arametric - ntrs.nasa.gov
8
Transcript of arametric - ntrs.nasa.gov
A Parametric Study of Jet Interactions
with Rare�ed Flow
C.E. Glass
NASA LaRC, Hampton, VA, USA
1 Introduction
Active control for vehicles traversing the transitional ow regime of an atmo-sphere is achieved by a reaction control system (RCS), consisting of thrustersstrategically placed about the vehicle. When jet plumes from the RCS inter-act with a local rare�ed or transitional ow �eld, unanticipated aerodynamicforces may result. For example, during the initial bank maneuvers of the�rst shuttle Orbiter ight, the rolling moment that occurred when the yawthrusters were �red was less than expected, resulting in greater RCS fuelusage than anticipated. The cause of this discrepancy was attributed toimproper scaling of wind tunnel derived RCS interaction correlations to the ight condition [1].
Recently, direct simulation Monte Carlo (DSMC) studies have been per-formed for the Mars Global Surveyor (MGS) [2] that show the attitudecontrol system (ACS) jets interact with the free stream and cause thrustreversal during the aerobraking maneuver in the transitional regime. Thatis, a net torque is produced in the direction opposite from that induced bythe ACS thruster; the ACS jet plume shadows a downstream portion of thespacecraft from the free stream ow, which causes lower local surface pres-sure than without the shadowing. Therefore, it is important to understandthe interaction of an ACS or RCS jet plume with the surrounding rare�ed ow �eld and surface to accurately incorporate the e�ects of the interactionin the vehicle design and aerodynamic control laws during a mission.
2 Problem Description
The purpose of this paper is to report results of a numerical study of acontinuum jet interaction with a rare�ed ow. The free stream numberdensity (n
1) of a baseline case is varied to produce changes in the inter-
action strength and provide insight into the underlying uid mechanics ofthese interactions. A recently reported numerical technique [3] is used in
1
21st International Symposium on Rare�ed Gas Dynamics
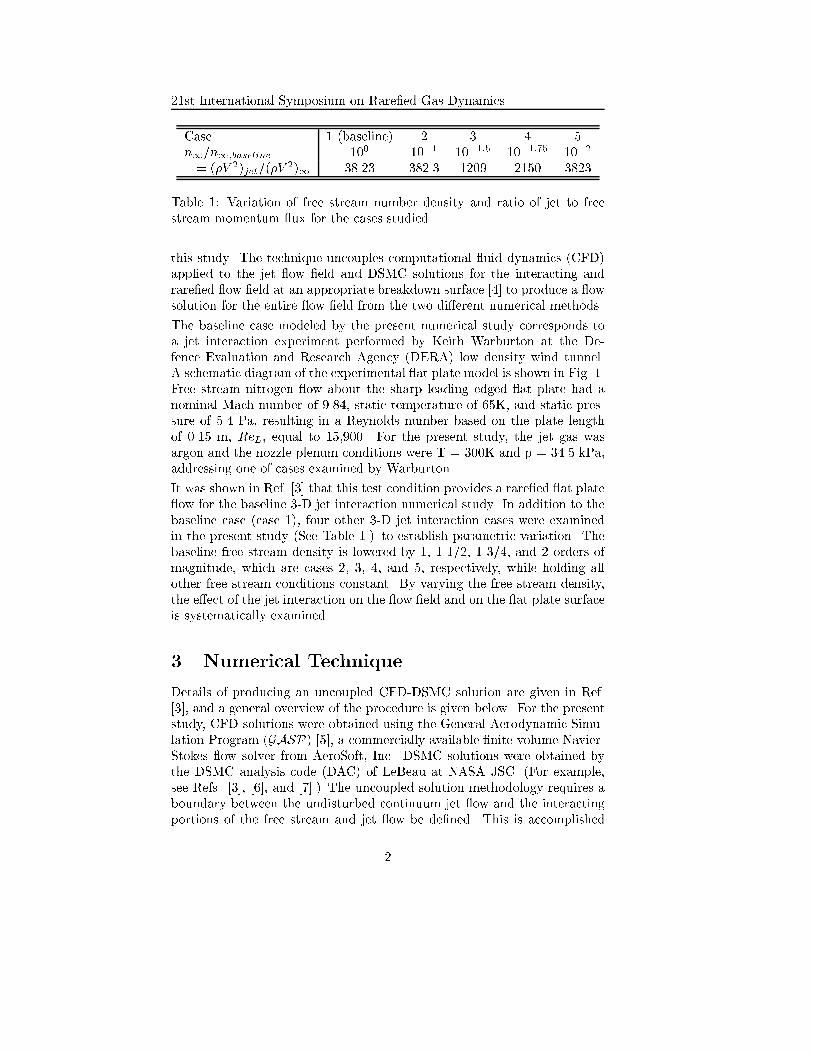
Case 1 (baseline) 2 3 4 5n1=n1;baseline 100 10�1 10�1:5 10�1:75 10�2
� = (�V 2)jet=(�V2)1
38.23 382.3 1209 2150 3823
Table 1: Variation of free stream number density and ratio of jet to freestream momentum ux for the cases studied.
this study. The technique uncouples computational uid dynamics (CFD)applied to the jet ow �eld and DSMC solutions for the interacting andrare�ed ow �eld at an appropriate breakdown surface [4] to produce a owsolution for the entire ow �eld from the two di�erent numerical methods.
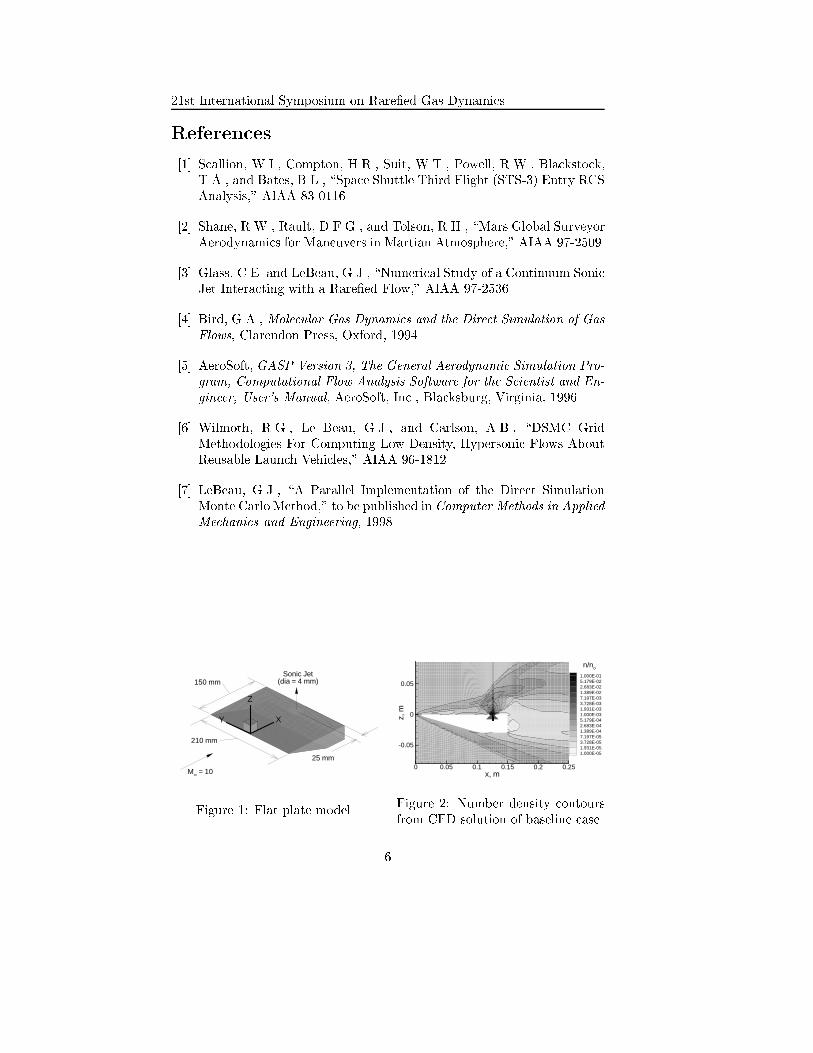
The baseline case modeled by the present numerical study corresponds toa jet interaction experiment performed by Keith Warburton at the De-fence Evaluation and Research Agency (DERA) low density wind tunnel.A schematic diagram of the experimental at plate model is shown in Fig. 1.Free stream nitrogen ow about the sharp leading edged at plate had anominal Mach number of 9.84, static temperature of 65K, and static pres-sure of 5.4 Pa, resulting in a Reynolds number based on the plate lengthof 0.15 m, ReL, equal to 15,900. For the present study, the jet gas wasargon and the nozzle plenum conditions were T = 300K and p = 34.5 kPa,addressing one of cases examined by Warburton.
It was shown in Ref. [3] that this test condition provides a rare�ed at plate ow for the baseline 3-D jet interaction numerical study. In addition to thebaseline case (case 1), four other 3-D jet interaction cases were examinedin the present study (See Table 1.) to establish parametric variation. Thebaseline free stream density is lowered by 1, 1-1/2, 1-3/4, and 2 orders ofmagnitude, which are cases 2, 3, 4, and 5, respectively, while holding allother free stream conditions constant. By varying the free stream density,the e�ect of the jet interaction on the ow �eld and on the at plate surfaceis systematically examined.
3 Numerical Technique
Details of producing an uncoupled CFD-DSMC solution are given in Ref.[3], and a general overview of the procedure is given below. For the presentstudy, CFD solutions were obtained using the General Aerodynamic Simu-lation Program (GASP) [5], a commercially available �nite volume Navier-Stokes ow solver from AeroSoft, Inc. DSMC solutions were obtained bythe DSMC analysis code (DAC) of LeBeau at NASA JSC. (For example,see Refs. [3], [6], and [7].) The uncoupled solution methodology requires aboundary between the undisturbed continuum jet ow and the interactingportions of the free stream and jet ow be de�ned. This is accomplished
2
Marseille, France, July 26-31, 1998
using a value of the Bird breakdown parameter [4], P, which assures thatthe CFD portion of the ow solution is not in uenced by the jet interactionregion, that is, it remains symmetric as is discussed and shown below.
To determine the boundary between the CFD and DSMC ow domains,CFD solutions of the entire interacting ow �eld, from the jet plenum tothe free stream, were obtained and analyzed. These solutions contain thecontinuum portion of the jet ow as it expanded from the nozzle exit, whichallows an analysis by the breakdown parameter. Twelve jet interactioncases were computed with the CFD: �xed nitrogen free stream propertieswith jet gases of helium, nitrogen, argon, and carbon dioxide at plenumpressures of 17.4, 34.5, and 51.7 kPa. A typical centerline number densitycontour from a CFD solution is shown in Fig. 2, which is an interactingargon jet at a plenum pressure of 34.5 kPa modeled in the present studyas the baseline case. Note that number density contours are normalized byLoschmidt's number, no, the standard number density of air at T = 273Kand p = 101.325 kPa [4].
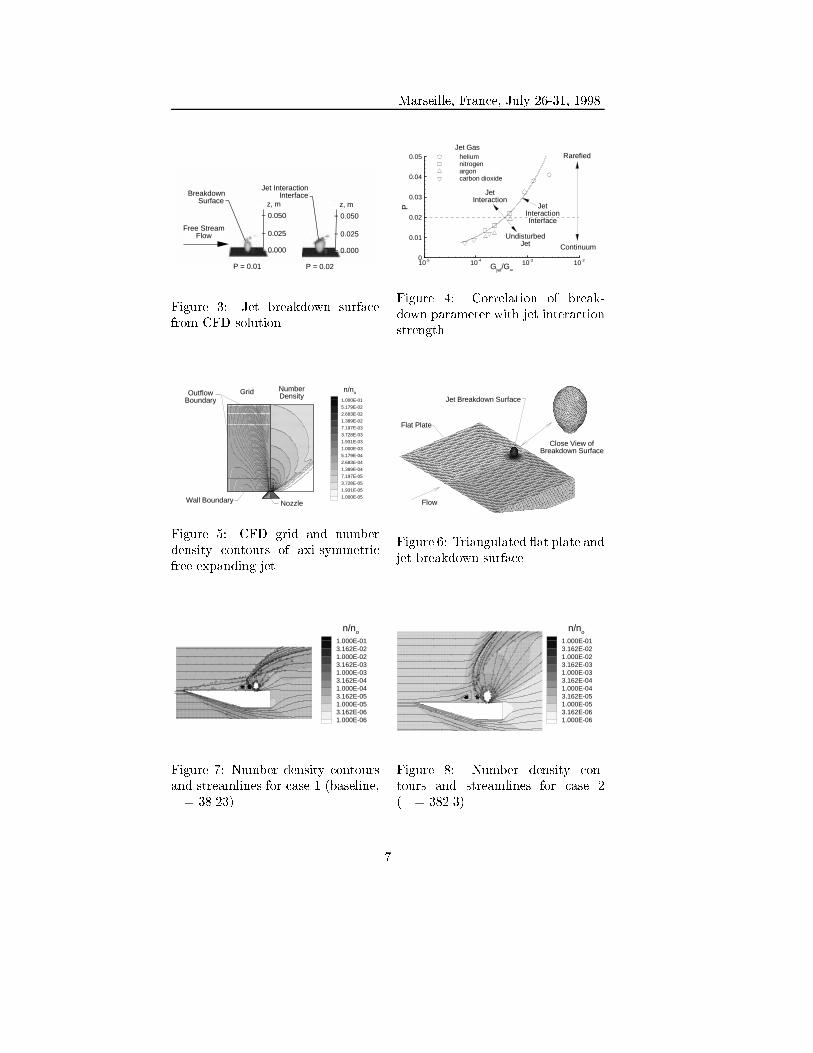
An analysis of the CFD solutions was performed using the Bird breakdownparameter to determine an appropriate breakdown surface of the jet plumewhere no interaction e�ects were present at the breakdown surface. A sam-ple of these results is shown in Fig. 3. Note that the breakdown surfacefor P = 0:01 on the left side of Fig. 3 shows a smooth, regular surface of avolume of revolution; however, the breakdown surface on the right side ofthe �gure (P = 0:02) has an irregular diagonal cut on the upper windwardportion. The irregular cut on the breakdown surface occurs at the locationof the compression region between the jet and the free stream. Based onthis analysis, a breakdown surface in uenced by the free stream to jet inter-action will exhibit the irregular surface feature. Therefore, a boundary canbe established where the interaction does not in uence the ow at or insidethe surface. Results of analyzing the twelve CFD solutions to determinethe largest value of breakdown parameter where the breakdown surface issmooth and not a�ected by the interaction are shown in Fig. 4. The break-down parameter values shown in Fig. 4 are correlated with a nondimensionalparameter Gjet=G1, with G de�ned by Eq. 1 as:
G =nV
�=(�d)(1)
which is the ratio of the number density ux, nV , and the molecular collisionprobability ux, �=(�d).
Given the curve �t relationship shown in Fig. 4, the two di�erent solutiondomains (CFD and DSMC) can be uncoupled, which has been performed forthe �ve cases presented in the following section. The jet nozzle and plumeare calculated using CFD. Typical grid and ow �eld results of the CFDcalculations are shown in Fig. 5. An appropriate breakdown parameter
3
21st International Symposium on Rare�ed Gas Dynamics
value is obtained from the curve in Fig. 4, which de�nes the jet in owlocation for the DSMC. A breakdown parameter value of P = 0:01 waschosen for the baseline (case 1), and P = 0:02 was chosen for the othercases. P = 0:02 represents the upper limit of the continuum regime foran expanding ow [4]. Next, the free stream and interacting regions of the ow, excluding the continuum noninteracting portion of the jet plume, arepredicted using DAC. The DAC requires the surface, which the ow is beingmodeled about, be triangulated. A triangulated representation of the atplate model for the present study is shown in Fig. 6. Note the close view ofthe jet breakdown surface shown on the upper right side of the �gure.
4 Results and Discussion
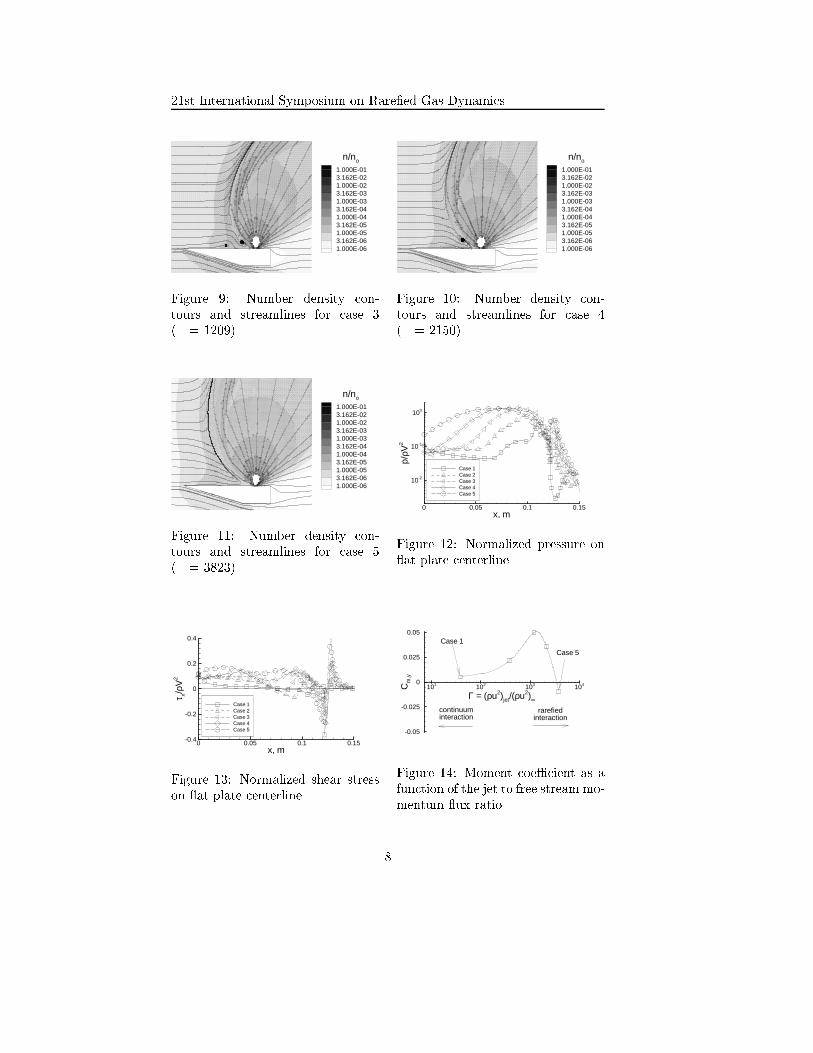
Number density contours and ow streamlines at the plane of symmetry forthe �ve cases described above are presented in Figs. 7 to 11. A comparisonof these �gures shows that as the free stream number density decreases, theextent of the jet interaction bow shock increases. Also, comparing Figs. 7and 8, the forward separation vortices become larger for decreasing freestream number density, and as shown in Fig. 11, when the free streamnumber density is decreased by two orders of magnitude below the baselinecase, the forward separation vortices are not present. This is signi�cantbecause the forward separation vortices allow the at plate shock layer owand jet plume ow to stagnate along a reattachment line. Without theseparation region present, the jet gas is directed outward away from thenozzle with no surface stagnation. The boundary where the free streamnumber density just supports the formation of the forward separation regionis between cases 3 and 4, that is, when the value of jet to free streammomentum ux, � >
�
2000. (See Table 1.)
The normalized surface pressure along the model centerline is presented nextin Fig. 12. Note that pressure is normalized by the free stream momentum ux for each case. The �gure shows that as the free stream number densitydecreases, the forward extent of the jet interaction in uence increases andbroadens over the at plate surface. For case 5, which has the lowest freestream number density, the jet interaction in uence has moved upstream
and is felt at the at plate leading edge. (See Figs. 11 and 12.)
Normalized shear stress, �x=(�V2), along the at plate centerline is pre-
sented in Fig. 13 for all �ve cases. The sign of the shear stress indicatesthe local ow direction just above the at plate surface; that is, a positivevalue indicates the free stream ow direction, and a negative value indicatesreversed ow, opposite the free stream direction. Immediately upstream ofthe jet nozzle exit (x = 0.125 m), ow just above the plate surface is inthe reverse direction as indicated by the negative shear stress. Further up-stream, the local shear stress becomes positive for all cases. For cases 1, 2,
4
Marseille, France, July 26-31, 1998
and 3, local shear stress changes sign again, indicating a separated, reversed ow region; the separation region just upstream of the nozzle exit is alsoshown by streamlines in Figs. 7, 8, and 9, respectively. However, unlikecases 1, 2, and 3, the surface shear stress is everywhere positive forwardof the initial reversed ow region for cases 4 and 5, as shown in Fig. 13,indicating no separated ow near the surface. Also, the ow streamlines forcase 4 (See Fig. 10.) do show a vortical structure above the plate surfaceforward of the nozzle exit, but not near the surface. For the lowest freestream density condition (case 5 shown in Fig. 11), no vortical structure isevident, probably because the free stream ow is not sheared by the jet owsu�ciently to cause a vortex.
To assess the integrated e�ect of the jet interaction on the upper surfaceof the at plate, the moment coe�cient, Cm;y = 2My=(�V
2AL), which isabout the y-axis at the center pivot of the upper plate surface (x = 0.075 m),as a function of jet to free stream momentum ux ratio, �, is presented asFig. 14. Note that moment contributions on plate surfaces other than theupper surface are neglected to isolate jet interaction e�ects on the uppersurface only. At higher momentum ux ratio (cases 1, 2, and 3), the momentcoe�cient is positive and increases with decreasing momentum ux ratiobecause the magnitude and extent of normalized surface pressure increasesover the aft portion of the plate surface as shown in Fig. 12. However,between cases 3 and 4, there is a downward turn of the moment coe�cientcurve, and at the momentum ux ratio of case 5, the moment coe�cient isnegative. The jet interaction e�ect has fed forward and causes a nose downor negative pitch for case 5. High pressure on the forward portion of theplate is also shown in Fig. 12 for case 5. In addition, the number densitycontours in Fig. 11 show that the jet interaction in uences the ow �eld tothe leading edge of the at plate.
5 Concluding Remarks
Three-dimensional computational techniques, in particular the uncoupledCFD-DSMC of the present study, are available to be applied to problemssuch as jet interactions with variable density regions ranging from a contin-uum jet to a rare�ed free stream. When the value of the jet to free streammomentum ux ratio, � >
�
2000 for a sharp leading edge at plate, no for-ward separation vortices induced by the jet interaction are present near thesurface. Also, as the free stream number density, n
1, decreases, the extent
and magnitude of normalized pressure increases and moves upstream of thenozzle exit. Thus, for the at plate model, the e�ect of decreasing n
1is
to change the sign of the moment caused by the jet interaction on the atplate surface.
5
21st International Symposium on Rare�ed Gas Dynamics
References
[1] Scallion, W.I., Compton, H.R., Suit, W.T., Powell, R.W., Blackstock,T.A., and Bates, B.L., \Space Shuttle Third Flight (STS-3) Entry RCSAnalysis," AIAA 83-0116.
[2] Shane, R.W., Rault, D.F.G., and Tolson, R.H., \Mars Global SurveyorAerodynamics for Maneuvers in Martian Atmosphere," AIAA 97-2509.
[3] Glass, C.E. and LeBeau, G.J., \Numerical Study of a Continuum SonicJet Interacting with a Rare�ed Flow," AIAA 97-2536.
[4] Bird, G.A., Molecular Gas Dynamics and the Direct Simulation of Gas
Flows, Clarendon Press, Oxford, 1994.
[5] AeroSoft, GASP Version 3, The General Aerodynamic Simulation Pro-
gram, Computational Flow Analysis Software for the Scientist and En-
gineer, User's Manual, AeroSoft, Inc., Blacksburg, Virginia, 1996.
[6] Wilmoth, R.G., Le Beau, G.J., and Carlson, A.B., \DSMC GridMethodologies For Computing Low-Density, Hypersonic Flows AboutReusable Launch Vehicles," AIAA 96-1812.
[7] LeBeau, G.J., \A Parallel Implementation of the Direct SimulationMonte Carlo Method," to be published in Computer Methods in Applied
Mechanics and Engineering, 1998.
XY
Z
Sonic Jet(dia = 4 mm)
M∞ = 10
25 mm
210 mm
150 mm
Figure 1: Flat plate model.
0 0.05 0.1 0.15 0.2 0.25x, m
-0.05
0
0.05
z,m
1.000E-015.179E-022.683E-021.389E-027.197E-033.728E-031.931E-031.000E-035.179E-042.683E-041.389E-047.197E-053.728E-051.931E-051.000E-05
n/no
Figure 2: Number density contoursfrom CFD solution of baseline case.
6
Marseille, France, July 26-31, 1998
− 0.050
z, m
− 0.025
− 0.000
− 0.050
z, m
− 0.025
− 0.000
Jet InteractionInterfaceBreakdown
Surface
Free StreamFlow
P = 0.01 P = 0.02
Figure 3: Jet breakdown surfacefrom CFD solution.
10-5 10-4 10-3 10-2
Gjet/G∞
0
0.01
0.02
0.03
0.04
0.05
P
heliumnitrogenargoncarbon dioxide
Continuum
Rarefied
UndisturbedJet
JetInteraction
Jet Gas
JetInteractionInterface
Figure 4: Correlation of break-down parameter with jet interactionstrength.
1.000E-01
5.179E-02
2.683E-02
1.389E-02
7.197E-03
3.728E-03
1.931E-03
1.000E-03
5.179E-04
2.683E-04
1.389E-04
7.197E-05
3.728E-05
1.931E-05
1.000E-05
n/noGrid NumberDensity
Nozzle
OutflowBoundary
Wall Boundary
Figure 5: CFD grid and numberdensity contours of axi-symmetricfree expanding jet.
Close View ofBreakdown Surface
Flow
Jet Breakdown Surface
Flat Plate
Figure 6: Triangulated at plate andjet breakdown surface.
1.000E-013.162E-021.000E-023.162E-031.000E-033.162E-041.000E-043.162E-051.000E-053.162E-061.000E-06
n/no
Figure 7: Number density contoursand streamlines for case 1 (baseline,� = 38.23).
1.000E-013.162E-021.000E-023.162E-031.000E-033.162E-041.000E-043.162E-051.000E-053.162E-061.000E-06
n/no
Figure 8: Number density con-tours and streamlines for case 2(� = 382.3).
7
21st International Symposium on Rare�ed Gas Dynamics
1.000E-013.162E-021.000E-023.162E-031.000E-033.162E-041.000E-043.162E-051.000E-053.162E-061.000E-06
n/no
Figure 9: Number density con-tours and streamlines for case 3(� = 1209).
1.000E-013.162E-021.000E-023.162E-031.000E-033.162E-041.000E-043.162E-051.000E-053.162E-061.000E-06
n/no
Figure 10: Number density con-tours and streamlines for case 4(� = 2150).
1.000E-013.162E-021.000E-023.162E-031.000E-033.162E-041.000E-043.162E-051.000E-053.162E-061.000E-06
n/no
Figure 11: Number density con-tours and streamlines for case 5(� = 3823).
0 0.05 0.1 0.15x, m
10-2
10-1
100p/
ρV2
Case 1Case 2Case 3Case 4Case 5
Figure 12: Normalized pressure on at plate centerline.
0 0.05 0.1 0.15x, m
-0.4
-0.2
0
0.2
0.4
τ x/ρV
2
Case 1Case 2Case 3Case 4Case 5
Figure 13: Normalized shear stresson at plate centerline.
101 102 103 104
Γ = (ρu2)jet/(ρu2)∞
-0.05
-0.025
0
0.025
0.05
Cm
,y
rarefiedinteraction
continuuminteraction
Case 1
Case 5
Figure 14: Moment coe�cient as afunction of the jet to free stream mo-mentum ux ratio.
8