ARA0103 Aðferðafræði Rannsókna - Háskólinn á...
36
01/03/2007 Dr Andy Brooks 1 ARA0103 Aðferðafræði Rannsókna Fyrirlestrar 16 og 17 Power, Effect Sizes, Meta-Analysis, and Replication ð) úrtaksstær (n, n s = x s mean/meðaltal standard deviation/staðalfrávik sample size/úrtaksstærð standard error/staðalvilla effect size/stærð áhrifa power/styrkur meta-analysis/eftirgreining replication/endurtekning p-gildi er < 0,01 Er áhrif klínískt marktækt? staðalvilla
Transcript of ARA0103 Aðferðafræði Rannsókna - Háskólinn á...

01/03/2007 Dr Andy Brooks 1
ARA0103Aðferðafræði Rannsókna
Fyrirlestrar 16 og 17Power, Effect Sizes, Meta-Analysis, and Replication
ð)úrtaksstær(n,ns=
xs
mean/meðaltalstandard deviation/staðalfráviksample size/úrtaksstærðstandard error/staðalvillaeffect size/stærð áhrifapower/styrkurmeta-analysis/eftirgreiningreplication/endurtekning
p-gildi er < 0,01
Er áhrifklínísktmarktækt?
staðalvilla
01/03/2007 Dr Andy Brooks 2
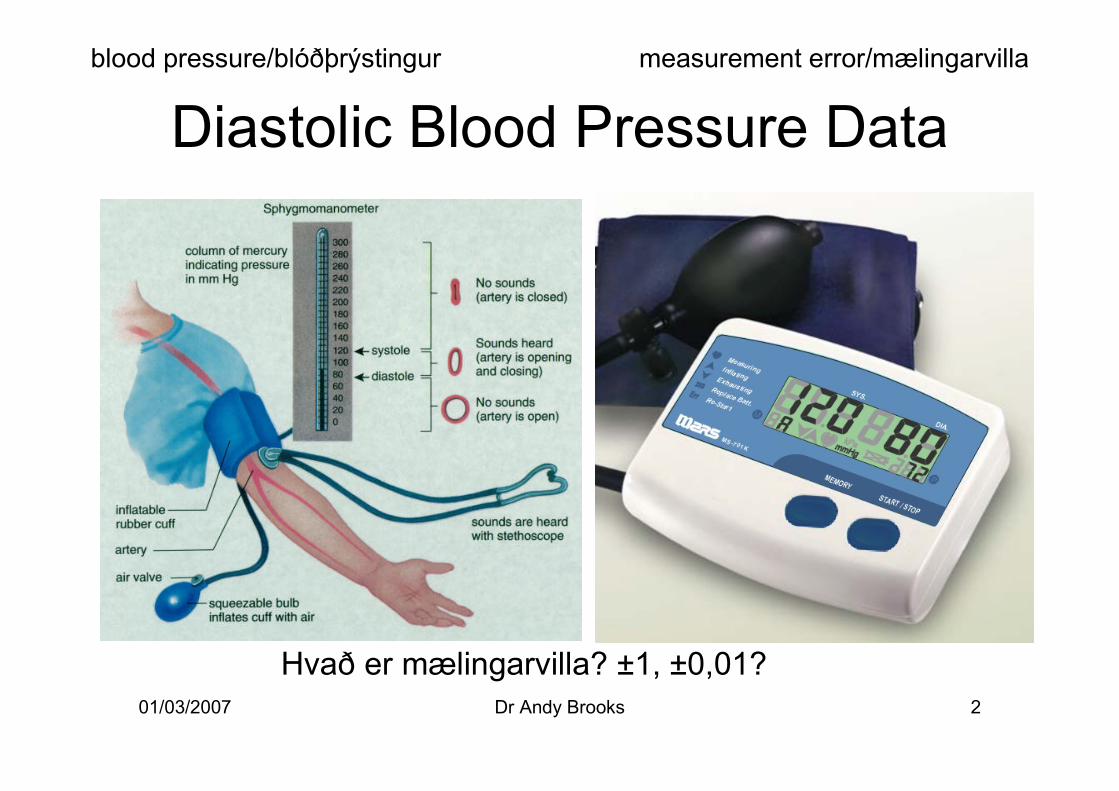
Diastolic Blood Pressure Datablood pressure/blóðþrýstingur
Hvað er mælingarvilla? ±1, ±0,01?
measurement error/mælingarvilla

01/03/2007 Dr Andy Brooks 3
Null hypothesisNúlltilgáta
• It is suspected that staff working in an old hospitalhave different blood pressures to staff working in anew hospital.– Working conditions in the both hospitals can be stressful
for different reasons.• The null hypothesis is that, on average, there is no
difference between blood pressures.– Mismunur er ekki til.
• We start by taking a random sample/slembiúrtak of10 from the old hospital (Group 1) and the newhospital (Group 2).
Hópur 1 Hópur 2

01/03/2007 Dr Andy Brooks 4
t-próf
2,1009t Critical two-tail0,3629P(T<=t) two-tail1,7341t Critical one-tail74720,1814P(T<=t) one-tail80900,9335t Stat6870
18df62900Hypothesized Mean Difference6068
1010Observations688086,444462,2667Variance9070
7376,6Mean8274Variable 2Variable 17076
7676t-Test: Two-Sample Assuming Unequal VariancesGroup 2Group 1
Excel

01/03/2007 Dr Andy Brooks 5
Niðurstaða (n=10)• Although there is an average difference of 3,6
we cannot reject the null hypothesis.– p-gildi er 0,36 og miklu stærri en 0,05– Ekki hægt að hafna núlltilgátuna– Segjum “núlltilgátan er rétt”– The standard deviations are large compared to the
average difference of 3,6.• Group 1 staðalfrávik = 7,9• Group 2 staðalfrávik = 9,3
– The standard errors of the means are only slightlyless than the average difference of 3,6.
• Group 1 staðalvilla = 7,9/√10 = 2,5• Group 2 staðalvilla = 9,3/√10 = 2,9
“segjum 2,7”
fjöldi í hverju hólfi sniðsins

01/03/2007 Dr Andy Brooks 6
68
70
72
74
76
78
80
0 1 2
Hospital
Dia
stol
ic B
lood
Pre
ssur
e
Graph showing standard error bars
• Standard error bars are approximate (± 2,7).• (Standard error not standard deviation bars are shown.)
standard error bar/staðalvillusúla
skörun er mikil

01/03/2007 Dr Andy Brooks 7
• The 1-α confidence interval for thepopulation mean/þýðismeðaltal µ is:
Confidence Interval (CI)/Öryggisbil
1-ndf
ns
dfns
df txtiltx=
+− )2/,()2/,( αα
The critical values of t can be read from tablesin statistical books or calculated usingstatistical software (t.d. TINV in Excel).
degrees of freedom/frígráður

01/03/2007 Dr Andy Brooks 8
95% Öryggisbil
• n = 10• df (frígráður) = n-1 = 9• 5% in the tails
– 2,5% left tail, 2,5% right tail• From a table of the t-distribution, the
multiplier is 2,26.• 2,26 * 2,7 (staðalvilla) ≈ 6,1

01/03/2007 9
BOOKTABLE6
2,882,552,101,73182,902,572,111,74172,922,582,121,75162,952,602,131,75152,982,622,141,76143,012,652,161,77133,052,682,181,78123,112,722,201,80113,172,762,231,81103,252,822,261,8393,362,902,311,8683,503,002,361,8973,713,142,451,9464,033,362,572,0254,603,752,782,1345,844,543,182,353
df0,010,020,050,1two tail
0,0050,010,0250,05one tail Critical Values ofStudent´s t-Distribution

01/03/2007 Dr Andy Brooks 10
Graph showing 95% confidence intervals
64
69
74
79
84
0 1 2
Hospital
Dia
stol
ic B
lood
Pre
ssur
e
In research papers, sometimes it is not clear if standard error bars orstandard deviation bars or 95% confidence intervals are being shown.
skörun er mikil
01/03/2007 Dr Andy Brooks 11
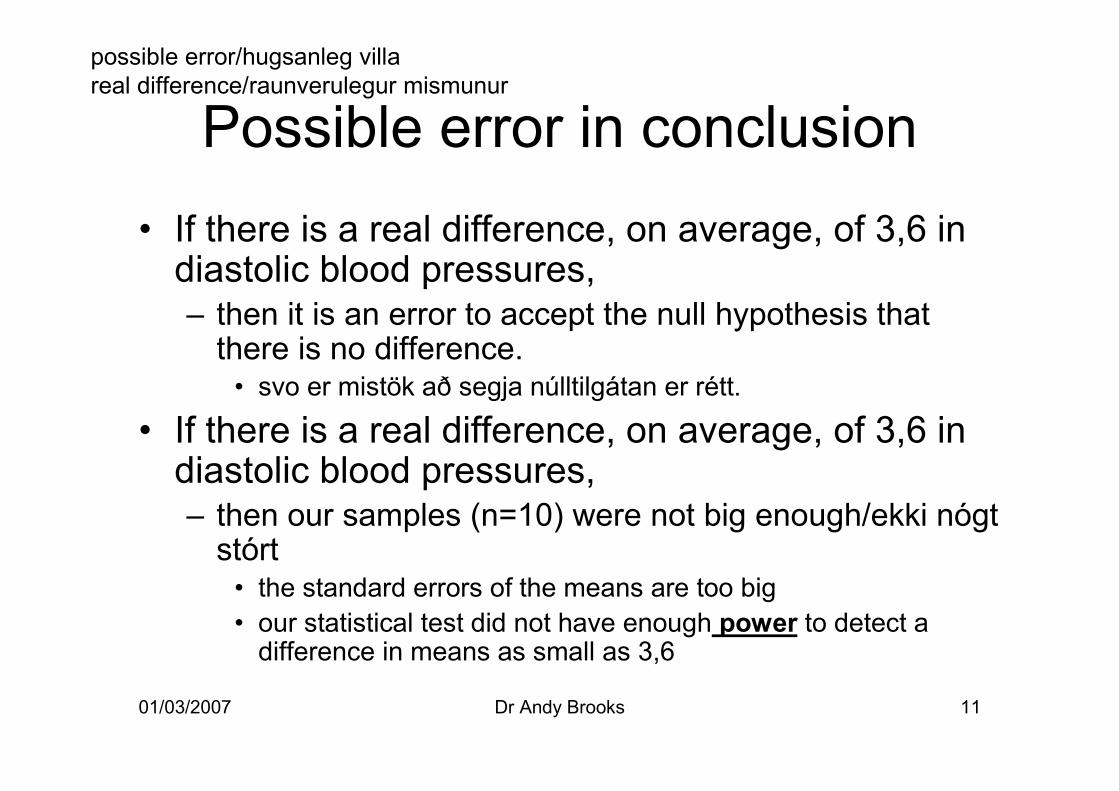
Possible error in conclusion• If there is a real difference, on average, of 3,6 in
diastolic blood pressures,– then it is an error to accept the null hypothesis that
there is no difference.• svo er mistök að segja núlltilgátan er rétt.
• If there is a real difference, on average, of 3,6 indiastolic blood pressures,– then our samples (n=10) were not big enough/ekki nógt
stórt• the standard errors of the means are too big• our statistical test did not have enough power to detect a
difference in means as small as 3,6
possible error/hugsanleg villareal difference/raunverulegur mismunur

01/03/2007 Dr Andy Brooks 12
Type I and II errors• A Type I error is rejecting the null hypothesis
when it is true.– Að hafna réttri núlltilgátu.– The probability of a Type I error is α.
• α is usually 0,05 or 0,01– gengur vel ef þú getur sagt p-gildi minna en 0,01 frekar en 0,05
• Samples from two groups which have the same populationmean can produce what appears to be a statisticallysignificant difference 1 time in 20 or 1 time in 100.
• A Type II error is accepting the null hypothesiswhen it is false.– Að hafna ekki rangri núlltilgátu– The probability of a Type II error is β.
• The power of a statistical test/styrkur tölfræðiprófs is 1- β.
Type I error/mistök af tegund I

01/03/2007 Dr Andy Brooks 13
Warning/Viðvörun• If α = 0,05
– There is a 1:20 chance you have committed a Type I error.• If α = 0,01
– There is a 1:100 chance you have committed a Type I error.• If α = 0,001
– There is a 1:1000 chance you have committed a Type I error.• If your sample size is small:
– Statistical power/styrkur may be very low.– And you may easily commit a Type II error.– β can be calculated for a test knowing the size of the
effect/stærð áhrifa you are looking for, samplesize/úrtaksstærð, and α level/alfastig.

01/03/2007 Dr Andy Brooks 14
t-próf (n=50)
1,9853t Critical two-tail0,0319P(T<=t) two-tail1,6611t Critical one-tail0,0159P(T<=t) one-tail2,1782t Stat
95df0Hypothesized Mean Difference
5050Observations79,387857,1837Variance
7376,6MeanVariable 2Variable 1
t-Test: Two-Sample Assuming Unequal Variances
We measure another 40 workers at each hospital...
Excel
fjöldi í hverju hólfi sniðsins

01/03/2007 Dr Andy Brooks 15
Graph showing standard error bars(n=50)
• Standard error bars are approximate (± 1,1).
7172737475767778
0 1 2
Hospital
Dia
stol
ic B
lood
Pre
ssur
e
standard error bar/staðalvillusúla

01/03/2007 Dr Andy Brooks 16
Graph showing 95% confidence intervals(n=50)
70
72
74
76
78
80
0 1 2
Hospital
Dia
stol
ic B
lood
Pre
ssur
e
2,02 * 1,1 (staðalvilla) = 2,22

01/03/2007 Dr Andy Brooks 17
Niðurstaða (n=50)• Við höfnum núlltilgátuna. An increased sample size has
given us the power to detect a difference.– Núlltilgátan er röng, hin tilgátan er rétt.– Tölfræðileg marktekt p = 0,03 (< 0,05)
• The point estimate for the effect size is 3,6.• En er áhrif klínískt marktækt?
– No ?• Standard deviations are large at both hospitals.
– Maybe we should be seeking explanations/útskýringar for theselarge standard deviations.
• Hvaða fólk er að reykja?• Hvaða folk er með yfirvinnu?• Hvaða fólk er með næturvakt?
– Maybe we should test to see if the standard deviations arestatistically different?
fjöldi í hverju hólfi sniðsinspoint estimate/punktspáeffect size/stærð áhrifa
01/03/2007 Dr Andy Brooks 18
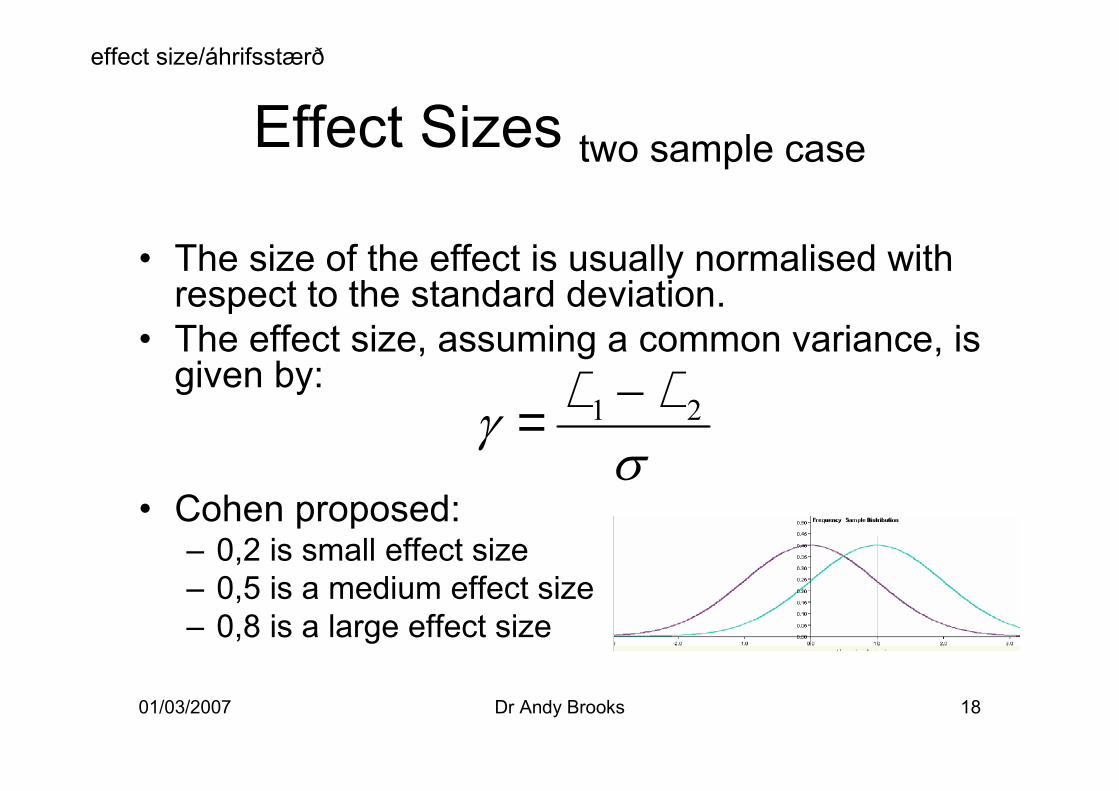
Effect Sizes two sample case
• The size of the effect is usually normalised withrespect to the standard deviation.
• The effect size, assuming a common variance, isgiven by:
• Cohen proposed:– 0,2 is small effect size– 0,5 is a medium effect size– 0,8 is a large effect size
σµµγ 21 −=
effect size/áhrifsstærð

01/03/2007 Dr Andy Brooks 19
Estimate of effect sizediastolic blood pressure experiment
• Point estimate/punktspá of differencebetween means = 3,6
• Estimate of variance = 70– For simplification, we assume a single
common variance in the diastolic bloodpressure experiment.
• Estimate of standard deviation = 8,3666• Estimate of effect size = 0,4303
– a small to medium effect
estimate/spágildi

01/03/2007 Dr Andy Brooks 20
Java applets for power and sample size by Russ Lenth
power = 0,04
http://www.stat.uiowa.edu/~rlenth/Power/

01/03/2007 Dr Andy Brooks 21
Java applets for power and sample size by Russ Lenth
power = 0,15

01/03/2007 Dr Andy Brooks 22
Java applets for power and sample size by Russ Lenth
power = 0,32

01/03/2007 Dr Andy Brooks 23
Java applets for power and sample size by Russ Lenth
power = 0,57

01/03/2007 Dr Andy Brooks 24
α and β• As the α level gets more strict (0,05 -> 0,01), then
you have less power β.– There is less chance of a Type I error.– But more chance of a Type II error (1-β).
• As the α level gets less strict (0,01 -> 0,05), thenyou have more power β.– There is more chance of a Type I error.– But less chance of a Type II error (1-β).
• Some researchers use an α level of 0,10, but thismeans a 1:10 chance of making a Type I error.– Many researchers find an alpha level of 0,10 to be
unacceptable.
unacceptable/óaðgengilegur

01/03/2007 Dr Andy Brooks 25
More power
• A power of 0,5 means there is a 50%chance your experiment will fail to detect adifference that is real.– If an experiment costs $10 million to run, you
want a power of 0,99 and not 0,5.• There may be no way of estimating power
until you have performed the experiment.– Previous results by other researchers can
sometimes be used to estimate the effect size.

01/03/2007 Dr Andy Brooks 26
Power calculations/Styrksútreikningar
• Power calculations get more complicated with morecomplicated experimental designs.
• Power calculations get more complicated when groupsample sizes and/or group variances are unequal.
• Professional software exists to support calculations ofpower for many types of statistical tests.– www.power-analysis.com
• Power calculations are impossible unless you have anestimate of the effect size.
• In research papers, a power analysis is often not reportedbecause a power analysis was never done. It is becomingmore common to insist a power analysis is done before aresearch paper is accepted for publication.

01/03/2007 Dr Andy Brooks 27
Missing effect size ?
• In the absence of previous results, groupsample sizes should be at least 10.– Have at least 20 participants if you plan to
randomize patients into two groups of 10 anduse an independent two-sample t-test.
• Try if possible to have large numbers ineach group (20, 30, 40, or 50...).– The more the better.

01/03/2007 Dr Andy Brooks 28
Java applets for power and sample size by Russ Lenth
power = 0,39

01/03/2007 Dr Andy Brooks 29
Java applets for power and sample size by Russ Lenth
power = 0,86

01/03/2007 Dr Andy Brooks 30
Failure to reject the null hypothesisEkki hægt að hafna núlltilgátuna?
• If you cannot reject the null hypothesis, use descriptivestatistics (average, standard deviation, standard error,minimum, maximum), histograms, boxplots and line graphsto present, compare, and interpret the data.
• What happens if you use an α of 0,10 ?– This may allow you to interpret the experimental results statistically,
but you need to emphasis the need to repeat the experiment withbigger samples.
• Try and estimate the power of the experimentretrospectively.– This can help future researchers.
• Find explanations of any outliers.– Sometimes this is where the real results of an experiment are.
descriptive statistics/lýsandi tölfræði outlier/einfari

01/03/2007 Dr Andy Brooks 31
Meta-analysis• Meta-analysis involves examining the results of
experiments with the same null hypothesis.• A meta-analysis can simply involve counting the
number of research papers that conclude theeffect was present against the number of papersthat conclude there was no effect.– Counts are based on the best quality experiments
(t.d. Randomized Control Trial/Hrein Tilraun).– Simple counting of research papers is viewed by
many researchers as insufficient.• The data has to be combined statistically.
meta-analysis/eftirgreining Tilraun 1 Tilraun 2
Tilraun 3 Tilraun 4
Tilraun 5

01/03/2007 Dr Andy Brooks 32
Meta-analysis• Another form of meta-analysis involves pooling
together raw data from several experiments.– að samlaga óunnin gögn úr nokkrir tilraunum
• This pooling together data effectively increasesgroup sample sizes and so increases the powerof any statistical tests applied.– If we have data for 5 experiments where group
sample sizes were 10, in the meta-analysis, groupsample sizes become 50.
fjöldi í hverju hólfi sniðsins

01/03/2007 Dr Andy Brooks 33
• Another form of meta-analysis involvespooling together effect size estimates fromseveral experiments.– Að samlaga áhrifastærðir
• Special software exists to support meta-analytic procedures.– t.d. RevMan from the Cochrane Collaboration.
• Dæmisaga, Fyrirlestur 10
Meta-analysisspecialsoftware/sérstakur hugbúnaður

01/03/2007 Dr Andy Brooks 34
Fig 3 Relative risk for mortality
(c) BMJ
forest plot
Dæmisaga, Fyrirlestur 10

01/03/2007 Dr Andy Brooks 35
Replication/Endurtekning• The results from a RCT may be wrong.
– A cause-and-effect relationship does not exist.• 0rsakatengls er ekki til• Gæti verið að aðrar útskýringar eru til
• People only start believing the result when theRCT is successfuly replicated by other researchteams.
• The results from several RCTs can be combinedin a meta-analysis.– Even the results of a meta-analysis can be disputed...
other explanations/aðrar útskýringardispute/rökræða

01/03/2007 Dr Andy Brooks 36
Replication/Endurtekning• Often, when you decide to replicate an
experiment, you also improve the experiment:– Measure O1 to check the groups are equal.– Breyta spurningalista
• Bæta við spurningar, taka burt spurningar, breyta orðalag,...
– Use a different questionnaire, one which has beenvalidated and shown to be reliable.
• But if you make too many improvements, youmight be running a different experiment.– Svo er ekki hægt að samlaga óunnin gögn, osf.
reliability/áreiðanleikivalidity/réttmæti
improve/bæta við