Randomized, Controlled Trial Of A Prenatal And Postnatal Lactation Consultant


Annual Report 2015-16


Staff List i
Research Highlights vii
I. COMMUNITY STUDIES
1. Developing a multi-component nutrition and health education intervention 1 model to combat the persistent problem of undernutrition in the rural areas of Allahabad, Uttar Pradesh
2. District level mapping of undernutrition among under 5 years children, 3 adolescent girl, pregnant woman and lactating mothers and infant & young child feeding practices of mothers of under 3 years children in the state of Andhra Pradesh
3. Assessment of magnitude, prevalence and aetiology of chronic kidney 6 disease among the rural population residing in mica belt of Nellore district, Andhra Pradesh
4. Assessment of nutritional status of under five year rural children and 7 performance of ICDS functionaries in the districts of Pondicherry
II. CLINICAL STUDIES
1 To estimate the normative values and plot a norm gram for serum folic acid 9 and B12 levels among women 15-35 yrs. age group in Mahboobnagar District, Telengana
III. MICROBIOLOGY AND IMMUNOLOGY
1 A prospective cohort study to understand periconception and prenatal factors 10 that influence fetal and postnatal growth and development
IV. BASIC STUDIES
1. Isolation and characterization of food derived iron binding peptides and their 12 effect on iron bioavailability: A proteomic approach
2. Role of vitamin D in adiposity 16
3. Amino acid – Metal complexes as model for the glucose tolerance factor of yeast: 20 Hypoglycaemic activity and therapeutic potential in diabetes; synthesis, structure and mechanism of action in yeast and animals
4. Molecular basis of maternal vitamin B12 restriction induced changes in the 26 C57BL/6 mouse offspring: Role of epigenetics
5. Status of vitamin B12 and folate among different adult groups: Dietary intake 29 and plasma levels
Page NoTitleSl.No
CONTENTS

6. Development of a raw food based quantitative food frequency questionnaire in 34 an urban set-up
7. Validity and reproducibility of a raw food based quantitative food frequency 3 9 questionnaire (RFQNFFQ) across three seasons among urban adults
8. Carboxymethyl lysine induces EMT in podocytes through transcription factor ZEB2: 46 Implications for podocyte depletion and proteinuria in diabetes mellitus
9. Aberrant accumulation of WT1-positive mesenchymal cells in pulmonary fibrosis 53
10. Expression and induction of small heat shock proteins in rat heart under chronic 63 hyperglycemic conditions
11. Assessment of subclinical micronutrients status and non-communicable diseases 71 of urban geriatric population: A population based cross-sectional study
12. Effect of long-term pre-diabetes on risk of renal, retinal and lens abnormalities: 75 Biochemical mechanisms and role of dietary agents
13. Vitamin A metabolism in relation to sexual dimorphism of adipose tissue 91 development
14. Vitamin A metabolism: a neglected paradigm in non-alcoholic fatty liver disease? 92
V. PUBLICATIONS, EXTENSION & TRAINING
1. Influence of mass media on teenagers's diet and health related behaviour 93
VI. FOOD AND DRUG TOXICOLOGY RESEARCH CENTRE
1. Role of tamarind extract on the carbonic anhydrase activity in ameliorating 96 fluoride toxicity in rats
2. Integrated fluorosis mitigation activities in Nalgonda District 102
3. Emerging bacterial foodborne pathogens in milk products 109
4. Studies on salmonella decontamination of foods using hybrid technology of 113 ozone-pulsed UV
5. Safety and quality of rice and wheat distributed in PDS with special reference 117 to damaged grains and mycotoxin contamination
6. Assessment of allergenicity potential of novel proteins expressedin genetically 118 modified (GM) plants under varying conditions of digestion and thermal treatments
VII. NATIONAL CENTRE FOR LABORATORY ANIMAL SCIENCES (NCLAS)
Service Activities 120
1. Investigation of molecular mechanism involved in the reduced adipogenesis, 127 steatosis and lipotoxicity by supplementation of piperine ingenetically mutant WNIN obese rats
2. Effect of protein variation on physical, physiological and biochemical indices in 128 Mongolian gerbils (merionesunguiculatus) – a comparative study
Page NoTitleSl.No

3. Paternal diet restriction and metabolic gene expression studies in obese rat 128 offspring (WNIN/Ob)
4. Genetic and epigenetic approach towards obesogenesity using a rat model 133
VIII. PRE-CLINICAL TOXICOLOGY RESEARCH CENTRE
1. Pre-clinical toxicity evaluation of bio-similar Rituximab (anti CD 20 Monoclonal 137 Antibody)
2. Pre-clinical toxicity evaluation of repeated dose intramuscular local tolerance 139 study of liquid pentavalent vaccine (DTwP+HepB+Hib) in sprague dawley rats
3. Pre-clinical safety evaluation of Pearl millet and Mung bean 141
LIBRARY AND DOCUMENTATION SERVICES 144
PhD PROGRAMMES 146
AWARDS / HONOURS CONFERRED ON SCIENTISTS 151
PARTICIPATION OF SCIENTISTS IN INTERNATIONAL MEETINGS/ 152WORKSHOPS/ CONFERENCES/ TRAINING PROGRAMMES
WORKSHOPS/ CONFERENCES/ SEMINARS/ TRAINING PROGRAMMES 153HELD AT NIN
SCIENTIFIC PUBLICATIONS 157
SCIENTIFIC ADVISORY COMMITTEE 163
Page NoTitleSl.No


SCIENTIFIC STAFFShri. T. Longvah
(Scientist 'G' & Director-incharge)
CLINICAL R. Hemalatha, MD
(Scientist 'F')Bharati Kulkarni, MBBS, DCH, MPH
(Scientist 'E')G. Jagjeevan Babu, MBBS, MPH
(Scientist 'E')K. V. Radhakrishna, MBBS, DCH
(Scientist 'E')P. Amrutha Rao, MBBS, DPHRaja Sriswan Mamidi, MBBS
S. Kruthika, MSc (RF)
Ankita Mondal, MSc (RF)
Richa Panda, MSc (RF)
PATHOLOGY M. V. Surekha, MD
Priyanka Jain, MSc (RF)
Sapna Singh, MSc (RF)
MICROBIOLOGY AND IMMUNOLOGYR. Hemalatha, MD
(Scientist 'F')M. Shiva Prakash, MSc, PhD
(Scientist 'E')Devraj J. Parasannanavar, MSc, PhD
N. Himaja, MSc (RF)
D. Vasundhara, MSc (RF)
Md. Shujauddin, MSc (RF)
V. Sudershan Reddy G. Sumalatha, MSc (RF)
K.B. Chathyushya, MSc (RF)
G. Madhavi, MSc (RF)
LIPID CHEMISTRYS. Ahmed Ibrahim, MSc, PhD
(Scientist 'E')P. Suryanarayana, MSc, PhD
(Scientist 'E')S. M. Jeyakumar, MSc, MPhil, PhD
P. Sujatha, MSc, PhD
Ch. Anuradha, MSc (RF)
V. Anantha Krishna, MSc (RF)
J. Sugeetha, MSc (RF)
G. Rajgopala Chary, MSc (RF)
STEM CELL BIOLOGYV. Vijayalakshmi, MSc, PhD
(Scientist 'F')C. Suresh, MSc, PhD
(Scientist 'E')A. Rajanna, MSc
Padmanav Behera, MSc (RF)
K. Naga Surya Prasad, MSc (RF)
J. Rishika, MSc (RF)
A. S. Neelima, MSc (RF)
MOLECULAR BIOLOGYSudip Ghosh, MSc, PhD
(Scientist 'E')Sanjay Basak, MSc, PhD
G. Venkateswarulu, MSc (RF)
K. Sandeep Kumar, MSc (RF)
Divya Kumari, MSc (RF)
V. Srinivas, MSc (RF)
MICRONUTRIENT RESEARCH
K. Madhavan Nair, MSc, PhD
(Scientist 'F')P. Raghu, MSc, PhD
P. Ravinder, MSc, PhD
Little Flower Augustine, MSc (RF)
A. Kiran Kumar, MSc (RF)
M. Purna Chandra, MSc (RF)
Dripta Roy Choudhary, MSc (RF)
K. Archana, MSc (RF)
P. Kondaiah, MSc (RF)
Yvette Wilda Jyrwa, (RF)
WORK PHYSIOLOGY Y. Venkataramana, MSc, PhD
(Scientist 'F')Keren Susan Cherian, MSc (RF)
FOOD CHEMISTRY
T. Longvah, MSc
(Scientist 'G' & Director-Incharge)K. Bhaskarachary, MSc, PhD, PGDN & DM
J. Sreenivasa Rao, MSc
S. Devendra, MSc, Mphil, PhD
R. Ananthan, MSc, PhD
Paras Sharma, MSc, PhD
Naveena Natrajan, MSc (RF)
Daniella Chyne, MSc (RF)
Naveena, MSc (RF)
T. Deepika, MSc (RF)L. Bidyalakshmi, MSc (RF)
i

ENDOCRINOLOGY & METABOLISM
M. Raghunath, MSc, PhD(Scientist 'G')
Ayesha Ismail, MSc, PhDP. Aruna, MSc (RF)
V. Sugunakar, MSc (RF)G. Ramesh, MSc (RF)G. Srividya, MSc (RF)
OCULAR BIOCHEMISTRY
G. Bhanu Prakash Reddy, MSc, PhD(Scientist 'F')
S. Vishwaraj, MSc (RF)Sneha Jakhotia, MSc (RF)
K. Shruthi, MSc (RF)T. Shalini, MSc (RF)
K. Rajesh Kumar, MSc (RF)M. Siva Prasad, MSc (RF)
Y. K. Prabhakar, Msc, PhD (ICMR-PDF)S. Sreenivasa Reddy, MSc, PhDSwapna Nagalingam, MSc, PhD
P. Swathi Chitra, MSc (RF)
FIELD DIVISION
A. Laxmaiah, MBBS, MPH(Scientist 'F')
R. Harikumar, MBBS, DPH(Scientist 'E')
N. Arlappa, MD (Comm. Med.)(Scientist 'E')
I. I. Meshram, MD(PSM)(Scientist 'E')
M. S. Radhika, MSc, PhDSylvia Fernandez Rao, MA, PhD
B. Swetha, MSc (RF)
BIOSTATISTICS
K. Venkaiah, MSc(Scientist 'G')
M. Vishnuvardhan Rao, MSc, PhD, MTech (IT)(Scientist 'F')
N. Balakrishna, MSc, PhD(Scientist 'E')
M. Tirupathi Reddy, MSc (RF)
EXTENSION & TRAINING
P. Uday Kumar, MD(Scientist 'F')
D. Raghunatha Rao, MSc, PhD, PG Dip. FNS(Scientist 'F')
T. Vijaya Pushpam, MA, MPhil, PhD(Scientist 'E')
M. Maheshwar, MCOM, MA, MCJ, LLB, MPhil(Scientist 'E')
G. M. SubbaRao, MA, PGDJ, PGDT, PhD(Scientist 'E')
K. Damayanthi, MSc, PhD
INSTRUMENTATION
B. Dinesh Kumar, MSc, PhD(Scientist 'F')
FOOD & DRUG TOXICOLOGY RESEARCH CENTRE (FDTRC)FOOD TOXICOLOGY
Arjun L. Khandare, MSc, PhD(Scientist 'F')
S. N. Sinha, MSc, PhD(Scientist 'E')
J. Padmaja, MSc, PhD(Scientist 'E')
V. Sudershan Rao, MSc, PhD(Scientist 'E')
S. Vasanthi, MSc, PhD(Scientist 'E')
V. Vakdevi, MSc, PhDM. Ankulu, MSc (RF)
Alekhya, MSc (RF)SGD. Naga Lakshmi, MSc (RF)Summaiya Alam Lari, MSc (RF)
M. Srujana, MSc (RF)B. Venkat Reddy, MSc (RF)
U. V. Ramakrishna, MSc (RF)
DRUG TOXICOLOGY
B. Dinesh Kumar, MSc (Pharma), PhD(Scientist 'F')
B. Santosh Kumar, MD
K. Nirmala, MSc, PhD
Nivedita Dube, MSc (RF)
A. Kiranmayee, MPharm (RF)
V. Varsha, MSc (RF)
Anita Singh, MSc (RF)
K. Narendra Babu, MSc (RF)
Vandana Singh, MSc (RF)
NATIONAL CENTRE FOR LABORATORY ANIMAL SCIENCES (NCLAS)
P. Suresh Babu, MVSc(Scientist 'F' & Director-Incharge, NARF)
SSYH. Qadri, MVSc(Scientist 'E')
N. Hari Shanker, MSc, PhD
K. Rajender Rao, MSc, PhD
N. Muralidhar, MSc (RF)
K. Suresh, MSc (RF)
Dinesh Yadav, MSc (RF)Venkat Krishna Prasad, MSc (RF)
ii

(Ministerial & Secretarial)ADMINISTRATIVE OFFICER
M. Ashok RajCh. MadhulathaSudha Srinivasan
ACCOUNTS OFFICERN.Murali Krishna
SECTION OFFICERSLatha Kumarsswamy
M.SivaP.Dhanasekharan
R.C.Padmini MohanK.Ch.Ramayya Dora M.Rajagopala Chary
D.Venkateswarlu
PRIVATE SECRETARIES D.V.Laxmi Rani
G.Hanumantha Rao Malini V. Rao
ASSISTANTSV.LaxminarayanaT.SatyanarayanaK.Sivarami Reddy
V.ElishaAlice Mary
D.SunilM.Babu
C.KalavathiD.SeetharamaiahE. Syama Sundari
Shakila Banu
G.R. Srinivas K.Jayamma
P. PrabhavathiMohd. Iliyas
Shaik Jamaluddin
PERSONAL ASSISTANTSG.Prashanthi
V.Swayam PrabhaK.Sailaja
G.Durga PrasadG. Mahesh Kumar
UPPER DIVISION CLERKSC.Prabhu
Mini PramodT.Anuradha Jayalaxmi
A.Narsing RaoG.S.Gautami
A.Satyanarayana PrasadY.Bala Narayana
LOWER DIVISION CLERKSM. Rekha
D. RamanjaneyuluG.Y.Anita
A. VenkataramanaU. Somayya
M. Raghuram
RECEPTIONIST-CUM-TELEPHONE OPERATORM. Jawahar Joshua
LIBRARY STAFF
Library Information OfficerB.Narayana
Library Information Assistant Prakash Kulkarni
Library ClerkUngarala Naidu
iii
ADMINISTRATIVE STAFF

Technical Officer “B” (Tech. staff)
1. Ramachander Chaugule 2. S. Ananda Rao 3. Ch. Gal Reddy 4. Anil Kumar Dube 5. Sharad Kumar 6. M. Ravindranath 7. A. Kasiviswaraja Mouli 8. V. Satish Babu
Technical Officer “B” (Engg. Support staff) 1. Bandam Ramulu
Technical Officer “A” (Tech. staff)
1. G. Amarendra Reddy 2. M.Satyavani 3. Virendra Vasant Panpatil4. M. Krupadanam5. R. Naveen Kumar6. B.Narahari 7. Laxmi Rajkumar8. K.Swaroopa Rani9. Vani Acharya10. C. Maniprabha 11. Abhay Kumar 12. K. Vinod Reddy 13. V. Vikas Rao 14. R. Radhakrishna Sarma 15. V.Radhakrishna Rao 16. D. Pandu Ranga Vittal17. K. Nageswara Rao 18. Ch. Nagambika Prasad 19. S. Lopamudra 20. S. Hemalatha 21. Amulya Rao 22. G. Shanker Rao 23. K. Srinivasa Rao 24. B. Pothu Raju 25. Korra Mangthya 26. R. Ravindar Naik27. D.Vijaya Bhaskara Rao28. P. Ajey Kumar 29. N. Sreenivasa Chary 30. B. Venkateswara Rao 31. P. Krishnaswamy 32. G. Chenna Krishna Reddy
33. K. Subash34. K. Narasimha Reddy 35. T. Nagasekhara Rao36. Ch. Ranga Rao 37. Sreenu pagidoju 38. Sunu P.V39. Srinivasu kurella 40. K. Sharada41. P. Sailaja 42. B.R. Annapurna 43. Ch. Hanumantha reddy 44. V. Bhasker 45. P. Yadagiri reddy46. M. Seshacharuyulu
Technical Officer “A” (Engg. Support staff)
1. Mota Chandrasekhara Rao 2. P. Moses Ashok Kumar 3. G. Mohan Rao4. G.B. Walter5. L. Vijaya Durga 6. B. Om Prakash 7. A. Santosh Kumar 8. N. Satyanarayana
Technical Assistant (Tech. staff)1. S.A. Brinda 2. K. Vasudev 3. M. Srinivas 4. K. Suryam Reddy 5. S. Laxman 6. B. Tulja 7. Narottam Pradhan8. K. Swatantra Rao9. Madhusudhana Chary10. P.S.Rama Rao11. Jagdish Buwade 12. R. Raghunath Babu 13. Sreedhar Mudavath 14. N. Raju 15. R. Hrusikesh Panda 16. Ravindranath Palika 17. Prathap Reddy 18. V.Sai Santhosh 19. Surender Jatavath 20.K. Usha Rani 21. C. Sai Babu
TECHNICAL STAFF
iv

22. P. Satish Babu 23. P.S. Prashanthi 24. S.P.V. Prasad 25. D.Rakesh Naik
Technical Assistant (Engg. Support Staff) 1. G. Janardhan 2. M. Asaithurai 3. Micheal Fernandez 4. A. Anjaiah5. T. Shyam Sunder 6. Joseph Vijaykumar 7. YVL Narasimha Rao 8. Mohd. Younus 9. G.P. Narender 10. Niharika 11. K. Pavan kumar 12. Purnachandra Beshra
Driver (Special Grade)P. Mahender
Technician “C” (Tech. staff)
1. K. Sree Ramakrishna 2. P. Anitha Chauhan 3. G. Madhavi 4. B. Giri Babu5. G. Venkataraji Reddy 6. S. Ashok 7. G.l. Stephen 8. G.A. Rabbani9. E. Sammi Reddy 10. K. Balaji11. M. Sripal Reddy 12. Srinivas Dheeravath13. N. Peddi Reddy 14. K. Satyanarayana 15. Y. Agreepa Raju 16. Gandamalla Narasimha 17. P. Bheem Shanker 18. J. Pochaiah 19. M. Balram 20. S. Chandraiah 21. B. Nagender Rao
Technician “C” (Engg. Support staff)
1. R. Sahadeva 2. J. Kumaraswamy 3. A.l. Goverdhan4. K. Srenivasa Raju 5. N. Narasimha6. P. Dasarath
7. S. Devendran 8. Ramavath Ramsingh9. Sriramulu Naidu 10. E. Srinivas 11. V. Bhuvaneswaran12. Polishetty Naidu 13. P. Narender Kumar 14. B. Bal Reddy
Technician “B” (Tech. staff)
1. Prabhu Raj2. P. Nagabhashunam 3. Nigala Yadagiri 4. E. Krishna 5. Neelakanta 6. L. Dasu 7. D. Dasaratha8. J. Nageswara Rao9. C. Chandramouli 10. Abdul Sattar 11. N. Rajaiah12. K. Rama Rao 13. V. Rajkumar 14.Manupathi Bikshapathi 15. C. Shankaraiah 16. Abdul bashid17. Dhanavath Saida18. V. Dasaratham19. Manmohan Meena 20. Srihari ram 21. Mohd. Maqbool22. S. Hanumantha Rao23. K. Balraj 24. K. Kasipathi 25. B.Eswaraiah26. K. Gopal 27. K. Harinarayana
Technician “B” (Engg. Support staff)1. J. Bhujender2. K. Parthasarathy 3. D. Ravinder 4. N. Ramesh Kumar
Technician 'A' (Engg. support staff) 1. Mahender Singh Jadav 2. M.Narasimha3. Shrinath Madiyalkar 4. N. Om Prakash 5. Santosa Kumar Brahma 6. K.B. Srinivasa Rao 7. Satram Mahesh Babu
v

8. Naga Saeeswar Kurmala 9. Mohd. Sabeer 10. M. Somaiah11. G. Venkatesh
Driver (Grade – I)
1. K. Krishna 2. V. Kondaiah 3. Syed Mohd. Ali
Driver (Grade – II)
1. D. Amruthanathan 2. K. Jangaiah
Junior Staff Nurse
1. B.V. Nancharamma 2. D. Threessamma 3. D. Rani 4. K. Venkataramana 5. S. Rojamani6. K.Santhosham
Auxiliary Nurse Midwife
1. Ch. Anitha 2. G. Tulasi Bai 3. V. Aruna Reddy4. E. Sheela 5. G. Vijayalakshmi6. Dadigiri Narasimhulu 7. N.Jhanshi
Nursing Attendant
1. R.Rajyalakshmi2. Govada Bhavani3. Valentina Teriscova4. D.Swarupa
Attendant (Services)
1. K.B. Raju 2. Manga Narasaiah 3. M. Eshwar 4. G. Viswanatham 5. M. Suresh 6. Mohd. H. Yousuf 7. Bondi Ramulu 8. J. Yadagiri 9 Syed Mohd. Iqbal 10. Mabbu Ramulu 11. V. Shanker12. A. Narasaiah 13. Mukkera Krishna 14.. Mohd. Mehboob 15. J. Lakshmaiah 16. K. Rajaiah 17. P.V. Poulous18. Ch..Guruswamy19. P. Shiva Shanker 20. K. Chandran 21. Mirza Ghouse Baig 22. G. Yadagiri 23. Mohd. Yaseen 24. Mohd. Chand 25. Mohd. Maulana
Attendant (Services) (contd.)26. Shaik Mukthar 27. M. Leela 28. Manchikanti Krishna 29. Syed Asif Ali 30. E. Mallesh 31. K. Narender 32. Y. Ramulu 33. V. Somaiah 34. E. Marthamma 35. T. Govind 36. P. Srihari 37. Mohd. Habibuddin 38. A. Venugopal 39. M. Kisan 40. B. Nageswara Rao41. P. Nagulu 42. M. Seenu 43. B.k. Mahadevaiah 44. A. Chandraprakash 45. M. Jayamma 46. D. Venkatesh 47. M. Satyamma 48. C. Sivaleela 49. G. Satyapual 50. A. Narsing Rao 51. A. Lakshmi
Attendant (Services) (contd.)52. Majeed Shareef 53. M. Upender 54. R. Punna Reddy 55. K. Srinu 56. M. Narsing Rao 57. A. Shanker 58. P. Ravinder59. D. Madhava Reddy 60. B.V. Sudershan Babu 61. I. Poshetty 62. G. Yadagiri 63. M. Venkataiah 64. N. Bhasker 65. A. Jangaiah 66. P. Dasarath 67. S. Narahari 68. K. Venkatesh 69. P. Narasimha 70. E. Kondal reddy 71. K. Venkat reddy 72. G. Upender 73. M. Komura Reddy 74. Ch. Shanker 75. G. Saraswathi 76. P. Balarjun
vi

1. COMMUNITY STUDIES1.1 Developing a multi-component nutrition and health education intervention model to combat
persistent problem of undernutrition in the rural areas of Allahabad, Uttar Pradesh The prevalence of undernutrition among <5 year children was alarmingly high. Therefore, a multi-
component nutrition education intervention district model to combat the persistent problem of undernutrition was developed in the district of Allahabad, Uttar Pradesh'. Phase I study (formative research: quantitative and qualitative) was completed. Based on the formative research findings, the development of sustainable nutrition intervention strategies and piloting of the strategies are in progress.
1.2 District level mapping of undernutrition among under 5 years children, adolescent girl, pregnant woman and lactating mothers and infant & young child feeding practices of mothers of under 3 years children in the state of Andhra Pradesh and Pudhucherry
Even though the prevalence of undernutrition among <5year children is declining throughout the country, the current prevalences of undernutrition is still at alarming levels, when compare with figures of developed countries. Therefore, district level mapping of undernutrition and its determinants was done to enable planners/implementers to develop area specific intervention strategies and programmes for prevention and control undernutrition. District level mapping of undernutrition was earlier done in the states of Madhya Pradesh, Gujarat, Meghalaya, Haryana and these states had already initiated area specific interventions. Similarly, district level mapping in the states of Andhra Pradesh and Pudhuchhery was completed and results have been published as a report. Respective state governments can now initiate area specific interventions in their states to control undernutrition.
1.3 Assessment of magnitude, prevalence and aetiology of Chronic Kidney Disease (CKD) among the rural population residing in Mica belt of Nellore District, Andhra Pradesh.
Several news reports and hospital records revealed that reported cases of CKD patents were high in the district of Nellore, where Mica belts exist. A study was carried out to assess magnitude, prevalence and etiology of CKD among the rural population in the Mica belt areas of Nellore district Andhra Pradesh at different time points. As per the recommendations of NIN, the ground water (mica/silica) was replaced with surface water (Khandaleru Reservoir), subsequently serum creatinine levels significantly declined and the prevalence of CKD also significantly declined over a period of time.
2. MICROBIOLOGY AND IMMUNOLOGY2.1 A prospective cohort study to understand periconception and prenatal factors that influence
fetal & postnatal growth and development Nine hundred and twenty eight (928) pregnant women were recruited at 20-24 weeks gestation
and were followed through during pregnancy uptill birth. Low birth weight (LBW)and Preterm births (PTB) were prevalent in 22.1% and 7.1% respectively. The mean (±SD) birth-weight was 2,610±46 g. When less than 10% birth-weight for gestational age of a reference population was used as a proxy for fetal growth restriction (FGR), 33% neonates had FGR. Maternal weight (Mwt),
vii
RESEARCH HIGHLIGHTS

viii
Mid Upper Arm Circumference ( MUAC) and skin fold at four sites were collected during 22-24 weeks of gestation, 30-34 weeks of gestation and more than 36 weeks of gestation. In a linear regression model, mid upper arm circumference (MUAC),both early and late in pregnancy,was significantly associated with birth-weight, maternal age,maternalweight and maternalskin fold thicknesses at all four sites – Biceps, triceps, subscapular, suprailiac. Low maternal MUAC (<24.0 cm) in either early or late pregnancy was associated with an increased risk of low birth weight (LBW)and fetal growth restriction (FGR). MUAC <24.0 cm had2 fold increased risk of LBW (odds ratio [OR]=2.985; p= 0.035) or FGR (odds ratio [OR]=2.984; p= 0.019). Maternal wasting, reflected by a single low MUAC (<24.0 cm) during pregnancy, is associated with a 2-fold higher risk of LBW. A single MUAC provides a simple, inexpensive and reliable approach to identify mothers at high risk of bearingan LBW infant and even greater risk of having a growth-restricted infant.
3. BASIC STUDIES3.1 Isolation and characterization of food derived iron binding peptides and their effect on iron
bioavailability: A proteomic approach.
Binding and solubilization of ferric iron by food peptides, released during digestion, facilitate intestinal iron absorption. In the present study, release of iron-binding peptides during in vitrogastrointestinal digestion of chicken egg white and buffalo milk was investigated. The iron-binding activity of the egg white protein and buffalo milk increased upon gastrointestinal digestion. The iron-binding activity from the digests was purified by gel filtration chromatography followed by reverse phase HPLC. Subsequently, the peptide sequences were characterized by MALDI-MS based methods. The egg white peptide (DKLPGFGDS(PO4)IEAQ, 1456.7 amu) was identified as an internal fragment of ovalbumin while the milk peptide (MHQPPPQPLPPT, 1242.56amu) was identified as an internal fragment of β-casein. The synthetic peptide corresponding to the identified egg white
59iron-binding peptide bound and increased Fe-iron uptake. However, the milk peptide, although bound iron, inhibited the absorption of iron in intestinal Caco-2 cells. Further, dephosphorylation of egg white synthetic peptide completely inhibited the iron-binding activity, while methyl-esterification of its carboxyl groups partially inhibited the activity. These results suggest that food derived peptides modulate intestinal iron absorption and that the isolated iron-binding egg peptide could be explored further as a potential nutraceutical for improving iron absorption.
3.2 Role of Vitamin D in adiposity
The aim of the present study was to examine the role of vitamin D and calcium on body adiposity in a diet-induced vitamin D deficient rat model. Vitamin D-deficient rats gained less weight and had lower amounts of visceral fat. Consistent with reduced adipose tissue mass, the vitamin D-deficient rats had low circulating levels of leptin, which reflects body fat stores. Expression of vitamin D and calcium sensing receptors, and that of genes involved in adipogenesis such as peroxisome proliferator-activated receptor, fatty acid synthase and leptin were significantly reduced in white adipose tissue of deficient rats compared to vitamin D-sufficient rats. Furthermore, the expression of uncoupling proteins (Ucp1 and Ucp2) was elevated in the white adipose tissue of the deficient rat indicative of higher energy expenditure thereby, leading to a lean phenotype. Expression of the p160 steroid receptor coactivator 3 (SRC3), a key regulator of adipogenesis in white adipose tissue was decreased in vitamin D-deficient state. Interestingly, most of the changes observed in vitamin D deficient rats were corrected by calcium supplementation alone. Our data demonstrates that dietary vitamin D and calcium regulate adipose tissue function and metabolism.

ix
3.3 Amino acid – metal complexes as model for the glucose tolerance factor of yeast: hypoglycaemic activity and therapeutic potential in diabetes; synthesis, structure and mechanism of action in yeast and animals
Our attempt to assess the utility of oral administration of simple, binary complexes of Cr(III) with amino acids in the treatment of Diabetes, indicated that like Cr-D-Phe complex , complex of Cr(III) 3
with L-Phe but not Gly or L-Cys , was effective in alleviating all the ill effects of High Sucrose feeding on glucose tolerance, intracellular metabolism and plasma lipid profile and mitigation of the associated changes at various levels of intracellular insulin signalling pathway, expression of key regulatory enzymes of metabolic pathways and changes in oxidative stress/anti oxidant status. The data suggests that binary complexes of Cr with only a few (but not all) amino acids may be effective in alleviating high sucrose diet induced insulin resistance/T2DM in male Sprague Dawley rats.
3.4 Molecular basis of maternal vitamin B12 restriction induced changes in the C57BL/6 mouse offspring: Role of epigenetics
Severe vitamin B12 deficiency in C57BL/6 female in addition to altering the body composition, lipid profile and reproductive performance also altered the behaviour of the F0 mice which appeared to be anxious and depressed and altered epigenetics appear to underlie their etiopathology. Transgenerational vitamin B12 deficiency of both severe and moderate intensity also altered body composition, induced dyslipidemia, fasting hyperglycemia, insulin resistance in addition to inducing anxiety and depressive behaviour in F1 offspring. In offspring also, increased inflammation, stress and impaired antioxidant status were associated with the deleterious effects of vitamin B12 deficiency. While rehabilitation from weaning appeared ineffective in alleviating maternal vitamin B12 deficiency induced changes in offspring, rehabilitation of B12R mothers from parturition could only delay but not prevent the onset of the deleterious changes in the offspring in general. Genome-wide gene expression studies suggest that modulation of some important signaling pathways involved in the development and function of the brain may underly the alterations observed in the offspring born to vitamin B12 restricted mice.
3.5 Status of vitamin B12 and folate among different adult groups
Deficiencies of vitamin B12 (B12) and folate (FA) lead to a wide spectrum of disorders that affect all age groups. Hence, to determine the plasma levels and dietary intake of B12 and FA in the adult population, a community-based cross-sectional study was conducted. The study also looked into dietary intake of B12 and FA in an urban setup among apparently healthy adults distributed into three age groups: 21-40, 41-60 and >60 years. The overall prevalence of FA deficiency was 12%, and there was no significant difference in plasma FA concentrations among the groups. While the overall prevalence of B12 deficiency was 35%, it was significantly higher in the 21-40 (44%) and 41-60 age groups (40%) when compared with the >60 group (30%). B12 deficiency was higher in vegetarians (54%) compared to those consuming mixed diet (31%), and the reverse was the case with FA. However, the dietary intakes of FA and B12 were not significantly different among the groups.
3.6 Development, validity and reproducibility of a raw food based quantitative food frequency questionnaire (RFQnFFQ)
Food frequency questionnaire (FFQ) is a commonly used tool to assess long-term habitual dietary-intake pattern related to chronic diseases. An attempt was made to develop a 141 item raw food based quantitative food frequency questionnaire (RFQnFFQ) based on commonly consumed foods

x
and local food habits. The pilot tested RFQnFFQ was validated against the standard 24-hour dietary recall (24hR) method. The reproducibility of RFQnFFQ was assessed at two reference periods in a year including seasonal variation. The reproducibility of the RFQnFFQs was found to be good and no significant seasonal difference in food and nutrient intake was observed by the RFQnFFQ. The agreement between the RFQnFFQ and 24hR validated the utility of RFQnFFQ. The RFQnFFQ of one year duration is thus a valid tool to elicit long-term habitual dietary intake pattern of subjects which could possibly be useful for the estimation of their nutrient intake in chronic diseases irrespective of the season of the year. As the RFQnFFQ used in this study is raw food based it could be adopted to other parts including rural areas of the country with appropriate modifications.
3.7 Carboxymethyl lysine induces EMT in podocytes and proteinuria in diabetes Advanced glycation end-products (AGEs) are implicated in the pathogenesis of diabetic
nephropathy (DN). Carboxymethyl-lysine (CML) is one of the predominant AGEs that accumulate in all renal compartments of diabetic patients. The induction of the transcription factor Zeb2 in podocytes was demonstrated upon exposure to CML through activation of NF-kB signaling cascade. Zeb2 orchestrates epithelial-mesenchymal transformation (EMT), during which cell-cell and cell-extracellular matrix interactions enable epithelial cells to become invasive. While the exposure of podocytes to CML results in increased podocyte permeability, shRNA-mediated knockdown of Zeb2 expression abrogated CML-mediated podocyte permeability. Further, in vivofindings of elevated CML levels concurrent with increased expression of ZEB2 in glomeruli and proteinuria in diabetic rats confirm that CML-mediated manifestations in the kidney under chronic diabetes conditions. These in vitro and in vivo results envisage the novel axis of NFkB-ZEB2 in podocytes playing a significant role in eliciting EMT and pathogenesis of DN.
3.8 WT1-positive mesenchymal cells in pulmonary fibrosis Collagen-producing myofibroblast transdifferentiation is considered a crucial determinant in the
formation of scar tissue in the lungs of patients with idiopathic pulmonary fibrosis (IPF). Multiple resident pulmonary cell types and bone marrow–derived fibrocytes have been implicated as contributor to fibrotic lesions because of the transdifferentiation potential of these cells into myofibroblasts. We demonstrate that Wilms tumor 1 (WT1), a known marker of mesothelial cells, is expressed by both mesothelial and mesenchymal cells in IPF lungs but has limited or no expression in normal human lungs. We also demonstrate that WT1+ cells accumulate in fibrotic lung lesions, using two different mouse models of pulmonary fibrosis and WT1 promoter–driven fluorescent reporter mice. Importantly, the number of WT1+ cells in fibrotic lesions was correlated with severity of lung disease as assessed by changes in lung function, histology, and hydroxyproline levels in mice. Finally, inhibition of WT1 expression was sufficient to attenuate collagen and other extracellular matrix gene production by mesenchymal cells from both murine and human fibrotic lungs. Thus, the results of this study demonstrate a novel association between fibrocyte-driven WT1+ cell accumulation and severe fibrotic lung disease.
3.9 Small heat shock proteins in rat heart under chronic hyperglycema The induction of small heat shock proteins (sHsp) is observed under various stress conditions to
protect the cells and organisms from adverse events including diabetes. Diabetic cardiomyopathy is a common complication of diabetes. Therefore, we investigated the expression of sHsp under chronic hyperglycemic conditions in rat heart. While the expression of MKBPHspB2, HspB3, αB-crystallin (αBC) was found to be increased in diabetic heart, expression of Hsp20 was decreased. Chronic hyperglycemia further induced phosphorylation of αBC at S59, S45, Hsp27 at S82,

xi
p38MAPK and p44/42MAPK. However, pS59-αBC and pS82-Hsp27 were translocated from cytosolic fraction to cytoskeletal fraction under hyperglycemic conditions. Furthermore, the results suggest up regulation of sHsp (MKBP, HspB3 and αBC), phosphorylation and translocation of Hsp27 and αBC to striated sarcomeres and impaired interaction of αBC and pS59-αBC with Bax under chronic hyperglycemia.
3.10 Assessment of subclinical micronutrients status and non-communicable diseases of urban geriatric population: A population based cross-sectional study (Pilot study).In this cross sectional pilot study, the prevalence of subclinical micronutrient deficiencies, non-communicable diseases (NCDs) and their association in urban elderly people were reported. The prevalence of vitamin B12 and folic acid among urban elderly people was 36% and 8.2% respectively. The prevalence of vitamin B12 deficiency was significantly (p<0.006) high in males. The prevalence of vitamin D deficiency among elderly people was high (56.3%) and there was no vitamin A deficiency, whereas the prevalence of zinc deficiency was only 17.1%. The prevalence of diabetes, hypertension (HT), overweight and obesity in these subjects were 51.9%, 67.8%, 46.2% and 31.6% respectively. The prevalence of under nutrition was very low i.e., 2.1%.The prevalence of central obesity was 61.8% which was significantly (p<0.002) high in males when compared to females. The prevalence of dyslipidemia was very high (76.8%) and this was significantly (p<0.004) high in female subjects when compared to males. The prevalence of metabolic syndrome(MS) and cataract in these elderly subjects was 51.1% and 36% respectively. There was significant (p<0.05) association of vitamin D deficiency with HT, BMI, MS and also a significant (p<0.05) association of Zn deficiency with HT.
3.11 Effect of long-term pre-diabetes on risk of renal, retinal and lens abnormalities: Biochemical mechanisms and role of dietary agents.Two animal models were developed to study long-term pre-diabetes induced complications (retinopathy, nephropathy and cataract). Injection of streptozotocin (90mg/kg body weight) to two-day old Sprague Dawley (SD) rat pups (nSTZ) develops only impaired glucose tolerance (IGT) associated pre-diabetes by two months and maintains pre-diabetic state upto ten months. Feeding High fructose (HF), High fructose+ High fat (HFHF) to 45 to 60 days old WNIN rats resulted in IGT and insulin resistance associated pre-diabetes by three months. Both these models developed retinal and renal abnormalities by the end of ten months, but not cataract. However, when cultured these pre-diabetic rat lenses in high glucose medium for a period of four days develop early lens opacification when compared to their respective control group lens. Feeding of bitter gourd (5.0%) to nSTZ pre-diabetic SD rats and feeding of garlic (3.0%) to HF fed WNIN rats had shown marginal protective effect in delaying development of these complications. Protective effect of bitter gourd in nSTZ induced complications is mainly due to its mild hypoglycemic, aldose reductase inhibition and antioxidant properties. Protective effect of garlic in HF induced abnormalities is mainly due to its insulin sensitizing and antiglycating properties.
3.12 Vitamin A metabolism in relation to sexual dimorphism of adipose tissue development Male mice are susceptible to high fat-induced hyperglycemia, which could be partly explained by
the RBP4 elevation in circulation, due to its over-expression, particularly in visceral adipose depots. However, no sexual dimporhic adipose tissue development between sexes, but triglyceride accumulation/storage in adipose tissues follows sexual-dimorphism; i.e. female accumulates more in gonadal depot and male accumulation in subcutaneous depot. Further, long term feeding of high fat diet increases hepatic vitamin A stores in both sexes of mice. However, most of the vitamin A metabolic pathway genes are transcriptionally regulated neither by sex nor by diet. Interestingly,

xii
long term feeding of HF diet resulted in elevation of n-3 PUFA; docosahexaenoic acid (DHA; C22:6) levels of liver, possibly through ELOVL2-mediated chain elongation pathway, which may partly explain the amelioration of hepatic triglyceride accumulation. The present study also highlights the role of genetic-nutrient interactions/ relationships and its impact in determining the disease development and/or its progression, which implies the need for genetics-based intervention strategies for treating obesity and its associated complications particularly; insulin resistance and type 2 diabetes.
3.13 Vitamin A metabolism: a neglected paradigm in non-alcoholic fatty liver disease?
Findings of the present study suggest that vitamin A deficiency induces hypotriglyceridemia and attenuates high fructose-induced hepatic steatosis by regulating key factors involved in triglyceride biosynthesis, such as glycerol 3-phosphate dehydrogenase (GPDH) and stearoyl CoA desaturase 1 (SCD1). In addition, increase in docosahexaenoic acid (DHA; C22:6) and its active metabolite resolvin D1 (RvD1) levels, implicates their significant contributions to the vitamin A deficiency-mediated favorable changes in hepatic lipid metabolism. Notably, chronic high fructose feeding, though resulted in hepatic steatosis, it did not affect the retinol status and its metabolic pathway genes/ proteins expression in liver. However, the key adipocytokine; leptin levels was markedly reduced by vitamin A deficiency diet feeding, which corroborates with decreased adiposity observed in these groups. Further, the data showed improved insulin sensitivity and glucose clearance, due to chronic vitamin A deficiency diet feeding. Overall, the study underscores the importance of nutrient-nutrient interaction in determining health and disease conditions, which assumes greater significance, in view of the therapeutic potential of vitamin A and its metabolites in clinical research.
4. EXTENSION AND TRAINING
4.1 Influence of mass media on teenagers' diet and health-related behaviour
This cross sectional study explored the influence of mass media on adolescents' diet and health- related behaviour (HRB). The objectives were to assess media viewing habits of teenagers; to assess the media content which the teenagers' are exposed to; to assess teenagers' understanding and adoption of media content on diet and HRB; to study teenagers' perceptions and practices of diet and HRB; and to elicit influence of mass media, if any, on diet and health of teenagers. In all 517 (253 boys 264 girls) participated in the study from 21 schools/Junior colleges of greater Hyderabad. The results highlight variation between same age group children and between genders in usage of media and understanding of media messages. Mass media influence on teenagers varied broadly based on their families' economic status. Among each group again influence of media was divergent between genders. The study reveals the influence of mass media on teenagers' consumption of alcohol and tobacco products. A sum of 24% teenagers is influenced by mass media towards this unhealthy behaviour. Teenagers used these products to imitate media visuals, film actors, television advertisements/ celebrities. Comparatively, boys of middle-income families are more under influence of film stars and consume alcohol and tobacco products to imitate actions on the screen. More than one-third of teenagers of this study do not do any physical activity. The primary reasons they mention for physical inactivity are “homework pressure”, “lack of play ground” “watching television” or “Internet browsing”. Majority of Adolescents pester their parents to purchase food and beverages endorsed by celebrities.

xiii
5. FOOD AND DRUG TOXICOLOGY RESEARCH CENTRE5.1 Role of tamarind extract on the carbonic anhydrase activity in ameliorating fluoride toxicity in
rats Fluoride administration inhibits carbonic anhydrase activity of RBC and in kidney homogenate in fluoride intoxicated rats compared to control rats. Tamarind fruit extract (TFE) supplementation to fluoride intoxicated rats enhanced carbonic anhydrase activity with increased urinary fluoride excretion. Long term exposure of Fluoride showed a trend of impaired glucose tolerance in rats.
Integrated fluorosis mitigation activities in Nalgonda DistrictIn Nalgonda district, Out of 2066 students screened for dental fluorosis in school children, 1183 students (57.2%) were affected by dental fluorosis. The percentage prevalence of fluorosis in each category villages was 16% (Category I; water fluoride level 0.83 ppm), 47% (Category II; water fluoride level 2.06 ppm), 81% (Category III; water fluoride level 2.83ppm)) and 82% (Category IV; water fluoride level 3.8 ppm). Oxidative stress studies revealed the increased oxidative damage in High ODAP treated group compared to the control group. Histopathological changes indicated extensive degeneration of motor neurons in high ODAP treated group compared to the low ODAP treated group.
5.2 Studies on salmonella decontamination of foods using hybrid technology of ozone-pulsed UV Contamination of spices with Salmonella is an important cause of detention and rejection of
shipments of spices in export markets. Thermal methods of pasteurization or sterilization cannot be used for spices to remove this pathogen. In recent years ozone gas has been recognized as very powerful antimicrobial agent and can be used where thermal methods are not useful.. The study on effect of ozone in combination with UV in reducing Salmonella and its contamination in spices demonstrated that ozone in combination with UV was effective against Salmonella decontamination. Combination of ozone and UV caused lethality that was greater than the sum of lethality of ozone applied individually. The study showed that 0.2 ppm of ozone was effective against Salmonella Spp. than 0.8 and 1.4 ppm. There was 100% inactivation of Salmonella with the usage of ozone and UV at 0.2 ppm at 20 min of exposure time. About 20 min of exposure time was more effective in reducing the growth of Salmonella when compared to 5, 10 and 15 min of exposure time. A significant reduction of Salmonella in pepper (98.76%) was observed at 1.4 ppm concentration of ozone and 15 min of exposure time along with 30mins of UV exposure. Inactivation of Salmonella spp. (100%) in ground pepper (n=40) was observed at 1.4ppm conc. of ozone and 15 min of exposure time along with 30mins of UV exposure. A significant reduction of Salmonella (85.9%) in chilli was observed at 1.4 ppm conc. of ozone and 15 min of exposure time along with 30mins of UV exposure. Ozone in combination with UV can be an effective treatment for reduction in Salmonella contamination of spices such as chilli and pepper. The results demonstrated that the hybrid technology of ozone pulsed UV is a promising alternative technique for Salmonella decontamination in spices.
5.3 Emerging bacterial foodborne pathogens in milk products A study was conducted to determine the prevalence of emerging foodborne pathogens in milk
products. The study on emerging bacterial foodborne pathogens in milk products indicated the presence of foodborne pathogens like Salmonella and S.aureus. The other indicator organisms like E. coli and fecal coliforms were also detected in the milk products. The contamination of S.aureus(73.5%) was high in khoa than other milk products. The other emerging foodborne pathogens like Listeria Spp. Methicillin resistant staphylococcus aureus (MRSA), Yersinia enterocolitica and E.coli

xiv
O157:H7 were not detected in any of the milk products. Khoa (52%) samples were found to contain 6S.aureus above 10 cfu/g which is likely to produce heat stable enterotoxin. Among 143 (31.7%)
cultures of Staphylococci, 106 (74.1%) showed coagulase enzyme production and 37 (25.9%) isolates were coagulsae negative. Only nine cultures (6.3%) showed positive result for enterotoxin
6production. It is known that >10 cfu/g of S. aureus is likely to produce enterotoxin, however in the present study 17% of food samples have crossed the limit but very less number of them were able to produce enterotoxin. There is a need to carry out a detailed study on evaluation of coagulase production among Staphylococci and its enterotoxin production. The presence of Salmonella Spp. in milk product is a cause of concern from the consumer point of view. The counts of Salmonellaand S.aureus are not conforming to FSSA-Microbiological standards of foods.
5.4 Safety and quality of rice and wheat distributed in PDS with special reference to damaged grains and mycotoxin contamination
A project on Safety and quality of rice and wheat distributed in PDS with special reference to damaged grains and mycotoxin contamination was initiated in 2011 to assess quality and safety of rice and wheat during their distribution in the PDS chain. The main objective was to evaluate fungal and mycotoxin contamination in rice and wheat stored under government storage units and PDS centres and to assess the mycotoxin levels in damaged grains segregated from food grains distributed in PDS. Analysis of 24 samples consisting of raw milled rice, boiled rice and wheat collected from storage godowns in Cherlapalli, RR district, Hyderabad indicated that levels of aflatoxin were below the FSSAI/GOI tolerance limit of 30µg/kg in all the analysed samples. Aflatoxins were also not detected above the regulatory levels in 9 PDS samples collected from households and 25 samples non-PDS rice samples collected from the retail markets. In rice products such as broken rice, rice rawa, rice flakes and rice flour samples presence of aflatoxins was detected in 10/37broken rice but at levels below the FSSAI limits (1.0- 14.3g/kg). Aflatoxin levels in damaged grains segregated from rice samples indicated presence of fully damaged/discoloured grains (0.03-0.4%), partially discoloured grains (0.1-0.8%) and dull looking grains (0.3-1.7%) in which aflatoxins were detected at levels of 0.1, 0.2, 3.0 and 4.0g/kg respectively. Presence of ergosterol assessed in 9 brown rice and 21 milled polished rice samples was found at levels ranging from 0.5-1.0µg/g and 0.25-14µg/g in brown and milled rice respectively. The above study indicated that aflatoxins are not present at levels above the food safety limits in PDS samples. The study observed that a potential for occurrence of higher aflatoxin may exist due to presence of damaged grains.
5.5 Assessment of allergenicity potential of novel proteins expressed in genetically modified (GM) plants under varying conditions of digestion and thermal treatments
The project on Assessment of allergenicity potential of novel proteins expressed in genetically modified (GM) plants under varying conditions of digestion and thermal treatments was initiated in November 2009 with the objective of testing purified novel proteins expressed in GM crops for their stability to pepsin digestion and heat. The assay developed consisted of 3 components namely determination of limit of detection of the novel protein in order to measure 90% digestibility of the test protein in simulated gastric fluid with pepsin at pH 1.2 on SDS-PAGE, determination of pepsin activity so that the required activity level of enzyme to protein is maintained at 10:1 during digestion of test protein, and digestion of test protein in SGF at pH 1.2. The method was validated with various purified proteins that are known to be stable or unstable to pepsin digestion (β-lactoglobulin, ovalbumin, concanavalin A, bovine serum albumin, lysozyme, RUBISCO) and applied to testing of 6 novel proteins expressed in GM crops namely Cry1Ac and Cry1EC, (BT cotton),

Cry1Fa1 (BT brinjal), Bar, Barnase and Barstar recombinant proteins expressed in GM mustard, for stability to pepsin digestion as part of pre-market regulatory approval. All the novel proteins expressed in GM crops tested have been shown to be rapidly digested within 0.5 minutes thus indicating limited risk of food allergy for these proteins. The effect of varying pH of SGF and pepsin activity levels on extent of digestion was evaluated using purified proteins which showed that pepsin is active upto pH 3.5 in SGF and beyond that becomes inactive and hence cannot digest the proteins. The stability of novel proteins to varying temperatures was tested at 0-95ºC for insecticidal proteins namely Cry1Ac, Cry1EC, and Cry1Fa1 and enzymatic proteins namely Bar, Barnase, Barstar. The activity of the heat treated novel proteins tested using insect bioassays and enzyme activity assays showed that all the proteins were rapidly inactivated by heat at temperatures tested. Through the above project, the pepsin digestibility assay and thermal stability assay could be successfully established for testing GM crops and regulatory reports submitted to the RCGM GOI for approval.
6. NATIONAL CENTRE FOR LABORATORY ANIMAL SCIENCES6.1 Paternal diet restriction and metabolic gene expression studies in obese rat offspring Studies have suggests that paternal diet along with maternal diet has concurrent effect in
programming the offspring to various metabolic complications such as obesity, type 2 diabetes and other associated disorders. In this study the effect of paternal diet restriction on modulation of various metabolic pathways involved in carbohydrate and lipid metabolism in the offspring studied. Upon diet restriction of WNIN/Ob obese male rats from different age group, the circulatory cholesterol and triglycerides, were reduced significantly when compared to the age matched ad libitum fed group. It was also noticed that the levels of TBARs and TOC were significantly reduced upon diet restriction. Hence, diet restriction in male obese WNIN/Ob rats lowered the rate of body weight gain, with reduced oxidative stress overall and fertility restoration in groups at early development stages of intervention. Food restriction reduces obesity but does not improve Leptin gene expression in WNIN/Obese rats. Further, it was observed that the obese pups born to diet restricted obese males have higher body weight gain, mean body weight and higher lipid profile compared to obese pups born to adlibitum fed carrier males.
6.1 Genetic and epigenetic approach towards obesogenesity using a rat model Experimental data suggested that the all 4 rat strains studied showed a differential response
towards diet source. Experimental groups of WNIN showed altered glucose metabolism associated with defects in insulin sensitivity and insulin secretion as evidenced by higher plasma Insulin levels, scoring higher values for HOMA IR and HOMA-beta and lower values for Insulin Sensitivity Index (ISI). Further it was noticed that WNIN developed dyslipidemia condition in high calorie fed groups as evidenced by significant increase in abdominal fat, elevated levels of circulatory triglycerides and decreased HDL-cholesterol levels and showed significantly increased levels of inflammatory cytokines such as IL-6, MCP-1, IL-1beta, and TNF alpha. Visceral adipose tissue histology studies revealed that, increased hypertrophy and hyperplasia, and mean adipocyte area compared to controls in WNIN strain. However, in SD and F-344, there was no such phenomena was observed under high calorie environment. The transcriptome analysis of adipose & liver tissues of WNIN and Fischer-344 strains fed with high calorie diets (High fat, high fat Sucrose) showed differentially expressed genes and their specificity towards diet, species and organ.
xv

xvi

1. DEVELOPING A MULTI-COMPONENT NUTRITION AND HEALTH EDUCATION INTERVENTION MODEL TO COMBAT THE PERSISTENT PROBLEM OF UNDERNUTRITION IN THE RURAL AREAS OF ALLAHABAD, UTTAR PRADESH
Undernutrition continues to be a major public health problem in the developing countries, including India, the most vulnerable groups being women and young children. Proper nutrition is necessary for adequate growth and development of children. Undernutrition has a multi-factorial aetiology, which include both food and non-food factors. The present study was carried out to estimate the prevalence of undernutrition among under five year children and infant and young child feeding practices. The study was funded by National Academy of sciences, Allahabad, Uttar Pradesh.OBJECTIVES1. To conduct rapid nutrition assessment of <5 year children in the rural areas of Allahabad.2. To assess the awareness, perceptions and practices of various stakeholders about the existing national
nutrition intervention programmes, adopting Community Needs Assessment (CNA) technique.3. To identify strengths and weaknesses in the implementation of the existing national nutrition
intervention programmes.4. To assess the health seeking behaviour and practices of vulnerable segments of population such as
children (care takers), adolescent girls, pregnant women and lactating mothers.5. To assess awareness, perceptions and practices of environmental, personal hygiene and food safety
among mothers of <5 year children and.6. To assess the performance of functionaries working in the areas of health and nutrition.METHODS It was a community based cross-sectional study carried out using systematic random sampling procedure. Salient observations of the studyv A total of 606 HHs were covered from 25 Anganwadi Centers, including 600 children for the present
study.v About 67% of the pregnant women had reportedly undergone Antenatal care (ANC) during last
pregnancy, of which about 25% had at least 3 ANCs. About 31% of pregnant women registered for ANC before 12 weeks of gestation and most of them had ANC at PHC/CHC.
v Majority (92.8%) of pregnant women received TT immunization and 72% IFA tablets during pregnancy, of which 55% received >90 tablets and about 35% reportedly consumed >90 tablets.About 59% women received ICDS supplementation during pregnancy. Majority (92%) of the deliveries were normal and 75% took place in Institution, either Government (51%) or private (23%) hospital and majority (44%) were conducted by doctors and 26% by TBA/ANM/LHV. About 47% received monitory benefit of Rs. 1400/- towards delivery in government hospital. Birth weight was recorded in 60% of infants, and was available for all of them, as per the record, 23% new born had birth weight <2.5kg.
I. COMMUNITY STUDIES
1

Fig. Prevalence (%) of undernutrition (<Median –2SD) among <5 yrs children by age
0
10
20
30
40
50
60
70
Underweight Stunting Wasting
21.217.1
19.3
35.1
58.6
7.4
39.4
57.4
5.2
32.9
48.1
9.7
0-11 months
12-35 months
36-59 months
Pooled
%
p<0.01
p <0.001
p <0.001
Ÿ About 58% of mothers initiated breastfeeding within 1 hour, while 16% initiated 1-3 hours of delivery.Ÿ About 86% of 0-5 month children were solely breast fed while 77% children of 6-11 months received
complementary feeding in addition to breast milk.Ÿ About 41% children (12-59 months) were participating in ICDS supplementary feeding programme,Ÿ Only 66% children (12-24 months) were fully immunizedŸ The prevalence of undernutrition (<Median -2SD) among <5 year children such as underweight,
stunting and wasting was 33%, 48% and 10% respectively.Adolescent girlsŸ The proportion of literacy among adolescent girls was 98%. However, 16.6% of them were school drop
outs. Ÿ Only about 42% of adolescent girls were availing ICDS services and of them, about 76% received IFA
tablets and 52% received health education. Similarly, about 20% of adolescent girls were beneficiary of SABALA.
Ÿ About 89% of adolescent girls were attained menarche with mean age of 12.4 years. About 66% of adolescent girls reportedly experienced one or other problems related to menstruation and 75% reported regular periods. The proportion of adolescent girls using sanitary pads during menstruation was 96% and of them, a majority (58%) of girls using 6-10 sanitary pads per each menstrual cycle.
Ÿ The proportion of adolescent girls with undernutrition i.e. thinness was about 19%. Similarly, the proportion of adolescent girls with anaemia (Hb<12g/dL) was 91.8%.Of them, about 10% had severe anaemia (Hb<7g/dL).
Pregnant womenŸ About 46% of currently pregnant women registered their pregnancy by 12 weeks of gestational age
and 82% of each received TT immunization and IFA tablets during pregnancy. Only 33% of currently pregnant women received the stipulated ≥ 90 IFA tablets, while rest were still receiving the same.
2

Ÿ Similarly, 75% of pregnant women were beneficiaries of ICDS supplementary food. The proportion of pregnant women with anaemia (Hb<11g/dL) was 87.4%. Of them, about 13.3% had severe anaemia (Hb<7g/dL).
Ÿ Almost all the lactating women availed ANC services and 95% of them underwent at least 5 and above ANCs during their last pregnancy. About 62% of lactating women registered for ANC by 12 weeks of gestation and 98% received TT immunization during their last pregnancy. Similarly, about 93% of lactating received IFA tablets and of them about 89% received the stipulated ≥ 90 IFA tablets during pregnancy. The proportion of lactating women with Chronic Energy Deficiency (CED) was 21.6%, while
231.6% lactating women were overweight/obese (BMI≥ 23 kg/m ). The prevalence of anaemia (Hb<12g/dL) among lactating women was 91.4%. Of them, 3.2% had severe anaemia (Hb<7g/dL).
2. DISTRICT LEVEL MAPPING OF UNDERNUTRITION AMONG UNDER 5 YEARS CHILDREN, ADOLESCENT GIRL, PREGNANT WOMAN AND LACTATING MOTHERS AND INFANT & YOUNG CHILD FEEDING PRACTICES OF MOTHERS OF UNDER 3 YEARS CHILDREN IN THE STATE OF ANDHRA PRADESH
The Government of Andhra Pradesh has been implementing several welfare and development programs, to reduce the infant mortality and maternal mortality and the prevailing undernutriton among pregnant and lactating women and young children under 5 years of age. The Government has requested National Institute of Nutrition, Hyderabad, to carry out a study to assess the current nutritional status of <5 year children, adolescent girls, pregnant women and lactating mothers; Infant and young child feeding practices of the mothers of young children and to assess the performance of ICDS services. The study was carried out in all the thirteen districts of Andhra Pradesh.
INVESTIGATIONS
The following investigations were carried out in all the selected households of all the districts:· Household demographic and socio-economic particulars.· 24 hour dietary recall – Assessment of food and nutrient intakes of pregnant women and lactating
mothers, at house hold level and individual level, by 24 hour dietary recall was carried out in five randomly selected households of pregnant women and lactating mothers and adolescent girl.
· Anthropometry – Current height and weight of the pregnant women and lactating mothers, adolescent girls and measurement of recumbent length for 2years, height for 2-5 years children and weight for <5 year children was carried out.
· Clinical examination for nutritional deficiency signs and history of morbidity for previous 15 days was carried out by well trained and standardized staff.
· Haemoglobin (Hb) estimation was carried out in all adolescent girls, pregnant women and lactating mothers.
· Infant and Young child feeding practices: Among mothers of <3 year children were assessed by conducting in-depth interviews.
· Coverage of children under various health and nutrition intervention programmes was also carried out.
3

· Knowledge and performance of ICDS functionaries (AWW, Supervisors, CDPOs) was assessed by conducting in-depth interviews and FGDs.
After conducting in-house and field training for the project staff, data collection was initiated in the month of February 2015 and completed in the month of January 2016 in all 13 districts. The data scrutiny and data entry, data analysis was completed and preparation of reports for all the 13 districts was completed by June 2106 and submitted to the Ministry of Women and Child Development (WCD), Government of Andhra Pradesh. The salient observations of the study As per the sampling procedure, a minimum of 600 children of <5 years, 100 each of the pregnant women, lactating mothers and adolescent girls were covered from 600 households in 30 Anganwadi Center (AWC) villages, in each district. The study population consisted of mainly nuclear families (54%), with an average family size of 5.0. The average adult male and female literacy levels were 73% and 71%, respectively. A majority (38%) of the households was involved either in agricultural or other labour, with an average monthly per capita income of ` 1753 and it ranged from a low of ` 834/pm in the district of Ananthapur to a maximum of `3,556/pm in Kurnool district. The drinking water sources were mainly the tube wells or piped water (57%). About half of the HHs had the facility of sanitary latrine and were using it presently. A majority (>65%) of the HHs were using LPG as cooking fuel and almost all the HHs were electrified. The usage of adequately iodized (>15ppm) salt ranged from 31% to 68% among the districts. In general, the food and nutrient intake at the HH level and at Individual level among all the vulnerable groups was lower than the suggested levels of ICMR. Diets are especially deficient in energy and grossly deficient in micronutrients such as iron, vitamin A, calcium and folic acid. The district level mapping for stunting is provided for the state (Fig. 1). Overall, the prevalence underweight, stunting and wasting was 26%, 36% and 11%, respectively among <5 year children, the comparative figures reported by the NFHS- 4 for the state was 33%, 33% and 18%. Among the districts, the prevalence of stunting was maximum in the district of vizianagaram and Vishakapatnam (41.9% and 47.8%), while wasting was maximum in the district of East Godavari (14%). The factors affecting on stunting is provided in the Table 1. The average prevalence of low birth weight (<2.5Kgs) was about 11%, while in the districts of Guntur and East Godvari it was maximum 16.7% and 15.9%, respectively. It was observed that almost all the mothers practiced feeding of colostrum to their children and practiced exclusive breast feeding upto <6 month old children, in all the districts. Exclusive breast feeding till the age of 6 months as reported by the mothers of 6-12 month children was 63%. Early initiation of breast feeding (<1 hr after delivery) was about 59%. About two third of mothers (61%) initiated complementary feed to their children at the recommended age of 6 months.
Kurnool45.5
Srikakulam35.9Vijaya
nagaram47.8
Visakhapatanam41.9
East Godavari
35.2West
Godavari32.7
Krishna29.5
Guntur31.3
Prakasam31.1
Nellore32
Chittoor30.9
Kadapa40.8
Ananthapur37.3
< 30 %30-35 %35-40 %>40 %
Fig. 1 Mapping of districts according to the magnitude of stunting in Andhra Pradesh (height for age <Median-2SD)
Nutritional status of <5 yr children
4

Table 1. Factors affecting high stunting in the state of Andhra Pradesh
Factors Prevalence of Stunting (%)
<30* 30-35# 35-40$ >40!Scheduled Caste/Tribes 45 44 33 35Female literacy 78 77 73 61Protected water supply for drinking (Tap/tube well) 77 55 53 58Households having and using sanitary latrine 67 59 41 40Early registration (12 weeks of gestation) 88 60 76 70Pregnant women registered before < 12 weeks of gestation 91 69 76 73Institutional deliveries 98 96 94 85Children of 12-23 months fully immunized 93 90 92 87Pregnant women age 15-49yrs (< 11gm/dl) Anaemic 51 76 72 74
* Krishna district; # Guntur, Prakasam, Nellore , Chittor and West Godavari; $ East Godavari, Ananthpur and Srikakulam; ! Viziyanagaram, Visakapatnam, Kurnool and Kadappa
Ninety percent of the children of 12-24months were fully immunized and coverage for atleast one dose of vitamin A supplementation for 12-59 months children during preceding one year was 75% and only 16% of 12-59month children reportedly received IFA tablet/syrup. The coverage of children for de-worming tablets was low at 40%. A majority (72%) of the 6-59 month children regularly (>20days) participated in ICDS supplementary feeding programme. The proportion of children of 6-59 months weighed atleast three times during the past one year was about 40% only.
Only one fifth of adolescent girls (19%) have availed ICDS services and among them only 1% received food supplements from ICDS, while a majority (59%) of them participated in Mid day meal program. The total prevalence of anaemia among adolescent girls was about 75%.
Almost all the currently pregnant women were registered for ANC, of which early registration (<12 weeks of gestation) was 69%. Almost all the currently pregnant women reportedly received supplementary food from AWCs. The 9% pregnant women were nutritionally at risk by height <145cm, by weight (<39 kgs), it was 3%. The overall prevalence of anaemia among pregnant was 73%.
Almost all the lactating mothers of <12 months children had undergone antenatal check-up (ANC) during the previous pregnancy, of which 74% of the lactating mothers registered before 12 weeks of gestation and 75% of mothers had undergone ANCs for more than 5 times during pregnancy. The coverage of tetanus toxoid vaccination during pregnancy was almost in total in all the districts. Only 75% of the currently lactating women received and consumed >100 tablets during pregnancy. About 96% of lactating mothers received ICDS supplement during previous pregnancy and 89% of them received food supplements during lactation. The coverage for IFA tablet during lactation was 7% only. Majority (92%) of the deliveries were institutional. About 78% of the lactating mothers were anaemic.
In conclusion, it was observed that the growth monitoring of the children and weight monitoring of the pregnant women is at low level. The coverage for the IFA tablet distribution among preschool children, adolescent girls and lactating mothers was low, while the participation in ICDS supplementary food program was satisfactory. The coverage for vitamin A supplementation among children and coverage for immunization of children and pregnant women is satisfactory, while the coverage for deworming is at low level. The knowledge levels of AWWs, supervisors and the CDPOs about the ICDS services, immunization and nutrition invention program is satisfactory. But, there is a need to strengthen the existing national nutrition intervention programmes along with promotion of better infant and young child feeding practices, health and nutrition education for parents and health care and sanitation practices (IYCF) for overall improvement of health and nutritional status of children. There is also need to
5

strengthen the programmes aimed at income generation, so as to enhance household food and nutrition security.
District level mapping of undernutrition among <5 year children was very high in the districts of vijayanagaram, Vishakapatnam, Kurnool and Kadapa, where more focused attention is required by the nodal department (MoWCD).
3. ASSESSMENT OF MAGNITUDE, PREVALENCE AND AETIOLOGY OF CHRONIC KIDNEY DISEASE AMONG THE RURAL POPULATION RESIDING IN MICA BELT OF NELLORE DISTRICT, ANDHRA PRADESH
The End Stage Renal Disease (ESRD) patient population continues to grow globally at an alarming rate due to a number of factors including chronic interstitial nephritis. Chronic interstitial nephritis is presumed to be due to drugs or environmental toxins, and the possible environmental toxins include water and food related toxins. Electronic and print media reported high prevalence of kidney related problem and deaths in Uchapally village, Podalakuru mandal located in mica belt of Nellore district and the ICMR and NIMS (Nizam's Institute of Medical Sciences), Hyderabad rapid exploratory study confirmed the same. Subsequently, as per the recommendations of members of NIN scientific advisory committee (SAC), a pilot study was carried out in four villages located in mica belt, with an objective to study the prevalence of kidney disease among the adult population from the selected villages located in the mica belt. ICMR pilot study also reported high prevalence (34%) of chronic kidney disease (CKD i.e GFR <60)) among the population residing in mica belt of Nellore. Therefore, it was proposed to carry out a comprehensive study to assess the prevalence, distribution and causes of kidney disease among the rural population residing in mica belt of Nellore district.OBJECTIVES· To assess the magnitude of kidney related diseases among the population residing in Mica belt of Nellore district.· To assess the prevalence of chronic kidney disease (CKD).· To evaluate the etiological factors for endemic kidney diseases.· To recommend possible remedial measures.· To design public health education and awareness programmes. METHODOLOGY A community based cross-sectional study was carried out in 2 villages of Mica belt region of Nellore district, Andhra Pradesh covering 793 adult (≥ 18 years) subjects of both genders (Men: 46.3% & Women: 53.7%). Information of socio-demographic particulars and source of drinking water was obtained from all the participants. History of consumption of NSAIDs, diabetes mellitus and hypertension was also collected from the subjects.RESULTS· A total of 793 adult subjects were covered for this study. Of them, majority (40.5%) are in the age group of 41-59 years followed by 18-39 years (31.4%) and 60 years and over (28.1%).· The major occupation of majority (44.3%) subjects was agricultural and non-agricultural labours (Mica
mine workers). Major source of drinking water is ground water (Bore well: 56& & Open Well: 32%). History of consumption NSAIDs was 42.5% with 28.8% occasional history of NSAIDs consumption. The
6

proportion of alcoholics and smokers was about 18.7% and 26.6%, respectively. About 45% subjects gave history of back ache, while 43% reported ankle pain.
· The proportion of subjects with known hypertension and diabetes was about 15% and 12%, respectively. However, on recording the blood pressure, the prevalence of hypertension was 30.8% (Men: 31.9% & Women: 29.9%). Similarly, on estimation of blood sugar, the prevalence of diabetes mellitus was 9.4%.
· The proportion of subjects with high serum creatinine (≥ 1.3g/dL) was 9.1% (Men: 14.7% & Women: 4.2%). While, the proportion subjects with glycosuria and proteinuria was reported among 20.8% and 33% of subjects, respectively. Similarly, haematuria was reported among 16% of subjects.
· With respect to chronic kidney disease (CKD), majority (39.9%) were in Grade-II CKD followed by Grade-III (7.3%), Grade-IV (0.9%) and Grade-V (0.1%).
4. ASSESSMENT OF NUTRITIONAL STATUS OF UNDER FIVE YEAR RURAL CHILDREN AND PERFORMANCE OF ICDS FUNCTIONARIES IN THE DISTRICTS OF PONDICHERRY
Despite the rapid agricultural and industrial growth, and consequent economic development and implementation of many national nutrition intervention programmes undernutrition continues to be a major public health problem in India. The most vulnerable segments of the population are preschool children, pregnant women, lactating mothers and adolescent girls, especially in the chronically drought prone rural areas, tribal communities and urban slums. Recent survey was carried out by NNMB (2011-12) in the rural areas of nine States revealed that about 45% of under-five children had underweight, 48% were stunted and 21% had wasting. The corresponding NNMB figures were not available for the state of Pondicherry as NNMB was extended to Puduccherry state only during 2012. Disaggregated data at the district level is very essential for the State Government to identify and map the regions which are at a higher risk of undernutrition to develop and implement appropriate intervention measures for the control and prevention of undernutrition in the community. Therefore, at the request of the Women & Child Development Department, Government of Pondicherry, National Institute of Nutrition, ICMR, Hyderabad, proposes to carry out district level survey, to assess the nutritional status of the under-five year children and Infant & Young Child Feeding practices among the rural communities in the following 2 districts and Urban areas of Pondicherry State.OBJECTIVESGeneral Objective
To assess health and nutritional status of <5 year children and infant & young child feeding practices among <3 year children at the district level.Specific objectives1. To assess the nutritional status of <5 year children and mothers of <5 year children in terms of
anthropometry such as heights & weights, and prevalence of clinical signs of nutritional deficiency.2. To assess the prevalence of morbidity among <5 year children during previous fortnight.3. To assess the infant & young child feeding practices by mothers of under 3 years children.4. To assess knowledge and performance of various functionaries of ICDS. In terms of ICDS objectives,
functions and other related activities.5. To estimate the iodine levels in the household (HHs) salt samples used for cooking by spot testing kit.
7

SALIENT FINDINGS OF THE STUDY· A total of 924 pre-school children (Boys: 55.8% & Girls: 44.2%) were covered from rural areas of
Puducherry. While the coverage of adolescent girls, pregnant woman and lactating mothers was 319, 261 and 308, respectively.
· Birth weight of all the infants was recorded and the majority (98.5%) of the infants were weighed with 24-hours after delivery. The proportion of infant's birth weight below 2.5kg was 13.1%.
· The proportion of mothers initiated breast feeding to their infants within one hour was 48.3%. None of the mothers fed pre-lacteals to their new born. Similarly, about 97% of mothers fed colostrum. Only 49.1% of mother's exclusive breast fed their infants up to 6 months. While, 72% of mothers initiated complementary feeding after completion of 6 months.
· About 93% of 12-24 months children were completely immunized for 6 vaccine preventable diseases. While about 90% of children received complete immunization for 7 vaccine preventable diseases, including 3 doses of Hepatis-B vaccination.
· About 57% of pre-school children were receiving supplementary feeding from ICDS. Of them, about 88% of children were receiving it regularly. The proportion of 6-36 months children availing Take Home Ration (THR) was 33%.
· Only 5.4% children reportedly received IFA tablets/syrup. Similarly, the proportion of children received at least one massive dose vitamin A solution was about 77%.
· The prevalence of morbidities during preceding 2 weeks of survey fever ( 22.4%), ARI (21.6%), diarrhoea ( 5.9%) and measles (0.5%).
· The prevalence of undernutrition such as underweight, stunting and wasting among rural under five year children was 16.7%, 15.6% and 12.4%, respectively.
· The proportion of under five year children with anaemia (Hb<11g/dL) was 98%.Of them, about 14% had severe anaemia (Hb<7g/dL).
· The proportion of literacy among rural adolescent girls of Puducherry was 99.7%. The proportion of adolescent girls availing ICDS services was only 3%. However, about 83% of adolescent girls reported received IFA tablets in Schools. About 76% of adolescent girls were attained menarche with mean age of 13.1 year.
· About 60% of adolescent girls reportedly experienced one or other problems related to menstruationand 90% reported regular periods. The proportion of adolescent girls using sanitary pads during menstruation was 97% and the mean number of sanitary pads used per each menstrual cycle by adolescent girls was 13.1.
· The proportion of adolescent girls with undernutrition i.e. thinness was about 16% and about 22% of adolescent girls were stunted.
· Similarly, the proportion of adolescent girls with anaemia (Hb<12g/dL) was 98%.Of them, 2.5% had severe anaemia (Hb<7g/dL).
· All the lactating women availed ANC services and underwent at least 5 and above ANCs during their last pregnancy. About 27% of lactating women registered for ANC by 12 weeks and 72% registered for the same between 12-23 weeks of gestation. Similarly, 99% lactating women received TT immunization during their last pregnancy. Almost all the lactating women received IFA tablets and of them about 95% received the stipulated ≥ 90 IFA tablets during pregnancy. Similarly, a majority (92%) of them received supplementary food supplied by ICDS.
· The proportion of lactating women with Chronic Energy Deficiency (CED) was 10%, while 57% 2lactating women were overweight/obese (BMI≥23 kg/m ). The prevalence of anaemia (Hb<12g/dL)
among lactating women was 98%. Of them, 3.3% had severe anaemia (Hb<7g/dL).
8

1. TO ESTIMATE THE NORMATIVE VALUES AND PLOT A NORM GRAM FOR SERUM FOLIC ACID AND B LEVELS AMONG WOMEN 15-35 YRS. AGE GROUP IN 12
MAHBOOBNAGAR DISTRICT, TELENGANA
To estimate normative values and plot a normogram for serum folic acid and B12 levels among women 15-35 yrs age group in Mehboobnagar district of Andhra Pradesh.STUDY DESIGN A Community based cross-sectional study. This sub study is part of a bigger study which involves documenting the effects of folic acid deficiency on pregnancy outcomes in the same district and a study being conducted by NIN to look at the nutritional status of girls aged 10-19 years of age in the district of Mahabubnagar.STUDY AREA: Mahabubnagar district of Andhra Pradesh STUDY POPULATION: 15-35 years women. All the women irrespective of their marital status and pregnancy and lactating status at the time of the study shall be included in the study. STUDY PERIOD: December 2012 to November 2013.SAMPLE SIZE: Using the unpublished data by NIN, mean and standard error for women in reproductive age group were estimated. With mean folic acid level of 10ng/ml and Standard error 1.1, for precision of 0.1 and .05 alpha, sample size is 465. For this study 500 women age 15-35 years will be included in the study. STATUS OF THE PROJECT: Project was completed and the data and samples were handed over to the PHFI, Hyderabad.
II. CLINICAL STUDIES
9

III. MICROBIOLOGY AND IMMUNOLOGY
1. A PROSPECTIVE COHORT STUDY TO UNDERST AND PERICONCEPTION AND PRENATAL FACTORS THAT INFLUENCE FETAL & POSTNATAL GROWTH AND DEVELOPMENT
The period of intrauterine growth and development is one of the most vulnerable periods in the human life cycle. The birth weight of the infant is a powerful predictor of infant growth, survival and also for the development of chronic diseases in adulthood and is dependent on maternal health and nutrition during pregnancy. Numerous studies in India and elsewhere have shown that in chronically undernourished women subsisting on poor nutrition, pregnancy and lactation have adverse effect both on maternal nutritional status and offsprings nutritional status. In India, 30% women are chronically undernourished and a proportion of 52% are anemic well before they conceive. Low birth weight (LBW) is also highly prevalent with 43 % babies showing growth restriction (small for gestational age- SGA) at birth in India. Poor foetal growth has both short-term consequences for survival and long-term adverse effects on cognitive development and risk of adult metabolic diseases such as diabetes type 2 and cardiovascular diseases. Several studies indicate that birth weight is not determined by genetic variation but by prenatal environment and the major determinants of SGA are low pre-pregnancy nutrition, poor gestational nutrition, short maternal stature and maternal infections. These findings highlight the need for interventions in pre-conception and prenatal period to prevent SGA babies in India. Thus the present study was carried out to determine maternal nutrition at the time of conception and correlate it with birth weight.HYPOTHESIS Maternal nutrition at the time of conception is a key determinant of course and outcome of pregnancy, birth weight and later development of the infant. OBJECTIVE To determine impact of peri-conception maternal nutrition status on birth weight.METHODOLOGY Study design: Prospective cohort study.Patient recruitmentInclusion criteria: All married, non pregnant women of childbearing age, signed informed consent and willing to comply with instructions.Exclusion criteria: Those not willing to comply with instructions or participating in any other clinical trial, those with chronic infections, metabolic complications, and inflammatory conditions such as Rheumatoid arthritis, SLE, gout, etc were excluded. MATERIALS AND METHODS· Non pregnant married women, who are likely to get pregnant were identified and recruited.
Demographic details for all these women were collected along with gynaecologic history including last menstrual period (LMP).
· Every 4-5 weeks these women were visited and their menstrual status enquired (LMP rounds). Pregnancy test was carried out to confirm pregnancy in women who had missed periods. On
10

confirmation of conception they were included in the pregnancy cohort and their height and weight were measured to assess nutritional status and a blood sample was collected to determine haemoglobin concentration.
· The recruited pregnant women were followed every month for antenatal examination and nutrition status assessment. Ultrasonogram was done to all pregnant women. 24 hours recall diet survey were carried out in all pregnant women at around 20 weeks of gestation.
· Delivery out come and complications if any were noted and maternal post natal weight was recorded for all subjects. Upon delivery, birth weight and other measurements of the new born were collected. The cohort might be extended prospectively till the children reach adulthood.
WORK DONE Three hundred and fifty nine (359) women in early pregnancy were enrolled. The mean age of
pregnant women was 22.6±4.01 years. The mean gravida and para were 1.8±0.82 and 1.3±0.95 respectively and 35.2% (92) women were primigravidas. Height and weight of pregnant women at the time of conception were available in 350 subjects; and 9 pregnant women refused measurements.
Women were categorised as malnourished and well nourished based on their BMI at the time of conception. The mean height (cm) and weight (kg) of pregnant women were 151.5±15.0 cm and 50.2±10.59kg (Table 1) respectively. The mean BMI at the time of conception was 21.8±4.9.24.2% (85) were undernourished (<18.5), 19.1% (67) were obese or over weight (BMI>25) and 56.6% (213) had normal BMI (18.52-24.9) at the time of conception (Table 2). Overall, 64.4 % were anaemic (<11gm/dl) at the time of conception.
The mean birth weight (kg) was 2.76±1.11 and mean gestational age was 37.9±1.92 weeks. 10.6% (21) were delivered prematurely. Low birth weight was prevalent in 12.6% (29); and 13.8 % (32) had adverse pregnancy outcome (Table 2). There was no difference in proportion of preterm deliveries in relation to maternal BMI or anaemia at the time of conception. However, of the 41 overweight women, none had LBW, and the birth weight was significantly higher when compared to undernourished and normal BMI women (Table 2). Ironically, a high proportion of women with adverse pregnancy outcome were also overweight.
Table 1. Nutritional status of pregnant women at periconception (8-10 weeks pregnancy) period in relation to maternal BMI
Table 2. Delivery outcome was available in 198 subjects
BMI No Proportion Mean BMI Mean Hb(g/dl)
Proportion with anemia, Hb (<11g/dl)
<18.5 85 24.3 17.2±2.89 10.9±2.51 49.4 (42/85)18.5-25 199 56.6 21.5±4.59 10.8±2.68 81.4(162/199)>25 67 19.1 28.7±3.96 11.2±2.28 32.8(22/67)Total 351 21.90 ±4.99 10.9±3.40 64.4 (226/351)
BMI 18.5 (46) 18.5-25 (111) >25 (41) Total
Mean Birth Weight (kg) 2.76±1.21 2.69±1.06 2.93±1.13 2.76±1.11
LBW % 17.3 (8/46) 15.3 (17/111) NIL 12.6 (25/199)(25//199)
GAD (wks) 38.0±2.21 37.9±1.79 38.1±1.98 37.9±1.92PTD % 10.8 (5/46) 10.8 (12/111) 9.7(4/41) 10.6 (21 /199)
11

IV. BASIC STUDIES
1. ISOLATION AND CHARACTERIZATION OF FOOD DERIVED IRON BINDING PEPTIDES AND THEIR EFFECT ON IRON BIOAVAILABILITY: A PROTEOMIC APPROACH
Dietary proteins in general possess specific biological properties which make these components potential ingredients of functional or health-promoting foods. Many of these properties are attributed to physiologically active peptides encrypted within the large protein molecules. These peptides are inactive within the sequence of parent protein but are released during gastrointestinal digestion or food processing. Depending on the amino acid sequence, these peptides may exert a number of different activities in vivo. Studies over the past two decades have demonstrated that iron bioavailability from protein rich foods, particularly from animal sources is high. Although the exact nature of components that enhance the iron absorption remained unknown, it is believed that peptides released during digestion of dietary proteins might bind and thus enhance the absorption of iron. The aim of this project is to isolate the iron binding peptides generated during simulated in vitro digestion of protein rich foods and test their effect on intestinal iron absorption. During the past three years we have attempted isolation of iron binding peptides from various legume seeds, egg, milk, chicken and other non-vegetarian sources. We have identified that citric acid is the major iron binding component of legumes seeds while no specific iron binding peptides could be observed after the digestion. In chicken and meat sources, several iron binding peptides were observed but were abundant in extremely low quantities; therefore, their isolation and characterization remained incomplete at this time due to methodological limitations. In the current report we reported the successful isolation and characterization of iron binding peptides from egg white and buffalo milk. However, only egg white peptide increased the iron absorption in intestinal cells, while the buffalo milk peptide inhibited the same.AIMS AND OBJECTIVESHypothesis: “Iron binding peptides generated during gastrointestinal digestion of protein rich foods increases the solubility and intestinal absorption of iron” OBJECTIVES1. To isolate iron binding peptides generated during simulated in vitro digestion of protein rich plant
(legume) and animal foods.2. Primary structure elucidation of iron binding peptides isolated from various food sources.3. To study the effect of purified peptides and their synthetic counterparts on iron solubility and
intestinal absorption in Caco-2 cell line model.4. To understand the role of specific amino acids on iron binding potential of peptides.5. To test the efficacy of iron binding peptides (both purified and their synthetic counterparts) on iron
bioavailability from various test foods fortified with iron.METHODOLOGYIn vitro digestion: Egg whites, buffalo milk, chicken, mutton and beef were obtained from local super-market. The seed samples (250g each) were soaked in 3 volumes of saline (0.9% NaCl) overnight, boiled for 30 min and homogenized to a fine consistency using polytron at maximum setting. Similarly, egg
12

whites (collected after boiling), milk, chicken and meat were homogenized (defatted with ether) and used for the subsequent digestion. Briefly, the pH of the sample was adjusted to 2 with 6N HCl followed by
oaddition of 1 g of pepsin and incubated for a period of 3 h at 37 C. At the end of digestion, the pH was neutralized to 6.8 with 1M bicarbonate solution, followed by addition of 0.5 g of pancreatin and
oincubated for a period 3h at 37 C to complete the digestion process. At the end of digestion, the samples owere clarified by centrifugation at 12000rpm for 30min at 4 C. The clarified supernatant was subjected to
ultafiltration through 10 kDa cutoff filters to collect the peptides (<10kDa) in the filtrate. The filtrate was then passed through the C-18 column (50mL packed volume), to separate the hydrophilic (unbound) and
ohydrophobic (bound) peptides and the fractions were lyophilized and stored at -20 C.Ion exchange chromatography: The lyophilized hydrophilic (dals) or hydrophobic peptide fractions (egg white, milk, chicken and meat) were reconstituted in 10 mL of 10mM Tris HCl buffer pH 7.5, and subjected anion-exchange chromatography on Mono-Q HR column (5mL). The column was equilibrated with 10 mM Tris HCl buffer pH 7.5, and eluted with a linear gradient of 10mM Tris HCl buffer pH 7.5 containing 1M NaCl from 0 to 0.5M. 5mL fractions were collected while monitoring absorbance at 215 nm.Gel filtration chromatography: The active fractions possessing iron solubilization activity obtained after the ion-exchange chromatography were pooled and concentrated by lyophilization. The samples were reconstituted in 2mL of 0.45%NaCl and fractionated on superdex-peptide HR (30 cm). One mL fractions were collected while monitoring the absorbance at 215 nm.Iron solubility assay: Ferric chloride stock solution (2.5 mmole/L in 6N HCl) was diluted to a final concentration of 25 µmole/L 50 mmole/L MES buffer (pH 6.5) in the absence (blank) or presence of 25 µL
o oof peptide fractions. The aliquots were then incubated at 37 C for 1 h, and centrifuged at 15,000g at 4 C for 15 min. The iron content of the supernatants was monitored calorimetrically for identifying the fractions with iron solubilization activity. The percent (%) solubilization of iron was calculated by assuming the solubility of iron in reference preparation of 1:20 iron/ascorbic acid as 100%.Iron uptake in Caco-2 cells: Caco-2 cells were grown in 6-well culture plates and used for the experiments 13 to 14 days post-confluence as described previously. To study the uptake of iron, the spent media was replaced with 1.5 mL of MEM and the cells were allowed to adjust to the media overnight. On the day of the experiments, ferric chloride (2.5 mmole/L stock in 10 mM HCl) was diluted to a final concentration of
59100 µmole/L (traced with 50nCi FeCl ) with MES buffer (50 mmole/L, pH 6.5) in the absence (blank) or 3
presence of 500 µmole/L of ascorbic acid or peptide fractions (100 µL of pooled gel filtration fractions) and then fed to the differentiated Caco-2 cells for a period of 2 h. After the incubation the monolayers were washed with ice-cold PBS containing 10 mmole/L bathophenonthroline, harvested by scraping and 59Fe radio activity counted in liquid scintillation counter. The % uptake was calculated assuming the uptake of iron in the presence of ascorbic acid as 100%.RP-HPLC: Reverse phase chromatography was performed on C-18 column (30X2.5cm, 5µ) connected to Agilent 1100 series HPLC system. Briefly, the column was equilibrated in solvent A (2% acetonitrile, 0.05%TFA) followed by elution with linear gradient of 50% solvent B (acetonitrile, 0.05% TFA). The flow was monitored at 215nm. The individual peaks were collected and tested for iron solubilization activity as described above.Matrix assisted laser desorption ionization-time of flight (MALDI-TOF) spectrometry: The dried HPLC peak fractions showing iron binding activity were reconstituted in 20 µL of 2% acetonitrle (with 0.1% TFA). The sample (1 µL) was mixed with equal volume of 50% acetonitrile, 0.1% TFA containing 5 mg/ml α-cyano-4-hydroxycinnamic acid (CHCA), spotted on a stainless steel target plate and dried. All MS and MS/MS spectra were acquired on an ABI 5800 TOF-TOF (Applied Biosystems, Foster City, CA, USA). The instrument was equipped with a nitrogen laser and operated in a positive-ion delayed extraction reflector mode. External calibration was performed by use of a standard peptide/protein mixture (Applied Biosystems). Usually, 250 individual spectra of each spot were averaged to produce a mass spectrum. The MS/MS spectra were acquired in 1-kV positive ion mode. Database searching was realized using the MatrixScience website (www.matrixscience.com) for MS/MS interrogations on Gallus gallus proteins
13

from Swiss-Prot databank (www.expasy.org). The search parameters were as follows: oxidation of methionine as variable modification and phosphorylation of serine/threonine as fixed modifications, no proteolytic enzyme specified and mass accuracy tolerance was set at 50 ppm for parent and 0.5 Da for fragments.59Fe uptake in Caco-2 cells: Caco-2 cells were grown in 6-well culture plates and used for the experiments between 13-14 days post-confluence as described previously (Palika et al., 2013). Ferric chloride (2.5 mmol/L stock in 10 mmol/L HCl) was diluted to a final concentration of 25 µmol/L (traced with 0.5 µCi of 59Fe) with MES buffer (50 mmol/L, pH 6.5) in the absence (blank) or presence of ascorbic acid (250 µmol/L), 0, 1:0.5, 1:1 and 1:2 molar ratio of iron to synthetic egg peptide or milk peptide, or peptide fractions isolated from chicken and meat were then fed to the differentiated Caco-2 cells for a period of 2 h. After the incubation the monolayers were washed thrice with ice-cold phosphate buffer saline containing 10 mmol/L batho-phenonthroline (to remove non-specifically bound iron), harvested by scraping, and counted in a liquid scintillation counter (Perkin Elmer, USA). The % uptake was calculated assuming the uptake with ascorbic acid as 100%. RESULTSCharacterization of iron binding peptides from egg white, buffalo milk, chicken and meat: The iron solubilization activity of egg, milk, chicken and meat protein digests increased as a function of pepsin and trypsin digestion, suggesting release of iron binding peptides due to digestion. Further, iron solubilization activity was higher after intestinal phase of digestion compared to peptic digestion (Fig. 1A representative data with egg white). The iron solubilization activity of egg, milk, chicken and meat digest was specifically resided in the C-18 column bound fraction, implying hydrophobic nature of these peptides (Fig. 1B representative data with egg white). The peptides were purified further by ion-exchange, gel-filtration and RP-HPLC. The iron solubilization activity was specifically resided in a single peak fraction during the above chromatographic steps of egg white and milk, suggesting that single peptide mediates the iron solubilization. The RP-HPLC of egg and milk iron binding peptides showed several peaks, but the iron solubilization activity was resided in a single peak, which was used for further characterization. The MALDI MS/MS analysis followed by de novo sequencing of egg white (Fig. 2) and
(PO )milk (Fig. 3) identified the peptides as internal fragments of ovalbumin (DKLPGFGDS IEAQ, 1456.7amu) 4
and casein (1242.56amu, MHQPPPQPLPPT), respectively. Fig 1. Effect of gastrointestinal digestion on iron binding capacity of egg white proteins: Iron solubilization activity of egg white protein digests with pepsin and pancreatin was assessed as a function of time (A). The iron solubilization activity of different fractions of egg white digests during the purification process (B). The % solubility was calculated assuming the solubility of iron in 6N HCl as 100%. The bars indicate mean+SD and bars with different superscripts are significantly different (P < 0.05).
14

Interestingly, the peptide isolated from egg white is a serine phosphorylated while milk the peptide contains histidine residue, which could be involved in iron binding. The synthetic peptides corresponding to this amino acid sequences also solubilized the ferric iron (Fig. 4, black bars). However, only the egg peptide increased the iron uptake in Caco-2 cells while the milk peptide inhibited the same (Fig. 4, gray bars). Subsequent studies suggested that phosphate group of egg peptide is essential for its iron binding while acidic amino acids also appears to play role. In contrast to egg and milk fractions, several iron binding peptide peaks were identified during gel filtration chromatography of chicken (3 fractions, closely eluting between molecular weights of 1000-2000Da) and meat peptides (2 fractions eluting between molecular weights of 1500-2000Da). However, the activity was sufficiently high to allow for further purification.
Fig 2. MALDI-MS/MS and de novo sequence analysis of egg white iron binding peptide. The HPLC peak fraction showing the iron binding activity was subjected to MALDI-MS and MS/MS analysis. The peptide peak corresponding to 1456.7 amu was subjected MS/MS analysis and analyzed for de novo sequencing using protein pilot software. The sequence annotation of MS/MS spectrum were shown in the figure.
Fig 3. MALDI-MS/MS and de novo sequence analysis of milk iron binding peptide. The HPLC peak fraction showing the iron binding activity was subjected to MALDI-MS and MS/MS analysis. The peptide peak corresponding to 1242.55 amu was subjected MS/MS analysis and analyzed for de novo sequencing using protein pilot software. The sequence annotation of MS/MS spectrum was shown in the figure. The sequence annotation of MS/MS spectrum.
Fig 4. Effect of Egg white and milk synthetic peptide 59on Fe iron uptake in differentiated Caco-2 cells:
59Ferric chloride (25 µmol/L, traced with 0.5 µCi of Fe) was fed to Caco-2 cells in the presence of indicated molar ratios of iron to synthetic egg (black bars) or milk (gray bars) peptide for a period of 2h. The cell
59associated Fe radioactivity was assessed as described in methods. The % uptake was computed assuming the uptake with control as 100%. 0
50
100
150
200
0 0.5 1 2 5
Iron/peptide ratio
59Fe
upt
ake
(%)
15

CONCLUSIONTogether, these results demonstrate existence of cryptic iron binding peptides generated during
gastro-intestinal digestion of protein rich foods, which could explain high iron absorption from these foods. Further, these peptides could either enhance or inhibit iron absorption. We have for the first time reported isolation and characterization of novel iron absorption enhancing peptide from egg white, and provided proof of concept with its synthetic peptide. The methodology developed for the isolation of iron binding peptide could pave the way for isolation of many such peptides in enhancing iron absorption.
2. ROLE OF VITAMIN D IN ADIPOSITY
The active hormonal form of vitamin D, 1,25[OH] D is essential for calcium homeostasis and this is 2 3
known to be the classical function of vitamin D. The classical function of vitamin D is carried out by the intestine, kidney and bone in concert with the parathyroid gland. Therefore, all these organs are known as target organs. In the last two decades it has been demonstrated that, 1,25D plays an important role in many non-target tissues in the body such as immune cells, pancreas, skin, muscle and adipose tissue. Recent reports from literature have demonstrated that vitamin D receptor knockout mice are resistant to diet-induced obesity. Preliminary studies from our laboratory have shown that rats fed on a vitamin D deficient diet gain less weight compared to vitamin D given control rats. The adipose tissue mass in the deficient rats was significantly less compared to control rats. The probable mechanism for reduced adiposity in a vitamin D deficient state has not been studied. Hence we assessed the role of vitamin D and calcium on both visceral and total body adiposity in a diet induced vitamin D deficient rat model.OBJECTIVE To study the role of vitamin D deficiency on body adiposity.METHODOLOGY
The schematic diagram for the experiment is shown below.Fig 1. Flow chart depicting the experimental protocol used
Male weanling sprague Dawley rats
Group I Group IIControl (+D3 diet – ad lib) (-D3 Diet)
Rats were fed the AIN-93 based diet containing 66kcal% carbohydrate, 20kcal% protein and 15kcal% fat. Groups I and II were fed for 12weeks and after confirming Vitamin Ddeficiency, Group II was further subdivided into three groups andfeeding was continued for six more weeks and animals were sacrificed, blood and different types of fat pads (retro-peritoneal, epidydimal and mesenteric) were collected, frozen in liquid nitrogen and stored at -80°C.
Group II Group III Group IV (-D3 diet) (High Ca diet (5% Ca) (+D3 Diet)
16

RESULTSA) The average food consumed by rats in the
different groups was monitored throughout the experimental period and there was no difference in the food intake between the groups. Rats in the vitamin D deficient group had body weights lower than the vitamin D given control group starting at ten weeks of age and this trend continued till the end of the experiment. Supple-mentation with vitamin D diet restored the body weights to that of control rats. Feeding the high calcium rescue diet resulted in increase in body weight, but this was less than that of control rats. The body weights from fifteenth week (time point when rehabilitation was initiated) till the end of the experiment (i.e. 21weeks of age) of different groups are shown in Fig 1.
B) The fresh weights of the different visceral fat pads namely retroperitoneal, epididymal and mesenteric were significantly less in the deficient group than control group (Fig 2). Both supplementation with vitamin D diet and the high calcium rescue diet corrected this change. Accordingly, the computed values of adiposity index were lower in the deficient group compared to control group, and both supplementation with vitamin D diet and the high calcium rescue diet reversed this change (Fig 2). The total body fat calculated as the difference between the body weight and lean body mass was less in the deficient group compared to control group (Fig 3A). The TAF was also significantly decreased in the vitamin D deficient group than vitamin D sufficient controls (Fig 3B), and this appeared to be corrected both by vitamin D diet and also upon high calcium feeding. This data indicates that vitamin D deficiency leads to reduced body adiposity.
C) Our observations of reduced fat mass and tissue associated fat prompted us to examine the serum lipid profile, adipokines and insulin in the different experimental groups. Serum levels of total cholesterol and HDL-cholesterol were comparable between the groups. Serum triglyceride levels were decreased in the vitamin D deficient group (Fig 4A), and this appeared to be corrected
Fig 1
Fig 2
Fig 3A Fig 3B
Fig 4A
17

only by vitamin D supplementation. Serum adipogenic hormones such as leptin, adiponectin and insulin were studied in the different groups. Serum leptin was decreased in the deficient group compared to control group (Fig 4B). Although serum adiponectin was higher in the deficient group it was statistically not significant (Fig 4C). Serum insulin was significantly reduced in the deficient rats compared to control rats, and this was partially corrected with high calcium rescue diet and completely reversed upon vitamin D supplementation (Fig 4D).
D) Our data indicates that vitamin D deficiency leads to decrease in body adiposity. It is known that adipose tissue genes modulate visceral adiposity. Therefore, we studied the expression of genes involved in adipogenesis such as leptin (Lep), adiponectin (Adpn), fatty acid synthase (Fasn), peroxisome proliferator-activated receptor gamma (Pparγ), and the sterol regulatory element binding protein 2 (Srebp2), involved in cholesterol biosynthesis in the different experimental groups. Expression of the adipogenic genes Pparγ, Fasn and Lep was reduced in the vitamin D deficient group than control group (Fig 5A & B). Supplementation with vitamin D diet normalized the expression of these genes, while the high calcium rescue diet corrected their expression partially. On the other hand expression of Srebp2 and Adpn was not altered between the groups (Fig 5A&B). Expression of CaSR gene was reduced in the deficient group (Fig 5B) compared to control group. Interestingly, its expression was normalized in both the high calcium and vitamin D supplemented group. Hence, expression of genes involved in adipogenesis and CaSR was reduced in the vitamin D deficient WAT.
E) Vitamin D deficient rats consumed the same amount of food as vitamin D sufficient control rats, suggesting that energy expenditure but not energy intake is altered in these rats. Proteins involved in energy expenditure: uncoupling protein1 (Ucp1) and uncoupling protein2 (Ucp2) were studied. The p160 steroid receptor coactivator (SRC) proteins (SRC1, SRC2/TIF2; SRC3/AIB1) are known to be involved in energy metabolism. Therefore, we examined the expression of their mRNA levels in WAT.
Fig 4C Fig 4DFig 4B
Fig 5A Fig 5B
18

Ucp1 and Ucp2 genes were significantly up regulated in the deficient group than control group. Both supplementation with vitamin D and high calcium feeding normalized their expression (Fig 5C). Among the coactivator proteins only SRC3 gene expression was decreased in the deficient WAT, and this was reversed both by vitamin D supplementation and feeding high calcium diet (Fig 5D). Expression of Steap4 gene remained unaltered between groups (Fig 5C). Both supplementation with vitamin D and rescue with high calcium diet normalized the SRC3 protein levels to that of control group.
F) Adipose tissue from vitamin D deficient rats demonstrated altered oxidant status compared to controls. Lipid peroxidation was observed to be higher in the deficient adipose tissue compared to control tissue as measured by MDA levels (Fig 6A). There was no difference in the protein carbonyl levels between the groups (data not shown). Further the activities of the antioxidant enzymes superoxide dismutase (SOD), Catalase and glutathione reductase (GR) were higher in the deficient group in comparison to the controls (Fig 6B-D). All the oxidative stress parameters were found to be normalized upon supplementation either with vitamin D or high calcium.
Fig 5DFig 5C
Fig 6A
Fig 6C
Fig 6B
Fig 6D
19

CONCLUSION Vitamin D deficiency leads to a decrease in body weights and decrease in both visceral and total body fat. The decrease in fat content may be attributed to down regulation of adipogenic and coactivator genes. Further it also observed that vitamin D deficiency resulted in altered oxidant status in the adipose tissue, and these changes were corrected both by supplementation with vitamin D or high calcium alone. Our study suggests that maintaining optimum levels of vitamin D and calcium in the body are critical not only for good musculoskeletal health but also for normal adipose tissue function. In conclusion, our data indicates that reduced adiposity in a vitamin D deficient rat model is in part due to the secondary hypocalcaemia. Nevertheless, vitamin D and VDR also play an essential role in adipocyte biology.
3. AMINO ACID-METAL COMPLEXES AS MODEL FOR THE GLUCOSE TOLERANCE FACTOR (GTF) OF YEAST: HYPOGLYCAEMIC ACTIVITY AND THERAPEUTIC POTENTIAL IN DIABETES; SYNTHESIS, STRUCTURE AND MECHANISM OF ACTION IN YEAST AND ANIMALS
GTF an ill-defined Chromium containing complex with amino acids such as phenylalanine, glutamic acid, glycine, cysteine, and Nicotinic acid, plays a role similar to that of insulin in mammals. When added exogenously to Yeast cultures, it enhances the rate of glucose metabolism, making yeast a model organism to study biological role of Chromium. Many ambiguities regarding the actual structure,
+3nature of binding between AA to Cr and minimal ligand requirements regarding GTF still exist, since in the years after its discovery , several such complexes were isolated from varied sources with different AA ligands, but having similar activity. Attempts to synthesize soluble, stable chromium - Amino Acid complexes have failed to date. Most of the studies done included regular organic synthesis procedures, using high temperature, alkaline pH etc. Recently, a (D-Phe) Cr was synthesized and was shown to have 3.
GTF activity, but this too turned out to be insoluble. Present studies aim at understanding some of these aspects using Yeast (S. cerevisiae NCIM 3559) as a model organism for testing the effects of AA.Cr complexes on glucose uptake by yeast (including determination of initial kinetics of glucose utilization). Subsequently, those complexes which showed positive & negative results in the yeast were tested in animal models for their effects on OGTT. For this purpose a number of AA – Cr complexes were synthesized, purified and their physicochemical properties studied. Interestingly, similar activity and striking parallelism were found between the two systems in the effects of the AA – Cr complexes on glucose uptake / OGTT. These studies are the first of their kind and open a path for understanding the
+3biological role of Cr in Yeast and Animals.AIMS AND OBJECTIVES· Synthesize, purify and characterize AA - Cr complexes using minimal optimal conditions.· Screen synthetic AA – Cr complexes in the yeast (S cerevisiae) system to identify the most active ones
having GTF like activity and test the effects of these compounds with GTF like activity in the yeast system for their effects if any on the OGTT in rat models. Assess how their activity compares with that of isolated GTF from yeast and LMWCr.
· Examine the mechanism of action of different AA- Cr complexes found active in the yeast and experimental animals, especially those of relevance to known metabolic changes associated with glucose metabolism.
20

· Assess the possible role of additional ligands apart from Amino acids in complexes of the type (AA) nCr.x.
· Elucidate the structures and physico-chemical properties of different complexes synthesized and examine whether other AA - Cr complexes exhibit similar properties like those of AA – Cr complexes.
Work done during previous yearsA. Synthesis of Cr-(AA) complexes 3
Cr-(AA) complexes were synthesized by mixing aqueous solutions of 10mM CrCl .6H O ( 50 mL) and 3 3 2
30mM amino acid ( 50 mL ) and heating at 80°C and refluxing for 4 hours. The homogeneous green reaction mixture was freeze-dried and the greenish-violet solid obtained was washed with acetone and dried in a hot air oven. The synthetic protocol used was closer to that reported by Abdel-Monem et al. The effects of these Cr-(AA) complexes were evaluated in HS induced IR / impaired glucose tolerance in male 3
SD rats.B. Animals The animal experimental protocol was approved by the Institutional Animal Ethics Committee (IAEC) approval (IAEC No: P42/12-2011/MR) at the National Centre for Laboratory Animal Sciences (NCLAS), National Institute of Nutrition (NIN), Hyderabad and Committee for the Purpose of Control and Supervision of Experiments on Animals (CPCSEA) (Regd. No. 154/1999/CPCSEA) and the experiment was carried out as per the animal ethical norms. Two month old male SD rats (n=48) were obtained from NCLAS, NIN and housed individually in polypropylene cages with wire mesh bottom and
0maintained at 22 C±2, under standard lighting conditions (12- hour light or dark cycle). They had free access to water and food (control and high sucrose diet), whose composition is given in table 1. C. Control and high sucrose diets Synthetic diets were prepared as per American Institute of Nutrition (AIN)-93G recommendations. Control diet for the rats contained starch- (carbohydrate) 54.5%, casein- 25%, oil- 10%, cellulose- 5%, mineral mixture-4%, vitamin mixture-1%, L-cysteine-0.3%, and choline chloride-0.2%. The HS diet contained 54.5% sucrose instead of starch while the composition of the other ingredients remained the same (Table 1). D. Experimental design Rats were fed a rodent chow diet ad libitum, for one week initially. They were then randomly divided into six groups consisting 8 animals in each group. Group-C: fed control diet and DW. Group-S: fed HS diet and DW. Group-S : fed HS diet and DW containing Cr-D-(Phe) . Group-S : fed HS diet and DW containing 1 3 2
Cr-L-(Phe) . Group-S : fed HS diet and DW containing Cr-(Gly) Group-S : fed HS diet and DW containing Cr-3 3 3. 4
L-(Cys) . Based on the calculated water intake of the rats, Cr-(AA) complexes were administered through 3 3
drinking water to provide a dose of 45g/ kg body weight/ day. The daily dosage of Cr(III) to the rats was based on an earlier report on the beneficial effects of Cr(III)in a rat model. The drinking water containing the Cr-(AA) was freshly prepared every day. These animals were maintained on their respective diets for a 3
period of 12 weeks from the day of HS feeding and Cr-(AA) complex supplementation.3
E. Fasting glucose, Insulin, oral glucose tolerance and insulin resistance Body weights of the animals were measured at the beginning and end of experimental period. The
Ingredients Control diet (g/kg)
Sucrose diet (g/kg)
Casein 250 250Starch 545 0Oil 100 100Cellulose 50 50Sucrose 0 545L-cysteine 3 3Choline chloride 2 2
Mineral mix1 40 40Vitamin mix2 10 10
Table 1. Composition of the diets used in the experiments
21

experimental animals and their controls were subjected to the oral glucose tolerance test (OGTT) after an overnight / 12-h fasting and collection of a blood sample from retro orbital sinus. Without delay, a glucose solution (40% in DW) was administered through a gastric gavage at a dose of 2.5g/kg body weight. Three more blood samples were collected at 30, 60,120 minutes after glucose administration. All blood samples were collected in 2 ml centrifuge tubes containing 2% sodium fluoride (100l/ml of blood) and kept on ice
0till centrifugation. From the whole blood, plasma was separated and stored at -20 C until further use. Blood glucose concentrations were measured using a glucometer (Rite Check Blood Glucose Monitoring System, OK Biotech Co, Ltd., Taiwan) and plasma insulin concentration was measured using the Radio Immuno Assay (RIA) kit purchased from BRIT Mumbai, India. The area under the curve (AUC) of glucose and insulin during OGTT were computed by the trapezoidal method. The indices of IR such as Homeostasis Model Assessment of IR (HOMA-IR) index and the ratio of glucose AUC to insulin AUC during OGTT were computed as described by us earlier.F. Biochemical measurements Plasma triglycerides, total cholesterol, and HDL- cholesterol levels were measured using commercially available enzyme based assay kits (Biosystems, Barcelona, Spain).G. Sample collection At the end of the experimental period the animals were fasted overnight and sacrificed by cervical decapitation. Liver and skeletal muscle (Gastrocnemius) were excised quickly and frozen immediately in
0liquid nitrogen, and stored at -80 C until used.H. Oxidative stress and antioxidant defence markers Liver was weighed, minced and homogenized (10%w/v) in 50mM phosphate buffer (pH 7). The
0homogenate was centrifuged at 1000xg for 20min at 4 C and a portion of supernatant was used for the estimation of lipid peroxidation [Thiobarbituric acid reactive substances (TBARS)] & protein carbonyls using standard methods. The remaining supernatant was further centrifuged at 12,000x g for 20min at
04 C to obtain the post-mitochondrial supernatant, which was used for the estimation of reduced glutathione and to determine the activities of antioxidant enzymes: Catalase, Superoxide dismutase (SOD) and Glutathione peroxidase (Gpx).I. SDS- PAGE and Western blotting Skeletal muscle was homogenised in Radioimmunoprecipitation Assay (RIPA) buffer (150mM NaCl, 0.5% sodium deoxycholate, 1% NP-40, 0.1% SDS and 50mM Tris, pH 7.2) containing 1M phenylmethane-sulfonylfluoride (PMSF) and 1:100 dilutions of protease inhibitor cocktail. The homogenate was
0centrifuged at 15,000 x g for 15 min at 4 C, the supernatant was collected and its protein concentration determined by bicinchoninic acid (BCA) method. Equivalent amounts of proteins were boiled in Laemmli sample buffer, resolved on a 10% polyacrylamide gel and transferred to a nitrocellulose membrane. Membranes were incubated with appropriately diluted primary antibody for IRS-1 (1:2000), GLUT-4 (1: 1000), Akt (1:1000) and pAkt (1:500) in blocking buffer followed by incubation with horseradish peroxidase coupled secondary antibodies. Immunoreactive bands were visualized using chemilumine-scense reagents (Bio-Rad, CA, USA). The band intensity was measured with a scanning densitometer coupled with Bio-Rad PC analysis software.J. Statistical analysis The differences among different groups in various parameters was analysed by one-way analysis of variance (ANOVA) using SPSS statistics package (version 17.0) followed by posthoc least significant diffence test (LSD). A probability value of p 0.05 was considered to indicate the significance of the ratio and significant difference between means of different groups. All the results are reported as mean SEM.RESULTS A. Characterization of Cr-(AA) complexes 3
Purified Cr-(AA) complexes were characterized by using following methods. UV-Visible spectra 3
22
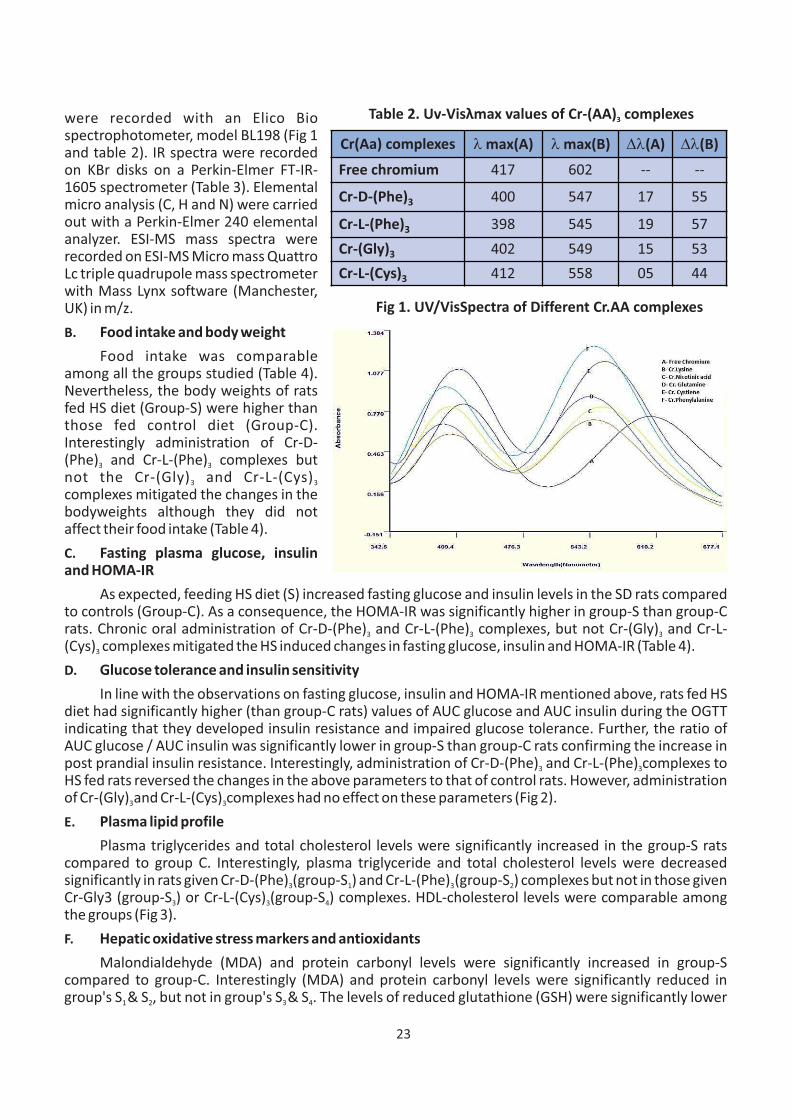
were recorded with an Elico Bio spectrophotometer, model BL198 (Fig 1 and table 2). IR spectra were recorded on KBr disks on a Perkin-Elmer FT-IR-1605 spectrometer (Table 3). Elemental micro analysis (C, H and N) were carried out with a Perkin-Elmer 240 elemental analyzer. ESI-MS mass spectra were recorded on ESI-MS Micro mass Quattro Lc triple quadrupole mass spectrometer with Mass Lynx software (Manchester, UK) in m/z.B. Food intake and body weight Food intake was comparable among all the groups studied (Table 4). Nevertheless, the body weights of rats fed HS diet (Group-S) were higher than those fed control diet (Group-C). Interestingly administration of Cr-D-(Phe) and Cr-L-(Phe) complexes but 3 3
not the Cr-(Gly) and Cr-L-(Cys) 3 3
complexes mitigated the changes in the bodyweights although they did not affect their food intake (Table 4).C. Fasting plasma glucose, insulin and HOMA-IR As expected, feeding HS diet (S) increased fasting glucose and insulin levels in the SD rats compared to controls (Group-C). As a consequence, the HOMA-IR was significantly higher in group-S than group-C rats. Chronic oral administration of Cr-D-(Phe) and Cr-L-(Phe) complexes, but not Cr-(Gly) and Cr-L-3 3 3
(Cys) complexes mitigated the HS induced changes in fasting glucose, insulin and HOMA-IR (Table 4). 3
D. Glucose tolerance and insulin sensitivity In line with the observations on fasting glucose, insulin and HOMA-IR mentioned above, rats fed HS diet had significantly higher (than group-C rats) values of AUC glucose and AUC insulin during the OGTT indicating that they developed insulin resistance and impaired glucose tolerance. Further, the ratio of AUC glucose / AUC insulin was significantly lower in group-S than group-C rats confirming the increase in post prandial insulin resistance. Interestingly, administration of Cr-D-(Phe) and Cr-L-(Phe) complexes to 3 3
HS fed rats reversed the changes in the above parameters to that of control rats. However, administration of Cr-(Gly) and Cr-L-(Cys) complexes had no effect on these parameters (Fig 2).3 3
E. Plasma lipid profile Plasma triglycerides and total cholesterol levels were significantly increased in the group-S rats compared to group C. Interestingly, plasma triglyceride and total cholesterol levels were decreased significantly in rats given Cr-D-(Phe) (group-S ) and Cr-L-(Phe) (group-S ) complexes but not in those given 3 1 3 2
Cr-Gly3 (group-S ) or Cr-L-(Cys) (group-S ) complexes. HDL-cholesterol levels were comparable among 3 3 4
the groups (Fig 3).F. Hepatic oxidative stress markers and antioxidants Malondialdehyde (MDA) and protein carbonyl levels were significantly increased in group-S compared to group-C. Interestingly (MDA) and protein carbonyl levels were significantly reduced in group's S & S , but not in group's S & S . The levels of reduced glutathione (GSH) were significantly lower 1 2 3 4
Table 2. Uv-Visλmax values of Cr-(AA) complexes3
Cr(Aa) complexes l max(A) l max(B) Dl(A) Dl(B)
Free chromium 417 602 -- --
Cr-D-(Phe)3 400 547 17 55
Cr-L-(Phe)3 398 545 19 57Cr-(Gly)3 402 549 15 53Cr-L-(Cys)3 412 558 05 44
Fig 1. UV/VisSpectra of Different Cr.AA complexes
23

-1Table 3. FTIR spectra of Cr(AA) complexes (strong peaks) in cm3
Cr.AA ComplexesN-H
(3400-3250)
C-H (3100-2700)
C=O (1760-1600)
C-O (1350-1000)
C-N (1280-1050)
Cr-O (540-450)
Cr-N (500-420)
S-H (1670-1500)
Free-(L)Phe alanine 3400 2875 1610 1315 1225 -- -- --Cr-(L)Phenylalanine 3407 2883 1615 1319 1261 458 453 ---Free-(D) Phenylalanine 3405 2875 1610 1317 1228 -- -- --Cr-(D)Phenylalanine 3410 2886 1620 1325 1267 460 455 --Free Cysteine 3380 2868 1625 1328 1250 -- -- 1584Cr-(L)Cysteine 3385 2871 1628 1336 1256 462 452 1588
In FTIR Cr-O, Cr-N Strong Peaks shows complex formation takesplace over the free chromium
Table. 4 Food intake, body weights, and levels of fasting glucose and insulin
Parameter C S S1 S2 S3 S4
Body weight (gms) 302 ±5.76a
337 ±8.25 b
305 ±9.28 a
302 ±4.17 a
338 ±7.53b
322 ±6.35 b
Food intake (g/day) 20.15 ±1.47
18.97 ±1.22
21.04 ±0.47
19.58 ±0.97
20.18 ±1.31
20.37 ±2.15
Fasting plasma glucose (mmol/L)
4.33 ±0.165a
6.11 ±0.142 b
4.51 ±0.175 a
4.57 ±0.214 a
5.67 ±0.358 b
5.97 ±0.435 b
Fasting plasma insulin (mU/ml)
66.16 ±9.2a
140.3 ±14.1 b
76.52 ±7.5 a
78.53 ±6.1 a
128.8 ±9.1b
138.5 ±7.14 b
Insulin sensitivity index (HOMA-IR)
12.73 ±0.71a
38.09 ±4.17 b
15.33 ±0.79 a
15.95 ±0.57 a
32.45 ±2.47 b
34.37 ±2.69 b
HOMA-IR: Homeostasis model of assessment for insulin resistance was calculated as fasting plasma insulin (U/ml) x fasting plasma glucose (mmol/l)/ 22.5. Values are mean ± S.E.M. (n=8), values in a row bearing different superscripts are different (p 0.05) from one another by one way ANOVA followed by post hoc least significant difference (LSD) test.
Fig 2
24

in group-S compared to group-C. However the levels of GSH were significantly higher in group's S & S , but 1 2
not in groups S & S . The levels of antioxidant enzymes, superoxide dismutase (SOD), glutathione 3 4
peroxidase (GPx), glutathione reductase (GR), glutathione-S-transferase (GST) and catalase (CAT) were significantly decreased in group-S compared to group-C. Interestingly, the changes in the activities of the antioxidant enzymes induced by feeding HS diet were significantly increased in group's S & S , but not in 1 2
group's S & S (Table 5).3 4
Fig 3
Table 5. Effect of Cr-AA complexes on hepatic oxidative stress markers and antioxidants
A- Amount of enzyme which gave 50% inhibition of pyrogallol autooxidation / min; B-g of GSH consumed / min; C-mol of NADPH oxidized / min; D- mmol of H O decomposed/min; Emol of GSH-CDNB conjugate formed/min. Values are mean ± S.E.M. (n=8), 2 2
values in a row bearing different superscripts are different (p 0.05) from one another by one way ANOVA followed by post hoc least significant difference (LSD) test.
Parameter C S S1 S2 S3 S4
MDA(nmol /mg protein)
0.571±0.025 a
1.42 ±0.043 b
0.346 ±0.043a
0.392 ±0.062 a
1.24 ±0.025 b
1.37 ±0.034 b
protein carbonyls(umol/mg protein)
1.79 ±0.21 a
2.61 ±0.21 b
1.42 ±0.16 a
1.38 ±0.17 a
2.63 ±0.31 b
2.54 ±0.35 b
Reduced glutathione (GSH)(mg/mg protein)
4.92 ±0.38 a
3.92 ±0.19 b
4.75 ±0.18 a
4.87 ±0.24 a
4.07 ±0.14 b
3.97 ±0.31 b
superoxide dismutase (SOD)(UA/mg protein)
49.14 ±1.43 a
39.54 ±0.84 b
49.61 ±2.35 a
48.41 ±1.32 a
40.17 ±0.47 b
41.17 ±0.25 b
glutathione peroxidase(UB/mg protein)
7.56 ±0.34 a
6.02 ±0.34 b
7.48 ±0.85 a
7.68 ±0.31 a
5.78 ±0.17 b
6.12 ±0.24 b
Glutathione reductase(UC/mg protein)
41.35 ±0.84 a
28.42 ±0.76 b
39.34 ±0.93 a
41.57 ±0.57 a
42.61 ±0.34 b
41.82 ±0.54 b
Catalase(UD/mg protein)
65.46 ±1.28 a
52.04 ±1.58 b
63.59 ±2.65 a
67.72 ±1.57 a
41.07 ±0.98 b
49.07 ±0.98 b
glutathione -s-transferase(UE/mg protein)
738.58 ±13.65 a
609.57 ±17.45 b
732.54 ±14.57 a
723.5 ±17.56 a
643.17 ±18.20 b
621.57 ±17.37 b
25

Fig 4
A B
A. Skeletal muscle insulin signaling The expression of IRS-1, pAkt and GLUT- 4 were significantly lower in group-S compared to group-C. Interestingly these changes were mitigated in group's S & S , but not in group's S & S rats. The amount of 1 2 3 4
IRS1, phosphorylated Akt (pAkt) and GLUT-4 (translocated to membrane) were significantly higher in skeletal muscles of group's S & S , but not in group's S & S (Fig 4).1 2 3 4
4. MOLECULAR BASIS OF MATERNAL VITAMIN B12 RESTRICTION INDUCED CHANGES IN THE C57BL/6 MOUSE OFFSPRING: ROLE OF EPIGENETICS
Vitamin deficiencies are common during pregnancy/ lactation and maternal vitamin deficiencies are associated with low birth weight and increased rate of perinatal morbidity and mortality. Interestingly further, prevalence of low birth weight in developing countries varies from 13% to 30%. Vitamin B12 deficiency along with associated hyper-homocysteinemia is largely prevalent in developing countries like India, Bangladesh etc. Also, metabolic syndrome, a cluster of cardiovascular risk factors such as diabetes, hypertension and obesity, has emerged one of the major health problems in developing countries like India. The fact that in patients with metabolic syndrome, folate and vitamin B12 treatment improves insulin sensitivity and endothelial function, in addition to decreasing homocysteine levels, suggests their importance to the metabolic syndrome.
DNA methylation, an epigenetic phenomenon, is suggested to be a mechanism by which maternal nutrients affect the phenotype of their offspring in the agouti mouse model. Vitamin B12 is required for the synthesis of methionine required for the maintenance of methylation patterns in DNA that determine gene expression. Deficiency in vitamin B12, therefore, can lead to: (a) altered methylation of DNA, and (b) an increased homocysteine level, an important and independent risk factor for cardiovascular disease. These defects may play an important role in developmental and neurological abnormalities.
26

Through fetal programming, maternal vitamin B12 deficiency significantly alters body composition, lipid profile, adipocytokine levels, increase insulin secretion, impair glucose tolerance, alter lipid and carbohydrate metabolism. However, we could not decipher the underlying epigenetic changes in the rat model due to low abundance of CpG islands in the rat genome. Therefore in the present study, we have used C57BL/6 mouse model as (i) mouse genome is rich in CpG islands and is thus suitable to study methylation patterns and (ii) mouse genome has 99% sequence homology with humans making it a better model to correlate with the human population.
Considering that (i) epigenetic changes are proposed to be the mechanism(s) by which nutrients modulate gene expression, and (ii) deficiency of vitamin B12 (which regulate one carbon metabolism including DNA methylation) is common among Indian mothers, it was considered important to decipher the epigenetic mechanisms underlying the modulation of adiposity and insulin response to glucose challenge in the offspring of vitamin B12 deficient mothers. This is expected to help us elucidate the epigenetic mechanisms underlying the above findings.
OBJECTIVESa) To create a mouse model of vitamin B12 restriction to resemble the closest to the Indian pregnant
mothers receiving Iron - folate supplements but not vitamin B12. b) Determination of vitamin B12 status. c) Assess changes in body composition (adiposity) and glycemic/insulin status induced by vitamin B12
restriction in C57BL/6 mice dams and their offspring.d) Determine the effect of maternal vitamin B12 restriction on the expression of specific markers/genes
associated with differentiation and development of neural, muscular, pancreatic, liver and adipose tissues in the offspring using immunohistochemical assessment of marker expression.
e) Determine epigenetic changes [changes in DNA methylation and acetylation / methylation of histones of the affected genes] in fetus / different tissues of adult offspring.
f) Evaluate whether or not vitamin B12 restriction induced changes are associated with glucocorticoid &/or oxidative stress (due to associated mitochondrial dysfunction)
WORK DONE DURING THE YEARGene expression microarray
Genome-wide gene expression studies were carried out in different brain regions of F1 generation mice using Illumina mouseref-8 v2.0 expression beadchip to evaluate the effect of maternal vitamin B12 restriction on brain of offspring. The experimental process involves labeling RNA and hybridizing this to the probes on a chip. The scanned intensities from these probes provide a snapshot of transcript abundance in a particular sample. Comparing the intensities obtained from different RNA species provide insight into the molecular pathways regulating the system under investigation. Data was obtained using Genome Studio Software.RESULTSThe genome - wide gene expression studies revealed 143 and 131 differentially regulated genes in the prefrontal cortex and hippocampus respectively. Our initial analysis of the microarray data suggests altered MAPK and Calcium signalling pathways in brain.
Work to be done Detailed analysis of the data obtained from genome-wide gene expression studies is in progress.
27

Annexure-1
Heatmap of differentially regulated genes in prefrontal cortex
Control
Control
Vit.B12 deficient
Vit.B12 deficient
Heatmap of differentially regulated genes in Hippocampus
28

5. STATUS OF VITAMIN B AND FOLATE AMONG DIFFERENT ADULT GROUPS: 12
DIETARY INTAKE AND PLASMA LEVELS
Micronutrients, vitamin B (B12) and folate (FA), play a vital role in various biological functions and 12
have implications for the regulation of various metabolic processes in the body. B12 is naturally available for human use only through ingestion of animal proteins, such as beef, poultry, fish, eggs, and dairy products. FA is present in both animal and plant sources like liver, egg yolk, legumes, and green leafy vegetables. Methylation of homocysteine (Hcys) to methionine and the synthesis of S-adenosylmethionine require these vitamins. FA encompasses many methylation reactions comprising DNA, proteins, phospholipids, and neurotransmitter metabolism. B12 and FA have overlapping biological functions such as synthesis of red blood cells, DNA, and are essential for normal myelin sheath that growth and development. Deficiency of these vitamins can lead to a broad spectrum of neuropsychiatric disorders that affect all age groups and that can often be reversed by early diagnosis and prompt treatment. Deficiency of B12 and FA increases the plasma concentration of Hcys, which is not only a risk factor for cardiovascular disease but also the cause of megaloblastic anemia, macrocytosis and cognitive impairment in the elderly. Both these vitamins are assessed together as they are involved in some common metabolic pathways; particularly there is an interrelationship between FA, B12 and methionine metabolism.
Although deficiency of these two vitamins can occur primarily as a result of insufficient dietary intake or poor absorption, various other factors such as socio-cultural, gender, age, genetic and ethnic backgrounds are likely to influence their status. Deficiency of B12 and FA, as assessed by the blood status, has been reported across population groups and in different stages of development in both developed and developing countries. In the global scenario, B12 and FA deficiencies have been associated with increased prevalence of metabolic complications such as diabetes mellitus, vascular diseases, neural tube defects, cardiovascular diseases, stroke, various cancers and age-related macular degeneration.
In the Indian context, the majority of the studies related to B12 and FA deficiencies are mainly focused on some categories of the population such as elderly people, children, and pregnant women. As a result, the apparently healthy population is seldom screened for B12 and FA concentrations.
Considering its contribution towards many metabolic disorders, the status of B12 and FA concerning the age and gender is critical. Studies on comparative analysis of the same across different age groups are meager in India. In a different context, while assessing the status of B12 and Hcys in diabetic retinopathy, we found that the prevalence of B12 deficiency was 41%, but FA status was normal among healthy, non-diabetic middle-aged urban population with a mean age of 54 years which prompted us to take up this study. Hence, in this study, we determined the prevalence of B12 and FA deficiency in the general population and enumerated the dietary intake of these nutrients and its association with the plasma concentration.
METHODOLOGY
Study design, subjects and sample collection: A community-based cross-sectional study was conducted predominantly in an urban setup. Six wards were randomly selected to capture the entire population from both Hyderabad city and Khammam town. The study was approved by the Institutional Ethics Committee of National Institute of Nutrition. After obtaining written consent from all participants, venous blood samples were collected in heparin and EDTA tubes in the morning following an overnight fast. The plasma was collected by centrifugation. The study population included 630 subjects: 347 men and 283 women aged 21-85 years, stratified into three age groups: 21-40, 41-60 and >60 years (elderly). Within the age groups, the distribution of men and women was approximately same. Apparently healthy subjects were recruited and those taking multivitamin supplements for the last six months or suffering from severe metabolic complications or having a history of surgical operation of the gastrointestinal tract
29
or suffering from acute illness at the time of enrollment were excluded. History of diabetes or any other complication such as hypertension was also noted down. The body weight (to the nearest 0.1 kg) and height (to the nearest 0.1 cm) were recorded using SECA weighing scale and anthropometric rod
2respectively. Body mass index (BMI) was calculated using the formula weight in kgs/height in m .
Biochemical estimations: Fasting blood sugar (FBS), glycosylated hemoglobin (HbA1c), hemoglobin (Hb) and lipid profile were analyzed using commercially available kits. Plasma concentration of B12 and FA was determined by RIA method using a dual count solid phase no boil RIA kit designed for simultaneous measurements of these vitamins. The plasma concentration of B12 below 203 pg/mL and FA below 3 ng/mL was considered deficient. Plasma total Hcys was determined by employing a special reversed phase column for separating the analytes, supplied in the commercially available HPLC kit.
Nutritional assessment: Dietary intake was assessed in a sub-sample (n=276, 127 men, and 147 women) using systematic random sampling procedure. It was done by conducting a three-day 24-h recall method (2 non-consecutive weekdays and one weekend day) to capture intra and inter-individual variation, and average nutrient intake was calculated. The nutritive values were taken as given in the Nutritive Value of Indian Foods (NVIF) and NNMB (National Nutrition Monitoring Bureau ) database, whereas USDA (United States Department of Agriculture) food and nutrient database was used for those foods that did not have a nutrient value in NVIF. To ensure minimum variation between the Indian and the USDA database, the nutritive values of some common foods after correction for moisture values were compared, and the variations were found to be comparable in the range of 10-20%. The total daily consumption was computed based upon the above nutritive value database. Lacto-vegetarians were placed in the vegetarian group whereas ovo-vegetarians and non-vegetarians were placed under the mixed diet group.
Statistical analysis: Median and interquartile ranges were calculated for skewed data and comparisons for the same were carried out by Kruskal–Wallis test. Mean and SE values of variables were calculated for normally distributed data. Comparison of mean values of these variables across the age groups was done
2by one-way ANOVA F-test with Post Hoc test of Tukey's multiple comparisons. The Chi-square (χ ) test was used for comparison of the prevalence of B12 and FA deficiency. The relationship between plasma B12 and FA with dietary B12 and FA was analyzed by Spearman rank correlation coefficients. Linear regression was applied to examine the association between FA and B12 with Hcys. The level of significance was considered at p < 0.05.
RESULTS
· The characteristics of the subjects are shown in table 1. The gender distribution was almost the same in all the age groups. Though the mean values were statistically different, BMI and Hb were comparable among the age groups. While the FBS was significantly higher in the 41-60 and >60 age groups when compared to the 21-40 age group, the HbA1c was higher in the >60 group when compared to the 21-40 and 41-60 age groups. However, plasma TC, TG and low-density lipoprotein (LDL) were significantly higher in the 41-60 and >60 age groups when compared to the younger (21-40) group; HDL was comparable among the age groups. The overall prevalence of anemia was found to be 28 %: the prevalence being higher (34%) in the 41-60 age group compared to the 21-40 (24%) and 41-60 (27%) age groups.
· Median plasma FA concentrations were not significant among the age groups (Table 2). The overall prevalence of FA deficiency was found to be 12%. However, the prevalence of FA deficiency (below 3 ng/mL) was significantly higher in the >60 (18%) and 41-60 (10%) age groups compared with the 21-40 age group (5%) (Fig. 1A).
· The overall prevalence of B12 deficiency was found to be 35% (Fig. 1B), which is higher when compared to the FA deficiency. Interestingly, median B12 concentrations of the 21-40 and 41-60 age groups were significantly different from the >60 age group (Table 2). In concurrence with the (median) plasma data, the prevalence of B12 deficiency (below 203 pg/mL) was significantly higher in the 21-40 (44%) and 41-60 (40%) age groups when compared to the >60 age group (30%) (Fig. 1B). While the
30

Table 1. Clinical and demographic profile of study subjects
Parameter
21-40 age group
(n=240)Mean
S.E
41-60 age group
(n=184)Mean
S.E
>60 age group
(n=206)Mean
S.E F value p value
Height (cm) 163.38a 0.91 161.28a 0.59 160.0b 0.65 5.12 0.006Weight (kg) 64.62a 0.84 65.97a 0.87 64.34a 0.81 0.957 0.385BMI (kg/m2) 23.97a 0.28 25.26b 0.34 25.21b 0.27 6.37 0.002Hb (g/dL) 13.44ab 0.13 13.03a 0.15 13.54b 0.15 2.93 0.054FBS (mg/dL) 96.08a 1.24 118.25b 3.62 118.09b 2.81 28.50 0.000HbA1c (%) 6.29a 0.11 6.27a 0.1 7.18b 0.11 21.68 0.000TC (mg/dL) 151.13a 2.37 173.96b 2.86 173.14b 2.74 25.50 0.000TG (mg/dL) 94.7a 4.83 108.43b 4.62 108.43b 4.57 2.98 0.051HDL (mg/dL) 47.96a 1.6 41.26a 1.0 45.10a 1.38 0.70 0.493LDL (mg/dL) 97.27a 2.23 116.09b 5.82 110.69b 2.45 7.51 0.001
Plasma FA (ng/mL) 6.3a 0.2 6.9a 0.26 6.5a 0.29 1.036 0.355
Plasma B12 (pg/mL) 258 a 10.7 296a 13.7 365b 16.2 16.6 0.000
Dietary FA (µg/day)
163.1a
(n=97) 6.2 167.7a
(n=99) 5.4 173.5a
(n=80) 6.6 0.576 0.631
Dietary B12 (µg/day)
1.31a
(n=97) 0.3 1.12a
(n=99) 0.42 0.73a
(n=80) 0.05 1.090 0.353
Hcys (µmol/L) 17.4 a
(n=89) 1.3 16.1 a
(n=64) 0.9 18.0 a
(n=73) 1.4 1.321 0.269
Values are mean and SE. Mean values across age groups were compared by one-way ANOVA 'F' test with post hoc test of Tukey's multiple comparisons. Significant differences (p < 0.05) of mean values among the age groups are indicated by different superscript letters (a, b).
Table 2. Plasma concentration and dietary intake of FA and B12
Values represent median and interquartile range (IQR). Significant differences (p < 0.05) of median values among the age groups are indicated by different superscript letters (a, b).
Age groups
Plasma concentration Dietary intakeFA (ng/mL)
Median IQRB12 (pg/mL)Median IQR
FA (µg/day)Median IQR
B12 (µg/day)Median IQR
21-40 5.6a 4.1-7.2 220a 150-320 154.2a 116.9-201.0 0.7a 0.4-1.1
41-60 6.0a 4.3-8.6 250a 160-380 162.2a 130.5-198.6 0.5a 0.3-0.7>60 5.2a 3.4-8.4 300b 197-455 167.4a 127.5-217.0 0.5a 0.4-0.8
p value 0.106 0.001 0.528 0.187
31

Age groups21-40 41-60 >60 Pooled
Prev
alen
ce o
f FA
def
icie
ncy
(%)
0
4
8
12
16
20
24
a
b
c
4.4
9.5
18
11.6
Def
icie
ncy
(%)
0
4
8
12
16
a a
11.8 11.4
A
Age groups21-40 41-60 >60 Pooled
Prev
alen
ce o
f B12
def
icie
ncy
(%)
0
10
20
30
40
50
60
44.6 38.7 27.9 33.7
a
a
b
Def
icie
ncy
(%)
0
10
20
30
40
50
MenMenWomen Women
44 29
a
b
overall prevalence of B12 deficiency was significantly higher in men (44%) than women (29%) (Fig. 1B), FA deficiency was comparable between the genders (Fig. 1A). After adjusting the BMI, Hb, lipid profile, the relationship between B12 and FA with age was unchanged.
· Irrespective of age and gender, as envisaged, the B12 deficiency was higher in the vegetarians (54%) than the subjects consuming the mixed diet (31%) and the reverse was the case with FA, where the deficiency was higher in the mixed diet group (12%) than the vegetarians (3%). Even amongst the vegetarians and mixed diet group, the B12 deficiency was higher in men than women (70 vs. 43% and 38 vs. 24%) despite the higher dietary intake in men.
· However, it should be noted that the concentration of plasma B12 between 203 to 350 pg/mL accompanied by elevated plasma Hcys concentration (>12µmol/L) was considered as borderline deficiency of B12. Therefore, the concentration of Hcys in the samples to confirm borderline deficiency of B12 was also analyzed. While the overall prevalence of borderline B12 deficiency was found to be 36%, there is no significant difference among the three age groups (Table 3). The mean plasma Hcys concentration in the borderline B12 deficiency subjects is shown in Table 1 and as expected the prevalence of hyperhomocysteinemia (HHcys) (>12 nmol/L) was about 75% in these subjects (Table 3). Further, the correlation of Hcys with the corresponding B12 and FA levels was examined. There was an inverse relationship between B12 (r=0.199, p=0.00) and FA (r=0.304, p= 0.00) with Hcys.
Table 3. Percentage of HHcys in borderline B12 deficiency subjects
Parameter 21-40 age group(n=89)
41-60 age group(n=64)
>60 age group(n=73)
Pooled(n=226)
Borderline deficiency of B12 (%) 37.1a 35.0a 35.4a 35.9
HHcys (%) 80.9a 67.8a 79.2a 75.3
Pooled data represent the total number of borderline B12 deficiency samples (n= 226). Data represent % and significant differences (p < 0.05) among the age groups are indicated by superscript letters ( ).a
Fig 1. Prevalence of FA (Panel A) and B12 deficiency (Panel B) among the different age groups. Pooled data represent the total number of samples (n= 630). Data represent % deficiency, and significant differences (p < 0.05) of mean values among the age groups are indicated by letters (a, b, c) above the bars. Inset in Panel A and B shows the prevalence of respective vitamin deficiency between men and women.
B
32

Age groups21-40 41-60 >60 Pooled
FA(µ
g/da
y)
0
50
100
150
200
250Vegetarian Mixed diet
a
ba
b
a
aa
a
Age groups21-40 41-60 >60 Pooled
B12(
µg/d
ay)
0.0
0.5
1.0
1.5
2.0
2.5Vegetarian Mixed diet
a
a
a
b
a
a a
b
Men Women Pooled
B12
(µg/
day)
0.0
0.4
0.8
1.2
1.6
2.0Vegetarian Mixed diet
a a
a
a
b
b
Men Women Pooled
FA(µ
g/da
y)
0
50
100
150
200
250Vegetarian Mixed diet a
aa
a
a
a
A B
· There was no significant difference in the median dietary intake of FA and B12 among the age groups as assessed by a three-day 24-h dietary recall method (Table 2). However, 66% of the study population with respect to FA and only 40% of the study population with respect to B12 was meeting 70% RDA. The dietary intake of FA with respect to vegetarians and mixed diet was significantly different in the 21-40 and 41-60 age groups whereas no significant difference was observed in the >60 age group and also in the pooled group (Fig. 2A). In the case of B12, the dietary intake with respect to the vegetarian and mixed diet group was significantly different in the 41-60 age group and the pooled group but a trend was observed in the 21-40 age group (Fig. 2B). While no significant difference was found in dietary intake of FA between the genders with the vegetarian and mixed diet group (Fig. 3A), a significant difference in dietary intake of B12 was seen in men with the vegetarian and mixed diet group (Fig. 3B).
· While a significant correlation was found between the plasma status and the dietary intake of B12, the plasma status and the dietary intake of FA were not correlated. There was an association between the plasma B12 and the plasma FA. Further, there was also a significant correlation between the dietary FA and the dietary B12. BMI and Hb showed a significant but inverse correlation with the B12 (p<0.01). FBS significantly associated with the B12. Hb correlated with plasma FA concentrations. Significant correlation was found between the plasma B12 and FA.
Fig 2. Dietary intakes of FA (Panel A) and B12 (Panel B) among the age groups with different food habits. Data represent mean ± SE. Mean values across the age groups were compared by one-way ANOVA 'F' test with LSD. Significant differences (p < 0.05) of mean values among the age groups are indicated by letters (a & b) above the bars.
Fig 3. Dietary intakes of FA (Panel A) and B12 (Panel B) between the genders with different food habits. Data represent mean ± SE. Mean values across age groups were compared by one-way ANOVA 'F' test with LSD. Significant differences (p < 0.05) of mean values among the age groups are indicated by letters (a & b) above the bars.
A B
33

6. DEVELOPMENT OF A RAW FOOD BASED QUANTITATIVE FOOD FREQUENCY QUESTIONNAIRE IN AN URBAN SET-UP
Dietary intake ranks the most important risk determinants of chronic diseases. The quantity and quality of foods play a key role in the development of many chronic diseases including diabetes mellitus. 24 hour dietary recall (24hR), Food Frequency Questionnaire (FFQ) and Food Diary are the most commonly used dietary assessment methods for epidemiological studies. Among these, 24hR and Food diary are targeted for shorter duration. 24hR will probe the dietary intake of the subject's immediate previous day. Food diary is a recorded list of food items consumed by the subject for a certain short period of time, usually, one week. The FFQ allows the estimation of the individual's habitual food intake pattern over a defined period of time. The FFQ is the most widely used and preferred dietary assessment tool in larger nutritional epidemiology studies, particularly for chronic lifestyle diseases including type 2 diabetes mellitus (T2DM) and cardiovascular diseases. The 24hR should be done multiple times across many time points so as to capture long-term food and nutrient intake and the Food diary is for a short period of time; whereas the FFQ could be used for long term dietary history. Quantitative food frequency questionnaires (QnFFQs) consist of a list of foods along with its weights or volumes and its consumption frequency over a defined period of time.
Distinct cultural and linguistic differences exist in India, so it is essential to develop and validate an appropriate FFQ suitable for the study purpose and setting. An urban population was taken into consideration as T2DM is frequently reported in urban area than the rural population. The dietary intake data is an essential part of nutrition surveillance systems for use in planning policies and strategies, and for monitoring and evaluation purposes. Many studies using validated FFQs had been done in the Europe and USA. The number of food items listed in the FFQ plays an important role in the estimation of nutrient intake. An FFQ with only a few foods leads to underestimation of nutrient intake; whereas an elaborate food list may lead to overestimation of nutrient intake. A well formulated FFQ should contain adequate number of foods which should yield a near to accurate picture of nutrient intake of the subjects. The list of food items in the FFQ should be framed as per the food preferences of the target population. The consumption of processed foods is also high by urban population.
SUMMARY
The findings of this study showed a higher prevalence of B12 deficiency in the apparently healthy individuals in an urban setup across the age groups. While the results are in concurrence with the studies that reported B12 status in different groups and under various conditions, at the same time, the findings indicate that factors other than dietary intake influence B12 deficiency. For example, the prevalence of deficiency in the younger adults is more than the elderly irrespective of similar dietary intake. Similarly, the prevalence of B12 deficiency was significantly higher in men than women. Even amongst the vegetarian and mixed diet groups, the B12 deficiency was higher in men than women despite the higher dietary intake in men. Most importantly, only 40% of the study population was meeting 70% RDA of B12. Though further studies are required to confirm or dispute these observations, this study highlights the need for routine screening for B12 status in the apparently normal adults and the need to evolve sustainable strategies to ensure adequate B12 intake so as to prevent the chronic complications associated with B12 deficiency.
34
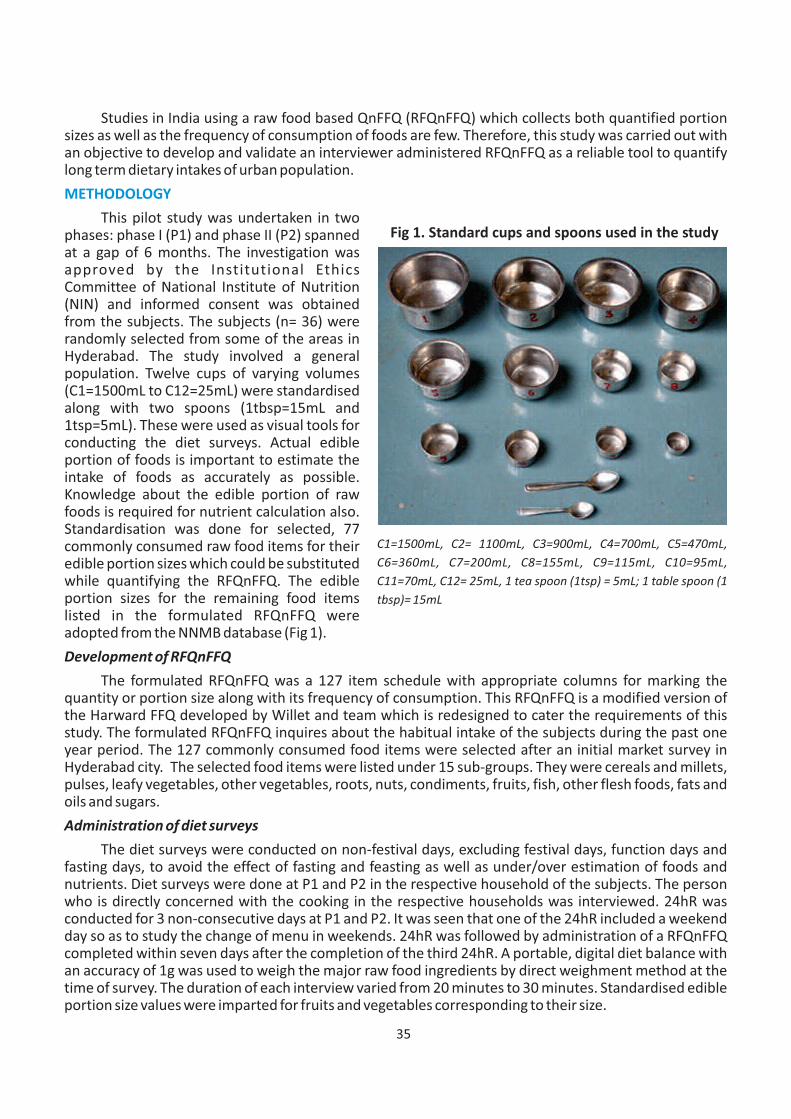
Studies in India using a raw food based QnFFQ (RFQnFFQ) which collects both quantified portion sizes as well as the frequency of consumption of foods are few. Therefore, this study was carried out with an objective to develop and validate an interviewer administered RFQnFFQ as a reliable tool to quantify long term dietary intakes of urban population. METHODOLOGY This pilot study was undertaken in two phases: phase I (P1) and phase II (P2) spanned at a gap of 6 months. The investigation was approved by the Institutional Ethics Committee of National Institute of Nutrition (NIN) and informed consent was obtained from the subjects. The subjects (n= 36) were randomly selected from some of the areas in Hyderabad. The study involved a general population. Twelve cups of varying volumes (C1=1500mL to C12=25mL) were standardised along with two spoons (1tbsp=15mL and 1tsp=5mL). These were used as visual tools for conducting the diet surveys. Actual edible portion of foods is important to estimate the intake of foods as accurately as possible. Knowledge about the edible portion of raw foods is required for nutrient calculation also. Standardisation was done for selected, 77 commonly consumed raw food items for their edible portion sizes which could be substituted while quantifying the RFQnFFQ. The edible portion sizes for the remaining food items listed in the formulated RFQnFFQ were adopted from the NNMB database (Fig 1). Development of RFQnFFQ The formulated RFQnFFQ was a 127 item schedule with appropriate columns for marking the quantity or portion size along with its frequency of consumption. This RFQnFFQ is a modified version of the Harward FFQ developed by Willet and team which is redesigned to cater the requirements of this study. The formulated RFQnFFQ inquires about the habitual intake of the subjects during the past one year period. The 127 commonly consumed food items were selected after an initial market survey in Hyderabad city. The selected food items were listed under 15 sub-groups. They were cereals and millets, pulses, leafy vegetables, other vegetables, roots, nuts, condiments, fruits, fish, other flesh foods, fats and oils and sugars.Administration of diet surveys The diet surveys were conducted on non-festival days, excluding festival days, function days and fasting days, to avoid the effect of fasting and feasting as well as under/over estimation of foods and nutrients. Diet surveys were done at P1 and P2 in the respective household of the subjects. The person who is directly concerned with the cooking in the respective households was interviewed. 24hR was conducted for 3 non-consecutive days at P1 and P2. It was seen that one of the 24hR included a weekend day so as to study the change of menu in weekends. 24hR was followed by administration of a RFQnFFQ completed within seven days after the completion of the third 24hR. A portable, digital diet balance with an accuracy of 1g was used to weigh the major raw food ingredients by direct weighment method at the time of survey. The duration of each interview varied from 20 minutes to 30 minutes. Standardised edible portion size values were imparted for fruits and vegetables corresponding to their size.
Fig 1. Standard cups and spoons used in the study
C1=1500mL, C2= 1100mL, C3=900mL, C4=700mL, C5=470mL, C6=360mL, C7=200mL, C8=155mL, C9=115mL, C10=95mL, C11=70mL, C12= 25mL, 1 tea spoon (1tsp) = 5mL; 1 table spoon (1 tbsp)= 15mL
35

Data entry and statistical analysis The filled up 24hR sheets and the RFQnFFQ were coded for each entry. Standard values for edible portion sizes were imputed wherever necessary and the data was entered in MS-EXCEL for statistical analyses. Weights of commonly consumed foods were assessed using the standardised set of cups and spoons. Edible portion sizes of 77 raw food items which were standardised prior to the pilot study were appropriately substituted. For ready- to- eat food items, standard portion size values were obtained from the labeling of the packet and also from the data available from the National Nutrition Monitoring Bureau (NNMB). Standardized reference values for edible portion sizes of commonly consumed raw foods were thus available and it was imputed in the RFQnFFQ at the time of data entry. For ready to eat foods (RTE) a separate data base was formulated along with codes based on the nutrition labeling of the pre-packed food items and also from the standardized recipes as reported earlier. The frequency categories were assigned as daily (1), twice a week (2/7), thrice a week (3/7), 4 times a week (4/7), once a week (1/7), once in a fortnight (1/15), once in a month(1/30), seasonally(1/120) and occasionally(1/180). Individual food and nutrient intake from the RFQnFFQ was calculated based on individual Consumption Unit (CU). Based on the food intake per day; energy and nutrient intakes of the subjects were calculated using the Indian food composition database. The formulated RFQnFFQ was statistically cross checked with the 24hR for testing the reliability of the RFQnFFQ. Median intakes for various foods and nutrients were calculated along with the intra quartile ranges (IQR) in 24hR and RFQnFFQs. Validity and reproducibility between 24hR and RFQnFFQs were evaluated using Spearman's rank correlation coefficient method. The reproducibility of the RFQnFFQ was checked by comparing the RFQnFFQs at P1 and P2 by Spearman's correlation. The validity of the RFQnFFQ was checked by comparing it with the mean of the three day 24hR for both phases of the study. The level of significance was considered at 0.05. RESULTS· The mean age of subjects was found to be 38 years. Majority of the subjects (57.6 %) were males and
42.4% were females. All the subjects belonged to the nuclear type of family. It was observed that the literacy level was high in the subjects and at least one person in the household was employed.
· Food and nutrient intake of the subjects: The food and nutrient intake of the subjects are presented as median and intra quartile range (IQR) values in the 3 seasons as well as for the baseline and final period. The median with IQR for intake of foods and nutrients is shown in Table 1. There was no significant difference (p<0.05) between baseline and final RFQnFFQ except for cereals and millets in food groups. Similarly, no significant difference (p<0.05) was observed between the methods for the given season except for fruits in season 1. However, there was significant difference (p<0.05) between baseline and final RFQnFFQ for fat, calcium, vitamin A, thiamine and riboflavin in nutrients. Within the seasons there was no significant difference (p<0.05) between the methods for nutrients.
· Validity of the RFQnFFQ: Validity of the RFQnFFQ was done to test the extent of accuracy of the nutritional assessment made by it in comparison with the 24hR. The validity of the RFQnFFQ was assessed by calculating the Spearman's rank correlation coefficient (r) (unadjusted) for the two time periods i.e., at P1 and P2. Table 2 shows the correlation coefficients between the RFQnFFQ and mean 24hR at P1 and P2. The r values for comparison between 24hR and RFQnFFQ at P1 and P2 were found to be significant for macronutrients like protein, fat; and micronutrients like calcium, phosphorus, thiamine, iron and folic acid (free) and also for the foods like cereals, pulses, roots, fats, milk and milk products and sugars.
· Reproducibility of the RFQnFFQ: The reproducibility was checked by comparing the RFQnFFQs at two time points: P1 and P2 using Spearman's rank correlation coefficient (ρ). Reproducibility of the formulated RFQnFFQ was checked for the food groups as well as nutrients. The RFQnFFQ which had been tested for reproducibility showed good correlation for almost of all the food groups and nutrients. The reproducibility of the RFQnFFQ is presented in Table 3 as ρ values. The ρ values of food groups ranged from 0.167 (nuts) to 0.928 (cereals and millets) and for nutrients ranged from 0.565 (vitamin A) to 0.960 (protein). The r values of all the nutrients were above 0.4. The ρ values for nutrients and foods to assess the reproducibility of the RFQnFFQs at P1 and P2 were found to be highly significant.
36

Table 1. Median (IQR) intake of foods and nutrients by the study subjects estimated by RFQnFFQ and 24hR at P1 and P2
P1 (N=36) P2 (N=33)24hR† RFQnFFQ 24hR†† RFQnFFQ
Energy (k cal) 1888 (1759, 2084) 2083 (1740, 2426) 1800 (1575, 2035) 2007 (1709, 2284)
Protein (g) 60 (53, 66) 67 (57,77) 53 (46, 60) 67 (57,76)Fat (g) 48 (42, 62) 54 (44, 64) 48 (41, 60) 51 (41, 58)
Calcium (mg) 817.6 (602.8, 1027.0)
913.5 (727.4, 1101.0)
808.5 (660.8, 917.1)
829.2 (697.8, 1048.3)
Phosphorus (mg) 1119.7(1012.0, 1448.2)
1366.8 (1141.9, 1592.0)
1104.5 (1015.6, 1293.4)
1413.2 (1153.4, 1701.5)
Vitamin A (µg) *# 324.5 (205.8, 501.3)
770.7 (664.0, 878.0)
336.3 (241.7, 531.3)
753.5 (662.3, 875.7)
Thiamine (mg) 0.9 (0.7, 1.0) 1.1 (0.9, 1.1) 0.9 (0.8, 1.2) 1.1 (1.0, 1.3)Riboflavin (mg) 0.8 (0.7,1.0) 0.8 (0.6, 1.0) 0.7 (0.7, 0.8) 0.9 (0.7, 1.0)Niacin (mg) 10.6 (8.6, 12.3) 11.9 (9.9, 14.0) 10.1(8.2, 13.5) 12.9 (10.8, 14.8)
Vitamin C (mg) 31.2 (61.6, 108.3) 117.1 (97.1,137.0) 52.4 (37.4, 104.6) 95.3 (82.7, 108.9)
Iron (mg) 10.9 (9.3,13.1) 14.4 (12.0, 16.0) 12.3 (9.1, 14.3) 14.8 (12.0, 17.5)Folic Acid (Free)(µg) *# 45.5 (34.2, 57.4) 77.7 (70.4, 86.0) 46.3 (39.4,54.2) 77.9 (65.9,86.8)
Cereals & Millets (g) 231 (200, 270) 263 (189, 336) 240 (201, 266) 259 (218, 298)
Pulses (g) 31 (25, 44) 48 ( 31, 63) 36 (14, 56) 50 (38, 62)Leafy vegetables (g) *# 8 (4, 26) 48 (37, 57) 22 (6,37) 45 (37, 49)
Other Vegetables (g) # 61 (31,111) 109 (86, 129) 37 (21, 56) 88 (78, 109)
Roots (g) * 43 (30, 54) 99 (67,132) 80 (55, 111) 83 (62, 107)Nuts (g) 12 (8, 33) 19 (8, 31) 12 (3, 25) 20 (12, 32)Condiments (g) 14 (12, 19) 15 (11, 21) 14 (11, 23) 17 (13, 23)Fruits (g) 34 (12,129) 106 (86,123) 38 (8, 66) 74 (55, 95)Flesh Foods (g) # 26 (17, 69) 49 (35, 58) 5 (3, 12) 49 (38, 60)
Milk & Milk products (mL / g) 183 (123, 332) 285 (185, 326) 195 (129, 291) 279 (177, 326)
Visible Fats (g) 21 (13, 38) 27 (19, 35) 20 (14, 23) 24 (21, 31)Sugars (g) 8 (3,18) 9 (2, 17) 10 (0, 26) 8 (0, 14)
Values expressed as Median (IQR), † - average of three 24hR at P1, †† - average of three 24hR at * - Significant difference (P<0.05) between RFQnFFQ and 24hR at P1 # - Significant difference, (P<0.05) between RFQnFFQ and 24hR at P2.
37

Table 2. Validity of the RFQnFFQ Table 3. Reproducibility of the RFQnFFQ
Nutrients r (P1) r (P2)Energy (kcal) 0.233 0.222Protein (g) 0.465a 0.364b
Fat (g) 0.142 0.484a
Calcium (mg) 0.623a 0.455a
Phosphorus (mg) 0.394b 0.350b
Vitamin A (µg) 0.015 0.366b
Thiamine (mg) 0.361a 0.398b
Riboflavin (mg) 0.325 0.108Niacin (mg) 0.161 0.305Vitamin C (mg) 0.059 0.306Iron (mg) 0.587a 0.516a
Folic Acid (free) (µg) 0.193 0.431b
Food GroupsCereals & Millets (g) 0.315 0.212Pulses (g) 0.566a 0.631a
Leafy vegetables (g) -0.176 -0.027Other Vegetables (g) 0.119 0.111Roots (g) 0.056 0.387b
Nuts (g) 0.309 0.087Fruits (g) 0.024 -0.498b
Flesh Foods (g) 0.208 0.067Milk & Milk products (g/mL) 0.564a 0.372b
Fats (g) 0.108 0.260Sugars (g) 0.363a 0.424b
Nutrient rEnergy (kcal)* 0.896Protein (g)* 0.960Fat (g)* 0.882Calcium(mg)* 0.902Phosphorus (mg)* 0.901Vitamin A (µg)* 0.565Thiamine (mg)* 0.920Riboflavin (mg)* 0.831Niacin (mg)* 0.931Vitamin C (mg)* 0.904Iron (mg)* 0.872Folic Acid (µg)* 0.902Folic Acid (free) (µg)* 0.894
Food GroupsCereals & Millets (g)* 0.928Pulses (g)* 0.894Leafy vegetables (g)NS 0.229Other Vegetables (g)* 0.826Roots (g)* 0.488Nuts (g)NS 0.167Fruits (g)* 0.707Fish (g)* 0.880Other Flesh Foods (g)* 0.920Milk & Milk products (g/mL)* 0.989Fats (g)* 0.502Sugars (g)* 0.650
® - Spearman's rank correlation between RFQnFFQ and mean 24hR at P1 and P2). a - Correlation is significant at the 0.01 level (2-tailed); b - Correlation is significant at the 0.05 level (2-tailed).
r - Spearman's correlation between RFQnFFQ at P1 and RFQnFFQ at P2 *- correlation is significant at p<0.01 NS- not significant
SUMMARY
This study observed that, the median intake of foods and nutrients by the subjects estimated from the RFQnFFQ and 24hR at P1 and P2 are comparable for most of the foods and nutrients. The tendency for overestimation of foods and nutrients in the RFQnFFQs than the 24hR might be because of the seasonal variations of food intakes. The over estimation of the dietary data could also be attributed by lower sample size. The reproducibility of the formulated RFQnFFQ also represents good response and better comprehensibility of the RFQnFFQ by the participants. From the study, it is concluded that the 127 item, RFQnFFQ is a valid tool in estimating the dietary intake of urban individuals. Based on the reproducibility and validation results of the RFQnFFQ, the formulated RFQnFFQ may be used for eliciting information on dietary data of chronic diseases. Since this RFQnFFQ is based on raw food items; it could also be used in other parts of India.
38

7. VALIDITY AND REPRODUCIBILITY OF A RAW FOOD BASED QUANTITATIVE FOOD FREQUENCY QUESTIONNAIRE (RFQNFFQ) ACROSS THREE SEASONS AMONG URBAN ADULTS
The quantity and quality of foods consumed over a period of time play a key role in the development of many chronic diseases such as type-2 diabetes mellitus (T2DM), CVD and cancer. A long term food and nutrient intake data is required for the assessment of nutritional status of the subjects with chronic diseases like T2DM. Food frequency questionnaires (FFQ) that provide habitual long-term food and nutrient intake data of the subjects are relatively inexpensive and hence, widely used in larger epidemiological studies. FFQ is a list of commonly consumed food items along with its frequency of consumption with or without its weights or volumes. Quantitative FFQ may be a better dietary tool as it envelopes the consumption frequency along with the corresponding portion quantity. However, FFQ is prone to be influenced by the cultures and food habits of the target population. Further, the accuracy of dietary information obtained from FFQ may be lower and is likely to have the risk of bias. Hence, it is required that an FFQ should be validated against a known or standard tool like multiple 24-hour dietary recall (24hR) or food records and also needs to be tested for their reproducibility among the target population before using it in studies requiring a long-term food intake with limited resources. Further, executing multiple 24hR in an urban setting will be difficult, time consuming. Thus, instead of multiple 24hR, a validated FFQ (recipe based or raw food based) could be used as it is easy to administer with restricted resources, less time consuming and near to accurate. In case of recipe-based FFQ, type of recipes and the consistency of cooked foods might vary across the individuals, households and regions due to food preferences and religious beliefs/practises. Further, the ingredients in a recipe may vary from season to season based on their availability and affordability. In addition, there is also a chance for seasonal variation in intakes of fruits and vegetables. The consistency of the recipe will also affect the actual nutrient intake. Therefore, a raw food based quantitative food frequency questionnaire (RFQnFFQ) would be appropriate than a recipe based FFQ as it could be administered during any season and to all regions in the country. Previously a pilot study was developed and tested an RFQnFFQ based on a 127 commonly consumed foods and local food habits for assessing the food group and nutrient intake in an urban set-up with a small sample size. However, the seasonal influence was not assessed in the pilot study. Furthermore, instead of developing separate FFQs for each region it would be beneficial to develop and validate a common RFQnFFQ which could be used across all regions of the country. Thus, the main aim of this study was to assess the reproducibility and validity of an RFQnFFQ along with the effect of seasonal variations in the food and nutrient intake of the subjects. METHODOLOGYStudy design The validation and reproducibility of the RFQnFFQ was carried out for a period of one year across the three major seasons (summer, rainy and winter) of 4-months span each in the urban set-up. Study was conducted on the subjects selected from random households residing in the Greater Hyderabad Municipal Corporation areas. A total of 117 subjects ≥18 years (both male and female) were recruited from 35 households. A total of 106 subjects including males (n=52) and females (n=54) completed the study. These subjects were followed up throughout the study period for completion of the validation of the RFQnFFQ. The 24hR was chosen as the reference method for comparing the RFQnFFQ for studying its validity. An initial RFQnFFQ of one year duration was administered during the baseline period. It was repetitively followed by three 24hR and a seasonal RFQnFFQ of 4-months duration each for the three seasons and finally followed by a final RFQnFFQ of one year duration. The schematic design of the study is presented in fig 1.
39

Administration of diet surveys The study was carried out for 12 months cover ing three consecutive seasons each with four months duration. Both, the R F Q n F F Q a n d 2 4 h R w e r e interviewer administered and conducted at the respective household of the subject. The person who was directly involved in cooking foods for the entire household was interviewed for dietary information. Baseline RFQnFFQ of previous one year duration was administered to the subjects in the beginning of the study, followed by seasonal RFQnFFQ of 4-months duration throughout all the three seasons, and at the end of the study a final RFQnFFQ of previous one year duration. In each season three 24hR was collected for 3 non consecutive days. The same subjects were interviewed in all the three seasons of the entire validation study. After the completion of the last 24hR, seasonal RFQnFFQ was administered within seven days. A set of twelve cups and two spoons of varying sizes (which were previously standardized for its volume) were used as visual tools in the administration of the diet surveys for assessing portion sizes in this study. Standardisation of selected raw foods was done for determining their edible portion sizes as reported earlier. For the remaining foods, standardised values were adopted from the National Nutritional Monitoring Bureau (NNMB) data base.22 A separate data base was created for RTE foods and foods eaten outside the house.A portable electronic digital diet scale with one gram accuracy was used for direct weighing of the staple raw foods. Those foods which were exhausted were quantified by imputing standardized values as identified using the visual tools or based on the size (small, medium large) by the responder. For foods eaten from outside, the near to approximate quantification was made based on the portion size identified by the subject.Raw food based quantitative food frequency questionnaire (RFQnFFQ) The RFQnFFQ was an interviewer-administered FFQ constituted a list of 141 raw food items with a corresponding frequency response along with the quantity of foods consumed. It was developed after an initial pilot testing of the RFQnFFQ in a smaller sample in a similar setting. It was decided to further extend the study to a larger sample size so as to study seasonal variations of food intake along with its validation. Few modifications were made to the RFQnFFQ before administering it to a larger sample size in the present study. There were two RFQnFFQs, baseline and final, for one year duration (reference period was the preceding year) and three seasonal RFQnFFQs (reference period of previous 4-months) in the study. The frequency of the baseline and final RFFQnFFQ ranged from daily, twice a week, thrice a week, four times a week, weekly once, once in a fortnight, once in a month, once in four months and once in a year. The frequency in case of seasonal RFQnFFQ was ranged maximum up to once in four months. The foods were listed under the following categories: cereals and millets, pulses and legumes, green leafy vegetables, other vegetables, roots and tubers, milk and milk products, nuts and oil seeds, fruits, flesh foods, fats and oils, sugars, condiments and spices, and ready to eat (RTE) foods. The quantity of foods consumed along with its frequency of consumption was recorded. As the RFQnFFQ was open ended, those foods which were not in the list and foods which were eaten outside were noted down along with
Fig 1. Schematic representation of the study design
40

Table 1A: Median (IQR) intake of foods (g/day) by the study subjects as estimated by RFQnFFQ and 24hR during the study period (n=106)
Food GroupsBaseline RFQnFFQ
S1-24hR
S1 –RFQnFFQ
S2-24hR
S2 –RFQnFFQ
S3-24hR
S3-RFQnFFQ
FinalRFQnFFQ
Cereals & Millets (g)*
257(234, 300)
236(201,277)
252 (231, 297)
268(216,324)
262(234, 299)
230(178,277)
264(235, 302)
266 (236, 304)
Pulses & Legumes (g)
55(31,76)
40(27, 49)
51(30,70)
50(34, 68)
54(36, 74)
32( 20, 53)
59(38, 70)
54(37, 73)
Green Leafy Vegetables (g)
37 (16, 60)
25(14, 38)
32(15, 54)
29(17, 59)
35 (19, 55)
17(10, 33)
32 (20, 48)
34(17, 60)
Other Vegetables (g)
112(76, 156)
76(41, 126)
79 (51, 123)
75(41, 98)
90(67, 133)
55(21, 85)
87 (66, 129)
113(73, 160)
Roots & Tubers (g)
100(43, 138)
82(41, 108)
89(43, 133)
87(48, 125)
93(42, 131)
78(44, 110)
95 (50,130)
102(43, 141)
Nuts & Oil seeds (g)
10 (6, 25)
8(3, 14)
9(4, 15)
9(3, 15)
9(4, 22)
6(2, 11)
11 (6, 17)
12 (6, 24)
Fruits (g)177
(77, 221)242
(211,323)162*
(72, 211)211
(175,269)164
(88, 216)154
(86, 227)168
(82, 213)178
(80, 230)
Food GroupsBaseline RFQnFFQ
S1-24hR
S1 –RFQnFFQ
S2-24hR
S2 –RFQnFFQ
S3-24hR
S3-RFQnFFQ
FinalRFQnFFQ
Fish (g)6
(0, 15)0
(0, 0)2
(0, 10)0
(0, 0)2
(0, 6)0
(0, 0)4
(0, 9)6
(0, 16)
Other Flesh Foods (g)
35(0, 57)
16(0, 44)
25 (0, 56)
29(0, 65)
28 (0, 56)
30(0, 58)
33(0, 55)
37(0, 62)
Milk & milk products (g/mL)
287(198, 392)
266(208,325)
284(198, 392)
247(200,330)
276(203, 387)
271(202,333)
285(185, 389)
284(206,393)
Fats & Oils (g)25
(19, 32)16
(10, 21)25
( 19,30)18
(13, 25)25
(20, 31)15
(13, 20)25
(19, 31)26
(20, 31)
Sugar(g)
10(6, 15)
9(6, 14)
9(5,15)
10 (6, 15)
9 (5, 14)
8(5, 11)
10(6, 16)
10 (6, 16)
Condiments &Spices (g)
10(6, 21)
12(10, 15)
10 (5, 18)
13(10, 20)
11 (7, 17)
11(7, 12)
12(6, 18)
11(6, 19)
RTE (g)18
(11, 26)46
(21, 87)14
(7, 19)45
(17, 93)24
(17, 33)32
(7, 79)18
(13, 26)17
(9, 29)
All values were calculated as per day intake of the subjects. *p<0.05
41

the corresponding portions. Intake of nutrient supplements of the subjects was also recorded in the RFQnFFQ. Twenty four hour dietary recall The 24hR was used as the reference tool to assess the validity of RFQnFFQ across the three seasons. As the 24hR assesses only short-term food intake, it was administered three times in one season to capture intra-individual variability of usual intakes. Altogether nine 24hRs in the entire study period were recorded. The 24hR was administered on the subjects for three nonconsecutive days of which one day was a weekend day to capture the variations of a weekend diet pattern. The raw ingredients of the particular recipe were noted down along with its weights. The major foods were directly weighed by the portable digital diet scale. Standardized values were imputed for those foods which were exhausted and minor ingredients like spices. Foods eaten outside or RTE foods consumed were also noted down and substituted with appropriate standardised values. The individual's consumption of the cooked foods was assessed using the standardised measuring cups and spoons. Data entry and nutrient calculations The data from the 24hR as well as from the RFQnFFQs were coded using standardized codes as used in the pilot study and entered in Microsoft Excel using a predesigned programme. The Indian food composition database, “the Nutritive Value of Indian Foods” was used for the calculation of nutrient intake. Values for the edible portion sizes of raw foods were imputed from already standardized values and also from the National Nutrition Monitoring Bureau (NNMB) food list. For RTE, pre-packaged foods and foods consumed outside, a separate data base was created and standardized values were substituted at the time of data entry.Statistical analyses: The food and nutrient intake was calculated per day by the subjects were obtained as median and intra quartile range (IQR) values in the three seasons as well as for the baseline and final period. The seasonal difference in food consumption pattern of subjects was expressed as mean and SD. The analysis of variance F Test (ANOVA- F Test) was used to determine whether any significant differences exist between the means of the groups for intake difference in food groups and nutrients. Unadjusted Pearson's correlation (parametric) were used to test the validity and reproducibility of the RFQnFFQ. The validity of the RFQnFFQ was determined by comparing the mean of nine 24hR (at the 3 seasons) with the final RFQnFFQ using Pearson's correlation. It is known that a good correlation between two methods designed to determine the same attribute does not always unquestionably connote a good agreement between the two methods as correlation coefficient depicts only the strength of a relationship between two variables. Therefore, the data were analysed by Bland-Altman plots to determine the limits of agreement between the two methods (RFQnFFQ and 24hR) so as to confirm the validity of the RFQnFFQ. The limits of agreement (±1.96 SD) were manifested by plotting the differences between the mean RFQnFFQ at baseline and final with mean 24hR of the three seasons against the mean results of the two methods. In addition we tested the mean differences of intakes of normality using Shapiro wilks test. The reproducibility of the RFQnFFQ was done by comparing the baseline and final RFQnFFQs by unadjusted Pearson correlation.RESULTS· The mean age of the male subjects was 38 (±13.43) years and that of female subjects was 42 (±16.05)
years. The majority of the subjects (83.0%) were Hindus. The literacy status of most of the study subjects (71.7%) was found to be graduation and above. Most of the subjects (68.9%) belonged to nuclear families.
· Food and nutrient intake of the subjects: The food and nutrient intake of the subjects are presented as median and intra quartile range (IQR) values in the 3 seasons as well as for the baseline and final period. The median with IQR for intake of foods and nutrients is shown in Table 1. There was no significant difference (p<0.05) between baseline and final RFQnFFQ except for cereals and millets in food groups. Similarly, no significant difference (p<0.05) was observed between the methods for the given season except for fruits in season 1. However, there was significant difference (p<0.05) between
42

Table 1B: Median (IQR) intake of nutrients by the study subjects as estimated by RFQnFFQ and 24hR during the study period (n=106)
Nutrients Baseline RFQnFFQ S1-24hR S1 –
RFQnFFQ S2- 24hR S2 –RFQnFFQ S3- 24hR S3-
RFQnFFQFinal
RFQnFFQ
Protein(g)
63(51, 77)
59(50, 70)
58(48, 69)
64(55,75)
62(50, 74)
52(45, 64)
62(49, 73)
63(52, 77)
Fat(g)*
45(36, 58)
50(41,62)
40(33, 51)
51(42, 65)
46(40, 56)
46(37, 54)
44(36, 54)
44 (36, 55)
Energy(kcal)
1887(1671, 2263)
1989(1766, 2314)
1824(1532, 2094)
2067(1842, 2389)
1951 (1679, 2254)
1726(1528, 2025)
1903 (1627, 2218)
1892 (1629, 2266)
Calcium(mg)*
896.7 (609, 1170)
946.6(824, 1075)
756.3 (560, 1081)
922.2(773, 1100)
865.3 (588, 1072)
863.1( 658, 1072)
827.9 (567, 1091)
847.8(591,
1142)
Vitamin A(µg)*
783.0(521,
1029)
814.8(670, 1034)
697.2(327, 940)
791.3(630, 1001)
719.4(440, 940)
601.9(364.6,
757)
661.4(509, 914)
755.7(473, 1033)
Thiamin(mg)*
1.2 (0.9, 1.5)
1.1(0.9, 1.3)
1.1(0.8, 1.4)
1.1 (1.0, 1.3)
1.1(0.9, 1.4)
0.9(0.7, 1.2)
1.1(0.9, 1.4)
1.1(0.8, 1.5)
Riboflavin(mg)*
0.9(0.7, 1.1)
1.1(0.9, 1.2)
0.8(0.6, 0.9)
1.0(0.9, 1.1)
0.9(0.6, 1.0)
0.9(0.7, 1.0)
0.8 (0.6, 1.0)
0.8(0.6, 1.0)
Niacin(mg)
11.8(10.0, 14.4)
11.4(9.7,13.3)
11.3(9.2,
13.8)
11.0(9.2, 13.6)
11.6(9.7, 14.1
9.4(7.5, 12.5)
12.0(10.1, 14.1)
11.9(10.3, 14.3)
Iron(mg)
13.8(9.5,
17.7)
13.3(11.1, 16.3)
12.6(8.9,
16.5)
13.3 (10.7, 16.1)
12.9(9.8,
16.8)
11.2 (8.5, 15.7)
13.6 (9.7, 17.2)
13.8 (10.0, 18.9)
Folic acid(µg)
215.9 (162,283)
171.9(148, 202)
206.2
(142,256.)
194.8(160,230)
211.6 (169,259)
141.9(108,187)
209.0(155,254)
228.4(165,288)
Zinc(mg)
6.7(5.6, 7.9)
5.9(4.9, 6.7)
6.5(5.3, 7.7)
6.4 (5.2, 7.5)
6.5(5.8, 7.9)
5.3(4.0, 6.4)
6.7 (5.7, 7.5)
6.7 (5.5, 8.0)
All values were calculated as per day intake of the subjects; *p<0.05
43

baseline and final RFQnFFQ for fat, calcium, vitamin A, thiamine and riboflavin in nutrients. Within the seasons there was no significant difference (p<0.05) between the methods for nutrients.
· Seasonal difference in food consumption pattern of subjects: It was observed that no significant differences (p<0.01) in foods (except for other vegetables, fish and RTE) and in nutrient intakes of subjects were found between the 3 seasons. The RFQnFFQ data on season specific food and nutrient intake of the subjects is provided in Table 2.
· Validity of the RFQnFFQ: The validity of the RFQnFFQ was calculated by comparing RFQnFFQ at final with the mean 24hR (at the 3 seasons) using unadjusted Pearson's correlation. All major foods except for other vegetables, sugars, condiments and RTE and among nutrients, all macronutrients and micronutrients except vitamin A was found to have relatively good correlation (r>0.5). The Pearson's correlation for the foods and nutrient intake of the subjects were found to be significant at p<0.01 except for condiments and spices and RTE. Validity of the RFQnFFQ is given in Table 4. The agreement for the intake of food groups and nutrients between the RFQnFFQ and 24hR was evaluated by the Bland-Altman plots and found that the mean differences between the two methods were lower and hence both the methods were comparable (Table 3).
· Reproducibility of the RFQnFFQ: The reproducibility of the RFQnFFQ was assessed by comparing the baseline and final RFQnFFQs. Pearson's correlation were used to assess the reproducibility of the
Table 2A. Seasonal difference in food intake (g/day) of subjects analysed by the RFQnFFQ (n=106)
Food Groups Baseline RFQnFFQ
S1 –RFQnFFQ
S2 –RFQnFFQ
S3-RFQnFFQ
FinalRFQnFFQ
F value
Pvalue
Cereals & Millets (g) 270 (54.3) 267 (55.1) 271
(54.2) 274 (55.6) 274 (53.5) 0.275 0.894
Pulses & Legumes (g) 59 (32.6) 55 (29.0) 59 (28.4) 61 (28.7) 59 (30.1) 0.722 0.577
Green Leafy Vegetables (g) 43 (30.3) 37 (26.3) 41 (26.0) 38 (21.5) 43 (29.6) 1.053 0.379
Other Vegetables (g) 121a (61.4) 90b (51.6) 101b
(53.2) 99b (47.4) 122a (60.4) 7.012 0.000**
Roots & tubers (g) 99 (55.1) 91 (54.4) 94 (57.6) 98 (52.7) 100 (57.3) 0.464 0.762
Nuts & Oil seeds (g) 19 (17.5) 14 (15.4) 16 (17.1) 16 (15.6) 18 (17.7) 1.346 0.252
Fruits (g) 168 (106.1) 159 (96.1) 167 (96.5)
170 (102.8)
169 (104.8) 0.210 0.933
Fish (g) 12a (17.3) 7b (10.4) 6b (8.4) 7b (8.8) 12a (16.9) 5.576 0.000**
Other Flesh Foods (g) 35 (31.8) 32 (31.7) 33 (31.3) 34 (33.9) 35 (31.2) 0.177 0.950
Milk & milk products (g) 310 (142.0) 304
(136.0)310
(135.1)309
(137.5)311
(136.7) 0.042 0.997
Fats & Oils (g) 26 (10.2) 26 (9.9) 27 (10.5) 26 (11.7) 27 (9.8) 0.170 0.954Sugar (g) 12 (9.2) 11 (8.0) 11 (7.5) 12 (8.2) 12 (8.9) 0.867 0.484Condiments & Spice (g) 14 (9.9) 13 (9.4) 13 (9.0) 13 (9.1) 14 (10.2) 0.342 0.850
RTE (g) 20ab (14.5) 15a (13.9) 26b
(12.2) 21ab (12.7) 26b (4.8) 3.236 0.012**
Data are expressed as mean ± SD All values were calculated as per day intake of the subjects; **Significantly different at p < 0.01 level (2-tailed) ; variations in superscripts indicate significant differences across different time points
44

Table 2B. Seasonal difference in nutrient intake of subjects per day analysed by the RFQnFFQ (n=106)
Data are expressed as mean ± SD; All values were calculated as per day intake of the subjects; **Significantly different at p < 0.01 level (2-tailed) ; variations in superscripts indicate significant differences across different time points
Nutrients Baseline RFQnFFQ
S1 –RFQnFFQ
S2 –RFQnFFQ
S3-RFQnFFQ
Final RFQnFFQ
F value
P value
Protein (g) 65(22.3) 60(20.8) 63 (19.0) 63(19.4) 65(22.3) 0.887 0.471Fat (g) 51 (22.3) 46 (21.7) 50 (19.7) 47 (19.6) 49(20.3) 0.785 0.535Energy (kcal) 2031(601.6) 1913(574.4) 2004(528.4) 1986(531.1) 2012(561.2) 0.707 0.587Calcium (mg) 933.2 (389.1) 831.9(347.6) 872.2(326.9) 842.4(306.8) 901.2(365.3) 1.529 0.192VitaminA(µg) 811.9 (443.8) 726.6(416.1) 725.6(384.2) 719.7(347.2) 791.1(451.4) 1.174 0.322Thiamin (mg) 1.3(0.6) 1.2 (0.5) 1.2 (0.5) 1.2 (0.5) 1.2 (0.5) 0.575 0.681Riboflavin(mg) 0.9 (0.4) 0.8(0.4) 0.9(0.3) 0.8 (0.3) 0.9 (0.4) 1.463 0.212Niacin (mg) 13.0(4.9) 12.3 (4.6) 12.5(4.5) 12.9(4.4) 13.0 (4.7) 0.463 0.763Iron (mg) 14.7(6.5) 13.5(6.0) 13.9(5.1) 14.2 (5.5) 15.1(6.3) 1.274 0.279Folic acid (µg) 231.2 (90.5) 209.7 (85.5) 225.4(79.9) 215.6(77.7) 230.3(89.5) 1.312 0.264Zinc (mg) 7.1(2.3) 6.8 (2.2) 7.0(2.1) 7.0 (2.1) 7.1(2.3) 0.315 0.868
Table 3. Validitation of final RFQnFFQ with mean 24hR (at 3 seasons) by Pearson's correlation (unadjusted) and Bland-Altman analysis
Table 4. Reproducibility of RFQnFFQ by Pearson's correlation (unadjusted) between baseline RFQnFFQ and final RFQnFFQ
All values were calculated as per day intake of the subjects** - Correlation is significant at 0.01 level (2-tailed) ; d mean difference between RFQnFFQ and 24hR
Foods Pearson’s correlation
Bland Altman Analysis - ¯ 95% CICereals & Millets (g) 0.501** 18.5 -93.2, 130.2 Pulses & Legumes(g) 0.678** 13.1 -32.6, 58.8 Green Leafy Vegetables (g) 0.577** 11.3 -37.4, 59.9 Other Vegetables (g) 0.387** 51.7 -59.7, 163.2 Roots & Tubers (g) 0.448** 16.2 -83.5, 115.9 Nuts & Oil seeds (g) 0.736** 7.5 -18.3, 33.3 Fruits (g) 0.598** -49.6 -217.4, 118.1 Fish (g) 0.593** 0.9 -30.6, 32.3 Other Flesh Foods (g) 0.600** 46.4 -23.9, 116.6 Milk & milk products (g/mL) 0.511** 35.6 -199.4, 270.5 Fats & Oils (g) 0.479** 8.5 -8.7, 25.8 Sugar (g) 0.429** 0.8 -16.3, 18.0 Condiments & Spices (g) 0.132 0.7 -19.8, 21.2 RTE (g) 0.503** -37.6 -134.0, 58.8 NutrientsProtein (g) 0.582** 3.8 -30.4, 38.0 Fat (g) 0.590** -0.9 -33.8, 31.9 Energy (Kcal) 0.566** 24.6 -908.5, 957.7 Calcium (mg) 0.493** -29.4 -655.3, 596.5 Vitamin A (µg) 0.314** -34.3 -906.1, 837.5 Thiamin (mg) 0.732** 0.2 -0.6, 0.9 Riboflavin (mg) 0.603** -0.1 -0.7, 0.5 Niacin (mg) 0.565** 1.8 -5.8, 9.4 Iron (mg) 0.658** 1.1 -8.1, 10.4 Folic acid (µg) 0.584** 52.1 -90.9, 195.1 Zinc (mg) 0.567** 1.1 -2.6, 4.8
Foods Pearson’s Correlation
Cereals & Millets (g) 0.975**Pulses & Legumes (g) 0.990**
Green Leafy Vegetables (g) 0.989**
Other Vegetables (g) 0.990**
Roots & Tubers (g) 0.993**
Nuts & Oil seeds (g) 0.991**
Fruits (g) 0.991**
Fish (g) 0.968**
Other Flesh Foods (g) 0.986**
Milk & milk products (g) 0.990**
Fats & Oils (g) 0.940**
Sugar (g) 0.783**
Condiments & Spices (g) 0.978**
RTE (g) 0.473**
NutrientsProtein (g) 0.992**
Fat (g) 0.952**
Energy (Kcal) 0.979**
Calcium (mg) 0.968**
Vitamin A (µg) 0.989**
Thiamin (mg) 0.992**
Riboflavin (mg) 0.960**
Niacin (mg) 0.992**
Iron (mg) 0.978**
Folic acid (µg) 0.987**
Zinc (mg) 0.991**
All values were calculated as per day intake of the subjects; ** Correlation is significant at 0.01 level (2-tailed)
45

SUMMARY This RFQnFFQ of one year duration was able to quantify the food intake of both conventional foods as well as RTE foods among the study subjects. The nutrient intake of the subjects could thereby be calculated from the food intake data. The RFQnFFQ could be used as a tool for assessment of dietary information of subjects with long-term chronic diseases particularly those diseases that are modifiable by diet such as T2DM. The RFQnFFQ of one year duration was thus a valid tool to capture long term habitual dietary intake pattern of subjects which could possibly be useful for estimation of nutrient intake of subjects in chronic diseases irrespective of the season. As the RFQnFFQ used in this study was raw food based it could be adapted to other parts of India including rural area with suitable modifications.
8. CARBOXYMETHYL LYSINE INDUCES EMT IN PODOCYTES THROUGH TRANSCRIPTION FACTOR ZEB2: IMPLICATIONS FOR PODOCYTE DEPLETION AND PROTEINURIA IN DIABETES MELLITUS
The vertebrate kidneys are indispensable for maintaining body homeostasis by regulating electrolyte, water and acid-base balance. These functions are carried out by the collective effort of approximately one million nephrons in each kidney. Each nephron consists of a glomerulus and a renal tubule. Appearance of protein in urine indicates damage to the glomerular filtration barrier (GFB), which is a size selective molecular sieve that firmly regulates the filtration of large macromolecules while allowing the passage of only small molecules and water. The three components that constitute GFB are the fenestrated glomerular endothelium, the glomerular basement membrane (GBM) and the podocytes. Podocytes are terminally differentiated visceral epithelial cells that are made up of numerous lamellipodia that branch into primary and secondary processes which further ramify into smaller foot processes. Foot processes from neighbouring podocytes interdigitate and connected by a modified adherent junction called slit diaphragm (SD) that provides intercellular space for the passage of glomerular filtrate. Alterations in the morphology of podocyte lead to the disruption of foot process architecture, which results in the loss of entire podocytes, ultimately leading to proteinuric state. Studies in patients and animal models of diabetes mellitus (DM) revealed that the onset of proteinuria is associated with decreased density and altered podocyte morphology. Podocyte number is markedly reduced in diabetic nephropathy (DN) where the foot process is significantly widened and the SD becomes narrower resulting in a declined glomerular filtration rate. Studies from diabetic rodents suggested that injured podocytes undergo apoptosis and also detach from GBM into the urinary space. Loss or injury to the podocytes will impede the glomerular function as the remaining healthy podocytes are unable to compensate for glomerular filtration, thus resulting in proteinuria. Podocyte injury is the leading cause of chronic kidney disease in patients requiring renal replacement therap. It was reported that podocytes undergo either apoptosis or epithelial-mesenchymal transition (EMT) that accounts for decreased podocyte count and proteinuria. Among various risk factors prevalent in DM, chronic hyperglycemia plays a critical role in abetting several complications including DN. Prolonged hyperglycemia is an exacerbating factor leading to elevated advanced glycation end-products (AGEs) in circulation and tissues. AGEs are a heterogeneous group of compounds derived non-enzymatically from the reaction of reducing sugars including glucose with free amino groups in proteins through a series of oxidative and non-oxidative reactions. AGEs accumulate in DM patients and tend to rise further with the progression of DN. The involvement of AGEs in the pathogenesis of renal damage has been supported by a study in non-diabetic rats wherein administration of AGEs induced proteinuria and histological changes that were observed in diabetic
46
kidney disease. On the other hand preventing AGEs formation attenuates diabetic complications. In renal biopsies from patients with DN, AGE-accumulation is primarily found in GBM and its accumulation involves upregulation of receptor for AGE (RAGE) on podocytes. N-carboxymethyl-lysine (CML) is one of the well-characterized AGE that accumulates predominantly in all renal compartments of diabetics. In an earlier study, it was shown that AGEs induced tubulo epithelial-myofibroblast transdifferentiation through interaction with RAGE. Although, CML is the predominant AGE present in renal compartments and podocytes from diabetic subjects, it is not entirely established how CML contributes to podocyte damage. In this study, we demonstrated that CML activates ZEB2, a canonical transcription factor that mediates EMT. Thus CML mediated NF-kB dependent up-regulation of ZEB2 could be linked to albuminuria in diabetic conditions.METHODOLOGYPodocyte culture Briefly, conditionally immortalized human podocytes cells (LY813) from University of Bristol were maintained under growth-permissive conditions at 33°C under 5% CO inRPMI-1640 medium containing 2
10% FBS, 100 units/ ml penicillin, 100 µg/ml streptomycin, and 1% insulin-transferrin-selenium solution. To induce differentiation, podocytes were shifted to non-permissive conditions at 37°C and maintained for 10 days. Differentiated podocytes were maintained for 4h in serum-free medium before treating with CML-KLH or control KLH.Transient transfection and luciferase assay Podocytes are resistant to tranfection; therefore we employed HepG2 cells to investigate effect of
5 CML on promoter activities of down-stream targets. HepG2 cells (1x10 cells/well) were transfected with promoter-reporter construct (pNifty/ZEB2/E-cadherin) and internal control expressing the Renilla luciferase, pRL-TK. Forty-eight hours after transfection, cells were washed twice with PBS and harvested with passive lysis buffer. After a brief freeze-thaw cycle, the insoluble debris was removed by
ocentrifugation at 4 C for 5 min at 12,000xg, and the supernatant was used for sequential quantification of firefly and Renilla luciferase activity. The activity of the cotransfected Renilla reporter plasmid was used to normalize transfection efficiency. ZEB2 knockdown using shRNA lentiviral particles A panel of five lentiviruses expressing unique ZEB2 shRNA sequences was purchased. Proliferating
5 human podocytes were plated in a 6-well plate at 40% confluence (2x10 cells/well) and cultured overnight for 12–16 h. The cells were then pre-treated with polybrene, infected with lentiviral particles, and incubated at 33°C. The following day the medium was replaced with fresh medium containing puromycin (1 μg/ml) as a selection marker. The puromycin-resistant cells were induced to differentiate using the protocol detailed above, and ZEB2 expression was measured in the differentiated cells using RT-qPCR and Western blot analysis. ZEB2 knockdown cells were employed for further studies.Sub-cellular fractionation Nuclear and cytoplasmic sub-cellular fractionation was carried out using the NE-PER kit.
oFractionated cytoplasmic and nuclear aliquots were stored at -80 C until used for Western blot analysis, wherein β-actin and histone-H3 were used as markers for cytoplasmic and nuclear fractions, respectively.Wound healing assay Human podocytes were seeded in 6 well plates and grown under normal growth conditions to reach 95% confluence. When the cells are confluent, media was aspirated and a scratch was made in the shape of “+” in a smooth sweeping motion using a sterile pipette tip. Cells were washed twice with pre-warmed media in order to remove any debris from damaged cells. Images of cells were taken before and after treating with CML-KLH or control KLH at regular time points to monitor the rate of migration of cells into the wound field. CML-KLH was prepared and antibodies for CML-KLH were produced as described by us earlier.
47

Albumin influx assay Briefly, human podocytes were placed on a 12-well plate with collagen-coated Transwell filters and differentiated at non-permissive conditions as described above by culturing for 10 days. The cells were then treated with CML-KLH or control KLH (1 µg/ml) for 48 h. Subsequently, the medium was removed, and cells were washed twice with 1 mM CaCl and 1 mM MgCl mixture to preserve cadherin junctions. 2 2 2
ml of RPMI 1640 medium with 40 mg/ml BSA was then placed in the bottom chamber, and 0.3 ml of RPMI 1640 medium (without albumin) was placed in the top chamber. The cells were incubated at 37°C, aliquots of medium was collected from the top chamber at various (1, 2, and 4 h) time points, and albumin concentration was measured in these aliquots using the BCA protein assay kit. Studies with diabetic rodents Two-month-old male Wistar-NIN rats with an average body weight of 205g were used for this study. The control rats (n=6) received 0.1 M citrate buffer (pH 4.5) as vehicle, whereas the experimental rats received a single intraperitoneal injection of streptozotocin (STZ; 35 mg/kg) in the same buffer. After 72 h of STZ injection, rats with fasting blood glucose levels >150 mg/dL were considered as the diabetic animals (n=6) and were maintained for 10 weeks. Urine was collected at the end of 10 weeks and was analyzed for albuminuria, if any. At the end of the experiment, under general anesthesia, kidneys were perfused with PBS containing 50 U/ml sodium heparin through a cannula placed in the abdominal aorta. Kidneys from these rats were harvested and cortical regions were dissected and used for immunohistochemistry and western blotting as described above. All animal care protocols were approved by the Institutional Animal Ethics Committee. Immunohistochemistry Kidneys were fixed in 4% paraformaldehyde. Paraffin embedded 4μM thick sections were obtained and immunolocalization of CML, ZEB2 and E-cadherin was performed by employing standard protocols. To prevent non-specific binding of the antibody, blocking was done by incubating the slides in 3% normal goat serum in PBS at room temperature for 1 hour. Later the slides were incubated overnight at 4°C with primary antibody in 1.5% normal goat serum in PBS. After overnight incubation with primary antibody, slides were washed with PBS and incubated with corresponding secondary antibody solution for 45 min and followed by incubation of slides with Vectastain elite ABC reagent. The protein was localized in the kidney sections by addition of DAB solution containing H O .2 2
RESULTSCML induces ZEB2 expression in human podocytes: Human immortalized podocytes treated with
varying concentrations of CML-KLH (0.1-1µg/ml) showed induction of ZEB2 in a dose dependent manner (Fig.1). Further, there was a significant loss of E-cadherin in podocytes treated with CML-KLH, which was more evident at a concentration of 1µg/ml (Fig 1). E-cadherin is a predominant epithelial marker and its expression is regulated transcriptionally by ZEB2. Unmodified or control KLH treatment did not significantly alter expression of either ZEB2 or E-cadherin (Fig 1).
· We then employed a concentration of 1µg/ml CML-KLH to investigate the time dependent effect of CML on expression of a panel of EMT markers. While ZEB2 expression was elevated till 48 h of exposure to CML-KLH, E-cadherin expression was depleted in time dependent manner (Fig 1). Also, the expression of other epithelial marker (EpCAM) was decreased and mesenchymal marker (b-catenin) was increased with CML-KLH treatment. However, we did not notice significant induction of other transcriptional factors that regulate EMT such as Snail1, Slug and ZEB1.
· Further, wound healing (scratch) assay demonstrated that podocytes exposed to CML-KLH exhibited enhanced motility (Fig 2). However, we did not notice migration of either podocytes or MDA-MB-231 cells treated with KLH alone.
CML activates NF-kB signalling in human podocytes: It was found that exposure of podocytes to CML resulted in activation of NF-kB signalling as evidenced by phosphorylation of IKKα/β and IKBα with eventual phosphorylation of p65NF-kB. Further, both enhanced phosphorylation and accumulation
48

Fig 1: CML induces ZEB2 expression in podocytes. A- Immortalized differentiated human podocytes were exposed to CML-KLH (0.1- 1.0 μg/ml) or KLH (1.0 μg/ml) for 48 h and cell lysates were prepared and equal amounts of protein fractionated by SDS-PAGE. Immunoblotting was performed for ZEB2 and E-cadherin. Results shown are representative of three independent experiments. Cells naïve to KLH and CML-KLH were considered as control. B- Immortalized differentiated human podocytes were exposed to 1.0 μg/ml of CML-KLH for varying time periods (0-48 h) and cell lysates were subjected to immunoblottingfor ZEB2, E-cadherin, -catenin and EpCAM.
E-cadherin
β-actin
Control 0.1 μg 0.2 μg0.5 μg
ZEB2
CML (μg/ml) 48 h
1.0 μg (KLH)
A
E-cadherin
β-actin
ZEB2
0 h 12 h 24 h 48 h
1 μg/ml CML
b-catenin
EpCAM
B
Fig 2. CML induces migration of cells. Immortalized differentiated human podocytes were subjected to wound healing assay and exposed to CML-KLH or KLH (1.0 μg/ml) for varying periods of time (0-12 h). Cells naïve to both CML-KLH and KLH were considered as control. Representative images of podocytes exposed to CML-KLH or KLH for 12 h.
0 h
0 h
0 h
Control 12 h
+CML12 h
+KLH 12 h
49

of p65NF-kB in the nucleus was found in podocytes exposed to CML. Activation of p65NF-kB correlated with increased expression of ZEB2 and decreased expression of E-cadherin in podocytes. This suggests, at least partly, that CML dependent activation of EMT phenomenon may be mediated via RAGE-NF-kB axis.
· CML-dependent activation of ZEB2 promoter activity: HepG2 cells that were transiently transfected with ZEB2 promoter-reporter construct showed increased luciferase activity upon treatment with CML-KLH (Fig.3A). It was known from previous studies that ZEB2 promoter region has a NF-kB binding site. Inhibition of NF-kB with MG-132 attenuated CML dependent expression of ZEB2. Based on the temporal relationship between these two effects of CML on NF-KB and ZEB2 in podocytes, we hypothesized that the effect of CML on ZEB2 expression is mediated via activation of NF-kB. Thus, we tested the effect of CML-KLH on expression of E-cadherin, a putative target of ZEB2. E-cadherin promoter has conserved regulatory elements including two E2 boxes (CACCTG) that bind ZEB2 and elicit the suppressive action of ZEB2 on E-cadherin expression. We tested this hypothesis by exposing HepG2 cells that were transiently transfected with wild-type E-cadherin promoter or E-cadherin promoter mutated in ZEB2 binding E-box region (CATCTG) to CML-KLH. While the promoter activity of wild-type E-cadherin was decreased with CML treatment (Fig.3B), mutation in ZEB2 binding region abolished the inhibitory effect of CML on E-cadherin promoter (Fig.3C). Taken together, these results suggest that CML induces loss of E-cadherin via ZEB2, whereas ZEB2 is induced by NF-kB.
· ZEB2 knockdown abolishes CML-dependent decrease in P-cadherin in human podocytes: CML treated podocytes showed decreased P-cadherin expression compared to cells that were naïve to
-/-CML treatment (Fig.4A&B). In ZEB2 podocytes, CML-KLH failed to repress in P-cadherin expression (Fig.4A&B). Hence, these results indicate that ZEB2 is essential for transducing the effect of CML on P-cadherin expression in podocytes.
· Essential role of ZEB2 in transducing effect of CML on podocyte permselectivity: To assess the functional consequence of podocyte exposure to CML, the filtration barrier function of podocytes was assessed by a paracellular permeability assay that measures the rate of albumin flux across the monolayer of differentiated podocytes. There was a CML-dependent increase in albumin influx across the podocyte monolayer (Fig.4). To delineate the role of ZEB2 in transducing the effect of CML on the permeability of the podocytes, paracellular albumin influx was performed in ZEB2-/- podocytes. Knockdown of ZEB2 expression resulted in blunting the ability of CML to increase podocyte
Fig 3. CML-dependent decrease in E-cadherin promoter activity is mediated via ZEB2. A- HepG2 cells were transiently transfected with ZEB2 promoter-reporter luciferase construct and then exposed to KLH or CML-KLH for 12-24 h. boxes and exposed to CML-KLH or KLH for 48 h. Data are mean ± SE (n=6); * p<0.05 vs untreated cells.
Control CML12 h
CML24 h
KLH12 h
KLH24 h
ZEB2
Prom
oter
Activ
ity(R
LU)
0
1
2
3
p<0.05
p<0.05 BA C
E-ca
dher
inLu
cifea
seAc
tivity
(RLU
)
0.0
0.2
0.4
0.6
0.8
1.0
0 h 12 h 24 h 48 h 48 h
CML KLH
p<0.05*
E-ca
dher
inPr
omot
erAc
tivity
(RLU
)
0.0
0.2
0.4
0.6
0.8
1.0
CML
0 h 12 h 24 h 48 h 48 h
KLH
Results represent the mean ± SE (n=6); * p<0.05 vs control. B- HepG2 cells were transiently transfected with E-cadherin promoter-luciferase construct and then exposed to CML-KLH or KLH for 0-48 h. Results represent mean ± SE (n=6); * p<0.05 vs untreated cells. C-, HepG2 cells were transiently transfected with E-cadherin promoter-luciferase construct with point mutations in the two E2
50

permeability to albumin (Fig.4). Hence, these results indicate that CML alters podocytes permeability via ZEB2 and ZEB2 could be a key factor in eliciting both EMT and altered permeability of podocytes by CML.
· CML formation and increased expression of RAGE in diabetic rat kidney linked to EMT and proteinurea: The accumulation of CML and expression of RAGE in cortical region of kidney from control and STZ-induced diabetic rats was examined. Both immunoblotting and immunohisto-chemical data demonstrated that there was an accumulation of CML and increased expression of RAGE in STZ-induced diabetic rat kidneys when compared to control rats (Fig.5A). Moreover, diabetic rat kidney showed increased expression of mesenchymal markers such as ZEB2, -catenin and vimentin and decreased expression of epithelial markers; E-cadherin and nephrin (Fig.5B). Further, immunohistochemsitry analysis of diabetic rat kidneys revealed elevated expression of ZEB2 and attenuation of E-cadherin expression in glomerular regions (Fig.5C).
· The STZ-diabetic rats showed impaired renal function as evidenced by elevated urinary albumin/creatinine ratio (Fig.6A). Immunohistochemical data reveal a decreased podocyte count in STZ-diabetic rat glomeruli (Fig.6B). The data obtained with experimental diabetic rat model imply that CML could lead to proteinurea through induction of EMT.
Fig 4. CML-dependent increase in permeability of podocytes. Immortalized human podocytes transduced with ZEB2 shRNA and untransduced cells were grown as a monolayer on collagen-coated Transwell filters and induced to differentiate for 10 days prior to treatment with KLH, CML-KLH or vehicle (control) for 24 h, and albumin permeability across the podocyte monolayer was determined at 2, 4 and 6 h.
Data are mean ± SE (n=4); *, p<0.05 vs cells treated without CML-KLH or KLH.
Fig 5. CML accumulation in diabetic rat kidney correlate with increase in ZEB2 expression. Renal cortex lysate control (Con) or STZ-induced diabetic (Dia) rats were analyzed by immunoblotting using antibodies against CML and RAGE (Panel A) and ZEB2, E-cadherin, b-catenin, vimentin and nephrin (Panel B). Immunohistochemical analysis of glomerular expression of ZEB2 and E-cadherin in control or diabetic rats (Panel C).
51

E-cadherin
Control Diabetic
ZEB2
CML
mg
C
Fig 6. Proteinuria is associated with decreased podocyte count: A- Urinary albumin/creatinine ratio was measured from urine collected for 24 h from control (Con) and STZ- induced diabetic (Dia) rats. B- Number of podocytes per glomeruli from control (con) and STZ- induced diabetic (Dia) rats were counted from WT-1 stained paraffin sections from control and diabetic rats.
Data are mean ± SE (n=6), * p<0.05 vs control
52

SUMMARY CML increases expression of ZEB2 by activation of NF-kB. CML-dependent increase in ZEB2 expression results in EMT via down-regulation of E-cadherin expression thus results in increased podocyte permeability to albumin. Therefore, these actions of CML on EMT of podocytes plays a vital role in podocyte depletion and the pathogenesis of albuminuria during DN. Thus lessening the load of AGE could be a desirable therapeutic approach for treating diabetic renal disease.
9. ABERRANT ACCUMULATION OF WT1-POSITIVE MESENCHYMAL CELLS IN PULMONARY FIBROSIS
Pulmonary fibrosis represents a heterogeneous group of diseases in which fibrotic lesions are characterized by the accumulation of multiple mesenchymal cells involved in the excessive deposition of extracellular matrix (ECM) in the parenchyma and subpleural regions of the lung. Idiopathic pulmonary fibrosis (IPF) is a fatal fibrotic lung disease with an incidence of 4.6–7.4 people per 100,000 of the population. The development of novel therapeutic approaches for IPF likely depends on mechanistic understanding of the role of the multiple lung mesenchymal cells that accumulate and participate in IPF pathogenesis. Recent findings suggest the co-existence of multiple lung mesenchymal cells in fibrotic lung lesions, including fibrocytes, pericytes, mesothelial cells, fibroblasts, and myofibroblasts. However, the cellular mechanisms involved in the progressive accumulation of mesenchymal cells in multiple fibrotic lesions of the lung, including in the parenchyma, adventitia, and subpleural areas, are not well understood. Histopathological analysis of IPF lungs demonstrates a predominant honeycombing pattern in subpleural/ peripheral areas, the appearance of fibrotic foci, and reticular abnormalities. The thickened peripheral surfaces of the lung contain clusters of inflammatory and lung-resident mesenchymal cells that exist in continuity with the established fibrosis, which is a characteristic histologic feature of IPF thought to be the root of the underlying disease process. Pulmonary function studies typically reveal a restrictive pattern due to reduced elasticity of the lungs with the thickened subpleura. In mouse models, overexpression of either transforming growth factor-α (TGFα) or transforming growth factor-β (TGFβ) is sufficient to induce progressive pleura/subpleural fibrosis with severe impairment of pulmonary function. TGFα transgenic mice develop progressive fibrosis in adventitia, parenchyma, and subpleural areas of the lung with histological features similar to IPF when the EGFR ligand, TGFα, was conditionally overexpressed in the lung epithelium using the Club cell (Clara cell) specific protein rtTA promoter. Results of adenoviral gene transfer of TGF-β1 into the pleural mesothelium in rats suggest that mesothelial cells may be important in the development of subpleural fibrosis. Recent studies demonstrate the critical relationship between the EGFR and TGFβ pathways and the most prominent effects noted in the subpleural regions of the lung. Fibrocytes are unique bone marrow (BM)-derived mesenchymal progenitor cells that express a common leukocyte antigen, CD45, and a mesenchymal marker, type I collagen (Col1). Fibrocytes can be identified in tissues with active fibrosis and inflammation in multiple fibroproliferative diseases, including IPF. Several studies have demonstrated that the number of circulating fibrocytes in patients with IPF reflects fibrogenic activity and disease progression. However, fibrocyte-driven functions that are responsible for the initiation and maintenance of pulmonary fibrosis remain ill defined. Recently it has been shown that fibrocytes accumulate progressively in fibrotic lesions, including in the subpleura of TGFα-transgenic mice. However, the majority of myofibroblasts that accumulate in these lesions are
53

derived from lung-resident fibroblasts, but not fibrocytes. In vitro co-culture studies combined with in vivo adoptive cell-transfer studies suggest that fibrocytes augment lung-resident mesenchymal cell proliferation and accumulation in fibrotic lung lesions, including in the subpleural regions. Although the new findings suggest that lung-resident mesenchymal cells contribute to the excessive ECM deposition in fibrotic regions, the molecular and cellular origins of this remain unknown. Therefore, using a combination of molecular techniques, imaging methods and fibrocyte adoptive transfer studies, we identified Wilms tumor 1 (WT1)– positive cells as a sizable subset of lung-resident mesenchymal cells that progressively accumulate in the subpleural fibrotic lesions of both human IPF and two different mouse models of pulmonary fibrosis. Moreover, genetic knockdown of WT1 was sufficient to attenuate ECM production in primary lung mesenchymal cells of both human IPF and mouse models of pulmonary fibrosis.METHODOLOGY
CreERT2Mouse strains: Heterozygous WT1 mice (knock-in allele) are normal and can be used to track the CreERT2/+ mTmG/+genetic lineage of WT1-expressing cells. We generated WT1 ROSA mice, a double-fluorescent
CreERT2/+ mTmG/+Cre-recombinase reporter mouse strain, by crossing WT1 heterozygous and ROSA CreERT2/+ mTmG/+heterozygous mice. Heterozygous WT1 ROSA mice (knock-in allele) express CreERT2 under the
WT1 gene locus. The generation of TGFα-over expressing mice in an FVB/NJ inbred-strain background has been described previously. Homozygous Club cell (Clara cell) specific protein-rtTA (CCSP) mice were mated with heterozygous (TetO) -cmv TGFα mice to generate bi-transgenic TGFα (CCSP/TGFα) mice. Mice 7
were housed under specific pathogen-free conditions.Human tissue samples: Human IPF and control non-IPF biopsies were obtained from adult patients who had undergone lung transplantation and paraffin-embedded. Lung samples from donor lungs with no lung disease were used as control non-IPF lung biopsies. IPF was diagnosed according to the American Thoracic Society consensus criteria. Human and mouse primary lung mesenchymal cell cultures: Primary lung mesenchymal cell cultures were prepared as described previously. Briefly, the lung tissue was collected into Dulbecco's Modified Essential Medium (DMEM) supplemented to contain 10% FBS and antibiotics. Each lung tissue sample was cut into 2 cm x 2 cm pieces, and finely minced and digested in 5 ml of DMEM containing collagenase-
oIII, incubated at 37 C for 1 hr. Digested tissues were passed through a 100 μm filter, washed twice by centrifugation at 100 x g for 5 min and plated onto 100 mm tissue-culture plates in 10 ml DMEM, and incubated at 37°C, 5% CO to allow the cells to adhere and migrate away from the larger remaining tissue 2
pieces. Unbound cells were removed by washing cells with fresh DMEM. Adherent lung mesenchymal cells were continued in culture until confluence. Mouse models of TGFα- and bleomycin-induced fibrosis: TGFα expression was induced by administering food containing doxycycline (Dox; 62.5 mg/kg) to CCSP/TGFα mice. CCSP/- mice fed with Dox-treated food were used as control mice as they develop no fibrosis due to the lack of a TGFα transgene. In a mouse model of bleomycin-induced fibrosis, 10-12 week-old female FVB/NJ mice were administered bleomycin (0.05 mg) daily in 0.05 mL saline solution intradermally (i.d.) in the center of the shaved back (within a 50 mm radius) for 5 days per week for a total of 4 wks. At Day 28, mice were euthanized and lung samples were collected for further analysis. All animals received either bleomycin or saline for 4 wks. Pulmonary fibrosis in both models was evaluated by analyzing the lung hydroxyproline concentration, histology and measurement of lung function, and quantification of gene transcripts RT-PCR and proteins by Western blot.Adoptive cell-transfer studies: Adoptive cell-transfer studies were performed as described previously. In
+ +brief, fibrocytes (CD45 Col1 ) of the lung were isolated by positive selection from primary lung mesenchymal-cell cultures of CCSP/TGFα mice on Dox for 4 wks using anti-CD45 magnetic beads. FACS analysis indicates that the purity of fibrocytes isolated by this technique is approximately 95%. Fibrocytes were resuspended in phosphate-buffered saline at two million cells per ml. FVB/NJ recipient mice were infused intravenously with 250 μl of sterile saline or fibrocytes at Day 14 of saline or bleomycin (i.d.)
54

treatment. Bleomycin or saline injections were continued for an additional 2 wks (5 days/week), and mice were sacrificed for pulmonary fibrosis measurements on Day 28.
CreERT2/+ mTmG/+Tamoxifen treatments: WT1 ROSA mice were i.d. treated with bleomycin for 4 wks to induce lung fibrosis or with saline as a control. Tamoxifen (H7904; Sigma-Aldrich, St. Louis, MO, USA) was dissolved in ethanol and emulsified in sunflower oil (W530285; Sigma-Aldrich) at 25 mg/ml concentration. To determine WT1-expressing cells (green in color), mice were treated with Tamoxifen (2.5 mg/day) to activate Cre recombination via intraperitoneal injections at the end (Day 26 to 27) of bleomycin treatment and euthanized on Day 28. Histology, hydroxyproline, and lung-function tests: Lungs were inflation-fixed using 4% paraformaldehyde and stained with Masson trichrome as previously described. Lung fibrosis was assessed by measuring the total weight of the right lung and determining hydroxyproline levels using a colorimetric assay as previously described. The lung-function measurements were performed using a computerized Flexi Vent system.Wt1 siRNA transfection studies: Primary human or mouse fibroblast cells were transfected with stealth WT1 small interfering RNA (siRNA) or mouse WT1 siRNA or stealth control siRNA using the Lipofectamine-3000 Transfection kit. Primary lung-resident mesenchymal cells were separated from fibrocytes using anti-CD45 magnetic beads as described previously and grown on 12-well plates to 90% confluence. Cells were transfected with siRNA using OptiMEM media containing no antibiotics. Transfected cells were harvested 72 h post transfection and used for RNA isolation and gene-expression analysis. Whole-transcriptome shotgun sequencing (RNA-Seq) and heat maps: The lungs of CCSP/- and CCSP/TGFα mice on Dox for 3 wks were collected in RNA-later solution, and total RNA was prepared. From each experimental group, three lung-tissue samples were sequenced using an Illumina HiSeq-1000 Sequencer. To identify differentially expressed genes between the lungs of CCSP/- and CCSP/TGFα mice on Dox for 3 wks, statistical analysis was performed using the DESeq Bioconductor package that utilizes a statistical model based on negative-binomial distribution of the read counts. Statistically significant genes were selected based on a P-value cut-off of 0.05 as well as a two-fold change (up or down), resulting in 1783 genes in total. Using this set of significant genes, hierarchical clustering on the log-transformed read counts normalized for different lengths of gene-coding regions (RPKM values) was performed for the CCSP/- or CCSP/TGFα groups, and a heat map was generated. Genes of the WT1 network were identified using an analysis tool available in the Ingenuity Pathway Analysis. RESULTS· WT1-positive cells accumulate in the subpleural fibrotic lesions of TGFα mice: To determine the
lung-resident mesenchymal cells that accumulate in fibrotic lung lesions, total lung transcriptome analysis was performed on lung homogenates from CCSP/- control and CCSP/TGFα mice on Dox for 3 wks using next-generation sequencing. There were two clusters of differentially-expressed genes in the fibrotic lungs of the TGFα mice compared to control mice. We analyzed the genes that were differentially expressed in fibrotic lungs to identify transcription factor-driven gene networks of lung mesenchymal cells that were selectively activated in TGFα mice compared to control mice using Ingenuity Pathway Analysis. The WT1-regulated gene network was markedly activated in the fibrotic lungs of TGFα mice (Fig1). WT1-network genes with the largest increases in Cluster 1 included IL10, MYCN, TERT, and THBS4, which are known to be involved in the maintenance of mesenchymal-cell proliferation and deposition of ECM proteins. To confirm increases in WT1-regulated genes, we quantified the transcripts for IL10, MYCN, TERT, and THBS4 using RT-PCR and observed significant in vivo increases in mice with TGFα overexpression for 4 wks.
· We determined the kinetics of in vivo WT1 expression in mice with TGFα overexpression versus normal lungs and observed a progressive increase in WT1 transcripts between Day 4 and Week 4 during TGFα-induced fibrosis (Fig 2A). We observed increased staining for WT1 in the nucleus of cells localized in the subpleural fibrotic lesions of TGFα mice on Dox at Weeks 2 and 4, but limited or no immunostaining in the lungs of control mice (Figure 2B). Further, we also found a significant
55

increase in WT1 transcripts in the lung mesenchymal cells isolated from fibrotic lesions in TGFα mice compared to control mice (Fig 2C). To assess whether WT1 was selectively expressed in lung-resident mesenchymal cells, we separated fibrocytes from lung-resident mesenchymal cells from the cultured lungs of CCSP/TGFα mice on Dox for 4 wks. We observed a significant increase in WT1 transcripts in the lung-resident mesenchymal cells compared to fibrocytes isolated from TGFα mice (Fig 2D).
· WT1-positive cells accumulate in the subpleural fibrotic lesions of human IPF: We assessed whether increased WT1 expression detected in the mouse model is a feature of fibrosis in human IPF by analyzing lung sections from patients with IPF and non-IPF patients. Double immunostainings on serial lung sections allowed us to visualize WT1-positive cells that co-express mesothelial (cytokeratin) and/or mesenchymal (vimentin) cell markers. In contrast to normal lung, IPF lung tissue exhibited prominent staining for WT1 in cells populated in the thickened subpleural areas of the lung (Fig 3B). The high-magnification images demonstrated that WT1 was localized in the nuclear regions of lung cells of IPF lungs, but there was limited or no WT1 staining in the normal non-IPF lungs (Fig 3A). In IPF lung tissues, the majority of mesothelial cells (cytokeratin-positive) were co-localized with WT1 in the nuclei, but their location was restricted to pleural surfaces with no staining
Fig 1. Overexpression of TGFα alters the network of genes regulated by Wilms tumor 1 during TGFα-induced pulmonary fibrosis. Ingenuity pathway analysis shows the network of genes regulated by Wilms tumor 1 during TGFα-induced pulmonary fibrosis. Shapes denote functional class of genes as indicated in the box with legends. Shapes filled with the colors red and green depict up and down regulated genes, respectively, in the lungs of TGFα mice compared to control mice. Solid and dashed lines depict direct and indirect interactions, respectively.
56
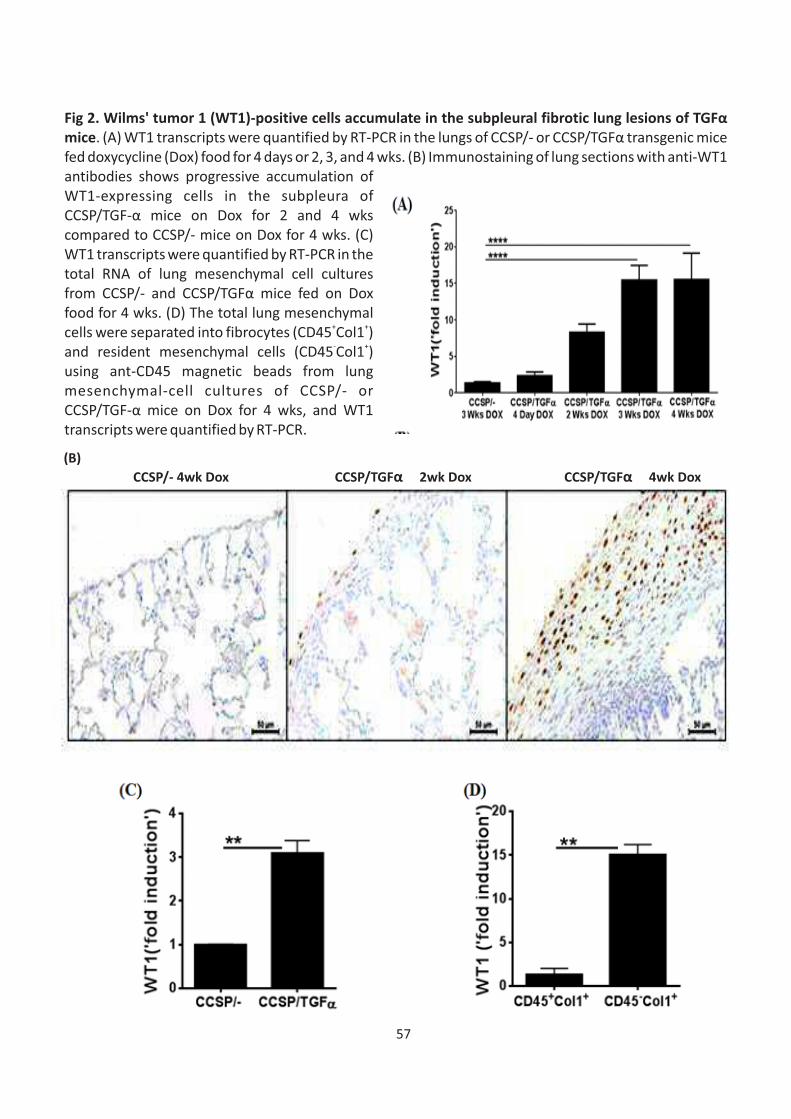
Fig 2. Wilms' tumor 1 (WT1)-positive cells accumulate in the subpleural fibrotic lung lesions of TGFαmice. (A) WT1 transcripts were quantified by RT-PCR in the lungs of CCSP/- or CCSP/TGFα transgenic mice fed doxycycline (Dox) food for 4 days or 2, 3, and 4 wks. (B) Immunostaining of lung sections with anti-WT1 antibodies shows progressive accumulation of WT1-expressing cells in the subpleura of CCSP/TGF-α mice on Dox for 2 and 4 wks compared to CCSP/- mice on Dox for 4 wks. (C) WT1 transcripts were quantified by RT-PCR in the total RNA of lung mesenchymal cell cultures from CCSP/- and CCSP/TGFα mice fed on Dox food for 4 wks. (D) The total lung mesenchymal
+ +cells were separated into fibrocytes (CD45 Col1 ) - +and resident mesenchymal cells (CD45 Col1 )
using ant-CD45 magnetic beads from lung mesenchymal-cell cultures of CCSP/- or CCSP/TGF-α mice on Dox for 4 wks, and WT1 transcripts were quantified by RT-PCR.
(B) CCSP/- 4wk Dox CCSP/TGFα 2wk Dox CCSP/TGFα 4wk Dox
57

58
for cytokeratin in the subpleural regions of IPF lungs (Fig 3B). However, the thickened subpleural region of the IPF lungs did display WT1-positive cells that co-localized with vimentin, but not cytokeratin (Fig 3B). Thus, the thickened pleura of IPF lungs, but not normal lung, had an accumulation of two major subsets of WT1-positive cells, where WT1 was expressed by both mesothelial and mesenchymal cells. Moreover, increased immunostaining for WT1 in both mesothelial and mesenchymal cells demonstrated overexpression of WT1 in IPF lungs.
· Fibrocytes do not transform into WT1-positive cells in pulmonary fibrosis: To further substantiate our findings that WT1-positive cells and fibrocytes are two distinct mesenchymal cell subsets that accumulate in vivo in subpleural fibrotic lesions, GFP-expressing BM cells were transferred into lethally irradiated recipient CCSP/- control and CCSP/TGFα mice. CCSP/- and CCSP/TGFα GFP chimera mice were then placed on Dox for 4 wks. For this study, lung sections from chimeric mice were immunostained for WT1 and vimentin to construct 3D images and count cells based on GFP, WT1, and vimentin expression. Consistent with our previous findings, we observed a significant increase in vimentin-positive cells in CCSP/TGFα chimera mice compared to CCSP/- controls on Dox for 4 wks (Fig 4A & 4B). More than 20% of cells vimentin positive cells were co-localized with WT1, suggesting that WT1-positive cells are a sizable subset of total lung-resident mesenchymal cells in the subpleural fibrotic lesions of TGFα mice (Fig 4C). Notably, WT1 staining was restricted to the nuclear regions of GFP-negative cells, and there also was no staining for WT1 in the GFP-positive fibrocytes. Together, our immunostaining results for WT1 demonstrated that WT1-positive cells and fibrocytes are two distinct subsets of the lung mesenchymal cells that accumulate in the subpleural fibrotic lesions of the TGFα mice compared to control mice.
· WT1-positive cells accumulate in the lung during bleomycin-induced fibrosis: To substantiate our hypothesis that WT1-positive cells accumulate in the fibrotic lungs, we developed an alternative mouse model of bleomycin-induced pulmonary fibrosis. As observed in the TGFα model, thickened lung pleura was associated with a significant increase in the number of WT1-positive cells. However, WT1 expression was restricted to the cells localized in the lung pleura during bleomycin-induced pulmonary fibrosis (Fig 5A & B). We also generated Tamoxifen-inducible double transgenic
CreERT2 CreERT2/+ mTmG/+ WT1 /ROSA26-loxP-stop-loxP-tdTomato mice (WT1 ROSA ) and used this genetic knock-in mouse model to identify genetic lineage of WT1-expressing cells. These mice express membrane red-fluorescent (''mT'') protein prior to Cre excision and membrane green-fluorescent (''mG'') protein following tomaxin-inducible CreERT2 activation. In support of our hypothesis, we observed increased GFP-expressing WT1-positive cells in the pleura of bleomycin-treated mice compared to saline-treated control mice (Fig 5C).
· Fibrocytes augment accumulation of WT1-positive cells in severe fibrotic lung disease: To determine whether fibrocytes influence accumulation of WT1-positive cells in the progressive expansion of fibrotic lung lesions, adoptive cell-transfer experiments were performed. Fibrocytes
+ +(CD45 Col1 ) were infused into the tail vein of CCSP/TGFα mice on Dox for 2 wks, and fibrotic lesions were assessed for the accumulation of WT1-positive cells at Day 7 after cell transfer. Transfer of fibrocytes resulted in significant increases in the number of WT1-positive cells in CCSP/TGFα mice compared with CCSP/- and CCSP/TGFα mice receiving saline (Fig 6A). Fibrocyte infusion resulted in a significant increase in the number of WT1-positive cells in CCSP/TGFα mice compared with CCSP/- and CCSP/TGFα mice receiving saline (Fig 6B). Pearson correlation with linear regression analysis indicated a linear correlation between increased subpleural thickness and WT1-positive cell
2accumulations in CCSP/TGFα mice infused with either saline or fibrocytes (Fig 5C; r =0.8198, P<0.005). Similarly, a linear correlation was observed between the number of WT1-positive cells in the lung subpleura and hydroxyproline levels.
· WT1 is a critical regulator of ECM gene expression by lung mesenchymal cells: To investigate WT1 expression in myofibroblasts that accumulate in the lung subpleura of human IPF lungs, dual staining for WT1 and αSMA (myofibroblast marker) were performed on lung sections from IPF and control non-IPF lungs. Consistent with no staining for WT1 in normal lungs, the control non-IPF lungs

Fig 3. Wilms' tumor 1 (WT1)-positive cells accumulate in the subpleural fibrotic lesions of lungs in patients with idiopathic pulmonary fibrosis (IPF). Mesothelial and mesenchymal cells are the major lung cell types that express WT1 in the subpleural fibrotic lesions of the human IPF lung. Serial lung sections from (A) non-IPF and (B) IPF patients were co-immunostained with antibodies against either cytokeratin (red, indicates mesothelial cells) and WT1 (brown) or vimentin (red, indicates mesenchymal cells) and WT1 (brown).
Non
-IPF
40X
20X
IP
F40
X
2
0X
A
B
59

Fig 4. Fibrocytes do not transform into Wilms' tumor 1 (WT1)-positive cells in the subpleural fibrotic lung lesions of TGFα Mice. (A) Lung sections from CCSP/- GFP and CCSP/TGFα GFP chimera mice fed doxycycline (Dox)-treated food for 4 wks were stained with antibodies for WT1 (white) and vimentin (red). The dashed box indicates the enlarged area. (B) Quantification of the total vimentin-positive cells in the subpleural regions of CCSP/- GFP chimera and CCSP/TGFα chimeric mice using Imaris version 7.2.3. (C) Quantification of the total WT1-positive cells from the subpleural regions of CCSP/- GFP chimera and CCSP/TGFα chimeric mice.
Fig 5. Wilms' tumor 1 (WT1)-positive cells accumulate in the lungs during bleomycin-induced pulmonary fibrosis. The lung sections were immunostained for WT1 antigen (brown), and the dotted box indicates the enlarged area. (B) The number of WT1-positive cells were quantified for each lung section in bleomycin- and saline-treated control mice.
CreERT2/+ mTmG/+(C) WT1 ROSA mice were injected intradermally with saline or bleomycin for 4 wks, and Cre-mediated recombination was induced by two doses of intraperitoneal Tamoxifen at Week 4. The dashed box in the 20X images indicates the area highlighted in the 60X images.
A CCSP/-GFP Chimera 4wk Dox
CCSP/-TGFα GFP Chimera 4wk Dox
B
60

stained negative for WT1 and had limited positive staining for αSMA in perivascular areas of the lung. In IPF lungs, WT1-positive cells were co-localized with cytoplasmic αSMA in the subpleural fibrotic lesions (Fig 7A). To investigate WT1 expression in myofibroblasts that accumulate in the lung subpleura of TGFα mice, dual staining for WT1 and αSMA were performed on lung sections from CCSP/- and CCSP/TGFα transgenic mice on Dox for 6 wks, when fibrosis was established. Consistent with no staining for WT1 in normal lungs, the lung pleura of CCSP/- mice stained negative for WT1 and also had limited staining for αSMA. In CCSP/TGFα mice, WT1-positive cells were co-localized with cytoplasmic αSMA in the subpleural fibrotic lesions (Fig 7B). Importantly, CCSP/TGFα mice at 6 wks on Dox showed two distinct populations of WT1-positive cells. In particular, elongated and spindle-shaped cells that were positive for both αSMA and WT1 were predominantly localized in the mature surfaces of the subpleural regions, whereas WT1-positive cells with limited or no staining for αSMA were localized in the subpleural lesions that interface with lung parenchyma in CCSP/TGFα mice (Fig 7B). Together, the immunostaining results suggest that WT1 is expressed by both myofibroblasts and vimentin-positive mesenchymal cells of the lung subpleura of CCSP/TGFα transgenic mice and human IPF lungs.
Fig 6. Adoptive cell transfer of fibrocytes augments accumulation of Wilms' tumor 1 (WT1)-positive cells in the subpleura of fibrotic lung lesions during TGFα-induced pulmonary fibrosis. (A) Immunostaining of lung sections with anti-WT1 antibodies (B) The number of WT1-positive cells per total cells in the lung pleura/sub-pleura was calculated by counting WT1-positive cells and total cells in pleura/sub-pleural regions from five representative images per animal from CCSP/- and CCSP/TGF-α mice. Data shown are means + SEM. (C) The correlation was calculated between the number of WT1-positive cells and subpleural thickness using Pearson correlation coefficient with linear regression
2analysis (r =0.8198; P<0.0001).
A CCS|P/- CCSP/TGFα CCSP/TGFα Saline Saline Fibrocytes
B C
+W
t1 C
ells
/Tot
al c
ells
+N
umbe
r of W
t1 C
ells
0.4
0.3
0.2
0.1
0.0
100
75
50
25
0
Pleural Thickness (mm)0 25 50 75 100CCSP/-
SalineCCSP/TGFα
SalineCCSP/TGFα
+ +CD45 Col1
61

· To assess whether increased WT1 expression is merely associated with or actually plays an important role in regulating ECM gene expression and contributing to fibrosis, we performed an in vitro knockdown of WT1 and assessed changes in ECM gene transcripts. We cultured the subpleural fibrotic lesions of human IPF lung or TGFα mice placed on Dox for 4 wks. Lung-resident
+mesenchymal cells (CD45─Col1 ) were separated from fibrocytes by negative selection using anti-CD45 magnetic beads. Thus isolated primary lung-resident mesenchymal cells were transfected with WT1 or control siRNA for 72 h, and ECM gene expression was analyzed by RT-PCR. WT1 transcripts were effectively depleted in cells transfected with WT1-specific siRNA compared to control siRNA (Fig 7C). The major ECM genes, collagen 1α, collagen 3α or collagen5 and FN1, were significantly decreased in human IPF or TGFα mice resident mesenchymal cells transfected with WT1-specific siRNA compared to control siRNA (Fig 7C).
A Non-IPF
IPF
62

SUMMARY In summary, this study demonstrates accumulation of WT1-positive cells in the lung subpleura during progressive pulmonary fibrosis. Further, adoptive transfer of fibrocytes augment WT1-positive cell accumulations, and this supports a unique association of fibrocytes in inducing severe fibrotic lung disease in mice. Our findings demonstrate a positive association between accumulation of WT1-positive cells and subpleural thickening and collagen deposition. Furthermore, attenuation of WT1 expression resulted in a significant decrease in ECM gene transcripts by lung-resident fibroblasts of both murine and human IPF. The findings of this study elicit new questions and address limitations in the previous paradigm that WT1 expression is limited to mesothelial cells and functions as a negative regulator of mesothelial-to-myofibroblast differentiation in IPF. Moreover, our current findings provide impetus for future studies to identify the role of WT1 in mesenchymal cell phenotypes of human IPF and also test possible therapeutic options that will disrupt the functions of WT1 and fibrocytes in pulmonary fibrosis. Overall, these results provide a novel insights into previously unrecognized roles for fibrocytes and WT1 in pulmonary fibrosis and the potential for these to be as useful therapeutics.
10. EXPRESSION AND INDUCTION OF SMALL HEAT SHOCK PROTEINS IN RAT HEART UNDER CHRONIC HYPERGLYCEMIC CONDITIONS
Diabetes has become a serious public health problem. The number of diabetic patients was 382 million people in 2013 and is expected to reach 592 million in 2030. Diabetic cardiomyopathy is a common complication of diabetes mellitus and is one of the most common causes of morbidity and mortality in diabetic patients. Diabetic cardiomyopathy is a major risk factor for developing myocardial dysfunction in diabetic patients in the absence of hypertension and coronary heart disease. Diabetes is associated with disturbed myofibrils, severe alterations in sarcomere microstructure and components of dystrophin associated protein complex. However, the pathophysiological insults for the development of diabetic cardiomyopathy are poorly understood. Though the cause of diabetic cardiomyopathy is not fully understood, oxidative stress, cardiac inflammation, lipid accumulation, cardiac fibrosis and apoptosis are considered to be the major mechanisms implicated in diabetic cardiomyopathy. Heat shock proteins (Hsp) are a group of proteins that accumulate in the cells after a variety of physiological, environmental and pathological stresses. Small Hsp (sHsp) are proteins with monomeric molecular mass ranging from 15 to 30 kDa and with a conserved α-crystallin domain. Mammals contain 10 sHsp: Hsp27/HSPB1, myotonic dystrophy kinase binding protein (MKBP)/HSPB2, HSPB3, αA-crystallin (αAC)/HSPB4, αB-crystallin (αBC)/HSPB5, Hsp20/HSPB6, cvHsp/HSPB7, Hsp22/H11/H2IG1/HSPB8, HSPB9 and sperm outer dense fiber protein (ODF)/HSPB10. Small Hsp acts as molecular chaperones by preventing aggregation or misfolding of proteins and allow their correct refolding under stress conditions. These proteins are also involved in several fundamental cellular processes like cytoskeletal architecture, intracellular transport of proteins and protection against programmed cell death. The heat shock response is mediated by a group of heat shock transcription factors (HSF). The mammals contain 3 different HSFs known as HSF1, HSF2 and HSF4. HSF1 is a major HSF, which mediates the regulation of several heat shock genes while HSF2 is involved in the differentiation and developmental processes. HSF4 is involved in the postnatal expression of Hsp. The phosphorylation status of sHsp is important for determining their chaperone activity and cytoprotective functions. Hsp27 is phosphorylated at serine positions 82 (S82), 72 (S72) and 15 (S15) while αBC at 59 (S59), 45 (S45) and 19 (S19). The p38 mitogen activated protein kinase (MAPK)/MAPK activated protein-2 is responsible for phosphorylation at S82,
63

S72, S15 of Hsp27 and S59 of αBC. While S45 of αBC is phosphorylated by p44/42 MAP kinase (ERK), kinase responsible for phosphorylation of S19 of αBC is unknown. Previously we have reported the elevated expression of α-crystallins, two prominent members of sHsp, in various tissues including heart in diabetic rats. Recently we have also observed induction of some members of sHsp family and their phosphoregulation in retina of diabetic rat model and lens of diabetic rat model. However, the effect of chronic hyperglycemia on expression of sHsp family members, kinase mediated phosphoregulation and their involvement in cytoskeletal protection and apoptosis in experimental diabetic heart has not been examined. In the present study, for the first time, we investigated the response of sHsp family members in chronic hyperglycemia and their translocation from cytosol to striated sarcomeres in cardiac myofibers and role in apoptotic cell death in diabetic rat heart. METHODOLOGYAnimal care and experimental conditions Three-month-old male WNIN rats with average body weight of 230 ± 14 g were used in the study. The control rats (n=10) received 0.1 M sodium citrate buffer, pH 4.5, as a vehicle, whereas the experimental rats received a single intraperitoneal injection of STZ (35 mg/kg bw) in the same buffer. At 72 hours after STZ injection, fasting blood glucose levels were monitored and animals with blood glucose levels > 150 mg/dL were considered for the experiment (n=10). Control and diabetic animals were fed with AIN-93 diet ad libitum. Body weight and blood glucose concentration of each animal were measured weekly. At the end of 12 weeks, rats were fasted overnight and sacrificed by CO2 asphyxiation. Institutional and national guidelines for the care and use of animals were followed, and all experimental procedures involving animals were approved by the Institutional Animal Ethical Committee (IAEC) of the National Institute of Nutrition.Quantitative real-time PCR (qRT-PCR) Total RNA was extracted from control and diabetic rat heart using Tri-reagent. Total RNA was reverse transcribed using High Capacity cDNA Reverse Transcription kit. Real-time PCR was performed in triplicates with 25 ng cDNA templates using SYBR green master mix with gene specific primers. Normalization and validation of data were carried using β-actin as an internal control and data were
-∆∆ctcompared between control and diabetic samples according to comparative threshold cycle (2 ) method as reported previously.Whole tissue lysate preparation Heart tissue (100-200 mg) was homogenized in TNE buffer (pH 7.5) containing 20 mM Tris, 100 mM NaCl, 1 mM EDTA, 1 mM DTT and protease inhibitors. Homogenization was performed on ice using a glass homogenizer and the homogenate was centrifuged at 14,000g and the protein concentrations were measured by Bradford reagent. Immunoblotting Equal amounts of protein were subjected to 12% SDS-PAGE and transferred to nitrocellulose membranes and incubated overnight at 4°C with specific primary antibodies. After washing with PBST, membranes were incubated with respective secondary antibodies conjugated to HRP. The immunoblots were developed using ECL detection kit and images were analyzed and quantitated. Detergent soluble assay For analyzing detergent solubility, heart tissue was homogenized in TNE buffer containing 0.5% TritonX. Homogenate was centrifuged at 14,000g at 4°C for 20 minutes. Following centrifugation, homogenate was separated as supernatant containing detergent soluble fraction and the pellet containing insoluble protein fraction. The pellet was washed with PBS, rehomogenized, sonicated and dissolved in Lammelli buffer and these samples were then analyzed by immunoblotting as described above.
64

Morphological analysis and immunohistochemistry The harvested tissue was immediately placed in 4% paraformaldehyde in phosphate buffer (pH-7.2), fixed overnight, embedded in paraffin blocks, and cut into 4 µm sections and used for Haemotoxylin and Eosin (H&E) staining, Masson's Trichome staining, immunostaining with specific antibodies, or terminal deoxynucleotidyl transferase (TdT) dUTP nick-end labeling (TUNEL) assay. TUNEL assay For TUNEL assay, an in situ Cell death detection kit was used according to the manufacturer's instructions. Briefly, the sections were deparafinized and rehydrated using xylene and ethanol gradings and permeablized using hot 0.1 M citrate buffer pH 6.0 and incubated with the TUNEL reaction mixture
ocontaining TdT and fluorescein labeled dUTP for 1 h at 37 C. Sections were mounted in medium containing DAPI and images were captured with a Leica laser microscope. For negative control, TdT was not included in the reaction mixture.Co-immunoprecipitation (Co-IP) Co-IP was carried out using Co-IP kit according to the manufacturer instructions. Briefly, heart was homogenized in TNE buffer containing 0.5% TritonX and homogenate was centrifuged at 14,000g at 4°C for 20 minutes. Following centrifugation, homogenate was separated as supernatant containing detergent-soluble fraction and the pellet containing insoluble protein fraction. The pellet was washed with PBS and solubilized in immunoprecipitation (IP) lysis. Anti-desmin or anti-αBC or anti-pS59-αBC antibodies were immobilized onto spin columns containing coupling resin. One mg of protein was precleared using control agarose resin slurry and centrifuged at 1000g for 1 min. The precleared protein
osample was added to spin column and incubated at 4 C overnight with gentle mixing. The spin column was centrifuged and washed 3 times with IP lysis/wash buffer and eluted with elution buffer. The samples were loaded onto SDS-PAGE followed by immunoblotting using anti-pS82-Hsp27, anti-αBC, pS59-αBC, anti-Bax, and anti-desmin antibody. RESULTS· Body weight, blood glucose and histology:
While the body weights of diabetic animals significantly decreased (178 ±2.87 g vs 334.1± 8.07g), the mean blood glucose levels of diabetic rats were significantly higher (390.1 ± 48.7 mg/dL vs 91.5±6.17 mg/dL) when compared with control rats. Hematoxylin and eosin (H&E) staining of the diabetic heart showed structural abnormalities such as perinuclear vacuolization, increase in interstitial space between cardiac myofibrils and disarrayed myofibrils when compared with controls (Fig 1A) whereas Masson's Trichome staining showed increased interstitial fibrosis in diabetic heart when compared with controls (Fig 1B).
· Altered expression of sHsp: Out of 10 sHsp analyzed, we could detect Hsp27, MKBP, HspB3, αBC, Hsp20, cvHsp and Hsp22 (Fig 2A and 3A). The MKBP levels were significantly increased both at and protein level under chronic hyperglycemic conditions (Fig 2A and 3A). The HspB3 levels were also significantly increased at mRNA and protein level when
Fig 1. Morphology of control and diabetic rat heart. Panel A: H&E staining. Arrow 'a' indicates perinuclear vacuolization; arrow 'b' indicates increase in interstitial space between cardiac myofibers. Panel B: Masson's Trichome staining. Arrow 'c' indicates fibrosis area stained in blue
Control DiabetesA
B
65

compared with control. While αBC levels were also significantly increased both at mRNA and protein, Hsp20 levels were significantly decreased at mRNA and protein level in diabetic rats (Fig 2A and 3A). However, Hsp27, cvHsp and Hsp22 levels were unaltered in diabetic rats when compared with controls (Fig 2A and 3A). Under stress conditions, sHsp act synergistically with the stress-induced Hsp70 in protecting cells. Hence, we have also analyzed the expression of Hsp70. Interestingly; the Hsp70 levels were significantly decreased under chronic hyperglycemic conditions (Fig 3A).
· Decreased expression of HSF: Since the chronic hyperglycemia led differential expression of some sHsp (MKBP, HspB3, αBC), the expression of regulatory proteins of heat shock response including HSF1, HSF2 and HSF4 were examined by quantitative RT-PCR and immunoblotting (Fig 2B and 3B). Surprisingly, the expression levels of HSF1 were significantly decreased both at mRNA whereas no changes in the HSF2 at mRNA and protein levels were observed when compared with controls (Fig 2B and 3B). However, HSF4 protein was not detected in control and diabetic rats (Fig 3B).
Fig 2. Expression of sHsp (Panel A) and HSFs (Panel B) in heart of control and diabetic rats by qRT-PCR
· Kinase mediated phosphoregulation of Hsp27 and αBC: Chronic hyperglycemia significantly decreased the pS82-Hsp27 and pS59-αBC levels whereas increased the pS45-αBC levels but the pS19-αBC levels remained unaltered (Fig 4A). While the S82 of Hsp27 and S59 of αBC are phosphorylated by p38MAPK, S45 of αBC is phosphorylated by p44/42 MAPK. Therefore, we assessed the activation of p38MAPK and p44/42 MAPK by immunoblotting. Though, chronic hyperglycemia did not affect the levels of p38MAPK and p44/42 MAPK it significantly increased the levels of p-p38MAPK, p-p44 and p-p42 MAPK (Fig 4B).
· Translocation of pS82-Hsp27 and pS59-αBC from soluble to insoluble fractions: Although, under hyperglycemia, levels of pS82-Hsp27 and pS59-αBC were found to be decreased in soluble fraction, they were translocated from detergent-soluble (cytosol) to detergent-insoluble (cytoskeletal) fraction (Fig 5A). Hence, the total (detergent-soluble and detergent-insoluble) pS82-Hsp27 and pS59-αBC levels were significantly high in diabetic heart. Levels of desmin were increased in detergent-soluble fraction and also translocated to detergent-insoluble fraction (Fig 5A). Moreover, co-immunoprecipitation studies have also shown the strong interaction of pS82-Hsp27 and pS59-αBCwith desmin (Fig 5B).
· We have also investigated the translocation of phosphorylated sHsp from cytosol to striated sarcomeres by immunofluorescence. The intense staining of pS82-Hsp27 and pS59-αBC at striated sarcomeres in diabetic heart when compared to control indicates the translocation from cytosol to striated sarcomeres under hyperglycemic conditions (Fig 6A-B).
· Chronic hyperglycemia impairs αBC interaction with proapoptotic protein Bax: We analysed the apoptotic cell death under chronic hyperglycemic conditions in heart. The TUNEL-positive cells were significantly higher in diabetic heart (Fig 7A) when compared with control. Chronic hyperglycemia
66

significantly increased the expression of Bax and cleaved caspase-3 whereas decreased the Bcl-2 levels when compared with the control (Fig 7B). Interestingly, the interaction of αBC and pS59-αBC with Bax was reduced in diabetic heart when compared with controls (Fig 7C & D).
Fig 3. Expression of sHsp and HSFs in heart of control and diabetic rats by immunoblotting. Panel A:Representative immunoblots of sHsp and respective quantitative bars demonstrating the sHsp levels. Panel B: Representative immunoblots of HSF and respective quantitative bars demonstrating the HSF levels.
Hsp27
MKBP
HspB3
αBC
Hsp20
Hsp22
Hsp70
Actin
A
Cont
rol
Diab
etes
Cont
rol
Diab
etes
27kDa
20kDa
17kDa
20kDa
17kDa
22kDa
72kDa
42kDa
B
HSF1
HSF2
HSF4
Actin
83kDa
60kDa
55kDa
42kDa
67

Fig 4. Kinase mediated phosphoregulation of Hsp27 and αBC in heart of control and diabetic rats. Panel A: Representative immunoblots of phosphorylated Hsp27, αBC and respective quantitative bars demonstrating the phosphorylated Hsp27, αBC levels in heart of control and diabetic rats. Panel B: Representative immunoblots of p38MAPK, p-p38MAPK p44/42MAPK, p-p44/42MAPK and respective quantitative bars demonstrating the p38MAPK, p-p38MAPK, p44/42MAPK, p-p44/42MAPK levels in heart of control and diabetic rats.
68

Fig 5. Panel A: Translocation of pS82-Hsp27, pS59-αBC from soluble (cytosol) to insoluble (cytoskeleton) fraction. Panel B: Interaction of sHsp with sarcomere marker desmin as analysed by co-immunoprecipitation in insoluble fractions of control and diabetic rat heart. IB, immunoblotting antibody; IP, immunoprecipitation; IP (-), no antibody control immunoprecipitation
Fig 6. Immunofluorescence of pS82-Hsp27 and pS59-αBC in control and diabetic heartPanel A: Tissue sections of control (a, b, c, d) and diabetic (a', b', c', d') heart were labeled with pS82-Hsp27 antibody (a), DAPI (b), merged (c) and at higher magnification (d). Panel B: Tissue sections of control (a, b, c, d) and diabetic (a', b', c', d') heart were labeled with pS59-αBC antibody (green; a), DAPI (blue; b), merged (c) and at higher magnification (d). Arrows represent pS82-Hsp27 and pS59-αBCstaining at sarcomere striations in diabetic heart.
69

Fig 7. Apoptotic cell death in heart of control and diabetic rats. Panel A: Apoptosis is detected by TUNEL staining of tissue sections of control (a, b, c) and diabetic heart (a', b', c'). The green stain indicates the apoptotic cell death and blue stain (DAPI) indicates nuclei. Bars demonstrating the number of TUNEL-positive cells in control and diabetic heart. Panel B: Representative immunoblots of Bax, Bcl-2 and cleaved caspase-3 and respective quantitative bars demonstrating the Bax, Bcl-2 and cleaved caspase-3 levels in heart of control and diabetic rats. Interaction of αBC (Panels C) and pS59-αBC (Panels D) with Bax as analysed by co-immunoprecipitation. Chronic hyperglycemia reduced the interaction of αBC and pS59-αBC with Bax in rat heart. IB, immunoblotting antibody; IP, immunoprecipitation; IP (-), no antibody (control immuno-precipitation).
SUMMARY Differential expression of sHsp family members in a comprehensive manner and site specific phosphorylation of αBC under chronic hyperglycemia were reported. The results also suggest that sHsp may have tissue-specific function while fulfilling general purpose under various stress conditions. Members of sHsp family may express either acutely or indistinctly and may act individually or in a concert to enable cells to resist stress conditions. Together the results suggest induction, phosphorylation, translocation of sHsp in diabetic cardiomyopathy and further studies are required to ascertain their role in cell death.
70

11. ASSESSMENT OF SUBCLINICAL MICRONUTRIENTS STATUS AND NON-COMMUNICABLE DISEASES OF URBAN GERIATRIC POPULATION: A POPULATION BASED CROSS-SECTIONAL STUDY (PILOT STUDY)
Population ageing is the most significant result of the process known as demographic transition. Demographic changes influence health, economic activity and social condition of people. There has been a steady increase in the proportion of the elderly population in both developed and developing countries during the last few decades due to increased longevity. In India the proportion of elderly people were increased from 7.7% in 2001 to 8.2% by 2011. This increased longevity is associated with burden of several chronic non-communicable age-related diseases like hypertension, diabetes, cardiovascular, cancer, neurodegenerative diseases etc. and majority of them are nutrition related. WHO also identifies the six leading risk factors (Tobacco use, Physical inactivity, Overweight/obesity, High blood pressure, High cholesterol levels, High blood glucose levels) that are associated with non-communicable diseases as being the leading global risk factors for death (Global health risks: WHO, 2009). Nutrition has been recognized as an important factor in influencing the functional outcome of ageing and ageing also has an important effect on nutritional status. In general most of the elderly people are at increased risk for micronutrient deficiencies. Nutrition status can be affected by a number of age associated physiological factors and many age-related diseases. Nutritional status has been found to be a valuable determinant of quality of life as well as morbidity and mortality. For example; many micronutrients are commonly altered in various degenerative diseases. However, the nutritional status of the older population in low-income countries, including India, seldom receives the level of research focus that is warranted. In India, the data on nutritional status of the elderly in terms of anthropometry, clinical assessment and dietary pattern is available from different surveys carried out by National Nutrition Monitoring Bureau (NNMB) and most of them are on rural population. The limited studies on health and micronutrient status of elderly people in various parts of our country are hospital based studies. However, there was no data on sub-clinical micronutrient status in urban elderly population and their association with age related disorders like anemia, diabetes, obesity, hypertension, and dyslipidemia are not available in southern part of India. Therefore, assessment of health and micronutrient status of geriatric population is essential to undertake appropriate interventions particularly of health and nutrition education (HNE) to improve the quality of life, healthy and active ageing. Based on this background the following objectives were framed for this study.OBJECTIVES· To assess the multiple micronutrient status of urban geriatric population.· To assess the prevalence of non-communicable diseases among the urban geriatric population.· To study the correlation between micronutrient deficiencies and non-communicable diseases
among elderly.METHODOLOGY A community based cross-sectional study was carried out among urban elderly in Hyderabad and Secunderabad. Subjects with age 60 years and above were recruited for this study with the approval of the Institutional Ethics Committee. Total 298 individuals (194 men & 104 women subjects) were recruited for this study.Data Collection: After obtaining an informed consent from the study subjects, a pre-tested study questionnaire was filled for majority of participants. This questionnaire included age, gender, type of family, education, dietary pattern, physical activity, smoking, alcohol intake etc. We have also collected information on history of non-communicable diseases (NCDs) like diabetes, hypertension, cardio vascular diseases, dyslipidemia, cancer, cataract etc.
71

Anthropometric measures: Anthropometric measures such as height, weight, waist and hip circumference were measured using appropriate standard equipment. Weight was measured nearest to 100 g using a SECA digital weighing scale with subjects wearing minimum clothing. Height was measured with accuracy of 0.1cm using an anthropometric rod/Stadiometer (SECA). Hip and waist circumference was measured nearest to 0.1cm using SECA (201) circumference tape. Body Mass Index (BMI) was calculated as weight (kgs) divided by height in meters square. The WHO recommended BMI cut-off values for Asian adults were used to classify overweight and obesity, while the WC cut-off values of 90cm and 80cm were considered for men and women respectively for abdominal or central obesity. Blood pressure (BP): Blood pressure was measured thrice at five-minute interval on left arm using Omron (7130) BP apparatus. Elderly with systolic BP of 140 mmHg and/or diastolic BP of 90 mmHg and/or those on medication for high BP were considered as hypertensive. Elderly people with systolic BP of <120mmHg and /or diastolic BP <80mmHg was considered as normal; whereas elderly people with systolic BP between 120-139mmHg and diastolic BP between 80-89mmHG were considered as pre-hypertensive. The prevalence of metabolic syndrome was calculated as per IDF criteria. Blood sample collection and processing: After completion of Anthropometric measurements, fasting blood samples were collected from majority of study subjects in heparinized tubes and plasma samples
0were separated and kept in -80 C for the following biochemical analysis. The prevalence of metabolic syndrome was calculated using IDF criteria after estimation of individual plasma lipids.Fasting blood glucose: Fasting glucose was measured immediately after separation of plasma by GOD-POD method using kit (Biosystems).Lipid profile: Lipid profiles (Triglycerides, Cholesterol and HDL) were estimated by kit methods (Biosystems). Whereas LDL was calculated using the Friedewald equation as given below: LDL = TC - HDL - TG/5.0 (mg/dL).Hemoglobin (Hb): Hemoglobin was estimated by Cyanmethemoglobin method.Vitamins and Minerals: Vitamin B12, folic acid, Vitamin D were measured by Radio Immuno Assay (RIA) methods. Vitamin A (retinol) was measured by HPLC, whereas, Zn was estimated by AAS method. Homocysteine was measured by ELISA (Cell Biolabs, San Diego, USA).Definition for diagnosing dyslipidemia: Triglyceride, HDL-C and Total cholesterol (TC) levels were used as parameters for diagnosing dyslipidemia. Plasma triglycerides ( 150 mg/dL); HDL-C (≥ <40 mg/dl for men and <50 mg/dl for women) and TC (≥200 mg/dl) as listed in NCEP guidelines (NECP, 2001).Statistical analysis: One way anova analysis was done to compare the mean values and p <0.05 considered as significant. To study the association between the micronutrient deficiencies with NCDs, chi-square test was used. RESULTS· Socio demographic particulars: The socio demographic particulars were presented in Table-1. Total
number of subjects recruited for this pilot study was 298 (194 male and 104 female) and their mean age was 66.68±0.34 years. Majority of urban elderly people were living in pucca houses most of the families are nuclear. In this study we found nearly 30% of the study subjects were graduates followed by intermediate in their educational status. Whereas the dietary habits of these subjects indicated that majority of them are non-vegetarians (mixed diet).
· The anthropometric particulars presented in Table-2 indicate that, there was a gender difference in Height, Weight, BMI, WC and HC.
· The clinical profile of the elderly subjects was given in the Table-3. The mean SBP and DBP were 134.52±1.127 (mmHg) and 81.42 ±0 .637 (mmHg) respectively. Whereas the mean fasting glucose and hemoglobin levels of these subjects were 110.26±3.03 mg/dl and 14.15±0.14g/dl respectively. The mean TG, TC, HDL levels of these subjects was 123.89±4.29 (mg/dl), 158.49±2.34 (mg/dl), 38.87±0.62 (mg/dl) respectively and there was gender difference in these parameters.
72

· Prevalence of micronutrient deficiencies: The prevalence of subclinical micronutrient deficiencies of urban elderly people was presented in Table-5. The prevalence of vitamin B12 and folic acid among urban elderly people was 36% and 8.2% respectively. The prevalence of vitamin B12 deficiency is significantly (p<0.006) high in males, However, the prevalence of hyperhomo-cystenemia was 24.3%. Interestingly, the prevalence of vitamin D among elderly people was high (56.3%) when compared with other vitamins. As expected, there was no vitamin A deficiency in elderly people. Whereas the prevalence of zinc deficiency was 17.1%.
Table 1. Socio Demographic Particulars of the subjects
Variable Number/ mean ± SE or (%)
Total number of subjects n=298 (100%)Male n=194 (65.1%)Female n=104 (34.9%)Age (years) 66.68±0.34Type of house (n=262)Pucca 258 (98.5%)Semi pucca 3 (1.1%)Kutcha 1 (0.4%)Type of Family (n=262)Nuclear 163 (62.2%)Extended nuclear 38 (14.5%)Joint 61 (23.3%)Food habits (n=261)Vegetarian 101 (38.7%)Non-vegetarian 160 (61.3%)Education (n=261)Illiterate 29 (11.1%)Read and write 7 (2.7%)Primary 18 (6.9%)Secondary 45 (17.2%)Inter 52 (19.9%)Graduate 81 (31%)Post graduate 29 (11.1%)
Table 2. Anthropometric variables of elderly study subjects
Variables Men Women Total
Height (cm)
164.87±0.47
(n=189)
151.98±0.68
(n=99)
160.44±0.53
(n=288)
Weight( kg)
68.78±0.77
(n=189)
62.53±1.072 (n=99)
66.63±0.65
(n=288)
BMI (kg/m2)
25.26±0.24
(n=189)
27.03±0.41
(n=99)
25.87±0.22
(n=288)
WC( cm)
93.26±0.74
(n=188)
89.73±0.95
(n=97)
92.06±0.59
(n=285)
HC(cm)
95.81±0.73
(n=172)
102.75±0.98
(n=86)
98.13±0.62
(n=258)
All values are mean ± SE
Table 3. Biochemical and Clinical profile of urban elderly subjectsVariables Men Women Total
SBP 133.82±1.30, (n=194) 135.82±2.13, (n=104) 134.52±1.13, (n=298)DBP* 80.34±0.78, (n=194) 83.45±1.03, (n=104) 81.42±0.64, (n=298)FBS(mg/dl) 111.12±3.47 (n=186) 108.56±5.87, (n=97) 110.25±3.03, (n=283)Hb(g/dl) 14.54±0.16, (n=186) 13.4±0.23, (n=97) 14.15±0.14, (n=283)TG(mg/dl) 119.47±5.35, (n=186) 132.44±7.13, (n=96) 123.89±4.3, (n=282)TC(mg/dl) 150.21±2.77, (n=186) 174.36±3.82, (n=97) 158.49±2.34, (n=283)HDL(mg/dl) 37.07±0.73, (n=186) 42.31±1.06, (n=97) 38.87±0.62, (n=283)LDL(mg/dl) 89.24±2.51, (n=186) 103.44±3.29, (n=97) 94.11±2.03, (n=283)
SBP: Systolic blood pressure; DBP Diastolic blood pressure; All values are mean ± SE. *Significant (p<0.05) gender difference in DBP.
73

· Prevalence of NCDs and other metabolic disorders: The prevalence of Diabetes, Hypertension, over weight and Obesity in these subjects were 51.9%, 67.8%, 46.2% and 31.6% respectively (Table-2). As expected, the prevalence of CED was very low (2.1%) in urban elderly subjects. Whereas the prevalence of Central Obesity was 61.8% which was significantly (p<0.002) high in males when compared to females. The prevalence of Dyslipidemia was very high (76.8%) and this was significantly (p<0.004) high in female subjects when compared to males. Whereas the prevalence of metabolic syndrome and Cataract in these elderly subjects was 51.1% and 36% respectively (Table-2).
· Association between micronutrient deficiencies and NCDs: There was significant (p<0.05) association between vitamin D deficiency with HT,BMI, MS and there was also a significant (p<0.05) association between Zn deficiency with HT. Interestingly hyperhomocystenemia was significantly (p<0.05) associated with Anemia.
Table: 4. Micronutrient deficiencies among urban elderly subjects
Name of the Micronutrient Overall deficiency Deficiency in
MalesDeficiency in
Females
Vitamin B12 (pg/mL)* 36.5% (<200pg/ml), (n=100) 42.4%(n=75) 25.8%(n=25)Folic acid (ng/mL) 8.3% (<4ng/ml), (n=23) 8.2%(n=15) 8.4%(n=8)Hyper homocystine 24.3% (>12µmol/l) (n=58) 21.4%(n=33) 29.4%(n=25)Vitamin D (ng/mL) 56.3% (<20ng/ml) (n=161) 107(57.2%) 54(54.5%)Zn (µmol/l) 17.1%(<10.7µmol/l) (n=48) 18.4%(n=34) 14.6%(n=14)
All values are mean ± SE. *Significant (p<0.05) gender difference in vitamin B12.
Table 5. Prevalence of NCDs in urban elderly people
Disease Prevalence (n) Males FemalesAnemia (n=282) 20.60%,(n=58) 21%,(n=39) 19.8%,(n=19)Diabetes (n=285) 51.9%, (n=148) 54.00%, (n=101) 48.00%, (n=47)Hypertension (n=298) 67.8%, (n=202) 67.0%, (n=130) 69.2%, (n=79)CED (n=288) 2.10%, (n=6) 2.1%, (n=4) 2.00%, (n=2)Overweight (n=288) 46.2%, (n=133) 50.3%, (n=95) 38.4%, (n=38)Obesity (n=288) 31.6%, (n=91) 24.3%, (=46) 45.5%, (n=45)Central obesity, (n=285)* 61.8%, (n=176) 68.1%, (n=128) 49.5%, (n=48)Dyslipidemia (n=281)# 76.8%, (n=219) 71.7%,(n=134) 86.7%,(n=85)Metabolic syndrome (n=282) 48.90%,(n=138) 52.7%,(n=98) 41.7%,(n=40)Cataract (n=261) 36%,(n=94) 38.7%,(n=67) 30.7%,(n=27)
#CED: Chronic energy deficiency; Prevalence of NCDs among urban elderly and there was a significant *(p<0.002); (p<0.004) gender difference in central obesity and dyslipidemia.
74

12. EFFECT OF LONG-TERM PRE-DIABETES ON RISK OF RENAL, RETINAL AND LENS ABNORMALITIES: BIOCHEMICAL MECHANISMS AND ROLE OF DIETARY AGENTS
Pre-diabetes is an early stage of diabetes and is associated with impaired fasting glucose (IFG), impaired glucose tolerance (IGT) or both. IGT and IFG are also associated with insulin resistance and metabolic syndrome. Individuals with IGT or IFG are at substantially increased risk of developing type-2 diabetes (T2D). Several epidemiologic studies indicate that the micro vascular diseases typically associated with diabetes are also observed in individuals with IGT/ IFG even before development of hyperglycemia. The most commonly associated vascular complications with pre-diabetes include myocardial infarction, stroke, neuropathy, nephropathy, retinopathy, CVD, micro-albuminuria and also other complications like cataract. Diabetic nephropathy (DN) is an important vascular complication affecting about 20% of diabetic people in India. Though diabetes, hypertension and metabolic syndrome are the major risk factors, in recent years it has been reported that there is an association of pre-diabetes with nephropathy. Diabetic retinopathy (DR) is one of the most common microvascular complications and is the leading cause of severe vision loss in working-age group people. Similarly, cataract is an early complication of diabetes which is also associated with pre-diabetic subjects. Several epidemiological studies have shown an association of IGT, IFG or pre-diabetes and metabolic syndrome in aged people with different types of cataracts. Nevertheless, there are no studies to explain experimental basis of pre-diabetes induced renal, retinal and lens abnormalities and associated mechanisms. Activation of polyol pathway, increased intracellular non enzymatic glycation and oxidative stress are some of the major mechanisms linked to various long-term complications in frank hyperglycemic or diabetic state including DN, DR and cataract. However associations of these pathways in pre-diabetes induced complicatios are not known. Hence, there was a need to understand how pre-diabetes condition can cause renal, retinal and lens abnormalities in experimental animal models not only to understand the molecular basis of these complications but also to plan strategies for the prevention or delay by appropriate dietary and nutritional intervention. Therefore, this study was planned with the following objectives.OBJECTIVESŸ To study the effect of pre-diabetes on risk of renal, retinal and lens abnormalities.Ÿ To study biochemical and molecular mechanisms associated with these complicationsŸ To study the effect of dietary agents to prevent or delay of these complications. Earlier, neonatal streptozotocin (nSTZ) pre-diabetic model was established in SD rats and these rats maintain IGT/pre-diabetic state for a longer period. High fructose or high fructose & high fat induced rat model is another well known models were used for study of metabolic syndrome, insulin resistance, IGT or pre-diabetes. In the present study these two models were used to study effect of long-term pre-diabetic state on development of retinal, lens and renal abnormalities. Dietary agents: There are many dietary agents with aldose reductase inhibition, antiglycating, antioxidant and also hypoglycemic properties. Bitter gourd (BG) and Garlic are two among them and we studied protective role of these dietary agents on pre-diabetes induced retinal, lens and renal abnormalities using above two animal models.METHODOLOGYExperiment 1: Protective role of bitter gourd on pre-diabetes induced retinal, lens and renal abnormalities in neonatal-streptozotocin (nSTZ) induced pre-diabetic model: Two-day old male SD rat pups (n=30) obtained from the National Center for Laboratory Animal Sciences, National Institute of
75
Nutrition, Hyderabad, were injected with STZ at the dose of 90 mg/kg body weight i.p. dissolved in 0.1M citrate buffer, pH 4.5. Control pups (n=10) received only vehicle. These pups were weaned after 21 days and maintained on AIN-93G/M diet in individual cages. Monthly fasting and postprandial glucose levels were monitored from the age of one month. Oral glucose tolerance test (OGTT) was performed at two months after STZ injection. Rats with impaired glucose tolerance (IGT) (2h glucose between140-200 mg/dl) and impaired fasting glucose (fasting glucose between 110-125mg/dl) or IFG were considered as pre-diabetic and divided into two groups; untreated pre-diabetic (n=11) and Pre-diabetic group animals fed with 5% BG (n=11) in the AIN-93 diet for eleven months. OGTT was conducted before termination of the experiment. Experiment 2: Ameliorating effect of garlic on pre-diabetes induced retinal, lens and renal abnormalities in high fructose fed WNIN rats: Two-months old WNIN rats obtained from the National Center for Laboratory Animal Sciences, National Institute of Nutrition, Hyderabad, were maintained on AIN-93 diet alone (control group; n=9) or AIN-93 diet supplemented either with 56% fructose (HF group, n=9); or high fructose with garlic (56% fructose and 3% garlic or HF+G group; n=9) or high fructose (34%) and high fat (22%) (HFHF group; n=6). Oral glucose tolerance test (OGTT) was performed after three months to conform development of pre-diabetes. OGTT was conducted before termination of the experiment. Daily food intake and monthly body weights were measured. Fasting and postprandial glucose were measured every month by glucose strips (OneTouch Horizon). At the end of each experiment, animals were sacrificed by CO asphyxiation. Retina, lens and kidneys were collected; snap frozen and stored at -2
080 C for further analysis. Some eye balls and kidneys were used for histology and immunohistochemistry. A set of eye lens were used for organ culture studies.Oral glucose tolerance test (OGTT) : This test was performed on overnight fasted rats by administering glucose orally at a dose of 2.0 g/kg body weight. Blood samples were collected at 0, 30, 60, and 120 min. Plasma glucose and insulin concentrations were measured using GOD-POD (BioSystems) kit and RIA (BRIT-India) respectively.Homeostasis model assessment for Insulin resistance (HOMA-IR): Insulin resistance was assessed using the equation: HOMA-IR = [fasting plasma glucose (mg/dl) × fasting plasma insulin (μU/ml)/2,430] for small animals.Electroretinograms (ERG): Development of retinal functional abnormality in these rats was assessed using ERG. Animals were dark adapted for overnight, pupil was dilated with atropine eye drops and rats were anesthetized. Before performing ERG, a positive electrode was placed on the cornea of the eye, reference electrode on the ear and a ground electrode on a tail of the animal. ERG recordings were performed with a UTAS Visual Diagnostic System. A scotopic and photopic responses were recorded using
-5 2 a series of flash stimuli from 10 to 25cd-s/m (-50 dB to +10 dB) using Ganzfeld system (BigShot). The responses were amplified with UBA-4204 Amplifier and analyzed with EM for windows software. Oscillatory potentials (OPs) were calculated using same photopic and scotopic amplitudes between -2 to 10dB. Mean ERG values of each eye were calculated, and this resultant value was used to compute the group means of a- wave, b-wave amplitudes as well as for Ops.Lens abnormalities/cataract: Lens abnormalities/cataract was monitored by slit lamp (Kowa SL-15 Portable, Japan) examination of eyes after dilation of pupils.Lens organ culture study: Since the pre-diabetic animals not developed any lens abnormalities by the end of each experiment, a set of lenses were cultured in modified TC199 medium in the presence of 55mM glucose for a period of four days and images were represented for four day culture period.
76

Renal abnormalities: Renal abnormalities were assessed by measuring creatinine, albumin, urea in urine (collected in metabolic cages for 24h) and also in plasma using kits (BioSystem). Based on these values GFR was calculated.
Lens protein content: A 10% homogenate was made from 3 to 5 pooled lenses in 50 mM phosphate buffer, pH 7.4. Before centrifugation, a set of aliquots were made for estimation of total protein, thiobarbituric acid reacting substances (TBARS)/ malondialdehyde (MDA) and sorbitol. The remaining total homogenate was centrifuged at 10,000 ×g for 30 min at 4°C. The supernatant was referred to as the soluble fraction. Total and soluble protein content was estimated with the Lowry method, and the percentage of soluble protein was calculated.
Oxidative stress in lens: Lens lipid peroxidation was measured as thiobarbituric acid reacting substances (TBARS) as reported earlier.
Estimation of sorbitol and aldose reductase (AR) activity in lens: AR activity and sorbitol in lens were estimated as described previously.
Histology: For histological studies, eye balls and kidneys were dissected out and fixed in 4% paraformaldehyde followed by paraffin sections and stained with hematoxylin and eosin staining. Retinal and kidney morphology was examined under the microscope.
Immunohistochemistry (IHC): Expression of aldose reductase (AR), vascular endothelial growth factor (VEGF), glial fibrillary acidic protein (GFAP), carboxymethyl-lysine (CML-KLH), 4-hydroxy-2-nonenal (4-HNE) in retina, was done by immunohistochememistry using specific polyclonal antibodies.
Molecular analysis: Genes implicated in retinal structural and functional integrity such as VEGF, GFAP, ARand rhodopsin at mRNA level were studied by real-time PCR and western/immuno blotting methods.
Quantitative Real-Time PCR: Total RNA was extracted from whole frozen retina tissues using Trizol reagent. The isolated RNA was purified using RNeasy mini kit (Qiagen). The concentration of total RNA was quantified by Nanodrop by measuring the optical density at 260 and 280nm. Total RNA was immediately subjected to reverse transcription by using cDNA Synthesis Kit (bioline). Quantitative real-time PCR was then performed using 20ng of cDNA template using SYBR green master mix with gene specific primers. The target gene expression values were normalized to the housekeeping gene (beta actin). Relative change in mRNA expression was calculated by use of the ∆∆CT values.
Immunoblot analysis: Whole retinas or kidneys were homogenized in phosphate-buffer (pH 7.2) 0followed by centrifugation at 10,000g/10 minutes at 4 C and the supernatants were used as total protein.
Protein in these samples was estimated by the Lowry method. For immunoblot analysis, 50-150μg of total protein of either retinal or kidney samples were subjected on 12% SDS-PAGE. After electrophoresis, proteins were electrophoretically transferred onto nitrocellulose membranes and immunoblotting was performed with individual primary polyclonal antibodies of 4-HNE, AR, VEGF, GFAP and CML-KLH, for retina samples, whereas, primary polyclonal antibodies of nephrin and podocin for kidney samples. This was followed by blocking with skimmed milk powder (V/W). After washing, these blots were incubated with HRP conjugated secondary antibodies (anti-mouse for VEGF, beta actin, nephrin and podocin; anti-rabbit for AR, CML-KLH, GFAP and anti-goat for 4-HNE). These immunoblots were then developed using chemiluminescence detection kit. Protein expression levels were then quantitated relative to beta actin in the same sample.
77

Fig 1. Bitter gourd had shown hypoglycemic property. Fasting (A), postprandial glucose (B) during the experiment; Glucose and Insulin response during OGTT at the end of the experiment (panel C&D).
Values are mean±SD, n=9-11 per group, *p<0.05.
RESULTS
Protective effect of bitter gourd (BG) on pre-diabetes induced retinal, lens and renal abnormalities in nSTZ induced pre-diabetic model
Food intake, body weights, fasting and postprandial glucose: As reported earlier, intraperitoneal injection of STZ at a dose of 90mg/kg body weight to two day old SD rat pups developed only IGT associated pre-diabetes by two months after STZ injection. Though there was marginal difference in fasting glucose, postprandial glucose levels were higher in IGT/pre-diabetic rats when compared to controls (Fig 1A). Feeding of BG had no effect on fasting glucose; but showed hypoglycemic property by lowering postprandial glucose (Fig 1B) as well as 2h glucose levels during OGTT at the end of the experiment (Fig 1C). There was no difference in daily food intake (gram/rat/day) between control (19.62± 2.83g) and pre-diabetic group (20.26±3.07g) rats, but the body weights of IGT/pre-diabetic rats are slightly lower (440±48g) than the controls (470±29g) by the end of the experiment. Feeding of BG had lowered food intake (18.66± 3.32g) but no effect on body weights (433±36g).
120
100
80
60
40
20
0
Fast
ing
Gluc
ose
(mg/
dl)
2 months 6 months 11 monthsDuration
2 months 6 months 11 monthsDuration
350
300
250
200
150
100
50
0
Post
pran
dial
glu
cose
(mg/
dl)
30
25
20
15
10
5
0
Gluc
ose
(nm
ol/l
)
0 30 60 120Time (min)
0 30 60 120Time (min)
Insu
lin (
U/m
l)μ
100
80
60
40
20
0
78

Fig 3. Bitter gourd prevented pre-diabetes induced retinal structural altrations. Retinal images after hematoxylene and eosin stain. There was reduction in retinal thickness of inner nuclear layer (INL), outer nuclear layer (ONL) as well as photoreceptor layers (PRL) in pre-diabetic animals as compared to control indicating damage of retinal layers especially loss of nuclear cell layers due to pre-diabetes. Bitter gourd prevented these abnormalities.
Fig 2. Bitter gourd partially prevented pre-diabetes induced retinal functional abnormalities. Scotopic b-wave and a-wave amplitude was recorded by ERG and plotted graphs of amplitude vs light intensity for b-wave (A) and OPs (B).
Values are mean±SD, n=5-6 per group recorded, *p<0.05.
Retinal functional abnormalities: Development of retinal functional abnormalities due to pre-diabetes was studied in these rats using ERG. ERG data indicate, untreated pre-diabetic animals developed retinal functional abnormalities by the end of the experimental period as there was a decrease in scotopic b-wave response and OPs when compared to controls. Feeding of BG to pre-diabetic rats has marginally prevented retinal functional abnormalities by preventing decrease in OPs but not photopic b-wave (Fig 2). Further, we studied structural alterations of retina due to pre-diabetes. There was a reduction in retinal thickness of inner plexiform layer (IPL), inner nuclear layer (INL), outer plexiform layer (OPL), outer nuclear layer (ONL) and photo receptor layer (PRL) in untreated pre-diabetic animals as compared to control indicating damage of retinal layers especially loss of nuclear cell layers (Fig 3). These results indicate that long term pre-diabetic state altered retinal structure in nSTZ induced pre-diabetic model. Interestingly BG has prevented these structural alterations.
In addition to the above functional and structural alterations, we also studied expression of certain key molecules which play an important role in development of retinopathy. Increased expression of VEGF, GFAP and decreased expression of Rhodopsin were observed in untreated pre-diabetic animals when compared to controls indicating development of retinal abnormalities/retinal degenerations. Interestingly BG prevented these changes marginally in pre-diabetic treated rats (Fig 4).
GCLIFL
INLOFLONL
PRLRPE
Control Pre-Diabetic (PD) PD+Bitter gourd
79

Fig 4. Expression of AR, CML, 4-HNE, Rhodopsin, GFAP and VEGF in the retinas of control, pre-diabetic and pre-diabetic rats fed with bitter gourd. Retinal immuno-fluorescence for AR, CML-KLH, 4-HNE, VEGF, rhodopsin and GFAP. Nuclei are labelld with DAPI (blue). The immunolocalization of VEGF, rhodopsin and 4-HNE was done with Alexa Flour-594 (Red); AR, CML and GFAP was done with Alexa Flour-488 (Green) secondary antibody (Invitrogen). The intensity of immunoreactivity was observed under fluorescence microscope (Leica) at magnification of 400X.
Rhodopsin
GCLIFL
INLOFLONL
PD+BG
4 - HNE
AR
CML
Control Pre - diabetic (PD)
GFAP
VEGF
GCLIFL
INLOFLONL
PRLRPE
GCLIFL
INLOFLONL
PRLRPE
GCLIFL
INLOFLONL
PRLRPE
GCLIFL
INLOFLONL
PRLRPE
GCLIFL
INLOFLONL
PRLRPE
GCLIFL
INLOFLONL
PRLRPE
80

Expression values are expressed as fold change over control. DATA are mean ± SD; n=3; (*p<0.05; $ significantly different from pre-diabetic group).
CML -KLH
4-HNE
VEGF
GFAP
Beta actin
Rhodopsin
AR
AC PD PD+BG
Mechanisms: There are several biochemical and molecular mechanisms that have been proposed to explain diabetes induced complications. These include activation of polyol pathway, increased advanced glycation and increased oxidative stress. Since diabetic retinopathy also occurs in pre-diabetic state, we studied expression of AR (polyol pathway), CML-KLH (glycation) and 4-HNE (oxidative stress) to understand the association of these pathways in development of pre-diabetes induced retinal abnormalities using IHC, immunoblot and gene expressions by qRT-PCR methods.
Immunohistochemistry: This was performed using polyclonal antibodies of AR, CML-KLH and 4-HNE. A faint immunoreactivity was observed for AR, CML-KLH and 4-HNE in control rat retinas, but the intensity of immunoreactivity was increased in untreated pre-diabetic rat retinas when compared to controls (Fig 4) indicating activation of polyol pathway, increased glycation and oxidative stress respectively. Feeding of BG prevented these changes marginally in pre-diabetic treated rats probably through its hypoglycemic property (Fig 4).
Immunoblotting: Expression of VEGF, GFAP, Rhodopsin, AR, CML-KLH and 4-HNE at protein levels were studied using immunoblot method and also performed densitometric analysis. There was a marked increase in expressions of VEGF, GFAP, AR, CML-KLH and 4-HNE in untreated pre-diabetic rat retinas when compared to controls. In the other way Rhodopsin expression was significantly decreased in pre-diabetic rat retinas when compared to controls (Fig 5A & B).
qRT-PCR: Further we studied expression of some of the markers at gene level by qRT-PCR and similar results were observed with qRT-PCR, where VEGF, GFAP, AR expressions were up regulated and rhodopsin was down regulated in untreated pre-diabetic rat retinas when compared to controls further supporting development of retinal abnormalities in pre-diabetic animals. Feeding of BG to pre-diabetic rats had shown marginal protective effect (Fig 5C).
Effect of nSTZ-pre-diabetes on risk of cataract: Since many epidemiological studies had shown the association of cataract with IGT/pre-diabetes in aged population, in the present study we used nSTZ-pre-diabetic SD rat model and studied long-term pre-diabetes on development of cataract and associated biochemical alterations in these animals. Eye of all animals (control, pre-diabetic and pre-diabetic rats fed with BG) were examined after dilation of pupils using slit lamp microscope and all animals eye lens are clear and not developed any lenticular opacifications.
Fig 5. Immunoblot analysis (Panel A) and quantification of immunoblots (Panel B) of VEGF, GFAP, Rhodopsin, AR, CML-KLH, 4-HNE and beta actin in control (C), pre-diabetic (PD) and pre-diabetic rats fed with 5% bitter gourd (PD+BG). qRT-PCR analysis of VEGF, GFAP, Rhodopsin and AR in control, pre-diabetic and pre-diabetic rats fed with BG retinas (Panel C).
81

Lens organ culture study: Since pre-diabetic animals not developed lens abnormalities by the end of each experiment, a set of lenses were cultured in modified TC199 medium in the presence of 55mM glucose for a period of four days and images were represented for end of four days culture period. Interestingly, untreated pre-diabetic rat lens developed early opacification when compared to control animal lens indicating pre-diabetes with IGT is risk of cataract. Pre-diabetic animals fed with BG had delay in development of lens opacification when compa-red to untreated pre-diabetic rat lens (Fig 6).
Since activation of polyol pathway is one of the risk factor in development of diabetic complications, we estimated polyol pathway intermediates (AR and sorbitol) in another set of lens to study role of this pathway in early development of lens opacification in pre-diabetic rat lens. As we observed in our previous studies, the results of polyol pathway intermediates indicate there was an increased accumulation of sorbitol in pre-diabetic rat lens due to increase of AR when compared to controls (Fig 7A & B). This excess accumulation of sorbitol in pre-diabetic rat lens could be one of the factors in early opacification of pre-diabetic rat lens when compared to control lens. Oxidative stress is another known factor to play an important role in the development of various complications during diabetic and pre-diabetic states. In the present study, a marginal increase in lipid peroxidation (MDA) in untreated pre-diabetic rat lens as compared to control indicates an increased oxidative stress in pre-diabetic state (Fig 7C). Pre-diabetic animals fed with BG had marginal protection in oxidative stress. However there was no difference in total, soluble and percent of total soluble protein content between groups (Table 1).
Effect of nSTZ induced longterm pre-diabetes on development of renal abnormality: To assess long-term pre-diabetes on development of renal abnormality, we estimated urinary albumin, creatinine and urea in control, pre-diabetic rats and pre-diabetic rats fed with BG. Pre-diabetic rats excreted elevated levels (57.81±29.72mg/24h) of albumin compared to control rats (18.13±3.95mg/24h) indicating altered renal function due to pre-diabetes. Whereas urinary albumin content was decreased (42.45±25.87mg/24h) in BG fed pre-diabetic animals (Table 2). Similarly pre-diabetic rats excreted higher amount of urinary urea (674±55mg/24h) when compared to control animals (650±28.33mg/24h). Feeding of pre-diabetic rats with BG had reduced urinary urea levels (601±110mg/24h). Together these results indicated that BG has prevented renal abnormalities induced due to pre-diabetes. However, there was no difference in urinary creatinine, plasma albumin, creatinine, urea and blood urea nitrogen levels between groups (Table 3).
Albuminuria in nephropathy is due to endothelial dysfunction, a loss of negative charges in the basement membrane, and change in the slit-membrane diaphragm composition. Since these IGT/pre-diabetic animals developed renal functional alterations due to increased urinary albumin excretion, we studied the structure of kidney by H&E and expression of nephrin, a key protein of the glomerular slit membrane and podocin, other slit-diaphragm protein in kidney of these animals using western blot method. There was increased kidney atrophy in pre-diabetic rats when compared to controls (Fig 8A). Further, western blot results indicated that there was a decrease in nephrin and podocin protein expression in kidney (Fig 8B) indicating damage of kidney slit-membrane in pre-diabetic animals and
Fig 6. Bitter gourd delayed development of lens opecification in in-vitro organ culture. A set of lenses from control, pre-diabetic and pre-diabetic animals fed with BG were cultured in modified TC199 medium in the presence of 55mM glucose for a period of four days and images were represented at the end of four days culture. Pre-diabetic rat lens developed early opacification when compared to controls.
Control Pre-diabetic(PD) P D+BG
82

83
Fig 7. AR, sorbitol and MDA in lens of control, pre-diabetic and pre-diabetic rats fed with bitter gourd group rats. AR activity was expressed as μmoles of NADPH oxidized/h/100 mg protein. Sorbitol was expressed as μmoles/g lens.
Values are expressed as mean±SD.
05
10152025303540
Control Pre-diabetic(PD)
PD+BG
AR
(U/h
/100
g pr
otei
n)
Groups
A
00.20.40.60.8
11.2
Control Pre-diabetic(PD)
PD+BGSor
bito
l (µm
ol/g
lens
)
Groups
B
02468
101214
Control Pre-diabetic(PD)
PD+BG
TBA
RS
(nm
ol/g
len
s)
Groups
C
Fig 8. Morphology of kidney by H&E stain in control, pre-diabetic and pre-diabetic rats fed with BG (A). Immunoblot analysis of nephrin and podocin in control, pre-diabetic and pre-diabetic rats fed with BG.
Control Pre-diabetic (PD) PD+BGControl Pre-diabetic (PD) PD+BG
A B
these alterations was reduced in pre-diabetic animals fed with BG. The possible mechanisms involved in the development of albuminuria in pre-diabetic animals could be down regulation of slit-diaphragm protein expression with subsequent structural disturbance.
Table 1. Protein content in lens of control, pre-diabetic and pre-diabetic rats fed with bitter gourd group rats
Parameter/Group Control Pre-diabetic (PD) PD + Bitter gourd
Total protein (mg/g lens) 509±24.65 547±27.30 543±26.88
Soluble protein (mg/g lens) 326±30.82 344±25.23 343±35.37
Percent of soluble protein 64.01 63.04 62.99
Table 2. Albumin, creatinine and urea in urine of control, pre-diabetic and pre-diabetic rats fed with bitter gourd group rats
Parameters Control Pre-diabetic(PD) PD+Bitterguard(BG)Albumin(mg/24h) 18.13±3.95 57.81±29.72 42.45±25.87Creatinine (mg/24h) 17.84±2.09 15.18±4.96 15.62±6.71Urea (mg/24h) 650±28.33 674±55 601±110Water intake (ml/24h) 20.20±9.93 23.83±3.12 28.83±9.60Urine output (ml/24h) 9.14±0.89 6.58±3.36 13.00±10.58

84
Parameters Control Pre-diabetic(PD) PD+Bitterguard(BG)Albumin(mg/dL) 25.06±1.72 23.75±2.17 23.97±1.55Creatinine (mg/dL) 0.911±0.050 0.890±0.055 0.872±0.155Urea (mg/dL) 29.14±3.25 29.90±4.64 27.53±3.01BUN(mg/dL 13.58±1.51 13.93±2.16 12.83±1.40
Table 3. Albumin, creatinine and urea in plasma of control, pre-diabetic and pre-diabetic rats fed with bitter gourd group rats
SUMMARY We developed nSTZ-induced pre-diabetes in SD rats. STZ injection to two day old SD rat pups
developed IGT associated pre-diabetes by two months. Feeding of BG at 5% to nSTZ- treated group prevented development of pre-diabetes. These nSTZ rats developed high fasting and postprandial glucose levels by two months and maintained pre-diabetic state for ten months. These pre-diabetic rats also developed retinal functional abnormalities. Further, increased expression of VEGF, GFAP and decreased rhodopsin expression in nSTZ-PD rats further supported development of retinal abnormalities. Increase in expression of AR, CML-KLH and 4-HNE in pre-diabetic rat retinas when compared to controls indicating activation of polyol pathway, glycation and oxidative stress at pre-diabetic state. Interestingly feeding of BG to nSTZ-pre-diabetic group animals prevented these retinal alterations marginally through its hypoglycemic property. These pre-diabetic animals not developed cataract as observed by slit lamp microscope. However, when cultured these lens at high glucose medium, nSTZ untreated pre-diabetic rat lens developed faster opacification when compared to controls indicating pre-diabetes is a risk of cataract. This could be mainly due to excess accumulation of sorbitol in rat lens due to pre-diabetes. Interestingly BG fed animal lenses delayed in development of opacification when compared to untreated pre-diabetic group rat lens. Increase of urinary albumin, urea in these animals indicates development of renal abnormalities due to pre-diabetes. Feeding of BG to nSTZ pre-diabetic rats had prevented these alterations.Ameliorate effect of garlic on pre-diabetes induced retinal, lens and renal abnormalities in high fructose induced pre-diabetic model: High fructose or high fructose & fat induced rat model is another well known model used for study of metabolic syndrome, insulin resistance, IGT or pre-diabetes. In the present study we used this HF and HFHF model for development of pre-diabetes and pre-diabetes induced retinal, lens and renal abnormalities.General characteristics of HF, HFHF induced pre-diabetic WNIN rats: Feeding of either high fructose alone (HF), fructose with 3% garlic (HF+G) or fructose with combination of high fat (HFHF) to WNIN rats for a period of three months developed pre-diabetes as there was an increase in IGT and HOMA-IR index in HF (2.088±0.547) and HFHF (2.752±0.294) group rats when compared to controls (0.893±0.1265). Interestingly garlic fed fructose group animals had shown reduction in HOMA-IR index (1.321±0.2171) when compared to fructose alone fed group (2.088±0.547). Further OGTT results after ten months of feeding indicate these animals maintained pre-diabetic (IGT& Insulin resistance) state till the end of the experimental period, but not developed fasting hyperglycemia (Fig 9). There was a marginal increase in mean food intake (g/rat/day) of HF (18.29±2.85g) and HFHF (17.86±3.45g) group rats when compared to control animals (16.14±2.19). Similarly, there was an increase in the body weight of HF (497± 65g) and HFHF animals (546±76g) when compared to control animals (429±62g) at the end of the experiment. This increased body weights in HF and HFHF fed animals could be due to increase in adiposity/insulin resistance. However, garlic had no effect on either food intake (17.33±2.04g) or body weights (499±45g).

Retinal functional abnormalities due to HF and HFHF induced pre-diabetes: Development of retinal functional abnormalities due to pre-diabetes was studied in these rats using ERG. ERG data indicated that, pre-diabetic animals developed retinal functional abnormalities by the end of the experimental period as there was a decrease in both scotopic, photopic b-wave responses and OPs when compared to controls. These reductions are more in HF group rats when compared to HFHF group. Feeding of garlic to HF group rats had prevented retinal functional abnormalities by preventing decrease in both scotopic and photopic b-wave responses and also OPs (Fig 10). Further, structural alterations of retina due to HF and HFHF induced pre-diabetes were also studied. There was reduction in retinal thickness of ONL, OPL and INL in HF induced pre-diabetic animals as compared to control indicating damage of retinal layers especially loss of nuclear cell layers (Fig 11). These results indicate that long term pre-diabetic state altered retinal structure in HF induced pre-diabetic model. Interestingly garlic has prevented these structural alterations in HF+G group rats. In addition to the above functional and structural alterations, molecular alterations in these retinal tissues by analyzing expression of certain key molecules which play an important role in development of retinopathy was observed. Increased expression of VEGF, GFAP and decreased expression of Rhodopsin were observed in these pre-diabetic animals when compared to controls indicating development of retinal abnormalities/retinal degenerations. Interestingly garlic prevented these changes marginally in HF+G group rats (Fig 12). Mechanisms: Expression of AR (polyol pathway), CML-KLH (glycation) and 4-HNE (oxidative stress) to understand the association of these pathways in development of pre-diabetes induced retinal abnormalities using IHC, immunoblot and gene expressions by qRT-PCR methods was studied.
Fig 9. Glucose (A) and Insulin (B) response during OGTT after three and ten months (C&D) feeding in control, HF, HF+G, and HF fed rats with garlic
0
50
100
150
200
0min 30min 60min 120minTime
ControlHFHF+GHFHF
0
4
8
12
16
20
24
0min 30min 60min 120minTime
ControlHigh FructoseHF+GHFHF
0
5
10
15
20
0 30 60 120Time (min)
ControlHFHF+GHFHF
0
20
40
60
80
100
120
0 30 60 120Time (min)
ControlHFHF+GHFHF
A
B
C
D
Gluc
ose
(mm
ol/l)
Gluc
ose
(mm
ol/l)
Insu
lin (u
U/m
l)
Insu
lin (u
U/m
l)
85

86
Immunohistochemistry: Immunohistochemistry was performed using polyclonal antibodies of AR, CML-KLH and 4-HNE. A faint immunoreactivity was observed for AR, CML-KLH and 4-HNE in control rat retinas, but the intensity of immunoreactivity was increased in HF, HFHF induced pre-diabetic rat retinas when compared to control indicating activation of polyol pathway, increased glycation and oxidative stress respectively. Feeding of garlic to HF rats has significantly prevented these changes (Fig 12). Immunoblotting: Expression of VEGF, GFAP, Rhodopsin, AR, CML-KLH and 4-HNE at protein levels were studied and also performed densitometric analysis. There was a marked increase in expressions of VEGF, GFAP, AR, CML-KLH and 4-HNE in pre-diabetic rat retinas when compared to control. In the other way Rhodopsin expression was significantly decreased in HF and HFHF pre-diabetic rat retinas when compared to control (Fig 13A&B). Feeding of garlic to HF rats has significantly prevented these changes probably through its antiglycating activity.
Fig 10. Scotopic b-wave response (A), Photopic b-wave response (B) in Control, HF, HF fed with Garlic group and HFHF group rats at the end of the experiment
0
100
200
300
400
-50 -45 -38 -34 -28 -22 -18 -12 -6 -2 2 4 8Light intensity (dB)
ControlHFHFHFHFG
0
20
40
60
80
100
120
140
-10 -6 -2 0 2 8 10Light intensity (dB)
ControlHFHFHFHFG
0
200
400
600
800
-2 2 4 8Light intensity in (dB)
ControlHFHFHFHFG
0
30
60
90
120
150
180
-2 0 2 8 10Light intensity in (dB)
ControlHFHFHFHFG
A
B
C
D
Scot
opic
b-w
ave
Ampl
itude
(µV)
Osc
illat
ory
pote
ntia
ls (µ
V)
Phot
opic
b-w
ave
ampl
itude
(µV)
Osc
illat
ory
pote
ntia
ls (µ
V)
Fig 11. Morphology of control, HF and HF fed with Garlic pre-diabetic rat retinas by H&E. Garlic prevented HF fed pre-diabetes induced retinal structural altrations
Control HF HF + G HFHFGCLIFL
INL0FL0NL
PRL RPE

87
Fig 12. Expressions of AR, CML, 4-HNE, VEGF, GFAP and Rhodopsin in the retinas of control, HF, HF fed garlic and HFHF group rats. Retinal immunofluorescence for AR, CML-KLH, 4-HNE, VEGF, GFAP and rhodopsin. Nuclei are labelled with DAPI (blue). The immunolocalization of VEGF, rhodopsin and 4-HNE was done with Alexa Flour-594 (Red); AR, CML and GFAP was done with Alexa Flour-488 (Green) secondary antibody (Invitrogen). The intensity of immunoreactivity was observed under fluorescence microscope (Leica) at magnification of 400X.
Fig 13. Immunoblot analysis (panal A) and quantification (panal B) of VEGF, GFAP, Rhodopsin, AR, 4-HNE, CML-KLH and beta actin in retinas of control, HF, HF fed garlic and HFHF group rat retinas.
Data are ± SD (n=3; p<0.05; * significant from control; $ significant from treated group)
Contorl
HF
HF+G
HFHF
AR CML 4-HNE VFGF GFAP Rhodopsin
C HF HF+G HFHF
VEGF
GFAP
Rhodopsin
AR
CML-KLH
4-HNE
Beta actin
A B

88
qRT-PCR: Further, we studied expression of some of the markers at gene level by qRT-PCR and similar results were observed, where VEGF, GFAP, AR expressions were upregulated and rhodopsin was downregulated in HF, HFHF pre-diabetic rat retinas when compared to control. Feeding of garlic to HF+G group rats had significant protective effect ( ).Fig 14 Though HF and HFHF group animals develop pre-diabetes induced retinal abnormalities, there are some differen-ces in expression of VEGF, CML, 4-HNE, AR and rhodopsin in these two groups. For example, retinal integrity was well maintained in HFHF model as compared to HF model, while expression of VEGF, CML and 4-HNE are relatively high in HF group animals. In other way, there was an increased expression of AR in HFHF rat retinas when compared to HF group. Rhodopsin is a rod specific protein known to decrease its expression in retinal degradation in obese animals with IGT and insulin resistance (Reegy GB, 2009). In the present diet induced (HF and HFHF) obesity models, we observed, similar results in retinas, but the magnitude of retinal degradation is more in HF group when compared to HFHF. Effect of high fructose, high fructose and high fat induced-pre-diabetes on risk of cataract: Since many epidemiological studies had shown an association of cataract with obesity, IGT/pre-diabetes associated aged population, in the present study we used HF and HFHF induced pre-diabetic WNIN rat model and studied effect of long-term pre-diabetes on risk of cataract and associated biochemical alterations in these animals. Eye of all animals (control, HF induced pre-diabetic, pre-diabetic rats fed with garlic and HFHF) were examined using slit lamp microscope after dilation of pupils and all animal eyes were clear and not developed any lenticular opacfications. Interestingly dissected HF and HFHF untreated pre-diabetic animal lenses were slightly opaque when compared to controls Fig 15. Lens organ culture study: Since, pre-diabetic animals had not developed complete lens opacification by the end of each experiment, a set of lenses were cultured in modified TC199 medium in the presence of 55mM glucose for a period of four days and images were represented for end of four days culture period.Interestingly, HF and HFHF pre-diabetic rat lens developed early opacification when compared to control animal lens indicating pre-diabetes with IGT/insulin resistance is risk of cataract.
Fig 14. qRT-PCR analysis of VEGF, GFAP, Rhodopsin and AR in control, HF, HF+G and HFHF retinas. Expression values are expressed as fold change over control.
( p<0.05; * significant from control; $ significant from treated group)
0
0.5
1
1.5
2
2.5
3
VEGF GFAP RHO ARGene
Conrol HF HF+G HFHF
**
*
*
$
$
$
$* * *
Fig 15. Control, High fructose, high fructose fed with garlic and high fructose and high fat fed rats lens before and after culture
Before culture
After culture
Control HF HF + Garlic HF + HF

89
0
5
10
15
20
Control HF HF+G HFHFGroups
C
0
0.3
0.6
0.9
1.2
1.5
1.8
Control HF HF+G HFHFGroups
B
05
1015202530354045
Control HF HF+G HFHFGroups
A
Pre-diabetic animals fed with garlic had shown delay in development of lens opacification when compared to untreated HF fed pre-diabetic rat lens (Fig 15). Since activation of polyol pathway is one of the r isk factor in development of diabet ic complications, we estimated polyol pathway intermediates (AR and sorbitol) in another set of lens to study role of this pathway in early development of lens opacification in HF and HFHF induced pre-diabetic rat lens. As we observed in our previous studies, the results of polyol pathway intermediates indicate that there was an increased accumulation of sorbitol in HF and HFHF induced pre-diabetic rat lens due to increase of AR when compared to controls (Fig 16A &B). This excess accumulation of sorbitol in pre-diabetic rat lens could be one of the factors in early opacification of pre-diabetic rat lens when they cultured at high glucose medium when compared to control lens. Oxidative stress is another known factor to play an important role in the development of various complications during diabetic and pre-diabetic states. In the present study, a marginal increase in MDA/TBARS in HF and HFHF induced pre-diabetic rats as compared to control ( ) indicating an Fig 16Cincreased oxidative stress in pre-diabetic state. HF pre-diabetic animals fed with garlic had shown marginal protection in oxidative stress. However there was no difference in total, soluble and percent of total soluble protein content between groups (Table 4). High fructose, high fructose and high fat induced longterm pre-diabetes on risk of renal abnormality: To assess HF and HFHF induced long-term pre-diabetes on development of renal abnormality; we estimated urinary albumin, creatinine and urea in control, HF and HFHF pre-diabetic rats. HF and HFHF Pre-diabetic group animals excreted elevated levels of urinary albumin compared to control rats (Table 5) indicating altered renal function due to pre-diabetes. Whereas elevated excretion of urinary albumin was prevented in garlic fed pre-diabetic animals. Similarly HF and HFHF pre-diabetic rats excreted higher amount of urinary urea when compared to controls. Whereas feeding of HF pre-diabetic rats with garlic had reduced urinary urea levels.
Fig 16. AR, Sorbitol and MDA in lens of control, HF, HF fed with garlic and HFHF pre-diabetic group rats. AR activity was expressed as μmoles of NADPH oxidized/h/100 mg protein. Sorbitol was expressed as μmoles/g lens.
Values are expressed as mean ± SD

90
Table 4. Protein content in lens of control, HF and HFHF pre-diabetic and pre-diabetic rats fed with garlic group rats
Parameter/group Control HF HF+Garlic HFHF
Total protein (mg/g lens) 618±8.81 580±16.88 603±37.13 604±30.03
Soluble protein (mg/g lens) 414±70.53 369±34.88 395±27.01 365±60.97
Percent of soluble protein 66.99 63.70 65.34 60.39
Table 5. Albumin, creatinine and urea in urine of control, HF, HF rats fed with garlic and HFHF group rats
Parameters Control HF HF + Garlic HFHFAlbumin(mg/24h) 18.92±6.63 28.69±3.61 18.39±5.37 29.85±9.38Creatinine (mg/24h) 12.90±1.67 16.58±4.08 9.47±3.91 14.22±3.93Urea (mg/24h) 677±104 950±309 456±107 783±213Water intake (ml/24h) 30.83±5.70 34.67±11.25 35.00±9.48 39.33±7.50Urine output (ml/24h) 14.08±4.34 24.83±6.08 16.83±3.25 26.67±6.43
Together these results indicated that garlic had prevented renal abnormalities induced due to HF fed pre-diabetes. However, there was no difference in urinary creatinine levels between groups (Table 6). Whereas, there was a decrease in plasma creatinine, urea and increase in GFR was observed in HF and HFHF group animals when compared to controls. Further, decrease in plasma albumin and increase in plasma urea was observed in HFHF group animals when compared to control animals. Feeding of garlic to HF group rats had shown marginal renal protective effect. Albuminuria in nephropathy is due to endothelial dysfunction and change in the slit-membrane diaphragm composition. Since HF and HFHF fed animals developed renal functional alterations due to increased urinary albumin excretion, we studied the structure of kidney by H&E and expression of nephrin, a key protein of the glomerular slit membrane and podocin, other slit-diaphragm protein in kidney of these animals using western blot method. There was increased kidney atrophy in HF and HFHF induced pre-diabetic rats when compared to controls (Figure 17A). Further, western blot results indicated that there was a decrease in protein expression of nephrin only in HF and podocin in both HF and HFHF group kidneys (Figure 17B) indicating damage of kidney slit-membrane in pre-diabetic animals and these alterations was reduced in pre-diabetic animals fed with garlic. The possible mechanisms involved in the development of albuminuria in pre-diabetic animals could be down regulation of slit-diaphragm protein expression with subsequent structural disturbance.
Table 6. Albumin, creatinine, urea, blood urea nitrogen in plasma of control, HF, HF rats fed with garlic and HFHF group rats
Parameters Control HF HF + Garlic HFHFAlbumin(mg/dL) 24.85±2.77 25.65±2.34 24.61±3.12 23.75±1.13Creatinine (mg/dL) 0.780±0.160 0.551±0.120 0.561±0.163 0.593±0.106Urea (mg/dL) 20.31±3.48 18.66±3.33 20.45±4.79 23.98±3.12BUN(mg/dL 9.46±1.62 8.69±1.55 9.53±2.23 11.17±1.45GFR(Kg/bw) 2.32±0.87 4.67±2.02 3.26±1.08 4.77±1.80

91
Fig 17. Kidney structure by H&E and nephrin and podocin expression by immunoblot in control, HF, HF fed garlic and HFHF group rats
Nephrin
Podocin
Beta actin
Contorl HF HF+G HFHF Con HF HF+G HFHF
SUMMARY HF, HFHF induced pre-diabetes in WNIN rats were developed. Feeding of either HF alone or with combination of high fat to WNIN rats developed insulin resistance associated pre-diabetes. Feeding of garlic at 3% to HF fed group prevented development of pre-diabetes. Feeding of HF and HFHF to WNIN rats had not developed fasting hyperglycemia but developed postprandial hyperglycemia and maintained pre-diabetes over a period of ten months. These pre-diabetic rats developed retinal functional abnormalities by ten months of experimental period. Increased expression of VEGF, GFAP and decreased rhodopsin expression in HF and HFHF rats further supported development of retinal abnormalities in these animals. Increase in expression of AR, CML-KLH and 4-HNE in HF and HFHF pre-diabetic rat retinas when compared to controls indicate activation of polyol pathway, glycation and oxidative stress at pre-diabetic state. Interestingly feeding of garlic to HF group animals prevented these retinal alterations through its antiglycating property. Though pre-diabetic animals had not developed cataract as observed by slit lamp microscope, after termination we observed a marginal opacification of HF and HFHF fed group rat lens. Further when cultured, these lens at high glucose medium, HF and HFHF rat lens developed faster opacification when compared to controls indicating pre-diabetes is a risk of cataract. This faster opacification could be due to excess accumulation of sorbitol in HF and HFHF fed rat lens. Interestingly garlic fed animals delayed in development of opacification when compared to HF untreated rat lens. Increase of urinary albumin, urea and decrease of plasma creatinine in HF and HFHF fed animals indicating development of renal abnormalities due to pre-diabetes. Feeding of garlic to HF group rats prevented these alterations.
13. VITAMIN A METABOLISM IN RELATION TO SEXUAL DIMORPHISM OF ADIPOSE TISSUE DEVELOPMENT
Vitamin A and its metabolites are known to modulate adipose tissue development and its associated complications. Here, we assessed vitamin A status and its metabolic pathway genes expression in relation to sexual dimorphism of adipose tissue development in high fat diet-induced mouse model. Methods For this purpose, 35 days old male and female mice of C57BL/6J strain were divided into 2 groups consisting of 7 animals from each sex, fed either stock diet or high fat (HF) diet for 26 weeks. Results· At the end, HF diet feeding increased body weight/weight gain and white adipose tissue (WAT) of
visceral and subcutaneous regions in both male and female mice.

92
· Further, vitamin A levels in visceral WAT remained unaltered, while elevated in subcutaneous WAT due to high fat feeding in both sexes. However, most of the vitamin A metabolic pathway genes neither altered nor associated with sex or diet.
· Notably, in line with hyperglycemia, the insulin resistance marker; retinol binding protein (RBP4) levels in plasma and its expression in visceral adipose depots significantly elevated in HF diet-fed male mice alone.
CONCLUSIONS· Male mice are susceptible to high fat-induced hyperglycemia, which could be partly explained by the
RBP4 elevation in circulation, due to its over-expression, particularly in visceral adipose depots; both retroperitoneal and gonadal WAT.
Ÿ Further, no sexual dimporhic adipose tissue development was observed between sexes, but triglyceride accumulation/storage in adipose tissues follows dimorphism; i.e. female accumulates more in gonadal depot and subcutaneous depot in male.
14. VITAMIN A METABOLISM: A NEGLECTED PARADIGM IN NON-ALCOHOLIC FATTY LIVER DISEASE?
Vitamin A and its metabolites are known to regulate lipid metabolism. However so far, no study has assessed, whether vitamin A deficiency per se aggravates or attenuates the development of non-alcoholic fatty liver disease (NAFLD). Therefore, the impact of vitamin A deficiency on the development of NAFLD was tested. METHODS Male weanling Wistar rats were fed one of the following diets; control, vitamin A deficiency (VAD), high fructose (HFr) and VAD with HFr (VADHFr) of AIN93G composition, for 16 weeks, except half of the
thVAD diet-fed rats were shifted to HFr diet (VAD(s)HFr), at the end of 8 week. RESULTS· Animals fed on VAD diet with HFr displayed hypotriglyceridemia (33.5 mg/dL) with attenuated
hepatic triglycerides accumulation (8.2 mg/g), compared with HFr diet (89.5 mg/dL and 20.6 mg/g respectively). These changes could be partly explained by decreased activity of glycerol 3-phosphate dehydrogenase (GPDH) and the down-regulation of stearoyl CoA desaturase 1 (SCD1), both at gene and protein levels, the key determinants of triglyceride biosynthesis.
· On the other hand, n-3 long chain polyunsaturated fatty acid; docosahexaenoic acid (DHA) and its active metabolite; resolvin D1 (RvD1) levels were elevated in the liver and plasma of VAD diet-fed groups, which was negatively associated with triglyceride levels.
· All these factors confer vitamin A deficiency-mediated protection against the development of hepatic steatosis, which was also evident from the group shifted from VAD to HFr diet.
CONCLUSION Vitamin A deficiency attenuated high fructose-induced hepatic steatosis, by inhibiting triglyceride synthesis, through regulation of long chain n-3 PUFA; DHA, its active metabolite; RvD1, besides, GPDH and SCD1.

93
V. EXTENSION AND TRAINING DIVISION
INFLUENCE OF MASS MEDIA ON TEENAGERS'S DIET AND HEALTH RELATED BEHAVIOUR
In the globalization process, food habits have undergone a sea change and have impacted Indian lifestyle in general and food habits of urban children in particular. Especially, in case of Double Income Single Kid (DISK) nuclear families, affordability for ready-to-eat foods has gone up, resulting in a shift of dietary behaviour. Fierce marketing techniques by food manufacturers, coupled with enticing messages of mass media have culminated in increased sales of junk foods. Needless to emphasize, 'junk foods' are posing a threat to the wellness of individuals. An adolescent is exposed to television, movies, print media and Internet equally and/ or simultaneously. They have choices to hand-pick media with a host of preferences. The whole gamut of media space unleashes fast food product promotions. Advertising incorporates a wide variety of campaigns in media plans to promote such products. In this context, this study was taken up to examine influence of mass media (television, print, movies, films, internet and radio together) on teenagers. OBJECTIVESŸ To assess media viewing habits of teenagers.Ÿ To study the media content which the teenagers' are exposed to.Ÿ To assess teenagers' understanding and adoption of media content on diet and HRB. Ÿ To study teenagers' perceptions and practices of diet and HRBŸ To elicit influence of mass media, if any, on diet and health related matters of teenagers.METHODOLOGY Survey method was used with a self-administered questionnaire as a tool for data collection.Cross-sectional study This is a cross-sectional study as it involves examining influence of mass media on teenagers from different socio-economic backgrounds. Accordingly, this study adopted stratified random sampling procedure having 3 types of economic groups' viz., lower-income (poor families), middle-income (middle- class families) and higher income (rich) families as follows: Ÿ Government schools & colleges (for teenagers of lower-income families)Ÿ Private schools & colleges (for teenagers of middle-income families)Ÿ International/corporate schools & colleges (for teenagers of higher-income families).Questionnaire Components The following sub-topics were incorporated in the questionnaire with thrust on knowledge and practice of teenagers.• Media viewing habits of teenagers

94
• Popular programmes or content of media• Nutrition and health related information recall • Dietary behaviour• Perception of physical appearance • Physical activity• Leisure activity• Lifestyle (hygiene, tobacco/alcohol abuse etc) A total of 536 students from all the above educational institutions were administered the questionnaire, of them 19 were found as incomplete and remaining 517 questionnaires were found as valid for analysis. These valid filled-in questionnaires include 183 students of corporate/ international institutions; 158 students of private institutions; and 176 students of government institutions. Of the total 517 samples, 253 were boys and 264 were girls.FINDINGS AND CONCLUSIONS This study on influence of mass media on teenagers' provided key insights into the diet and health-related behaviour of young people. This study focussed on a wide range of dietary perceptions and health-related awareness among the adolescents under the influence of mass media. Analysis of the data highlights variation between same age group children and between genders in usage of media, understanding of media messages and health related behaviour. Mass media influence on teenagers varied broadly based on their families' economic status viz., higher income group, middle income group and lower income group. Among each group again influence of media appears divergent between genders. Overall, television was mostly viewed by teenagers closely followed by newspapers/ magazines. Movies were also most favored media of teenagers and about two-third of teenagers were browsing the Internet. But, digital divide was significantly wider between different economic-groups. Usage of Internet by girls studying in government institutions was not even half of the percentage of girls of corporate institutions. In different types of television content, entertainment programmes were mostly watched by teenagers, followed by sports and news content. Teenagers prefer to view action movies and horror movies. Of all the content in newspapers or magazines, sports-related information and celebrities' gossips were mostly road by teenagers. Boys road sports news and girls showed interest in reading about celebrities. Teenagers browse Internet mostly to play games, socialise and as part of entertainment. Apart from games; YouTube, Face book, Entertainment and Movies were most frequently visited websites by teenagers. It was significantly observed that, usage of Internet was less in teenagers of poor families. Of all kinds of health-related topics, majority teenagers, irrespective of gender and economic group, like to know more and more information about healthy and nutritious food items. Irrespective of gender, more than half of the teenagers perceive their physique was not fit enough. It was significantly observed that, almost one-fourth of teenagers of low-income families were fulfilling their need of physical activity not by playing, but only through domestic work like helping parents in labour work, house chores etc. More than one-third of teenagers did not take any physical activity. The primary reasons they mention for non-physical activity are “homework pressure”, “lack of play ground” “watching television or internet browsing”. Very less number of teenagers checks calorie values before eating food outside the home. Almost two-third of teenagers usually consumes carbohydrate-rich foods like sweets, pizzas, burgers etc. In this study, it was observed that - of all the media content on diet and health related - commercial food advertisements were mostly watched content by teenagers. Most of these products were seen as endorsed by celebrities, particularly by film stars in these advertisements. A significant observation was that, a whopping three-fourth of teenage girls in poor families was highly influenced and consumes commercial food products endorsed by celebrities. Of all the commercial food and beverage products endorsed by celebrities, soft drinks are the most popular among the teenagers.

95
Film stars stand as prime motivators for teenagers to do physical exercise. Sports persons stands next to film stars in inspiring teenagers towards taking up physical exercises. Majority teenagers said that, they tend to take one or other kind of physical fitness activity whenever they see a fit body of film actors/ actress and sports persons. On the other-side, almost half-of-the girls like to imitate their family elders in following healthy habits. Majority teenage boys “always” aspire to look like their favourite celebrities, whereas, majority girls only “sometimes” feel to look like celebrities. This response of teenagers obviously reflects wide difference between genders towards their attitude to imitate celebrities in their looks. But, in poor families majority boys and girls were “always” aspired to look like their favourite celebrities, which indicates the influence of celebrities' looks are more on youngsters of low-income families. Critical observation of the data reveals the hidden influence of media on teenagers' consumption of alcohol and tobacco products. A sum of 24% teenagers was influenced by mass media towards this unhealthy behaviour. Teenagers used these products to imitate media visuals; to imitate film actors; to imitate television advertisements/ celebrities; and to imitate visuals of you tube/ internet. Comparatively, boys of middle-income families were more under influence of film stars and consume alcohol and tobacco products to imitate actions on the screen.

96
VI. FOOD AND DRUG TOXICOLOGY RESEARCH CENTRE
1. ROLE OF TAMARIND EXTRACT ON THE CARBONIC ANHYDRASE ACTIVITY IN AMELIORATING FLUORIDE TOXICITY IN RATS
Fluoride is a cumulative poison and prolonged ingestion of small but toxic doses of fluoride causes in chronic fluoride poisoning commonly known as fluorosis. Cases of fluorosis in man and animals have been reported globally. In India, fluorosis has been encountered due to both natural and industrial sources. Endemic skeletal fluorosis continues to be a challenging national health problem in India, largely because of its persistence in the several areas, due to defunct defluoridation plants with inadequate safe water supply. Fluorosis is most severe and widespread in the two largest countries, India and China. In India, 20 states have been identified as endemic areas, with an estimated 60 million people at risk and 6 million people disabled; about 600,000 might develop a neurological disorder as a consequence (Reddy DR, 2009). The most affected states are Andhra Pradesh, Punjab, Haryana, Rajasthan, Gujarat, Uttar Pradesh, Bihar, Tamil Nadu, Kerala, Karnataka and Maharashtra. Chronic exposure to excessive fluoride may cause toxic damage to osseous tissue, which manifests as dental and skeletal fluorosis. The toxic effects interfere with the mineralization process, and the defects that result are generally irreversible. Amelioration of toxic effects of fluoride in human and animal remained unresolved and controversial till to date due to lack of safe effective ameliorative agents that can remove F from the body and can ameliorate toxic effects as well. Chemical compounds such as aluminum sulfate, ascorbic acid and boron have been reported to be effective in experimental fluoride exposure with variable success. Serpentine (magnesium meta silicate) administration ameliorated clinical symptoms to some extent but long term toxicological studies were not undertaken. These agents are generally not indicated for prolong use due to their toxic side effects, which underlines need for evaluating a nontoxic-safe agent that can reduce fluoride burden in body and ameliorate toxic effects of fluoride (WHO, 2002). Herbal medicines are plant derived preparations with potential health benefits and active ingredients are components of herbal medicines with definite therapeutic or prophylactic activities (WHO, 1993). TamarindusindicaL., (Leguminosae; English name: Tamarind, Hindi: Imli or Ambli) is a tree native to Africa, also cultivated in Sudan, Indonesia, Pakistan, Philippines, Java, Spain and Mexico. It is used extensively as a souring agent in raw and cooked forms in Indian food preparations, more so in the southern part of India. Previous studies in dogs and humans suggested the beneficial effect of tamarind ingestion on fluoride toxicity by way of increased urinary excretion and decreased retention in bone when tamarind was given with fluoridated water. Defluoridated water alone has a beneficial effect by mobilizing fluoride from the bone, but the process is very slow. Studies on rats and rabbits suggests that use of tamarind fruit pulp extract can reduce fluoride concentration in blood and bone by enhanced urinary excretion, indicating the ameliorative potential of tamarind fruit pulp extract in fluoride toxicity. Changes in plasma biochemistry suggested less hepatic and renal damages in animals receiving tamarind fruit pulp extract along with fluorinated water in comparison to that receiving fluorinated water alone. A significant correlation between fractional fluoride clearance and urinary pH was shown by Whitford et al, 1976. The dependence of fluoride reabsorption on urinary pH is similar to the renal handling of other weak acids. Hydrogen fluoride is a weak acid and in its undissociated form (HF) appears

97
to be more readily reabsorbable. Several studies have reported the renal clearance of fluoride to always be lower with acid urine than with alkaline urine. Tamarind ingestion may reflect changes in reabsorption of fluoride at the level of renal tubules. Fluoride binding by tamarind in vitro has been reported, but the extent of avidity of the binding are not strong enough and hence this low affinity binding is unlikely to reduce the absorption of fluoride from the gut. In the study it was speculated that the increase in alkalinity of urine due to tamarind ingestion might be linked to increased renal clearance of fluoride. However, carbonic anhydrases are the enzymes involved in the regulation of acid-base balance and pH of the blood and in other animal tissues. Whether the tamarind ingestion plays a role on the carbonic anhydrase activity thereby in the regulation of pH is not known. Carbonic anhydrases are zinc metalloenzymes that catalyze the reversible hydration of
- +Co +H O H CO HCO + H .2 2 2 3 3
The first reaction is catalyzed by carbonic anhydrase and the second reaction occurs instantaneously. The carbonic anhydrase (CA) gene family includes ten enzymatically active members, which are major players in many physiological processes, including renal and male reproductive tract acidification, bone resorption, respiration, ion exchange, acid-base balance, carboxylation/ decarboxy-lation reactions, gluconeogenesis, signal transduction, respiration, and formation of gastric acid. The absorption rate of fluoride from the stomach is dependent on the pH of the gastric contents. Plasma
.clearance of fluoride by the kidneys is related to urinary pH Acidosis induces reduction in the renal clearance of fluoride. The CA activity was enhanced under fluorotic conditions in sheep and chlamydomonasreinhardtii. The increased CA activity results in the enhanced levels of H+ ions which binds to fluoride ions and forms HF which appears to be readily reabsorbable. Thus above studies indicate the role of CA in regulating the renal clearance of fluoride by altering the pH of the urine. The dietary source which can inhibit the CA activity, facilitate the increased excretion of fluoride in urine by increasing the urinary pH. Earlier studies indicate that tamarind has the potential to increase the urinary pH and thereby ensuing in clearance of excess of fluoride. Tartaric acid, the major component present in tamarind is not metabolized by the body and it may inhibit the action of carbonic anhydrase (CA) leading to the increased pH of urine.The exact biochemical mechanism involved in carbonic anhydrase inhibition by tamarind fruit pulp extract or tartaric acid in the regulation of the pH is not yet reported. Therefore the present study is proposed to investigate the biochemical mechanisms involved in inhibiting the CA activity if at all, by the tamarind fruit pulp extract and tartaric acid. The outcome of the present study augments existing fluoride eradicating programmes in controlling fluorosis problems, as tamarind is available to all economic sections with less effort.METHODOLOGYMaterials and methods Carbonic anhydrase (EC 4.2.1.1.) was obtained from Sigma. All other chemicals otherwise mentioned are analytical grade. Tamarind fruit was obtained from local market.Preparation of tamarind pulp extract The plant material (fruits of tamarind) was washed with distilled water to remove the dirt and air dried. The fruit kernel and seed was removed and fruit pulp was separated. The pulp was dried in shed and stored in air tight glass container. One hundred grams of pulp was mixed with 1.5 liter of solvent
o(methanol:water, 1:1) and kept at 25 C overnight. Thereafter, it was stirred in a magnetic stirrer for 1 h and filtered. The extracted solution was subjected to in vacuosolvent evaporation in a rotary evaporator under reduced pressure. A pasty material obtained (50 g) was stored at 0-4ºC until the time for use. When needed, the residual extract was suspended in distilled water and used in the study.Animal Experiment The animal experiment was initiated after the Institutional Animal Ethical Committee Approval. Wistar NIN rats were used for the study. The animals were randomly distributed into 6 groups with 6rats in

98
control group and 8 rats in fluoride, fluoride with tamarind supplementation, and tamarind supplementation, fluoride with tartaric acid supplementation and tartaric acid supplementation. Animal care and experimental protocols are followed in accordance with and approved by the Institutional Animal Ethical Committee. Rats are housed individually in stainless steel cages and are fed with standard laboratory diet. Control group rats received distilled water for drinking while the fluoride group received distilled water with 200mg/L sodium fluoride in drinking water. The fluoride with tamarind supplementation group received 200mg/L sodium fluoride in drinking water and 200mg/ kg body weight tamarind fruit pulp extract per day. The tamarind supplementation group received distilled water for drinking and 200mg/kg body weight tamarind fruit pulp extract per day. The dose of T. indica (200mg/kg body weight) was selected based on previous studies in which a dose-dependent effect of T. indicaon reducing serum and bone fluoride concentration with concomitant increase in excretion of fluoride in urine was obtained. The fluoride with tartaric acid supplementation group received 200mg/Lsodium fluoride in drinking water and 24mg/kg body weight of tartaric acid. The tartaric acid supplementation group received 24mg/kg body weight of tartaric acid. Collection of blood and urine Blood and urine samples are collected every one month and also at the end to monitor the pH of urine and blood and to assess the carbonic anhydrase activity in blood.Water and diet intake were also taken at 2, 4 and 6 months. Collection of tissues At the end of experiment (6 months) the animals are sacrificed and tissues like kidney, liver, bone in
oaddition to blood and urine are collected and stored at -80 C for further analysis.Biochemical analysis(I Estimation of fluoride in urine: Urinary fluoride levels were determined according to the method of
Tusl, 1970 in urine and bone.(ii) Measurement of pH: pH of urine collected from the control and fluoride treated animals at
differenttimeintervalsare measured with a digital pH meter.(iii) Carbonic anhydrase activity: CA activity in erythrocytes and in kidney was carried out according to the
method of Wilbur and Anderson (1948).SDS-PAGE and Immunoblotting The kidney issues were homogenized in a buffer containing 20 mM Tris, 100 mM NaCl, 1mM EDTA (TNE buffer; pH 7.5) 1 mM DTT, 1 mM PMSF, 1 μg/ml each of aprotinin, leupeptin, and pepstatin. Homogenization of tissues was performed on ice using a glass homogenizer and the homogenate was centrifuged at 12,000 ×g for 20 min. The supernatant was collected and used for immunoblot analysis. An equal amount of protein from control and experimental tissues was subjected to 12% SDS-PAGE and proteins were transferred onto PVDF membrane. Nonspecific binding was blocked with 5% BLOT-Quick Blocker reagent (Calbiochem) in PBST (20 mM phosphate buffer; pH 7.2, 137 mM NaCl, 0.1% Tween20) and incubated overnight at 4°C with anti-carbonic anhydrase II (1:5,000) and anti-actin (1:500) antibodies diluted in PBS. After washing with PBST, membranes were then incubated with anti-rabbit IgG (1:3500) or anti-mouse IgG (1:3500) secondary antibodies conjugated to HRP. The immunoblots were developed with enhanced chemiluminescence detection reagents (GE Health Care, Bucking hamshire, UK) and digital images were recorded by Image analyzer (G-Box iChemi XR, Syngene, G-box). Images were analyzed and quantitated using image J software (available in the public domain at http://rsbweb.nih. gov/ij/).Statistical analysis Descriptive statistics like mean, standard deviation were calculated for all variables. Mean values were compared across groups per given time point using one way ANOVA with a post-hoc test of LSD (Least significance difference). Whenever the assumptions are violated, non-parametric test Kruskal-

99
walisoneway ANOVA was applied. When initial variations were observed ANCOVA was used. The level of significance was considered as 0.05. SPSS windows version 19 was used for statistical analysis. RESULTS 1. The average body weights of the rats of all the groups is given in table 1. Body weight of F group was
significantly (P<0.05) decreased as compared to control group, however, there was a body weight gain in F+tamarind group as compared to the F group at 2, 4 and 6 months.
2. The average diet and water intake at 2, 4 and 6 months among all the groups was given in table. 2.A significant (P<0.05) decrease in diet intake was noticed in the F group as compared to control whereas, diet intake was increased in F+tamarind group, compared to F group at 2, 4 and 6 months. The water intake was lower in the F, F+tamarind groups compared to control group.
3. The average urinary pHat 2, 4 and 6 months among all the groups was given in table 3. There are no significant differences in the urinary pH levels in all the groups.
4. The urinary fluoride levels at 2, 4 and 6 months is given in table 4. There was a significant increase (P<0.05) in urinary F excretion in the F+tamarind and F+tartaric acid groups as compared to F group at 2, 4 and 6 months.
5. The carbonic anhydrase activity was lower in the fluoride group compared to control and F+tamarind group (Fig. 1). The carbonic anhydrase activity in kidney was also lower in the fluoride group compared to control and F+tamarind group.
6. The accumulation of fluoride in the teeth and bone was lower in the F+tamarind group compared to fluoride group Table 5.
7. To further investigate at the protein level, we analyzed the expression of CA II by western blotting.The results have shown reduced expression of CAII protein in F group (Fig. 3A & B) (P<.005) indicating that F accumulation in the body significantly affected translation of protein expression of the CA II. The TFE supplementation has resulted in significant increase (P<0.000) in CA II protein expression in kidney.
Table 1. The average bodyweights of the wistar rats from all the groups at monthly intervals
Groups 1st Month 2nd Month 3rd Month 4th Month 5th Month 6th Month
Control 82.28±8.67
245.93±19.08
317.30±23.01
377.00±37.46
421.67±48.87
448.17±44.38
Fluoride 73.15±14.24
170.60±38.31a*
249.25±17.04a*
237.88±56.06a*
295.86±49.42a*
321.14±62.5a*1
Fluoride+tamarind
81.03±9.30
182.94±47.46
253.13±46.99
281.00±46.36
323.88±43.26
337.88±51.28
Tamarind 74.53±18.99
227.16±22.64
301.50±24.68
347.38±30.20
391.88±38.59
440.88±40.11
Fluoride+tartaric acid
77.69±13.77
204.96±22.34
263.50±26.01
289.75±28.15
336.38±26.22
352.57±33.27
Tartaricacid
79.61±7.04
226.36±14.29
298.88±15.81
344.00±22.07
363.75±48.75
393.57±78.03
Statistically significant (p<0.05); a = compared to control group; b= compared to F group c= compared to F+tamarind group; d= compared to Tamarind group; e=compared to F+tartaric acid, f=tamarind group. Results are expressed as mean±SD; n= 6 rats/group.

100
Table 2. The average water and diet of the wistar rats from all the groups at 2, 4 and 6 months
Groups2 Months 4 Months 6 Months
Diet (grams) Water (ml) Diet (grams) Water (ml) Diet (grams) Water (ml)
Control 20.54±0.57 42.61±3.54 17.28±2.12 44.49±3.08 20.08±1.85 43.33±4.80
Fluoride 11.47±0.15a* 21.52±1.9a*4 15.05±0.42a* 26.61±1.15a* 19.28±2.68 30.43±0.25a*
Fluoride +Tamarind 17.16±1.89 22.43±1.0 14.93±1.45 26.42±1.93 18.77±1.84 29.81±2.40
Tamarind 15.67±1.01 31.00±2.58 16.53±0.80 42.95±6.35 19.58±1.42 43.12±2.60Fluoride + tartaric acid 18.13±2.27 22.24±3.20 16.35±0.38 22.81±1.30 19.82±1.92 28.76±2.07
Tartaric acid 17.30±1.68 31.25±4.44 15.59±1.61 13.66±2.54 18.14±1.06 39.33±3.15
Table 3. The average urinary pH of the wistar rats from all the groups at 2, 4 and 6 months
Groups 2 months 4 months 6 monthsControl 8.21±1.23 6.59±0.176 6.71±0.38Fluoride 8.096±0.56 7.23±0.66 7.3±.819Fluoride+tamarind 7.3±0.88 6.64±0.39 7.29±0.841Tamarind 7.59±1.03 6.48±0.16 6.39±0.147Fluoride+tartaric acid 7.5±0.77 6.44±0.176 7.15±0.73Tartaric acid 7.73±0.85 7.33±0.47 6.67±0.41
Table 4. The Urinary fluoride (mg/24h) levels in different groups at 2, 4, and 6 months
Groups 2 months 4 months 6 monthsControl 0.041 ± 0.007 0.065 ± 0.014 0.094 ± 0.011Fluoride (F) 0.645 ± 0.16a* 0.709 ± 0.134a * 0.736 ± 0.104 a*
F + tamarind 0.940 ± 0.201 a*b* 1.048 ± 0.258a*b* 1.017 ± 0.172 a*b*
Tamarind 0.05 ± 0.002b*c* 0.068 ± 0.015b*c* 0.075 ± 0.013 b*c*
F+tartaric acid 0.830 ± 0.12a* 0.935 ± 0.248a* 0.945 ± 0.102a*
Tartaric acid 0.06 ± 0.004 0.067 ± 0.014 0.08 ± 0.013
Statistically significant (p<0.05); a = compared to control group; b= compared to F group c = compared to F+tamarind group; d= compared to Tamarind group; e=compared to F+tartaric acid, f=tamarind group. Results are expressed as mean±SD; n= 6 rats/group
Table 5. The accumulation of fluoride in teeth and bone in different groups
Groups Teeth Fluoride (mg F/g dry teeth)
Femur bone Fluoride (mg F/ g dry bone)
Control 0.1175 ± 0.174 0.325±0.040Fluoride (F) 1.251 ± 0.226 a* 2.973±0.265a*
F+tamarind 1.004 ± 0.1474a*b* 2.197±0.119a*b*
Tamarind 0.146 ± 0.017 0.3412 ± 0.032F+tartaric acid 0.952 ±0.115a* 2.3414 ± 0.188a*
Tartaric acid 0.104 ± 0.008 0.3625±0.025
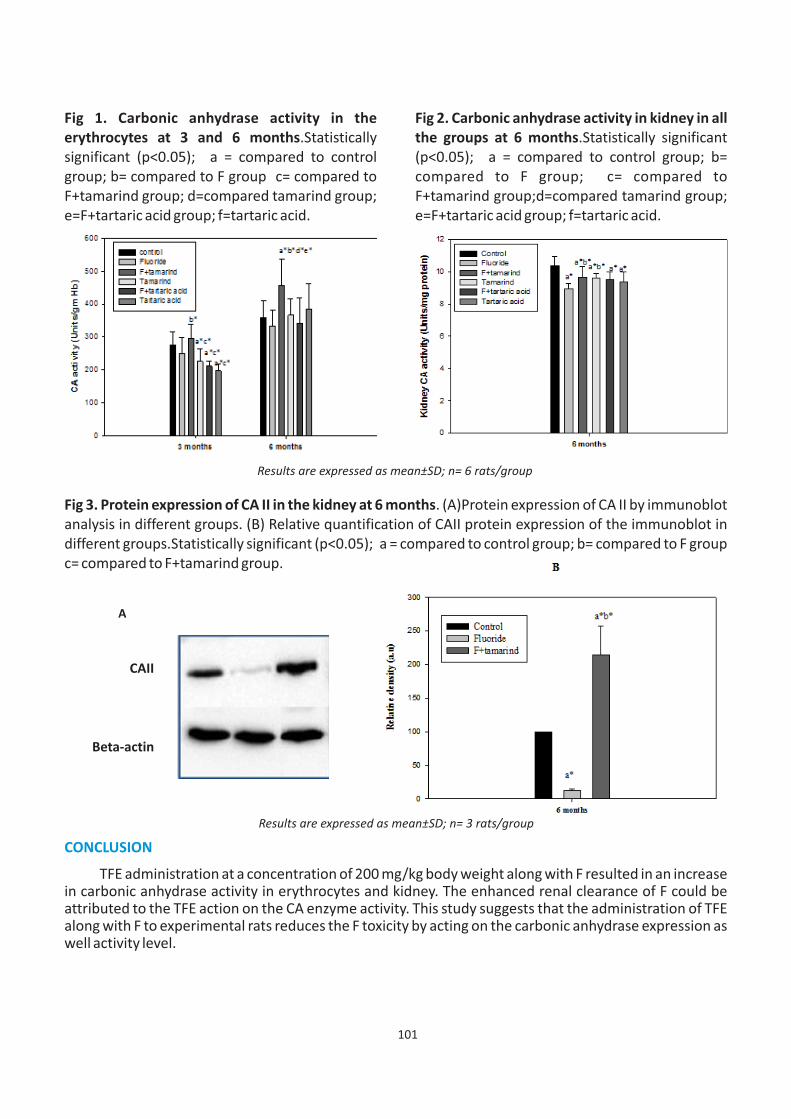
101
Fig 1. Carbonic anhydrase activity in the erythrocytes at 3 and 6 months.Statistically significant (p<0.05); a = compared to control group; b= compared to F group c= compared to F+tamarind group; d=compared tamarind group; e=F+tartaric acid group; f=tartaric acid.
Fig 2. Carbonic anhydrase activity in kidney in all the groups at 6 months.Statistically significant (p<0.05); a = compared to control group; b= compared to F group; c= compared to F+tamarind group;d=compared tamarind group; e=F+tartaric acid group; f=tartaric acid.
Results are expressed as mean±SD; n= 6 rats/group
Fig 3. Protein expression of CA II in the kidney at 6 months. (A)Protein expression of CA II by immunoblot analysis in different groups. (B) Relative quantification of CAII protein expression of the immunoblot in different groups.Statistically significant (p<0.05); a = compared to control group; b= compared to F group c= compared to F+tamarind group.
Results are expressed as mean±SD; n= 3 rats/group
CONCLUSION
TFE administration at a concentration of 200 mg/kg body weight along with F resulted in an increase in carbonic anhydrase activity in erythrocytes and kidney. The enhanced renal clearance of F could be attributed to the TFE action on the CA enzyme activity. This study suggests that the administration of TFE along with F to experimental rats reduces the F toxicity by acting on the carbonic anhydrase expression as well activity level.
CAII
Beta-actin
A

102
2. INTEGRATED FLUOROSIS MITIGATION ACTIVITIES IN NALGONDA DISTRICT
Hydrofluorosis/ fluorosis is caused due to prolonged intake of water with excess fluoride (> 1.0 ppm). The epidemiological evidence that concentrations above this value carry an increasing risk of dental fluorosis and progressively higher concentrations lead to increasing risks of skeletal fluorosis forms the basis of guideline derivation. In India, fluorosis is a public health problem and is endemic in 204 districts of 21 states of India including the Nalgonda district of Telangana. There are few reports available on prevalence of fluorosis in Nalgonda district. The referred studies suggested that 30% population suffer from dental fluorosis, 25% from skeletal deformities as well as bony pains. And 75% of them are below socio-economic status. Some of the villages are being supplied surface (Krishna) water. The data available is not adequate to know the current status of fluorosis (dental and skeletal) in Nalgonda district, to develop the interventional strategy in the affected villages of the district. Therefore, at the request of UNICEF, the present study has been initiated to ascertain the problem of fluorosis in the community of Nalgonda district, Telengana for further intervention.METHODOLOGYStudy design A Total of 2000 students (about 500 in each category) between the ages 8-14 year of both genders are surveyed for anthropometric measurement and clinical examinations. In each category villages, 40% urine and 20% blood samples were collected from surveyed school going children for fluoride and appropriate biochemical examination, respectively. In order to assess the demographic profile and nutritional status among the population in study villages, 10% houses were selected for survey in each category of the area. Selection of villages A total of 227 (168 unfiltered and 59 filtered water samples) drinking water samples were collected from all the drinking water sources in 21 villages. All the water samples were collected in pre-cleaned and dry plastic bottles and transported to the National Institute of Nutrition (NIN), Hyderabad and, stored at 2-8°C in cold room for further water quality parameter analysis. The fluoride levels in all water samples were estimated by Ion Sensitive Electrode (ISE) method, Hyderabad. The fluoride levels in all drinking water sources were ranged from 0.3-6.0 ppm. For the purpose of the present study, the water sources in each of the villages were stratified into four categories on the basis of fluoride level in drinking water as <1, 1.5-3, 3.1-4 and above 4.0 ppm in order to relate to the prevalence of dental mottling at different levels of fluoride. Category 1 served as control and rest of three categories (2, 3 and 4) serves as affected villages. Out of 21 villages, 12 villages (3 villages for each category) were finalized for further survey. Selection of household In each of the selected villages, about 20 households (HHs) were finalized based on the blood samples provided by students from different castes (equal number of houses from each caste) were covered for carrying out various investigations.The following investigations were carried out in the villages selected for the survey.1. Collection of household socioeconomic and demographic particulars such as community, family size
and occupation.2. Examination of all the available individuals in the selected HHs for presence of clinical signs of dental
and skeletal fluorosis.3. Assessment of intake of different foods associated with fluorosis was done among a sub-sample of
HHs covered for clinical examination by conducting semi-quantitative diet survey using a food frequency questionnaire.

103
RESULTS In order to select the study villages according to the study design, a total of 227 (168 unfiltered and 59 filtered water samples) drinking water samples were collected from all the drinking water sources from 21 villages of Nalgonda district. All the water samples were collected in pre-cleaned and dry plastic bottles and transported to the National Institute of Nutrition (NIN), Hyderabad and, stored at 2-8°C in cold room for fluorideanalysis and other water quality parameters. Drinking water fluoride levels in the study areas of Nalgonda district were shown in Table 1. Mean fluoride level in villages of category I was within 1.0 mg/L. Fluoride level in water used for drinking in villages belong to category II to IV were significantly higher than the villages in category I and it was more than permissible limit. Especially, the fluoride levels in drinking water samples from category III and IV were about 2 to 4 times higher than the safe limit. Drinking water fluoride levels in villages of Marriguda and Choutuppal mandals were significantly higher (p<0.05) as compared to the villages of Suryapet and Pochampally mandals. Locations of study villages in various mandals of Nalgonda district are shown in Fig 1.
Category of the village
Name of the mandal
Name of the villages
Fluoride level in water (mg/L)
ISuryapet Pillalamarri
0.83±0.27Pochampally Julur
Marrigudam Koyalagudem
IIChoutuppal D.Nagaram
2.08* ±1.34Choutuppal Malkapur
Pochampally Pillaipally
IIIChoutuppal Tupranpet
2.82* ±0.97Choutuppal Peepalpahad
Marriguda Kudaspally
IVMarriguda Anthampet
3.70* ±1.05Narayanpur Vailapally
Marriguda ShivannagudemValues in Mean ± SD, *Significantly different with category -I (p < 0.05)
Table 1. Levels of Fluoride in drinking water indifferent categories of villages
Fig 1. Locations of study villages in Nalgonda district, Telangana, India

104
Out of the study villages of category 1, namely Pillalamari, Julur and Koilakudam, people from Pillalamari were using the locally available Tap water and bore well water (7 houses out of 21 houses). People in other two villages (Julur and Koilakudam) were using reverse osmosis (RO) water for drinking and cooking 100% (35 houses out of 35 houses). Moreover, the people in these villages were using RO water regularly at all the time may be because of low cost (Rs. 2 to Rs. 3 per 20 liter) since 2 years. In addition, the schools of these villages were also using filter water for drinking as well as midday meal cooking purposes. The high tech technology is being used in these villages to get RO water through card at any time is shown in the Fig 2. Villages such as Pillalamari, Julur and Koilakudam are belong to study area under category I, people in Pillalamari are mostly using the locally available Tap water (12 houses out of 21 surveyed houses) and bore well water (7 houses out of 21 surveyed houses). Only 3 houses out of 21 in this village are using the filter water through reverse osmosis process for drinking purpose.
Fig 2. Card using for receiving the filter water from RO plants
People in all the surveyed houses (59 houses) in the study villages of category II (D.Nagaram, Malkapur and Pillaipally) were using RO water for drinking and cooking purposes. Two villages (D. Nagaram and Pillaipally) were using the RO water for the last 5 years however, the people from Malkapur village have been using the RO water since 10 years at thecost of Rs.3 per 20 litre. People from category III villages such as Thupranpet and Peepallapahad were also using RO water (40 out of 40 houses) for the last 2 years with marginal higher cost (Rs.5 per 20 liters). However, we found interesting observation that the schools of Thupranpet village were providing the bore well water having higher F content for drinking and midday meal cooking. The team advised to the concern authorities to provide safe drinking water to the school children. However, regular monitoring is needed to confirm the provision and availability of safe drinking water in schools for drinking and cooking purpose to the children. In addition, the people from village Kudabakshipally 55% were using bore well water (11 out of 20 houses), 15% Tap water (3 out of 20 houses) and 30% RO filter water (6 out of 20 houses). Even though the village was listed in the provision of Krishna water supply, none of the houses during the survey in this village were using the Krishna water due to irregular and inadequate Krishna water supply. Moreover, the mean fluoride level in bore well water samples (n = 12) used for drinking purpose collected from this village shows 2.82± 0.97 mg/L. Hence, it is recommended to take all necessary steps immediately to provide and monitor the regular and adequate supply of safe drinking water to this village and schools located in this village. In addition, the people in villages such as Anthampet and Vailapally in category IV are also not using the Krishna water due to irregular and inadequate supply. Most of the houses (16 out of 39 surveyed

105
houses (41%)) in Anthampet and Vailapally villages are using RO filter water and 21 houses out of 39 were using the locally available tap water and the people in 2 houses out of 39 are using the bore well water. However, there was no RO filter plant located in the Anthempet village; people are collecting the RO water from Vailapally. As, it is difficult to get the water regularly from another village little far away from the Anthempet, people are supposed to use the locally available ground water with high fluoride level. Moreover, the mean fluoride level in drinking water samples collected from the Anthempet village was 2.95 mg/L with the standard deviation of 1.01. People in Vailapally village are receiving the RO water only from the year of 2014. As the capacity of the RO filter plant running in the Vailapally village is about 5000 liter per day, it is inadequate to meet the needs of the local people. Fig 3 shows the RO filter available in the Vailapally village.
Fig 3. Reverse Osmosis filter plant available in Vailapally village of Nalgonda District
Moreover, the Sivannaguda village in category IV receiving Krishna water for more than 5 years. In most of the house (16 out of 20 houses) in this village are using the Krishna water and only 4 houses out of 20 are using the water from RO plant located in this village. Nutritional status of children between 8 to 14 year in study areas of different categories in Nalgonda district were assessed through the anthropometric measurements such as height and weight, the results were expressed as height-for-age and Body Mass Index (BMI) for age compared with WHO reference standard. Table 2 and 3 illustrate the nutritional status of the children in study areas of different categories in Nalgonda district, based on the levels of BMI for age and height for age. According to the BMI for age, a total of 638 out of 2066 (30.9%) children in all the study areas were under poor nutrition status (Table 2) and the prevalence of stunting (lower than reference height for age) was 26% (537 out of 2066) in the study areas (Table 3). Furthermore, the observed BMI levels of children were significantly lower (p < 0.05) in category III and IV than the children in category I and II. Prevalence of stunting was significantly higher (p < 0.05) in IV category villages (32%) than the children in villages in category I and II (Table 3). However, the percentage of prevalence of stunting was similar in category I and II (27%). Prevalence of fluorosis among children in study villages A total 2066 students of both genders were examinedfor dental fluorosis in selected categories of villages.As the increase in drinking water fluoride levels, increases the prevalence of dental fluorosis was
st nd rdmonitored from increase of grade 1 , 2 and 3 of dental fluorosis. Out of 2066 students, 1183 students nd th(57.2%) were affected by dental fluorosis. Prevalence of fluorosis in villages of 2 to 4 categories was
stsignificantly higher than the 1 category villages. The percentage prevalence of fluorosis in each category villages was 16% (Category I), 47% (Category II), 81% (Category III) and 82% (Category IV). (Fig 4).

106
Table 2. Nutritional status of 8-14 year old children according to BMI for age level in study areas of Nalgonda district, Telangana
Area categoryBMI
(kg/m2) Mean ± SD
Nutritional status of 8-14 years old childrenThinness (< -2SD) Normal (> -2SD)N % N %
I (n = 506) 16.1 ± 2.33 138 27.3 368 72.7II (n = 504) 16.0 ± 2.70 155 30.8 348 69.2III (n = 548) 15.8*± 2.39 158 28.8 390 71.2IV (n = 509) 15.2*± 2.06 187 36.7 322 63.3
Total (n = 2066) 638 30.9 1428 69.1Values represents Mean ± SD, *Significantly different with category I (p < 0.05)
Table 3. Nutritional status of 8-14 year old children according to height for age in study areas of Nalgonda district, Telangana
CategoryTotal No. of
Children surveyed
Nutritional status of 8-14 years old childrenStunting (< -2SD) Normal (> -2SD)
N % N %I n = 506 135 27 371 73II n = 503 137 27 366 73III n = 548 104 19 444 81IV n = 509 161 32* 348 68
Total (n = 2066) 537 26 1529 74*Significantly different with category I (p < 0.05)
Fig 4. The prevalence of dental fluorosis (%) in 8-14 years age group children of different
category villages in Nalgonda district
Prevalence of dental fluorosis was compared between girls and boys .A total of 977 boys and 1090 girls were surveyed, out of 977 boys, 577 boys (59.1%) were affected and out of 1090 girls, 606 girls (55.6%) were affected by different grades of dental fluorosis.
Overall, boys were more affected (4% higher) than girls and also followed the same
st rd thtrend in each category (1 - 6.6%, 3 - 6.1% and 4 - 6.7% higher than girls) villages. The relationship between drinking water fluoride levels on the prevalence of fluorosis among the children in different categories of villages were shown in Fig5.
Fig 5 represents the dental fluorosis prevalence in different age group children of both genders in different category villages. Increase of age (increase of exposure) and fluoride level significantly (p < 0.05) increases the prevalence of dental fluorosis in affected villages.
Fig 5.The prevalence of dental fluorosis in different age group children in different
categories from Nalgonda district

107
4.4. Biochemical Parameters in urine and blood
Urinary fluoride and serum T3, T4 and TSH levelsin children of both sexes (girls- 98 and boys- 108) rdwere estimated. Significantly high urinary F level was observed in the 3 category of village children of
st nd thboth genders than 1 , 2 and 4 category villages. There was no significant difference in urinary F levels of st nd thboth sexes between 1 and 2 categories villages. Similarly, 4 category village children urinary F was not
ndsignificantly different from 2 category children of both sexes. However, the urinary fluoride levels among th stboys of 4 category was significantly (p<0.05) higher than the urinary fluoride levels of boys in 1 category
villages. st Significantly lower T3 levels was observed in boys of the 4th category village children than 1
nd rd st(p<0.001), 2 (p<0.05) and 3 (p<0.05) category villages. However, in 1 category village children T3 levels nd rd thof boys was significantly higher (p<0.05) than 2 , 3 and 4 category village children. As water fluoride
st thlevels increases (from 1 to 4 category villages) the T3 levels was decreased in girls. However, the st nd rd thdifference was significant only in 1 category villages as compared to 2 , 3 (p<0.05) and 4 (p<0.001)
nd rdcategory villages. There was no significant difference in T3 level between 2 and 3 category village children of both sexes. The T4 levels in children of both sexes (girls- 109 and boys- 101) wereanalysed.
thSignificantly (p<0.001) lower T4 level was observed in 4 category village children of both sexes as st nd rdcompared to 1 , 2 and 3 category village's children. However, there was no significant change in T4
st nd rdlevels was observed between 1 , 2 and 3 category village children of both genders. The TSH levels in children of both genders (girls- 109 and boys- 101) were analyzed. There was no significant change in TSH levels of both sexes between all the category villages. As water-F has a positive correlation with urinary
rdfluoride (up to 3 category) and negative correlation with T3 and T4 (Table 4).
Table 4. Urine fluoride and serum T3, T4 and TSH levels of 8-14 years children in Nalgonda district
Category of
villages
Urine-F (mg/l) T3 (ug/dl) T4 (ng/ml) TSH(Mu/l)
Boys Girls Boys Girls Boys Girls Boys Girls
I(N= 25)1.65±0.958
(N= 22)1.55
± 0.58
(N= 25)2.04±0.465
(N= 23)1.96±0.725
(N= 25)125.36± 27.0
(N= 22)123.63± 30.20
(N= 25)2.38
± 1.023
(N= 23)1.73
± 0.751
II(N= 29)2.09±1.235
(N= 26)1.44
± 1.03
(N= 28)1.53±
0.401a**d*
(N= 26)1.45±
0.680a*
(N= 29)131.34±
38.22d**
(N= 26)124.03
± 19.88 d**
(N= 29)2.00
± 0.804
(N= 26)2.26
± 1.018
III
(N= 28)3.84±1.747
a**b**d**
(N= 21)2.49
± 1.26 a*b**d*
(N= 28)1.58±
0.56a**d*
(N= 23)1.39±
0.482a*
(N= 28)122.78±
31.24d**
(N= 23)112.95± 33.88
d*
(N= 28)2.13
± 1.160
(N= 22)2.07
± 1.262
IV(N= 26)2.46±
1.36a*
(N= 29)1.72
± 0.879
(N= 27)1.22±
0.421a**
(N= 30)1.19±
0.536a**
(N= 27)84.81±
36.60 a**
(N= 30)95.10±
40.53 a*
(N= 27)2.01
± 0.745
(N= 30)2.20
± 0.988Values represents mean ± Standard deviation, I = a, II = b, III = c and IV = d: Significant at p <0.05 = * and p<0.001 = **
The activity of total alkaline phosphatase was assayed in serum of 8-14 years age children of both sexes (girls- 106 and boys- 102). The total alkaline phosphatase activity of boys was significantly (p<0.001)
rd st nd thhigher in the 3 category of villages than 1 and 2 & 4 category villages (p<0.05). However, there was no significant difference in the total ALP level of girls between all the category villages. The PTH levels
nd st thinchildren of both sexes in 2 category villages weresignificantly (p<0.05) higher than 1 and 4 category village. There was no significant difference in 25-OH Vitamin-D levels of boys between all categories of

108
ndvillages. However, 25-OH Vit-D levels were significantly (p<0.001) lower was observed in girls of 2 st rdcategory villages than 1 category villages. The 25-(OH)- Vitamin D levels of 3 category village children
stwere also significantly lower than 1 category villages.Significantly higher 1,25-(OH) Vitamin-D levels 2rd st ndwere observed in 3 category village children than 1 (p<0.001) and 2 (p<0.05) category village children
of both sexes. Table 5. Serum Total ALP, PTH, 25-(OH)- Vitamin D and 1,25 –(OH) vitamin-D levels of 2
8-14 years children in Nalgonda district
CONCLUSIONS· Fluoride levels in drinking water samples collected from all the villages except the control category
shows more than 1.5 mg/L. · A total of 69% houses (162 houses out of 234) were using reverse osmosis (RO) treated water for
drinking purposes. · A total of 30.9% children in the study areas were under malnutrition and the prevalence of stunting
was 26% in the study areas of Nalgonda. · A total of 57.2%school children were affected from dental fluorosis. · A total of 59.1% boys and 55.6% girls were affected with different grades of dental fluorosis.· A total of 1087 peoples were surveyed in study villages and found 538 (49.5%) peoples were affected.
Categoryof the
villages
Total ALP(IU/l) iPTH(pg/ml)
25-OH Vitamin-D(ng/ml)
1, 25-(OH)2Vitamin- D
(pg/ml)Boys Girls Boys Girls Boys Girls Boys Girls
I(N= 24)
291.65 ±122.45
(N= 23)281.60 ±152.88
(N= 25)17.22± 7.28
(N= 23)18.37± 9.33
(N= 25)33.84
± 14.11
(N= 21)39.81
± 24.81
(N= 20)28.70
± 25.16
(N= 19)50.36
± 38.58
II(N= 28)
360.26 ±122.4
(N= 26)295.11 ±134.82
(N= 29)18.89± 5.88
(N= 26)24.38±
10.80a*d*
(N= 28)27.96± 9.25
(N= 26)23.88±
7.10 a**
(N= 26)73.00±
48.27a**
(N= 19)77.73
± 57.50
III
(N= 27)433.26
± 164.71 a**b*d*
(N= 23)374.22
± 212.01
(N= 28)17.96± 4.50
(N= 23)20.87± 9.39
(N= 28)30.92
± 14.87
(N= 23)28.13 ±8.80 a*
(N= 21)108.19± 54.36 a**b*
(N= 20)109.75± 45.63a**b*
IV(N= 27)
321.34 ±81.65
(N= 30)279.59
± 105.92
(N= 27)19.33± 9.51
(N= 30)18.08± 5.66
(N= 27)32.51
± 11.54
(N= 30)31.43
± 18.04
(N= 21)95.09 ±
31.15a**
(N= 24)98.00 ±
42.01a**Values represents mean ± Standard deviation, I = a, II = b, III = c and IV = d: Significant at p <0.05 = * and p<0.001 = **

109
3. EMERGING BACTERIAL FOODBORNE PATHOGENS IN MILK PRODUCTS
Food-borne diseases pose a threat to human health and the economy of individuals, families and nations. In the Western hemisphere and in Europe, Salmonella serotype Enteritidis (SE) has become the predominant strain. Other foodborne pathogens are considered emerging because they are new microorganisms or because the role of food in their transmission has been recognized only recently. Infection with Escherichia coli serotype O157:H7 was first described in 1982. Subsequently, it has emerged rapidly as a major cause of bloody diarrhoea and acute renal failure. Changes in microbial populations can lead to the evolution of new pathogens, development of new virulent strains in old pathogens, development of antibiotic resistance that might make a disease more difficult to treat, or to changes in the ability to survive in adverse environmental conditions (WHO, 2011). A review on foodborne diseases in India indicated that majority of the foodborne disease were caused due to vegetarian foods. In other countries the incidence of foodborne diseases were more due to non vegetarian stuffs such as beef, pork meet, frozen steaks, poultry and other meat items. Among the foods implicated in India, milk and milk products were predominantly involved in the foodborne disease outbreak. A recent study in India on detection of E.coli 0157:H7 in market dairy food samples indicated that one samples each of milk, paneer and ice cream was found to be positive for E.coli 0157:H7. Among VTEC (vero cytotoxin producing E.coli) E.coli 0157:H7 has become widely recognized as a very important cause of foodborne illness. New serotypes such as O groups 026, 0103, 0111 and 0145 E.coli 0157:H7 also cause foodborne human intestinal infectious disease. A recent example is 0103:H25 VTEC isolated during an outbreak in Norway which was never previously reported or characterized. A better understanding of the distribution, epidemiology and threat posed by emerging and uncharacterized pathogens is needed because they are poorly controlled, spread globally, rapidly through the food chain. The detection, reporting and characterization of foodborne illnesses play an important role in identifying the origins and incidence of disease when links can be made to the causative agents and the foods involved. The causes of many reported foodborne illness outbreaks remain unidentified, and hence the risks to consumers cannot be assessed and appropriate preventive measures taken. In this context it is essential to detect and characterize emerging foodborne pathogens in milk products. The objective of this study is to determine the prevalence of emerging foodborne pathogens and their persistence and survival at different conditions in milk products. METHODOLOGY Study was carried out in Hyderabad which is the capital of Andhra Pradesh, India. The twin cities of Hyderabad and Secunderabad come under ambit of a single municipal unit, the greater Hyderabad municipal corporation. Random sampling procedure was adopted to select five zones out of it. The sample required for the study was be obtained using probability proportion to size method. A standard proforma to collect information on milk products from procurement points was prepared. The proforma was pretested and collected the information on demographic data, product information and personal hygiene of the shop keeper. The demographic data includes information on date of purchase, procurement point, region, district, mandal, area/locality, shop type and owners name. The product information such as name of the milk product, date of manufacture, date of expiry, lot/batch no (quality symbol), amount of product purchased, type of storage, type of container used for storage, storage temperature, duration of storage, mode of transportation, source of supply, type of milk used for preparation was collected. The information on personal hygiene of the shop keeper like wearing gloves, frequent cleaning of hands, cleanliness of clothing and status of nails were also collected. Based on the prevalence of emerging foodborne pathogens in the pilot study, Rasmalai, Kulfi-icecream, Paneer, and Khoa were selected. As per the study design, a total of 400 samples were collected from randomly selected procurement points of Hyderabad. Twenty five Grams of each sample was

110
weighed and transferred to 225 ml of sterile buffered peptone water. The diluents of buffered peptone water were then inoculated on to the respective media. Identification and enumeration of foodborne pathogens such as Escherichia coli 0157:H7 Listeria monocytogenes, Yersinia enterocolitica, Methicillin resistant Staphylococcus aureus (MRSA) and Salmonella spp. was US-FDA bacteriological analytical performed as described by standard methods ofmanual. After thoroughly mixing the food sample (25g) in buffered peptone water (225ml) by 1:10 dilution the diluents were inoculated onto their respective enrichment and selective media such as Listeria enrichment broth and Listeria selective agar (PALCAM) for Listeria monocytogenes, Escherichia coli 0157:H7 Escherichia coli 0157:H7 selective agar for Escherichia coli 0157:H7, enrichment broth and MRSA selective agar for Methicillin resistant Staphylococcus aureus , MSA (Mannitol salt agar) for Staphylococcus aureus with small round pale colored colonies, Selenite broth and XLD (Xylose lysine deoxycolate agar) for Salmonella spp. with red colored colonies with black centre and YSA (Yersinia selective agar) for Yersinia spp. with transparent colonies with pink centre. After inoculation the plates
0were incubated for 24hrs at 37 C in incubator. Morphological tests such as Grams staining and motility tests (coagulase test for S. aureus) were conducted followed by biochemical tests using Hi assorted biochemical test kit (A combination of 12 tests for identification of gram negative rods. Kits contains sterile media for citrate utilization, lysine utilization and ornithine utilization, urease detection phenylalanine deamination (TDA), Nitrate reduction, H2S production test and 5 different carbohydrates for utilization test – Glucose, Adonitol, Lactose arabinose, Sorbitol ) followed by latex agglutination test kit supplied by Himedia. All microbial counts were converted to the base -10 logarithm of the number of colony forming units per ml of milk samples (log cfu/ml) and from the means and their standard deviations. Data was analyzed using Analysis of Variance (ANOVA) through the General Linear Models (GLM) procedure of the statistical analysis system software (SPSS version-11.5, 2003). Least significant differences was used to test means at p<0.05.RESULTSŸ Analysis of 400 milk products indicated the presence of foodborne pathogens like Salmonella and
S.aureus. The other indicator organisms like E. coli and fecal coliforms were also detected in the milk products.
Ÿ The contamination of Salmonella enterica (15.7%) was high in paneer than rasmalai, khoa and kulfi. The contamination of S.aureus (73.5%) was high in khoa than other milk products.
Ÿ The other emerging foodborne pathogens like Listeria Spp. Methicillin resistant staphylococcus aureus(MRSA), Yersinia enterocolitica and E.coli O157:H7 were not detected in any of the milk products.
Table 1. Incidence of foodborne pathogens (% of contamination) in milk products sold in various localities of Hyderabad
Milk products(n=400)
Foodborne pathogens
S.aureus S. enterica
F. coliforms E.coli Listeria
spp.Yersinia
Spp. MRSA Campylobacter
E.coli0157:H7
Rasmalai 32 (31.7%)
6(5.9%)
21(20.8%)
10 (9.9%) ND ND ND ND ND
Khoa 75 (73.5%)
10(9.8%)
48(47.1%)
32 (31.4%) ND 6
(5.8%) ND ND ND
Paneer 29 (28.4%)
16 (15.7%)
64(62.7%)
46 (45.1%) ND 1
(1%) ND ND ND
Kulfi 22 (22.0%)
12(12%)
13(13.0%)
6 (6.0%) ND 1
(1%) ND ND ND

111
Ÿ The contamination of E.coli (45%) and fecal coliforms (62.7%) were high in paneer than other milk products.
6Ÿ Khoa (52%) samples were found to contain S.aureus above 10 cfu/g which is likely to produce heat
stable enterotoxin. The presence of Salmonella spp. in milk product is a cause of concern in consumer point of view.
Ÿ The percentage contamination of foodborne pathogens was high in summer season than in winter except foodborne pathogen S. aureus.
Ÿ The information collected on milk products indicated that 70% of milk products were kept in refrigerated condition and 30% were kept at ambient temperature. The information on personal hygiene of shop keeper indicated that 92% of the shopkeepers were not wearing gloves while serving milk products. Only 31% of shop keepers wore clean clothes and 33% of shop keepers cut their nails.
Ÿ Statistical analysis was done to see the association between food safety practice and milk products contributing to foodborne pathogens. A significant association was found between type of storage and log concentration of S.aureus in khoa whereas with water for washing hands, status of nails, cleaning cloth were contributing to foodborne pathogens in other milk products.
Table 2. Mean concentration ranges of foodborne pathogens in milk products
Food Category
S.aureus F.coliforms E.coli
Mean Std deviation 95 %CI Mean Std
deviation 95 %CI Mean Std deviation 95 %CI
Rasmalai 4.5 1.49 4.0-5.1 20 1.7 3.2-4.9 9 1.8 3.2-6Khoa 6.1 1.36 5.8-6.4 48 1.6 4.4-5.3 32 1.6 4.7-5.9Paneer 4.1 1.36 3.6-4.6 63 1.6 4.4-5.2 44 1.5 4.6-5.5Kulfi 4.1 1.31 3.5-4.7 13 1.2 2.6-4.1 6 1.6 2.1-5.6
Table 3. Association between food safety practices and milk products contributing to foodborne pathogens
Variable Milk Product Foodborne pathogen Catagories
P ValueType of storage Refrigerated Ambient
Khoa E.coli 42.1 85.7 0.05*Paneer S.aureus 59.6 88 0.001**Paneer E.coli 21.2 42 0.05*Kulfi F.coliforms 14.3 26.9 0.01**
Water for washing hands Borewell water Municipal waterRasmalai S.aureus 47.2 19.6 0.05*khoa F.coliforms 57.1 31 0.01**khoa E.coli 53.1 11.9 0.01**Paneer F.coliforms 69.3 31.3 0.01**
Status of nails Cut UncutRasmalai S.aureus 13.6 29.1 0.05*Khoa S.aureus 8.1 40 0.01**Kulfi S.aureus 14.3 38.4 0.01**Kulfi F.coliforms 10.7 24.7 0.05*
* P<0.05 indicates statistical significance at 95%CI; **P<0.01 indicates statistical significance at 99%CI

112
Table 4. Risk estimate of foodborne pathogens with food safety practicesassociated with milk products
Variable Milk product Foodborne pathogen OR (CI) P Value
Water for washing hands (Ref- Municipal water, Risk-Borewell water)
Rasmalai S.aureus 5.58(1.86-16.7) 0.01*
Khoa F.coliforms 3.20(1027-8.06) 0.01*
Paneer F.coliforms 9.44(1.77-50.4) 0.05**
Khoa S.enterica 0.022(0.001-0.5) 0.05*
Status of nails (Ref-cut, Risk-uncut) Khoa S.enterica 17.2
(1.52-195.8) 0.05*
* P<0.05 indicates statistical significance at 95%CI; **P<0.01 indicates statistical significance at 99%CI
Table 5. Population (log10cfu/g) of S.aureus on Rasmalai after storage at4, 10 and 37 deg c for different length of time (0, 1,2,4,6,8,10 & 12d)
MlikProduct
Foodborne pathogen
Storage time (d)
Temperature4 10 37
Rasmalai S.aureus
0 2.61±0.00 2.72±0.02 2.72±0.021 2.49±0.00 2.50±0.00 3.34±0.062 2.45±0.01 2.53±0.04 3.32±0.024 1.93±0.01 2.18±0.02 3.36±0.026 1.23±0.09 2.14±0.00 2.75±0.028 2.02±0.02 2.19±0.14 2.48±0.01
10 1.77±0.04 2.79±0.02 2.92±0.0312 0.64±0.06 2.86±0.04 3.03±0.04
oŸ Study on persistence and survival of S. aureus at different temperature (4, 10 and 37 C) for different
length of time (0-12 days) indicated that, S. aureus population varied with temperature and showed ohighest population at 37 C.
Ÿ The antibacterial activity of nisin against S. aureus and Salmonella spp. indicated that the minimum inhibitory concentration was observed at 2.5 mg/ml.
Ÿ Among S. aureus (n=143) cultures analysed for enterotoxin and coagulase enzyme, nine cultures (6.3%) showed positive result for enterotoxin production (ELIZA) and 106 (74.1%) showed positive result for coagulase enzyme production.
Food Pathogen
Con. Of Nisin (mg)
Clear zone (mm)a
S.aureus
40 4.15±0.0720 3.6±0.6310 3.2±0.075 3.1±0.07
2.5 2.1±0.071.25 NGb
Table 6. Antibacterial activity of nisin against S.aureus
Table 7. Antibacterial activity of nisin against Salmonella spp.
Food Pathogen
Con. of Nisin (mg)
Clear zone (mm)
Salmonellaspp.
40 6.1±0.0720 5.1±0.0710 4.1±0.075 4.1±0
2.5 3.1±0.071.25 NG

113
Table 8. Coagulase diversity in Staphylococcal enterotoxin producing S.aureusfrom food sample
Type of foods No. of foods Coagulase + Coagulase - EnterotoxinDhal 7 5 2 2Hand Washings 7 6 1 0Khoa 36 27 9 0Kulfi 5 4 1 0Non veg 12 5 7 2Paneer 7 6 1 0Pine apple FJ 2 2 0 0Rasmalai 22 20 2 1Rice 27 17 10 2Sapota FJ 2 2 0 0Veg curry 16 12 4 2Total 143 106 (74.1%) 37 (25.9%) 9 (6.3%)
CONCLUSIONSŸ Emerging foodborne pathogens like Methicillin resistant staphylococcus aureus (MRSA), Yersinia
enterocolitica, Listeria monocytogenes and E.coli O157:H7 were not detected in any of the milk products.
6Ÿ Both Khoa and Paneer samples were found to contain S.aureus above 10 cfu/g which is likely to
produce heat stable enterotoxin. However very few S.aureus isolates (6.3%) were able to produce enterotoxin. Coagulase diversity among S.aureus isolates indicated that coagulase positive cultures were more (74%) than the coagulase negative (26%) cultures. Both coagulase positive and negative cultures were able to produce enterotoxins. Further molecular characterization of classical and novel genes encoding different enterotoxins is necessary to find out different types of enterotoxins.
Ÿ The significant association found between type of storage and log concentration of S.aureus in khoa whereas with water for washing hands, status of nails, cleaning cloth contributing to foodborne pathogens in other products indicated that there is a need to provide food safety training to food handlers to improve food safety.
4. STUDIES ON SALMONELLA DECONTAMINATION OF FOODS USING HYBRID TECHNOLOGY OF OZONE-PULSED UV
Salmonella belongs to the genus gram negative bacteria and it causes Salmonellosis which is one of the most commonly and widely distributed foodborne diseases. It constitutes a major public health burden and represents a significant cost in many countries. Millions of human cases are reported worldwide every year and the disease results in thousands of deaths. Food contamination with Salmonella is an important cause of detention and rejection of shipments of food in export markets.

114
These foods include spices, spice mixtures, aquaculture products and many other products. Pasteurization and sterilization of food products can effectively kill this pathogen, but the presence of Salmonella in spices or spice mixtures and other food products which cannot be pasteurized or sterilized is the major concern. In recent years, ozone is being considered as a potent antimicrobial agent which can be used for pathogen reduction. One of the limiting factors for ozone application is short half life of ozone molecule, but this can be extended by using the pulsed UV. AIMS AND OBJECTIVES To study the effect of ozone-pulsed UV on Salmonella contamination in spices.MATERIALS AND METHODSBacterial Strains The pure cultures of Salmonella spp. (MTCC-1162) was obtained from Microbial Type Culture Collection Centre (MTCC), Chandigarh, India.Preparation of bacterial culture All the strains of pure culture were initially inoculated on to Nutrient broth procured from HIMEDIA
0and kept for incubation at 37 C for 24hr. After the incubation is over, the bacterial culture was sub cultured on Nutrient Agar slant. The pure culture was maintained on Nutrient Agar slant till further experiment. For the experiment a loopful of individual bacterial culture was inoculated on to Nutrient broth and
0incubated at 37 C for 24hr. After the incubation 1 ml of the exponential growth phase culture was taken -3for serial dilution in peptone water. The dilution 10 was taken for the further experiment which yielded
886 cfu/ml (2.9 log) of Salmonella Spp. Inoculation of bacterial culture
-3 Initially 0.1 ml of bacterial culture (10 ) was inoculated on Nutrient agar by spread plate method. One set of inoculated petriplate was kept in the incubator as control. The other set of inoculated petriplates were exposed for disinfection treatments. The inoculation of each culture was done in triplicates.Preparation of spice samples Before ozone treatment the pepper and chilli samples were weighed and subjected to surface sterilization. The surface contamination of pepper was removed by steam sterilization (autoclave). The chilli samples were dipped in 90% alcohol for 15 mins. After surface sterilization the samples were air dried and used for ozone treatment.Inoculation of spice samples Whole Pepper, whole chilli along with their powder samples were obtained from the market and inoculated with Salmonella sp. The spiking of chilies and pepper with pure bacterial culture was done by
-3using standard method. Pepper and chilli samples were dipped in the solution of serially diluted 10 concentration of Salmonella for 15mins. The spice samples were then separated from the inoculun with the help of sterilized spatula and forceps. The spice samples were then exposed to ozone in combination with UV. Each spice sample without ozone exposure was considered as a control. After the ozone and UV treatment the spice sample was added to buffered peptone water. The inoculation of each spice sample was done in quadruplicates. Disinfection treatmentOzone The inoculated plates were exposed in the fumigator with ozone for about 20 min. The amount of ozone released during the exposure was 1.4 ppm/ second. After the exposure the plates were kept back in
0the incubator at 37 C for 24hr.

115
Ozone and Ultraviolet light The inoculated plates were exposed in the fumigator with ozone and pulsed UV for about 20 min. The amount of ozone and pulsed UV released during the exposure was 1.4 ppm/second and 0.380
3 0pulses/sec/10 . After the exposure the plates were kept in the incubator at 37 C for 24hr.Microbiological analysis Approximately 25g of each ozone treated spice samples were placed in 225 ml of buffered peptone water. Thorough mixing will be done and 100ml of the sample was inoculated on XLD agar by spread plate
0method. The respective plates were kept for incubation at 37 C for 24hrs then bacteria were counted. Analysis of moisture, ash and fat content Analysis of moisture, ash and fat content of ozone treated and non treated spice samples was done according to standard methods.RESULTSŸ Efficacy of Ozone in combination with UV and laser on Salmonella spp. (MTCC 1162) at different conc.
(0.2, 0.8 &1.4) and exposure time (5, 10, 15 & 20) on Salmonella spp. indicated that significant reduction (99.3%) was observed at 0.8 ppm and 20 min of exposure time (Table-1). The effect of ozone along with UV indicated that significant reduction was observed (100%) at 0.2 ppm and 20 min of exposure time. The effect of ozone along with UV and laser indicated that significant reduction was observed (100%) at 0.2 ppm and 20 min of exposure time.
Ÿ Efficacy of Ozone in combination with UV and laser on Staphylococcus spp. (ATCC) at different conc. (0.2, 0.8 &1.4) and exposure time (5, 10, 15 & 20) on Staphylococcus Spp. indicated that significant reduction (98.13%) was observed at 0.8 ppm and 20min of exposure time. The effect of ozone along with UV indicated that reduction was observed (68.24%) at 1.4 ppm and 20 min of exposure time. The effect of ozone along with UV and laser indicated that significant reduction was observed (93.95%) at 1.4 ppm and 20 min of exposure time (Table-2).
Ÿ Effect of ozone and extended duration of UV on Salmonella spp.(MTCC-1162) indicated that a significant reduction (98.6%) was observed at 0.2 ppm and 20 min of extended UV exposure and a significant reduction (99.5%) in Salmonella was observed at 0.2 ppm and 25 min of extended UV exposure (Table-3).
Ÿ The spiking of chillies and pepper with pure bacterial culture was done by using standard method. Initially the surface contamination in chillies was removed by wiping them using 95% alcohol and then
-1dried for 15 min. Then the chillies were spiked by dipping them in the bacterial culture (10 ) for 15min. The surface contamination of pepper was removed by steam sterilization (autoclave). Then the pepper was spiked by dipping in 95% alcohol and then dried for 15 min.
Ÿ Inactivation of Salmonella spp. in chilli and their log reduction (log cfu/g) by ozone indicated that 51.69% Salmonella reduction was observed at 0.2 ppm conc. of ozone and 10 min. of exposure time.
Table 1. Effect of ozone (0.2, 0.8 and 1.4 ppm) on gram negative (Salmonella spp.) bacteria (Strain MTCC 1162) at different exposure time (5, 10, 15 and 20min)
Ozone
Exposure time (min)
Ozone concentration (ppm)0.2 0.8 1.4
Mean ±SD % reduction Mean ± SD %
reduction Mean ± SD % reduction
0 3.17±0.03 3.17±0.03 3.17±0.035 3.06±0.05 13.4% 2.80± 0.22 20.6% 2.91± 0.01 24.28%
10 2.46±0.07 80% 2.30 ±0.29 72.73% 2.52± 0.04 69.37%15 1.84±0.05 95.3% 2.23 ±0.02 84.37% 2.03± 0.07 89.82%20 1.52±0.19 97.5% 0.66±0.57 99.3% 1.76±0.05 95.2%

116
Ÿ Inactivation of Salmonella spp. in chilli and their log reduction (log cfu/g) by ozone with extended UV indicated that there was 48.3% reduction in Salmonella at 0.2 ppm conc. of ozone with 10 min of exposure time along with 20 min of extended UV.
Ÿ Analysis of market samples of chillies (n=30) for Salmonella spp. indicated thatSalmonella spp. was found in 3 (10%) of the chilli samples.
Ÿ Inactivation of Salmonella spp. in chilli and their log reduction (log cfu/g) by ozone with extended UV indicated that a significant reduction of 85.9% was observed at 1.4 ppm conc. of ozone and 15 min of exposure time along with 30mins of UV exposure (Table-4).
Ÿ Inactivation of spiked Salmonella spp. in pepper and their log reduction (log cfu/g) by ozone with extended UV indicated that a significant reduction of 98.76% was observed at 1.4 ppm conc. of ozone and 15 min of exposure time along with 30mins of UV exposure (Table-5).
Table 2. Effect of ozone on gram positive (Staphylococcus aureus) bacteria
Ozone
Exposure time(min)
Ozone concentration (ppm)0.2 0.8 1.4
Mean ±SD
% reduction Mean ± SD % reduction Mean ±SD % reduction
0 2.58±0.15 2.58±0.15 2.58±0.155 2.53±0.09 12.5% 2.49±0.0 22.5% 2.80± 0.04 7.15%
10 2.41±0.03 33.75% 2.29±0.35 42.5% 2.51± 0.03 52.86%15 2.36±0.02 42.5% 2.25±0.02 55% 2.26± 0.01 73.58%20 2.09±0.19 67.5% 0.87±0.04 98.13% 1.12±0.07 98.08%
Table 3. Effect of ozone and UV (for extended time period) on gram negative (Salmonella spp.)
bacteria (Strain MTCC 1162)
CombinationExposure
time(min)
Ozone concentration (ppm)
0.2ppmMean±SD % reduction
Control 0 3.17±0.03
Ozone (10min.)UV(20min.)
Trails1 1.15±0.35 97.47%2 1.44±0.1 98.18%3 0.15±0.48 99.77%4 0.5±0.70 99.77%5 1.44±0.07 98.78%6 1.57±0.27 98.20%
Ozone (10min.)UV (25min.)
Trails1 0.35±0.38 99.71%2 0.15±0.21 99.94%3 1.02±0.66 98.50%4 0.65±0.09 99.66%5 0.58±0.11 99.75%6 0.61±0.15 99.73%
Table 4. Inactivation of Salmonella (MTCC) in chilies and their log reduction (log cfu/g) by ozone with extended UV
Population in log conc.
Ozone conc. (ppm)
Exposure Time (min)
UV Exposure
Time (min)Mean±SD %
reduction
Control 3.09* 1.4±0.1 15 30 2.79 ±1.03 -
Chilies spiked without ozone 1.65 1.4±0.1 15 30 1.65± 0.63 -
Chilies spiked with Ozone 0.73 1.4±0.1 15 30 0.73 ±
0.55 85.9
*Data represents average value of six colony counting

117
Table 5. Inactivation of Spiked Salmonella (ATCC) in pepper and their log reduction (log cfu/g) by ozone with extended UV
Population in log conc.
Ozone conc. (ppm)
Exposure Time (min)
UV Exposure Time (min) Mean±SD %
reductionControl 2.79* 1.4±0.1 15 30 2.79 ± 1.03Pepper spiked without ozone 2.44 1.4±0.1 15 30 2.44 ± 1.10
Pepper spiked with Ozone 0.58 1.4±0.1 15 30 0.58 ± 0.71 98.76
*Data represents average value of four colony counting
*Data represents average value of four colony counting
Table 6. Inactivation of Salmonella (ATCC) in pepper powder and their log reduction (log cfu/g) by ozone with extended UV
Ozone conc. (ppm)
Exposure Time (min)
UV Exposure Time (min) Mean±SD % reduction
Control 1.4±0.1 15 30 3.2 ± 0.1Pepper powder without ozone 1.4±0.1 15 30 0.36 ±0.31
Pepper powder with Ozone 1.4±0.1 15 30 0.00 ± 0.00 100
Ÿ Inactivation of Salmonella spp. in pepper powder (n=40) and their log reduction (log cfu/g) by ozone with extended UV indicated that a significant reduction of 100% was observed at 1.4 ppm conc. of ozone and 15 min of exposure time along with 30mins of UV exposure (Table-6).
Ÿ A total of 40 market chilli powder samples were analyzed for Salmonella contamination. Salmonellawas not detected in any of the chilli powder samples.
CONCLUSION Ozone in combination with UV can be an effective treatment for disinfection and reduction of Salmonella contamination of spices such as chilli and pepper. The results showed that the hybrid technology of ozone pulsed UV is a promising alternative non thermal technique for Salmonelladecontamination in spices.
5. SAFETY AND QUALITY OF RICE AND WHEAT DISTRIBUTED IN PDS WITH SPECIAL REFERENCE TO DAMAGED GRAINS AND MYCOTOXIN CONTAMINATION
A project on Safety and quality of rice and wheat distributed in PDS with special reference to damaged grains and mycotoxin contamination (Project Code# 11-FD05) was initiated in 2011 to assess quality and safety of rice and wheat during their distribution in the PDS chain. The main objective was

118
toevaluate fungal and mycotoxin contamination in rice and wheat stored under different government storage units and PDS centres and to assess the mycotoxin levels in damaged grains segregated from food grains distributed in PDS.Recognizing the public health significance of the study the FCI kindly granted permissions to conduct the study in their godowns in RR district. Analysis of 24 samples consisting of raw milled rice, boiled rice and wheat collected from storage godowns in Cherlapalli RR districtindicated that levels of aflatoxin were below the FSSAI/GOI tolerance limit of 30µg/kg in all the analysed samples.PDS samples collected from households also showed negligible levels of aflatoxins. In addition aflatoxin analysis was also carried out in milled rice products obtained from rice mills such as brown unpolished rice, polished rice, bran, and broken rice wherein aflatoxin was detected only in bran fraction at12µg/kg. In order to compare these results with non-PDS samples, rice samples obtained from the retail markets were also analysed for aflatoxins.Analysis of 25 samples of non-PDS rice indicated presence of aflatoxins (aflatoxin B1 and B2) in 9 samples of which majority were below LOD and only one sample had levels above the LOD at 3g/kg. Analysis of rice products such as broken rice, rice rawa, rice flakes and rice flour samples showed, aflatoxins were detected in 10/37broken rice at levels ranging from 1.0- 14.3g/kg and in one rice flour sample at 3.0g/kg. None of the rawa and flakes samples showed presence of aflatoxins at levels exceeding 1g/kg. To determine aflatoxin levels in damaged grains, these were segregated from PDS rice samples as for fully damaged/discoloured grains (0.03-0.4%), partially discoloured grains (0.1-0.8%) and dull looking grains (0.3-1.7%) in which aflatoxins were detected at levels of 0.1, 0.2, 3.0 and 4.0g/kg respectively.The presence of damaged grains in 15 non-PDS rice that showed discolouration, insect damage, or mould damage indicated presence of aflatoxins at levels ranging from <5 to above 50 g/kg. As a marker of fungal contamination presence of ergosterol was assessed in 9 brown rice and 21 milled polished rice samples and was found at levels ranging from 0.5-1.0µg/g and 0.25-14µg/g in brown and milled rice respectively. The aflatoxin levels in these samples ranged from 1-20 and 10-50g/kg respectively. The above study indicated that aflatoxins are not present at levels above the food safety limits in PDS samples. The study observed that a potential for occurrence of higher aflatoxin may exist due to presence of damaged grains.
6. ASSESSMENT OF ALLERGENICITY POTENTIAL OF NOVEL PROTEINS EXPRESSED IN GENETICALLY MODIFIED (GM) PLANTS UNDER VARYING CONDITIONS OF DIGESTION AND THERMAL TREATMENTS
The project on Assessment of allergenicity potential of novel proteins expressed in genetically modified (GM) plants under varying conditions of digestion and thermal treatments was initiated in November 2009 with the objective of testing purified novel proteins expressed in GM crops for their stability to pepsin digestion and heat. The method for pepsin digestibility assay was successfully standardized so as to make it applicable for premarket safety and allergenicity testing of GM crops for regulatory approval. A complete assay protocol was developed that consisted of 3 components namely determination of limit of detection of the novel protein in order to measure 90% digestibility of the test protein in simulated gastric fluid with pepsin at pH 1.2 on SDS-PAGE, determination of pepsin activity so that the required activity level is maintained during digestion of test protein, and digestion of test protein in SGF at pH 1.2 and pepsin activity of 10 Units to one µg of test protein. The method was tested with various purified proteins that are known to be stable or unstable to pepsin digestion (β-lactoglobulin, ovalbumin, concanavalin A, bovine serum albumin, lysozyme, RUBISCO) so as to derive a standard

119
protocol. Using the standardized protocol, 6 novel proteins expressed in GM crops namely Cry1Ac and Cry1EC, (BT cotton), Cry1Fa1 (BT brinjal), Bar, Barnase and Barstar recombinant proteins expressed in GM mustard, were successfully tested for stability to pepsin digestion and regulatory reports submitted to the RCGM. All the novel proteins expressed in GM crops that were tested for stability to pepsin digestion have been shown to be rapidly digested within 0.5 minutes thus indicating limited risk of food allergy for these proteins. The effect of varying pH of SGF and pepsin activity levels on extent of digestion was evaluated using purified proteins which showed that pepsin is active upto pH 3.5 in SGF and beyond that pH becomes inactive and hence cannot digest the proteins. The effect of varying pepsin activity levels from 10, 5, 2.5 and 1 Unit per g test protein was evaluated with Cry1Fa1 protein expressed in BT brinjal which showed that Cry1F was digested within <0.5mins at all activity levels tested.When the Cry1Fa1 digestibility was tested at varying pH levels of SGF at 1.2, 2.0, 2.5 and >3.5,it was observed thatthe protein was digested within 30secs at pH 1.2 and 2.0 but above pH 2.0 and 3.0 bands with intensity almost equal to 10% were visible throughout the digestion time period of 60mins tested. The stability of novel proteins to varying temperatures was successfully shown for novel proteins that have insecticidal properties (Cry1Ac, Cry1EC, and Cry1Fa1) and enzymatic activity (Bar, Barnase, Barstar). The thermal stability and of Cry proteins was tested at varying temperatures ranging from 0-95ºC followed by testing the activity of the heat treated protein using insect bioassays. The activity of Bar, Barnase and Barstar proteins was shown by various enzymatic assays specific to the proteins. Through the above project, the pepsin digestibility assay and thermal stability assay could be successfully established for testing GM crops and are currently being applied for regulatory studies.

120
VII. NATIONAL CENTRE FOR LABORATORY ANIMAL SCIENCES
ACHIEVEMENTS
I. During this period Cabinet Committee headed by the Prime Minister of India given the approval for the establishment of “National Animal Research Facility for Biomedical Research” at the Genome Valley with a mandatory proposal to merge the National Centre for Laboratory Animal Sciences, Shameerpet,
rdHyderabad and also for the formation of 33 permanent institution functioning under the aegis of ICMR, Department of Health Research, Ministry of Health & Family Welfare Government of India with approved grant of Rs 338.58 Crores.
II. The Services & Research activities of the NCLAS during this period are mentioned below. A. SERVICE ACTIVITIES1. Breeding and Supply of animals During the period, a total 36,267 animals were bred and out of which 22,607 animals were supplied to various outside institutions and 2,204 animals supplied within the institute. An amount of Rs. 58,51,525/- (Rupees Fifty Eight Lakhs Fifty One Thousand Five Hundred and Twenty Five only) has been generated.
Ÿ Details of individual strains of animals bred and supplied are shown in Tables 1 2 & 3. 2. Supply of Animal Feed
a. Stock Animal Feed Centre prepared 54,810 Kgs of feed (Rat & Mouse feed 46,650 Kgs + Guinea pigs & Rabbit feed
8160 Kgs) during the period. Out of this, a total of 25,883 Kgs feed (Rat & Mouse feed 22,631 Kgs + Guinea Pigs & Rabbit feed 3,252 Kgs) was supplied to outside institutions generating an amount of Rs. 42,89,947/- (Rupees Forty Two Lakhs Eighty Nine Thousand Nine Hundred and Forty Seven only). An additional 30,962 Kgs of feed (Rat & Mouse feed 26,179 Kgs + Guinea Pigs & Rabbit feed 4,783 Kgs) was also supplied within the institute. The details of stock feed supplied are shown in Table - 4 & 5.
b. Experimental Animal Feed In addition, Centre also prepared 558 Kgs of custom made experimental animal feed and paddy
Husk of 125 kgs to outside institutions. An amount of Rs. 5,45,127/- (Rupees Five lakhs Forty Five Thousand One Hundred and Twenty Seven only) was generated as shown in Table-6.
3. Blood and Blood ProductsŸ During the period, a total of 1074 ml of Blood and blood products have been supplied to different
institutions an amount of Rs.2,34,550/- (Rupees two lakh Thirty Four thousand Five hundred and Fifty only) has been generated are shown in Table-7.
4. Human Resource DevelopmentŸ During this period two regular programs have been conducted. In the junior level Laboratory Animal
Technicians Training Course (LATTC), there were 14 participants underwent training in Laboratory Animal Sciences. In the senior level Laboratory Animal Supervisors Training Course (LASTC) 8 candidates were trained.
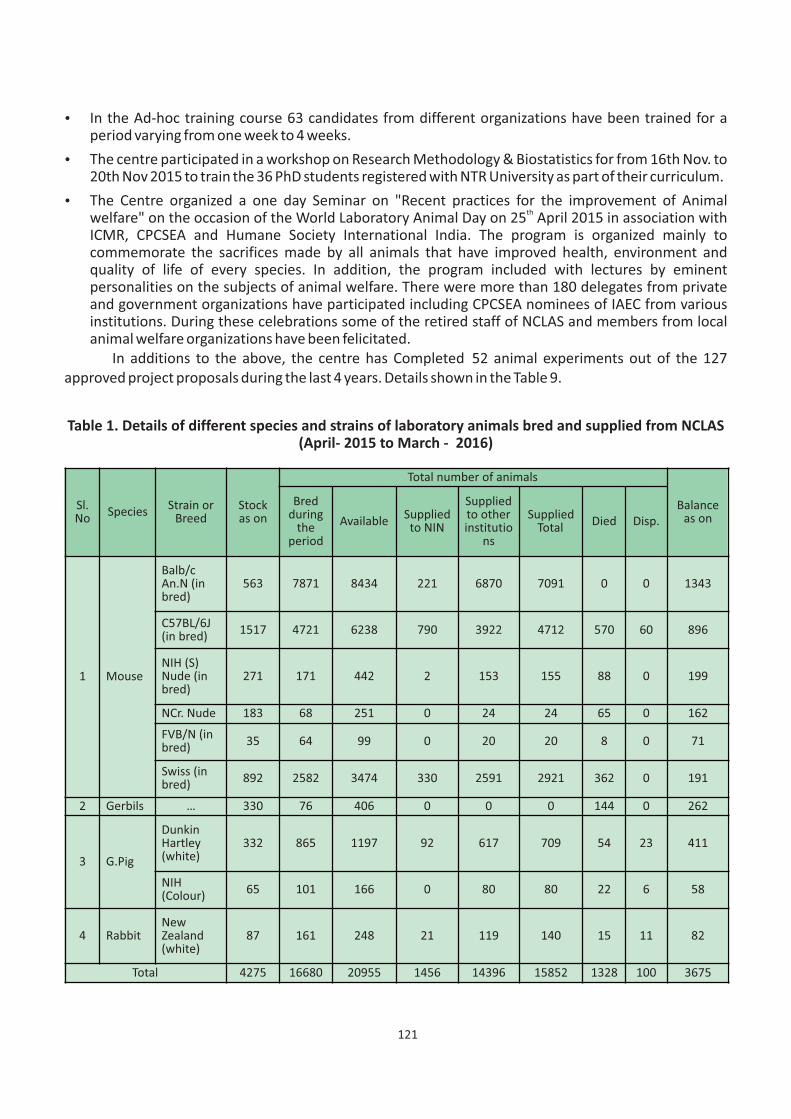
121
Ÿ In the Ad-hoc training course 63 candidates from different organizations have been trained for a period varying from one week to 4 weeks.
Ÿ The centre participated in a workshop on Research Methodology & Biostatistics for from 16th Nov. to 20th Nov 2015 to train the 36 PhD students registered with NTR University as part of their curriculum.
Ÿ The Centre organized a one day Seminar on "Recent practices for the improvement of Animal thwelfare" on the occasion of the World Laboratory Animal Day on 25 April 2015 in association with
ICMR, CPCSEA and Humane Society International India. The program is organized mainly to commemorate the sacrifices made by all animals that have improved health, environment and quality of life of every species. In addition, the program included with lectures by eminent personalities on the subjects of animal welfare. There were more than 180 delegates from private and government organizations have participated including CPCSEA nominees of IAEC from various institutions. During these celebrations some of the retired staff of NCLAS and members from local animal welfare organizations have been felicitated.
In additions to the above, the centre has Completed 52 animal experiments out of the 127 approved project proposals during the last 4 years. Details shown in the Table 9.
Table 1. Details of different species and strains of laboratory animals bred and supplied from NCLAS (April- 2015 to March - 2016)
Sl.No Species Strain or
BreedStock as on
Total number of animals
Balance as on
Bred during
the period
Available Suppliedto NIN
Supplied to other institutio
ns
Supplied Total Died Disp.
1 Mouse
Balb/c An.N (in bred)
563 7871 8434 221 6870 7091 0 0 1343
C57BL/6J (in bred) 1517 4721 6238 790 3922 4712 570 60 896
NIH (S) Nude (in bred)
271 171 442 2 153 155 88 0 199
NCr. Nude 183 68 251 0 24 24 65 0 162
FVB/N (in bred) 35 64 99 0 20 20 8 0 71
Swiss (in bred) 892 2582 3474 330 2591 2921 362 0 191
2 Gerbils … 330 76 406 0 0 0 144 0 262
3 G.Pig
Dunkin Hartley (white)
332 865 1197 92 617 709 54 23 411
NIH (Colour) 65 101 166 0 80 80 22 6 58
4 RabbitNew Zealand (white)
87 161 248 21 119 140 15 11 82
Total 4275 16680 20955 1456 14396 15852 1328 100 3675

122
Table 2. Details of different species and strains of laboratory animals bred and supplied from NCLAS (April- 2015 to March-2016)
Sl.No
SpeciesStrain or
BreedStock as on
Total number of animals
Balance as onBred during
the periodAvailable
Suppliedto NIN
Supplied to other
institutions
Supplied Total
Died Disp.
1 Rat
CFY/NIN (inbred)
76 70 146 0 0 0 51 26 69
Fischer 344 N (inbred)
223 361 584 0 37 37 44 150 353
Holtzman (inbred)
218 39 257 0 0 0 92 85 80
SD (Sprague Dawley)-Outbred
751 2561 3312 216 2390 2606 20 125 561
Wkyoto (inbred)
89 142 231 0 32 32 67 40 92
WNIN (inbred)
1322 5067 6389 231 4497 4728 0 30 1631
WNIN / Gr-Ob
788 501 1289 69 0 69 54 418 748
WNIN / Ob-Ob (inbred)
797 334 1131 100 0 100 97 240 694
SD NIN Nude 220 80 300 0 0 0 88 0 212
2 HamsterGolden (inbred)
241 1407 1648 132 1255 1387 31 0 230
3 Monkey … 24 1 25 0 0 0 4 0 21
Total 4749 10563 15312 748 8211 8959 548 1114 4691
TABLE-1 (TOTAL) 4275 16680 20955 1456 14396 15852 1328 100 3675
TABLE-2 (TOTAL) 4749 10563 15312 748 8211 8959 548 1114 4691
GRAND TOTAL 9024 27243 36267 2204 22607 24811 1876 1214 8366

123
Tabl
e 3.
Sal
e of
ani
mal
s fro
m N
CLAS
(apr
il -2
015
to M
arch
-201
6)
Sl.
NoM
onth
Anim
als
Transport Boxes charges
Handling Charges
Tras
pora
tion
Anim
al
Sale
Am
ount
in R
s
Tota
l Am
ount
MIC
ERa
tG.
Pig
Hamster -Golden
RABBIT-New Zealand (white)
Road Transport
Air fright charges
Balb/c An.N
C57BL/6J
NIH Nude
NCr. Nude
FVB/N
Swiss
Fischer 344 N
Holtzman
Wkyoto
Sprague Dawley
WNIN
WNIN/Gr-Ob
WNIN / Ob-Ob
FVB
SD NIN Nude
D.Hartley (white)
NIH (Colour)
1Ap
ril
2015
335
389
3317
513
022
513
382
1813
200
2500
1000
029
945
3975
2045
3165
2M
ay
2015
785
240
278
2232
182
350
9021
13
1410
012
5050
0014
886
4903
6052
5596
3Ju
ne
2015
986
238
2026
223
236
710
6010
010
3012
830
0012
900
4341
049
5820
5852
58
4Ju
ly
2015
866
681
1092
2532
434
392
1600
012
5059
0316
679
6481
3068
7962
5Au
g 20
1543
030
610
817
638
460
1052
1214
700
1750
8776
2854
536
7430
4212
01
6Se
pt
2015
815
113
1692
7528
680
9700
1500
8000
2071
128
6010
3229
21
7O
ct
2015
445
396
3517
043
530
230
106
1023
600
3000
1454
442
885
4619
7054
5999
8No
v 20
1529
049
615
8427
041
091
8120
1480
017
5087
5426
881
4658
4051
8025
9De
c 20
1547
723
010
414
041
015
1030
2091
0017
5084
0724
084
3244
1036
7451
10Ja
n 20
1660
305
3455
1517
019
678
158
1370
022
5010
801
3184
226
7520
3261
13
11Fe
b 20
1664
530
312
133
182
632
4094
1220
700
1750
8596
2842
146
6190
5256
57
12M
ar
2016
736
225
1220
3837
361
136
126
3430
096
5019
580
5821
745
0930
5721
77
Gran
d To
tal
6870
3922
153
2420
2591
3732
2390
4497
290
8012
5511
921
4028
3140
012
1261
3665
0651
2213
058
5152
5

124
Tabl
e 4.
Sto
ck fe
ed su
pplie
d fr
om N
CLAS
(Apr
il-20
15 to
Mar
ch –
2016
)
Sl.
No
Mon
th
Prep
ared
Qua
ntity
Fee
dSu
pplie
s in
Kgs
20 %
Pr
otei
n14
%
Prot
ein
Oth
er In
stitu
tions
Our
Inst
itute
Gov
ernm
ent
Priv
ate
20 %
Pro
tein
14 %
Pro
tein
20 %
Pro
tein
14 %
Pro
tein
20 %
Pro
tein
14 %
Pro
tein
1Ap
ril –
2015
3450
780
1155
105
600
300
2380
390
2M
ay-2
015
5800
1080
1100
270
670
260
2170
225
3Ju
ne-2
015
4500
360
1705
165
550
205
2420
310
4Ju
ly-2
015
3650
540
1640
7545
50
2340
360
5Au
gust
-201
529
0066
010
4242
550
026
5045
56
Sept
embe
r-20
1533
0072
011
4015
530
00
2385
475
7O
ctob
er-2
015
3100
1980
920
7510
00
1755
685
8N
ovem
ber-
2015
3000
053
562
600
225
2124
288
9De
cem
ber-
2015
3500
120
1623
215
400
2318
477
10Ja
nuar
y-20
1632
5060
013
7527
060
2019
3240
111
Febr
uary
-201
634
5066
012
3645
400
018
4035
812
Mar
ch-2
016
6750
660
5335
380
00
1865
359
TOTA
L46
650
8160
1880
622
4238
2510
1026
179
4783
Tabl
e 5.
Sal
e of
feed
from
NCL
AS (A
pril
- 201
5 to
MAR
CH -
2016
)
Sl.
No
Mon
th
Feed
Padd
y hu
skTr
aspo
rt
char
ges
Hand
ling
Char
ges
Sale
of f
eed
Amou
nt in
Rs
Tota
l Am
ount
in
Rs.
Rat,
Mou
se &
Ham
ster
fe
ed in
Kg
(20
% P
rote
in )
Rabb
it, G
.Pig
&
Mon
key
feed
in
Kgs
(14
% P
rote
in)
High
fat d
iet
(Spe
cial
) -Kg
s
1Ap
ril -
2015
1755
405
113
5000
2168
017
5039
0550
4189
802
May
-201
517
7053
02
1887
210
0030
3500
3098
783
June
-20
1522
5537
011
147
772
2000
3892
5043
9022
4Ju
ly -
2015
2095
7520
1250
6410
520
0030
6300
3736
555
Augu
st -
2015
1092
425
2022
059
1250
2090
6023
2369
6Se
ptem
ber -
2015
1440
155
2021
139
1500
2389
5026
1589
7O
ctob
er -
2015
1020
7515
7330
750
1640
7517
2155
8N
ovem
ber -
2015
1135
287
1242
4675
020
9120
2141
169
Dece
mbe
r -20
1516
6321
515
5851
622
5025
7580
3183
4610
Janu
ary
-201
614
3529
035
2829
312
5027
7775
3073
1811
Febr
uary
-20
1616
3645
9030
071
2000
3652
8539
7356
12M
arch
-20
16.
5335
380
105
2835
617
5081
5057
8451
63Gr
and
Tota
l22
631
3252
558
6250
3524
3918
250
3926
502
4289
947

125
Table 6. Special feeds / Diets formulated and supplied From NCLAS(April 2015- March 2016)
SlNo
Date Bill No PARTY Type of DietQuantity in
KgsAmount in Rs
1 07.04.2015 4971 NBRC, Gurgaon,Harayana HFD 15 171752 07.04.2015 4973 IGNOU, New Delhi HFD 5 70253 09.04.2015 4981 NBRC, Gurgaon,Harayana Control diet for Iron Def. 10 93504 24.04.2015 4988 SRM Univ., Kanchepuram HFD 25 23500
5 24.04.2015 4995 NBRC, Gurgaon,HarayanaProtein Def.diet 9 7155Control diet 9 7245
6 30.04.2015 5005 IICT,Hyderabad Cholestrol diet 40 324807 13.05.2015 5017 Sri Basaweswara Med. Col., Karnataka HFD 2 1800
8 01.06.2015 5046 NBRC, Gurgaon,HarayanaProtein Def. diet 5 3975Control diet 5 4025
9 19.06.2015 5067 Vivimed Labs Ltd, Hyderabad HFD 1 6009 24.06.2015 5072 Jiwaji Univ. Gwalior 8%Protein diet 100 30000
10 16.07.2015 5098 NBRC, Gurgaon,Harayana Control diet for Iron Def. 10 9350
11 29.07.2015 5108 NBRC, Gurgaon,HarayanaProtein Def. diet 5 3975Control diet 5 4025
12 27.08.2015 5149Center for Biotech.Anna Univ., Chennai (MDRF)
HFD 10 15600
13 27.08.2015 5148 NBRC, Gurgaon,HarayanaProtein Def. diet 5 3975Control diet 5 4025
14 22.09.2015 5227Center for Biotech.Anna Univ., Chennai (MDRF)
HFD 10 15600
15 24.09.2015 5230 Osmania Med. Coll., Hyd. HFD 10 1465016 28.10.2015 5263 Osmania Med. Coll., Hyd. HFD 15 2197517 06.11.2015 5283 PGIME&R Chandigargh Iron Def. diet 10 1295018 17.11.2015 5290 SBST,Univ. VIT, Vellore HFD 2 3420
19 07.12.2015 5316 Tripura Univ. AgartalaCa Def. diet 1 1170Control 1 1170High Ca diet 1 1170
20 23.12.2015 5330 SBST,Univ. VIT, Vellore Control diet 2 263021 31.12.2015 5345 PGIME&R Chandigargh Iron Def. diet 10 12950
22 19.01.2016 5171Center for Biotech.Anna Univ., Chennai (MDRF)
HFD 5 7800
23 25.01.2016 5368 Sri.Venteshwara Univ.Trirupati HFD 5 732524 28.01.2016 5372 Natreon Inc, Kolkata HFD 25 4550025 16.02.2016 5402 Dr.M.Balaji, S.V. University Tirupathi. HFD 4 556026 24.02.2016 5415 Dr. NH Balasinor, NIRRH, Mumbai 6% and 22% Fat Diet 30 51225
27 24.02.2016 5416Dr. Dipaya Chaudhari, Tripura University, Tripura
Control 6 18720
28 29.02.2016 5422 The Director, IICT, Hyderabad HFD 50 76000
25 03.03.2016 5432Dr. Ishan Patro, Jiwaji University, Gwaliar
8% Protein Feed 100 44000
26 29.03.2016 5456 Dr. Swati, IGNOU, New Delhi HFD 5 10382Total 558 538877

126
Table 7. Sale of blood & blood products from NCLAS
Date
Bill No Name of the Institute Quantity
in ml
Handling charges &
Packing charges
Amount Total
APRIL-2015 - NILMAY-2015
8 5015 Mr.Ramesh, Aurigene Discoverie s Ltd., Hyderabad Plasma 50 250 15000 15250
13 5019 Nektar Therapeutics India Ltd, Shameerpet, R.R.Dist
Monkey plasma 60 250 24000 24250
JUNE-2015 - NILJULY-2015
20 5102 Dr.Anil Kumar, Delta labs, Bangalore Plasma 200 1750 60000 61750
AUGUST-20154 5121 Prof.R.P.Sharma, University of Hyd Rat Plasma 200 750 20000 20750
19 4900 Mylan Lab Ltd, Hyderabad Rat WNIN Plasma 30 750 6000 6750
26 5140 Aurigene Discoveries Technologies Ltd., Hyderabad
Monkey plasma 40 2000 8000 10000
SEPTEMBER- 201523 5156 Mylan Lab Ltd, Hyderabad Rat Plasma 30 1000 6000 7000
OCTOBER- 2015 - NILNOVEMBER- 2015
3 5272 Tergene Biotech, Hyderbaad Serum 5 1250 2000 3250
6 5282 GVK Biosciences (P) Ltd., Hyderabad Swiss Plasma 25 250 7500 7750
DECEMBER- 2015
1 5161 Dr.P.Radha, Osmania University, Hyd Rabbit Blood 2 250 200 450
23 5166 Dr.P.Radha, Osmania University, Hyd Rabbit Blood 2 250 200 450
31 5167 Dr.Chandraiah, NIPER Hyderabad IVIS Spectrm Scan Charges 14000
JANUARY-2016
7 5169 Mylan Lab Ltd, Hyderabad Rat Plasma 30 1050 6000 7050
12 5356 Delta Laboratories, Bangalore C57BL/6j Plasma 100 750 30000 30750
22 5367 Delta Laboratories, Bangalore Mice Plasma 50 750 15000 15750
27 5173 Dr.K.C.Haritha Yadav, Osmania Medical College, Hyd
Rat TOBEC (Scan) Charges(@200 x 180 No's) 3600
FEBRUARY-20163 5175 Mylan Lab Ltd, Hyderabad Rat Plasma 30 6000 6000
17 5405 Prof.P.Sharma, University of Hyderabad Rat Plasma 200 1250 20000 21250
23 5412 GVK Biosciences (P) Ltd., Hyderabad
Monkey plasma 20 1250 8000 9250
MARCH-2016 - NILTotal 1074 234550

127
Table 8. Details of training courses conducted by NCLAS
Sl.No
Type of Course and current number
Qualification & Eligibility Criteria Duration Fee No. of seats
every yearGovt. Pvt
1
47th Laboratory Animal Technicians Training Course (LATTC) 15th June - 31st July 2015
Undergraduate with knowledge of English read and write
6 weeks 4000 8000 14
2
35rd Laboratory Animal Supervisors Training Course (LASTC)1st Sept --30th Nov 2015
Graduation in Life sciences, Medical & Veterinary Sciences
3 months 8000 16000 8
3
Ad hoc or Modular Training Course – open throughout the year for National, International & WHO Sponsored candidates
Sponsorship from the Head of the institution 1-3 weeks
1000 per
weeks
5000 per
weeks
63
4.
Workshop on Research Methodology & Biostatistics for PhD students from 16th Nov. to 20th Nov 2015
Ph.D Students One Day 36
Table 9. Experiments undertaken during the last 4 years
Year Total Approved Completed Ongoing To Be Initiated Sleeping
2016 11 0 0 1 10
2015 20 0 4 6 10
2014 32 6 12 3 11
2013 16 9 5 0 2
2012 48 37 2 1 8
Total 127 52 23 11 41
B. RESEARCH ACTIVITIES
1. INVESTIGATION OF MOLECULAR MECHANISM INVOLVED IN THE REDUCED ADIPOGENESIS, STEATOSIS AND LIPOTOXICITY BY SUPPLEMENTATION OF PIPERINE INGENETICALLY MUTANT WNIN OBESE RATS
Obesity is considered as dreaded killer lifestyle disease and is a global health concern and associated with severe metabolic complications. There is an urgent need to identify breakthrough drugs with paradigm shifting in pharmaco dynamics for treating obesity. Piperine is one of the bioactive compounds isolated from Piper nigrum Lin. having health promoting properties. The present study is carried out to

128
see the effect of piperine on WNIN obese rats. 36 Obese rats of 35 days age were taken and randomly divided in to three groups. Group-I rats were fed with standard rodent chow, Group-II rats fed with 0.1% Piperine and Group-III fed 0.2% Piperine for a period of 8 weeks. Parameters like growth, food intake were monitored in all the three groups. Body composition analysis was carried out by total body electrical conductivity (TOBEC), serum lipid profile, and circulating levels of adiponectin, IL6 and TNF-α level were estimated by ELISA kits. The experimental obese rats showed a significant decrease in their body weight and food intake compared to control and continued to be low till the end of the experiment. The total body fat was significantly reduced and the lean body mass increased in experimental rats. Piperine supplementation decreased lipid accumulation and steatosis, which resulted from both decreased lipogenesis and increased fatty acid oxidation. It also inhibited adipogenesis possibly by reverting transcription factors PPARγ and its target genes. The beneficial effects of Piperine can be attributed to the presence of rich phytochemicals and antioxidant. The present study indicates the therapeutic potential of piperine in treating obesity, hyperlipidemia and associated dietary obesity disorders.
2. EFFECT OF PROTEIN VARIATION ON PHYSICAL, PHYSIOLOGICAL AND BIOCHEMICAL INDICES IN MONGOLIAN GERBILS (MERIONESUNGUICULATUS) – A COMPARATIVE STUDY
There is an urgent need to identify and develop an alternative animal model for biomedical research and we have made an attempt in this direction and characterizedthe Mongolian gerbil and a manuscript got accepted in Journal of Lab animals.In biomedical research the most economical models are rodents, they are readily available and are easily propagated/managed in the laboratory animal facilities. The Mongolian gerbil (Merionesunguigulatus), a small rodent, it is bigger than a mouse and smaller than rat. We have made an attempt to study the effect of standard protein and high protein to gerbil on the breeding performance, physical, physiological and biochemical indices. The study also aimed to determine the reproductive indices and biochemical indices of the gerbils in a follow up generation. Thirty male and 30 female weanling gerbils were taken and randomly distributed of each sex. 20% protein (standard rodent chow) and 28% protein diets were fed to both genders. Growth and food intake was monitored for 14 weeks in the first generation. Once the animals reached adult hood they were introduced for mating. The 28% protein supplemented animals showed normal physical growth, food intake, clinical chemistry parameters and normal reproductive performance with a good litter size. The gerbils supplemented with 20% protein diet showed significant reduction in the body weight and reduced clinical chemistry parameters. They also showed an abnormal reproductive performance with reduced
rd ndlitter size and 65% mortality prior to 3 day of the birth. The animals did not conceive in the 2 mating. The above mentioned results made us to confine to 28% protein diet supplementation to gerbils and the results were tabulated. The manuscript preparation is in progress.
3. PATERNAL DIET RESTRICTION AND METABOLIC GENE EXPRESSION STUDIES IN OBESE RAT OFFSPRING (WNIN/Ob)
Obesity is a multifactorial disorder affecting a significant portion of the population all over the world. The genetic basis for obesity has in several cases been established in studies of rodent models like Ob/Ob and db/db mouse and Zucker fatty and Koletsky corpulent rats.Though the WNIN/Ob mutant rat

129
modelof NIN has several features common with other models, there are some unique characters specific to it like kinky tail, well defined lean, carrier and obese phenotype etc. For the past few years, the animals have been characterized with reference to physical and biochemical traits of obesity. However, the actual molecular mechanism(s) leading to obesity in these animals is yet to be unravelled. At NCLAS, the obese rats are being breed in two methods of crossing 1)carrier and carrier and 2) Food restricted obese male and carrier female. The offspring produced will follow Mendelian genotyping ratios and are genetically similar. However the biochemical and molecular regulation in the development of obesity in these offspring generated by these two methods has not been characterized yet. Most of the studies focused on the role of maternal nutrition in programming the adult onset diseases. However studies on the influence of paternal diet in the development of metabolic complications in the offspring were scarce. Few studies reported the effect of food restriction on reproductive performance of males. Recently, in a report the food restriction in males altered the metabolic changes in the offspring. These studies suggests that paternal diet along with maternal diet has concurrent effect in programming the offspring to various metabolic complications such as obesity, type 2 diabetes and other associated disorders. Considering these we proposed to study the effect of paternal diet restriction on modulation of various metabolic pathways involved in carbohydrate and lipid metabolism in the offspring. AIMS AND OBJECTIVES· To decipher the effect of diet restriction in WNIN obese male rat on the modulation of various genes involved in carbohydrate and lipid metabolism in the offspring.· To study the regulation of differentially expressed genes promoter methylationWork done After obtaining the animal ethical committee clearance weanling Wistar obese male, wistar carrier male and female rats were obtained from NCLAS. Rats were divided into two groups i.e. WNIN/ Ob male & carriers females and Carrier male and female. All the rats were fed with chow diet till 12 weeks or mating time. The food restricted group(WNIN/Ob males) was fed with 1/3 food compared to control obese rats from weaning. Mating between WNIN/ Ob-FR male and carrier female and within the carrier was conducted to produce the offspring. RESULTS Obese rats of WNIN/Ob were reported twice heavier with body fat percentages 4 fold high compared to Lean rats. The present data on 90 days old rats showed a similar trend. The mean value observed for body weights of obese rats fed ad libitum (Obese_Ad) was 569.67grams, with 95% CI of mean ranging from 501-637 grams. The mean value observed for body weights of Lean rats fed ad libitum (Lean_Ad) was 293.50 gms, with 95% CI of mean ranging from 256-330 grams. Independent samples T test showed that Obese_Ad rats were significantly heavier than Lean_Ad rats (Fig1a). The fold difference for body weights observed between Obese_Ad versus Lean_Ad rats was 1.94 (570/294). The mean value observed for body weights of food restricted obese rats (Obese_Fr) was 197grams, with 95% CI of mean ranging from 176 - 217 grams. Body weights of obese_Fr rats were significantly lower with respect to obese_Ad as well as Lean_Ad rats (Fig 1a). The fold difference for body weights observed between Obese_Ad versus Obese_Fr rats was 2.9 (570/197). Similar observations were noticed on body composition analysis. The mean value for fat percentage in obese_Ad rats was 55.33%, with 95% CI of mean ranging from 54.83% - 55.83%. The mean value observed for Lean_Ad rats was 15.21%, with 95% CI of mean ranging from 13.29% -17.14%. Fat percentages were significantly high in obese_Ad rats compared to Lean_Ad rats (Fig 1b). The fold difference for Fat percentage observed between Obese_Ad versus Lean_Ad rats was 3.7 (55/15). The mean value for fat percentage of obese_Fr rats was 14.99%, with 95% CI of mean ranging from 11.60% - 18.39%. Fat percentages of obese_Fr rats were significantly lower with respect to obese_Ad (Fig 1). The fold difference for fat percentages observed between Obese_Ad versus Obese _Fr rats was 3.7 (55/15).

130
Fat percentages of Lean_Ad versus obese_Fr rats were comparable (Fig 1). Further the study noticed that food restriction recovers dyslipidemia and Oxidative Stress in WNIN/ Obese rats. Circulating triglyceride levels in Obese rats of WNIN/Ob were reported significantly high compared to Lean rats.34,36 Serum Triglycerides assessed in 90 days old rats in the present study showed significantly higher levels in obese_Ad (192.24±20 mg/dL) compared to Lean_Ad rats (99.15±17.7 mg/dL). Triglyceride levels in Obese_Fr rats (76.68±6.1 mg/dL) were significantly low compared to Obese_Ad rats and were comparable with Lean_Ad rats (Figure2). Oxidative stress assessed by TBARS levels were significantly high in obese_Ad (11.80±0.5) compared to Lean_Ad rats (4.75±0.2). TBARS levels in Obese_Fr (5.45±0.4) were significantly low compared to Obese_Ad rats and were comparable with Lean_Ad rats (Fig 2). Leptin Profile To understand the correlation between Food restriction and leptin gene expression whereas FR does not improve Leptin expression in WNIN/ Obese rats. Obese rats of WNIN/ Ob were reported to have high circulating Leptin levels.35 Plasma Leptin assessed in 90 days old rats in the present study showed significantly higher levels in obese_Ad (43.21±6.4 ng/mL) compared to Lean_Ad rats (0.58±0.0 ng/dL). The fold difference for circulating Leptin levels observed between Obese_Ad versus Lean_Ad was 74 (43/0.58). Circulating leptin levels in Obese_Fr (25.36±2.3 ng/dL) were significantly low compared to Obese_Ad rats (Fig 4a). The fold difference for Leptin levels observed between Obese_Ad versus Obese _Fr rats was 1.72 (43/25). Obese_Fr rats showed significantly higher levels of Leptin compared to Lean_Ad rats (Fig 3). The fold difference for circulating Leptin levels observed between Obese _Fr versus Lean_Ad rats was 43 (25/0.58). Leptin gene expression in white adipose tissue showed 4.49 and 4.0 fold increase in Obese_Ad and obese_Fr rats with respect to Lean_Ad rats. Fertility Obese animals fed ad libitum and under diet restriction did not show any difference in their testis weights. Further, ratios of testis weights to average body weights were calculated and compared. Ad libitumfed obese animals have a significantly less testis weights relative to their body mass when compared to diet restricted male obese rats. F1 Generation It was observed that the obese pups born to diet restricted obese males have higher body weight gain and mean body weight compared to obese pups born to adlibitum fed carrier males (fig 4). The glucose and AUC values of Obese offspring born to diet restricted obese males are also higher (fig 5). Lipid profile of Obese offspring born to diet restricted obese males is also higher than obese offspring born to adlibitum carrier males (fig 6).
Fig 1. Food restriction reduces Body weight (a), and fat percentage (b) inWNIN/Obese rats

131
Fig 2. Food restriction improves (a) serum triglycerides and (b) TBARS levelsin WNIN/Obese rats
Fig 3. Food restriction reduces circulating Leptin levels with respect to adlibitum fed obese rats but not with respect to ad libitum fed lean rats. B). Leptin gene expression in retro adipose of ad-libitum fed Lean, Obese and Diet Restricted obese animals
Fig 4. Body weight and body weight gain of F1 obese off spring
520.00
540.00
560.00
580.00
600.00
620.00
640.00
660.00
Group 1 Group 2
Body Weight (grams)
460
480
500
520
540
560
580
Group 1 Group 2
Weight Gain (grams)
Group1 – obese sibs of food restricted father; Group2 – obese sibs of adlib fed father

132
Fig 5. Triglycerides levels and Fastic glucose values in F1 obese offspring
050
100150200250300350
Group 1 Group 2
Fasting Triglyceride (mg/dl)
Group1 – obese sibs of food restricted father; Group2 – obese sibs of adlib fed father
Fig 6. Lipid profile of F1 obese offspring
0
20
40
60
80
100
120
140
Group 1 Group 2
Total Cholesterol (mg/dl)
0
20
40
60
80
100
Group 1 Group 2
HDL-cholesterol (mg/dl)
Group1 – obese sibs of food restricted father; Group2 – obese sibs of adlib fed father
0
0.2
0.4
0.6
0.8
1
Group 1 Group 2
HDL-cholesterol / Total Cholesterol
01234567
Group 1 Group 2
Triglycerides/HDL-cholesterol

133
4. GENETIC AND EPIGENETIC APPROACH TOWARDS OBESOGENESITY USING A RAT MODEL
Studies revealed that interactions between obesity genotypes and an obesogenic environment will synergistically increase the frequency of obesity. Animal studies show that while some inbred strains of mice are susceptible to obesity when fed a high fat diet, others are found to be resistant, clearly indicating that certain combinations of alleles are more obesogenic than others. Indeed, it had been previously established that although the 3 control rat strains i.e. WNIN, SD, Fischer-344 differ slightly physically, physiologically and biochemically from each other and maintained on the same rat chow, the mutant rat (WNIN/Ob) had emerged only from WNIN (which showed high fat percentage in body and least activity) rat strain. The etiology behind the emergence of mutant obese rat only from WNIN rat strain has not yet been revealed. Thus the present study is aimed to determine the obesogenic potential of WNIN rat strain in response to genetic and/ or epigenetic (diet induced) stimulus. It plans to validate/ negate the hypothesis that “WNIN rat strain has high obesogenic tendency towards genetic and/or epigenetic stimulus amongst different rat strains”. Obesogenic diet will be given to different male rat strains (WNIN, SD, Fischer and WNIN/Ob) and physical, physiological, Protein, gene expression and their regulation by epigenetic mechanisms will be analyzed to understand the development of overweight/obesity in these animals. AIMS AND OBJECTIVES· To evaluate the effect of high calorie diets on development of obesity in different rat strains by
monitoring various physical, physiological and biochemical parameters. · To determine the expression of genes associated with obesity in different tissues by whole
transcriptome analysis and validation by RT-PCR/ QRT PCR.· To decipher the promoter DNA methylation of the differentially expressed genes by bisulphate
conversion method.Plan of work Species : Rats Strains : WNIN, WNIN/Ob, SD, Fischer- 344Gender : Males Age : weaning (21 day old) ratsNumber : n=6 Duration : 12 weeks Groups : Control, High fat, High Sucrose, High fat sucrose Animal experimentation Male weaning rats of different strains (WNIN, WNIN/Ob, SD, and Fischer- 344) were obtained from National Centre for Laboratory Animal Sciences (NCLAS) with the approval of the ethical committee on animal experiments at National Institute of Nutrition, Hyderabad, India. They were housed individually in
opolypropylene cages with wire mesh bottom and maintained at 22+2C , under standard lighting conditions (12-h light / dark cycle). The animals were divided into four different groups and were fed with four different high calorie semi purified diets i.e. Control, high fat, high sucrose, and high fat sucrose. Four different diets were prepared according to the literature. The rats were fed with their respective diets till a period of 13 weeks. Daily food intake and weekly body weights were monitored. Various physical, physiological and biochemical parameters, indicative of obesity/metabolic disorder were monitored during the experiment. Then the animals were sacrificed and different metabolically active tissues (liver, muscle, adipose, brain and kidney) were collected, immediately snap frozen in liquid nitrogen and stored at -80C for further molecular studies.RESULTSMetabolic profile Experimental data suggested that the all 4 rat strains (WNIN, SD, Fischer-344 and WNIN/Ob) showed a differential response towards diet source. It was observed that the WNIN strain showed a

134
higher percentage increase of body weights in the experimental groups compared to controls when fed with high calorie diets, which was not evident in SD, Fischer-344, and WNIN/Ob strains. WNIN showed a surplus positive energy balance in energy excess (high calorie environment) condition as evidenced by significantly higher WAT weights. Whereas, in Fischer and SD strains we could not observe such condition. Adiposity Index (AI), which measures the body adiposity levels were found to be significantly higher in high calorie fed groups of WNIN. Whereas, in Fischer and SD, the AI were found comparable among the three dietary fed groups.Glucose Metabolism High calorie fed groups of WNIN and WNIN/Ob strains developed impaired glucose tolerance condition as evidenced by delayed glucose clearance from circulatory during OGTT test and significant higher AUC Glucose levels. Further, experimental groups of WNIN showed altered glucose metabolism associated with defects in insulin sensitivity as evidenced by higher plasma Insulin levels, scoring higher values for HOMA IR and HOMA-beta and lower values for Insulin Sensitivity Index (ISI). Whereas, Fischer-344 and Sprague Dawley (SD) strains remained insulin sensitive and did not develop Impaired Glucose Tolerance condition (IGT) after high calorie diet feeding as evidenced by Comparable AUC Glucose and Fasting Insulin, HOMA IR, HOMA-beta, and ISI values. Lipid Metabolism WNIN developed dyslipidemia condition in high calorie fed groups as evidenced by significant increase in abdominal fat, elevated levels of circulatory triglycerides and decreased HDL-cholesterol levels. However, no such altered lipid profile was observed in all the three dietary fed groups (Control, High fat, HFS) of Fischer and Sprague Dawley (SD) strains as evidenced by comparable circulating triglycerides and HDL-cholesterol levels.Pro-Inflammatory status at circulatory In WNIN, experimental groups showed low levels of circulatory Adiponectin and high levels of Leptin than Fischer-344 and SD strains. Further, decreased serum Adiponectin concentrations indicates an important risk factor for developing insulin resistance and type-2 diabetes as it acts as insulin-sensitizer with anti-diabetic, anti-inflammatory and anti-atherogenic properties. It is widely accepted and well established fact that Leptin plays an important role in food intake and body weight regulation. Increased Leptin levels in experimental groups of WNIN, clearly suggesting a Leptin resistance condition which is generally evident during obesity development. Obesity is characterized by excessive body fat and chronic low grade systemic inflammation of adipose tissue, which leads to the release of a large number of adipocytokines into circulatory. In our study, WNIN and WNIN/Ob strains showed increased levels of inflammatory cytokines such as IL-6, MCP-1, IL-1beta, IL-10, and VEGF significantly when fed with high calorie diets. Whereas, Fischer-344 and SD strains showed comparable results for above pro-inflammatory mediators when fed with high calorie diets.
Obesity Indicators
-1000
100200300400500600700
BW gain(gms)
HOMA-IR AUC Glucose TG (mg/dl) WAT (gms) AdiposityIndex (AI)
Plasma IL-6(pg/mL)
Plasma TNF a (pg/mL)
Effect of HFS diet- Obesogenesity WNIN
Fischer
SD
Fo
ld c
han
ge
dif
fere
nce

135
-50
0
50
100
150
200
250
300
BW gain(gms)
HOMA-IR AUC Glucose TG (mg/dl) WAT (gms) AdiposityIndex (AI)
Plasma IL-6(pg/mL)
Plasma TNF a (pg/mL)
Obesity Indicators
Effect of HF diet -Obesogenesity
WNIN
Fischer
SD
Fold
cha
nge
diffe
renc
e
Differential gene expression profile Transcriptome analysis of adipose & liver tissues of WNIN and Fischer-344 strains fed with high calorie diet groups (High fat, high fat Sucrose) showed differentially expressed genes and their specificity towards diet, species and organ.The WNIN Liver showed number of genes up regulated was 27 and number of genes down regulated were 7 when compared to its control whereas in WNIN Adipose the number of genes down regulated was 29 when compared to control. On the other hand Fischer-344 Liver resulted in number of genes up regulated was 2100 when compared to its control and adipose tissue showed number of genes up regulated was 4 and the number of genes down regulated were 3 when compared to its control. The gene ontology (GO) terms for transcripts were extracted wherever possible. The top 25 of different GO terms identified in molecular function, biological process and cellular component category. Gene Ontology annotation revealed that most of the differentially expressed transcripts belong to the cellular components of nucleus, cytoplasm, mitochondria, and cell membrane involving in the biological process of transcription, translation, and signal transduction and showed specific molecular functions such as ATP binding, zinc ion binding, DNA and RNA binding transcription factor activity, and also acts as signal transducers. Further we performed the data trimming by identifying specific genes which perform different molecular function related to whole body metabolic homeostasis. Liver Histology Studies Liver tissues were stored in 10% formalin solution immediately after removal by dissection and preceded for Hemotoxylin and eosin (H&E) staining for histopathology studies. The preliminary examination of H&E slides revealed that groups treated with high calorie diets (both high fat and high fat
1101
F344-LIVERAWNIN-LIVER
Total genes= 2182A
Unique genes= 1082
Total genes= 1216
Unique genes= 116
2121
F344-AdiposeWNIN-Adipose
Total genes= 2290
Unique genes= 170
Total genes= 2128
Unique genes= 7

136
sucrose) in WNIN strain accommodated with extensive vacuolar structures which were suspected for hepatic lipid droplets. Further to corroborate the suspected preliminary result, fresh frozen liver tissue samples were taken and were processed for oil red staining to confirm for neutral lipid accumulation in liver. However, no extensive vacuolar structures and hepatic lipid droplet storage were identified in control and experimental groups of SD and F-344 strains.
Oil red staining for Liver triglycerides (20X magnification)
SUMMARY Experimental data suggested that the all 4 rat strains (WNIN, SD, Fischer-344 and WNIN/Ob) showed a differential response towards diet source. The WNIN strain showed a higher percentage increase of body weights in the experimental groups compared to controls and which was not evident in SD, Fischer-344 strains. WNIN showed a surplus positive energy balance in energy excess condition as evidenced by significantly higher WAT weights which represents the central adiposity, whereas in Fischer and SD strains we could not observe such condition. Adiposity Index (AI), which measures the body adiposity levels were found to be significantly higher in high calorie fed groups of WNIN but not in other rat strains studied. Experimental groups of WNIN showed altered glucose metabolism associated with defects in insulin sensitivity as evidenced by higher plasma Insulin levels, scoring higher values for HOMA IR and HOMA-beta and lower values for Insulin Sensitivity Index (ISI) in WNIN only. Further it was noticed that WNIN developed dyslipidemia condition in high calorie fed groups (High fat and High fat Sucrose) as evidenced by significant increase in visceral fat, elevated levels of circulatory triglycerides and decreased HDL-cholesterol levels. WNIN showed significantly increased levels of inflammatory cytokines such as IL-6, MCP-1, IL-1beta, and TNF alpha when fed with high calorie diets whereas Fischer-344 and SD strains showed comparable results. Visceral adipose tissue histology studies revealed that in WNIN strain, groups treated with high calorie diets represented increased hypertrophy and hyperplasia, and mean adipocyte area compared to controls. However, in SD and F-344, there was no such phenomena was observed under high calorie environment. The transcriptome analysis of adipose & liver tissues of WNIN and Fischer-344 strains fed with high calorie diets (High fat, high fat Sucrose) showed differentially expressed genes and their specificity towards diet, species and organ. Hence, the study results suggest that WNIN showed a higher tendency than Fishcer-344 and Sprague Dawley (SD)towards the development of obesity under high calorie environment.
WNIN Control Liver WNIN HF Liver WNIN HFS Liver

137
VIII PRE-CLINICAL TOXICOLOGY RESEARCH CENTRE (PCT)
1. PCT EVALUATION OF BIO-SIMILAR RITUXIMAB (ANTI CD 20 MONOCLONAL ANTIBODY)
CLONZAb is a chimeric mouse/human monoclonal antibody (mAb) developed by Clonz Bioech Pvt. Ltd., It is produced in genetically modified CHO cells, consisting of a glycosylated IgG kappa immunoglobulin with murine light- and heavy-chain variable regions (Fab domain) and human kappa and gamma-1 constant regions (Fcdomain). CLONZAb binds to CD20; a transmembrane phosphorylated protein, located on pre-B and matures B-lymphocytes (B-cell lineage-restricted pan-B cell antigen).
CLONZAb (Rituximab) is currently marketed by Roche as Rituxan/ Mabthera (innovator) and a Biosimilar version of the same with the brand name as Reditux by Dr.Reddy's in India and Rest of the world.
The intension is to promote for treating chemoresistant follicular B-cell Non- Hodgkin's Lymphoma (NHL), CD20 positive diffuse large B-cell NHL in combination with CHOP chemotherapy & Rheumatoid Arthritis. In view of this as per the regulatory requirements it is mandatory to undertake Pre-clinical safety Evaluation of the product as per DBT guidelines.METHODOLOGYPreclinical Evaluation The preclinical safety evaluation includes i) Acute and ii). Long term toxicity studies using Swiss Albino Mice, New Zealand White Rabbits & SD Rats at Centre for Advanced Research for Preclinical Toxicology, NIN (ICMR) as per regulatory guidelines of schedule 'Y' of DCGI. ACUTE TOXICITY STUDYSwiss Albino Mice The Acute toxicity test has been carried out in Swiss albino mice (6M+6F), aged 4-6 weeks, weighing 25 - 30gm. A high dose (5XTD – 13mg/0.9ml) of test material was administered to the animals through intravenous route in three divided doses (each time 0.3ml). The rationale for maintaining 5XTD was due to availability of test compound in the maximum concentration of 15mg/1ml. This is followed by daily observations for mortality and bi–weekly monitoring of live phase, cage side and physical activities till 15th day of post exposure. At the end of experiment all animals were euthanized and gross necropsy of vital organs was conducted.New Zealand White Rabbits The Acute toxicity test by IV route was carried out in New Zealand White rabbits (3M+3F), aged 3 – 4 months, weighing 1.4 - 1.5 kg. The animals were exposed to the maximum possible dose of 232.5mg/ 15.5ml which is five times more than the therapeutic dose. In view of the gastric emptying time, the volume to be administered the mentioned concentration was given in 3 divided doses in 24 hrs. This is followed by daily observations for mortality and bi–weekly monitoring of live phase, cage side and physical activities till 15th day of post exposure. At the end of experiment all animals were euthanized and gross necropsy of vital organs was conducted.

138
Sub Chronic Toxicity StudyThe study was conducted in Sprague Dawley rats (30M+30F), aged 4 – 6 weeks, weighing 150 – 180 gm. The rats were divided into five groups to receive various concentrations of test compound by intravenous route. The test compound was administered in Therapeutic Dose (12mg/3ml), Average Dose (30mg/3ml), High Dose (45.6mg/3ml) and the innovator was administered equivalent to therapeutic dose along with vehicle control. The dosage schedule was weekly once for four weeks with total volume of 3ml per animal in three divided doses 1ml each time depending on the body weight. In view of the gastric empting time, the volume to be administration was 3ml in three divided doses. The rational for maintaining 3.8XTD in HD was due to availability of test compound in the maximum concentration of 15mg/1ml. The animals were observed daily for mortality, live phase, cage side, physical, physiological, neurological activity till end of the experiment. The feed intake, body weights were recorded bi-weekly. The urine analysis (qualitatively) was monitored pre and post exposure in all groups of animals. Fifty percent of the animals were subjected to biochemistry and hematology in all groups after 48hrs of post exposure followed by euthanization for gross necropsy and histopathology of all vital organs (pharynx, larynx, esophagus, abdominal aorta, brain, pituitary glands, thymus, spleen, bone marrow, kidney, pancreas, skin, heart, lung, trachea, thyroid, adrenals, sternum, liver, sciatic nerve, gastrointestinal tract,
thepididymis, uterus, mammary glands, testes/ovaries & tail). On 16 day of post exposure remaining 50% of animals were subjected to biochemistry, hematology and euthanized to collect all major organs for gross necropsy and histopathology.RESULTSAcute - Mice· No pre-terminal deaths were recorded in mice exposed to test compound.· No significant effect on food intake and body weight gain were recorded · Clinical signs, behavioral activity were normal.· No gross necropsy changes were recorded. Rabbit· No pre-terminal deaths were recorded in rabbits exposed to test compound.· No significant effect on food intake and body weight gain were recorded · Clinical signs, behavioral activity were normal.Sub-chronic· No pre-terminal deaths were recorded in rats exposed to test compound and innovator group. · No significant effect on food intake and body weight gain was observed in animals which received
test compound as compared to vehicle control.· The clinical chemistry parameters viz., blood glucose levels, kidney and liver function tests were
found to be in normal range in all groups of animals except urea levels in HD (3.8XTD) group in final term exposed to the test compound decreased when compared to vehicle control.
· There were no significant changes in hematology parameters except in monocytes level of the AD (2.5XTD) group which exposed to the test compound in midterm showed lower levels when compared to vehicle control but were within normal range and hence of not considered significant.
Midterm All organs evaluation was 'normal' except 1 Lungs – Chronic interstitial pneumonitis of varying grads were seen across all groups including VC
group.

139
2. Liver – Vacuolation in liver was seen in 4/6 (66%) animals in TD group, 3/6 (50%) in HD group and 1/6 (16%) in VC group.
Final termAll groups evaluation was 'normal' except 1. Lungs – Chronic interstitial pneumonitis of varying grads were seen across all groups including VC
group.2. Liver – Vacuolation in liver was seen in 1/6 (16%) of TD group, 2/6 (33%) in HD & ID groups and 1/6
(16%) in VC group.CONCLUSIONSŸ No pre-terminal deaths were recorded among various test species of acute and subchronic toxicity
studies. All the animals were active and there were no abnormalities in live phase, physical activity and neurological activity throughout the acute and subchronic study period. No gross necropsy changes were observed, there was no significant difference in body weights of various test species of acute and subchronic toxicity studies.
Ÿ In subchronic toxicity study clinical chemistry and hematological parameters were in normal range. Histopathology evaluation of all organs collected revealed no abnormality which could be attributed to the test item in doses administered.
2. PCT EVALUATION OF REPEATED DOSE INTRAMUSCULAR LOCAL TOLERANCE STUDY OF LIQUID PENTAVALENT VACCINE (DTWP+HEPB+HIB) IN SPRAGUE DAWLEY RATS
Immunization is one of the most well-known and effective methods of preventing childhood diseases. With the implementation of the Universal Immunization Programme (UIP) by the Government of India, significant achievements have been made in preventing and controlling vaccine-preventable diseases (VPDs). Introduction of Pentavalent vaccine provides protection to a child from 5 life-threatening diseases – Diphtheria, Pertussis, Tetanus, Hepatitis B and Haemophilus influenzae type b (Hib). DPT (Diptheria+ Pertussis+ Tetanus) and Hep B are part of routine immunization in India; Hib vaccine is a new addition. Together, the combination is called Pentavalent. Hib vaccine can prevent serious diseases caused by Haemophilus influenzae type b like pneumonia, meningitis, bacteremia, epiglottitis, septic arthritis etc. Administration of pentavalent vaccine reduces the number of pricks to a child, and provides protection from all five diseases.
Indian Immunologicals Limited has recently developed pentavalent vaccine which elicits immunity against the five diseases (Diphtheria, Pertussis, Tetanus, Hepatitis B and Haemophilus influenza type b). As per the regulatory requirements it is mandatory to undertake Repeated Dose Intramuscular Local Tolerance Study of Liquid Pentavalent Vaccine as per DBT guidelines.METHODOLOGY The study was conducted in Sprague Dawley rats (33M+33F), aged 6 – 8 weeks weighing 180 – 200 gm. The rats were divided into six groups i.e., i. Control - Normal Saline (3M+3F) ii. Vehicle control - Aluminum phosphate gel + Thiomersal (6M+6F) iii. PV – TD (6M+6F) iv. PV – 2XTD (6M+6F) v. PV – 0.5XTD (6M+6F) vi. Innv – TD (6M+6F). The test compound was administered through intramuscular route as mentioned above. The dosage schedule was weekly once for four weeks with constant volume of 0.5 ml administered at right (0.25ml) and left (0.25ml) dorsal area of rats. The animals were observed daily for mortality, live phase, cage side, physical, physiological, neurological activity till end of the experiment.

140
Feed intake, body weights were recorded bi-weekly and urine analysis (qualitatively) was monitored pre and post exposure in all groups of animals. The clinical chemistry and hematological parameters were undertaken after 48hrs of last exposure in all animals followed by euthanization of 50% of animals from each group for gross necropsy and histopathological examination of all vital organs and site of injection.
ndThe 50% animals in recovery phase were observed for changes at site of injection. At the end of 62 day blood was drawn for clinical chemistry and hematological parameters followed by euthanization to undertake gross necropsy and histopathological examination of site of injection.RESULTSRoutine Monitoring · No pre-terminal deaths were recorded in rats exposed to test compound and innovator group. · No significant treatment related effect on food intake, body weight gain, clinical signs, behavioral
activity. · Statistically significant changes in clinical chemistry and hematological parameters were observed,
but were within the normal range.· Significant increase in weight of liver, lungs, spleen was recorded in all groups except PV – 2XTD during
the Immediate Exposure Phase, while there were no such changes in the recovery phase group of animals except for liver weight in innovator group.
Monitoring of site of injection (Physical, Necropsy and Histopathology) I Nodules were observed in all test groups including vehicle control, which contains only adjuvant and
no antigens.ii. The mean inflammatory score varied between test groups and within each test group at both time
points.iii. A gross visual changes were observed over a period of 55 days after last exposure at site of injection in
ndPV – TD group. Twenty nine percent of animals at site of injection had gross visible nodules on 22 day thand there were no visible nodules on 55 day of last exposure. In addition, 58% of animals were
nd thclassified major visible nodules at site of injection on 22 day but on 55 day of last exposure only 25% were graded as major.
iv. In PV – 2XTD group, where all antigen content is two times of human dose, 92% of site of injection were nd thgraded as major on 22 day, while it was 8% on 55 day of last exposure. There were 33% visible nodule
nd thon 22 day and on recovery 55 day, there was no visible nodule.v. Histopathological observation in case of test compound (PV – TD) at the site of injection as follows: %
of animal showing inflammation at Immediate Exposure Phase was 83% while at recovery phase the figure was 50%, correspondingly mean score of inflammation was 4.4 at Immediate Exposure Phase and 3.7 at recovery phase. Apart from this presence of abscess observed at Immediate Exposure Phase is 67%, which were 33% at recovery phase.
vi. The reaction at the site of injection after last exposure of test compound (PV – TD) as compared to innovator was as follows: On physical (Palpation) examination at the site of injection after 55 day of recovery period, 33% sites had visible nodule in innovator compound (Innv – TD), whereas there was no visible nodule in case of test compound (PV – TD). Histopathologically, mean score of inflammation at Immediate Exposure Phase for test compound (PV – TD) is 4.4 and for innovator (Innv – TD) the value is 4.2; and at recovery phase the mean score of inflammation for test compound (PV – TD) is 3.7 and for innovator (Innv – TD) it is 2.8.
CONCLUSION There was no mortality in animals exposed to test compound and vehicle control. The clinical chemistry and hematological parameters were in normal range. No visible nodules at the site of injection
thwere recorded after 55 day of exposure. Various lesions observed at site of injection showed a decrease in occurrence at the end of the experiment as evidenced by histopathological evaluation.

141
3. PRE-CLINICAL SAFETY EVALUATION OF PEARL MILLET AND MUNG BEAN
Generally Phosphorus (P) availability in soil is very poor (0.7-3%). Many attempts have been made to enhance the bio-availability of 'P' using microorganisms. However, the availability could not enhance more than 5% which is insufficient to meet the crops need.
In the recent past CAZRI under NAIP program has developed Bio-Synthetic Nano Nutrients formulation having nano particles of Mg, Zn, Fe and P. It is observe to enhance production of crops (Mungbean, Pearl millet) after application of nano test material.
In view of these results CAZRI is keen to introduce this as Bio-Synthetic Nano Nutrients for larger farming so that the crops can be introduced in the Production consumption system (PCS) chain. However its safety as per regulatory guidelines of FSSAI (Food Safety and Standard Authority of India) is a prerequisite.METHODOLOGY : PEARL MILLETAcute - Rats The acute toxicity test (14 days) has been conducted in healthy Sprague Dawley Rats (n=40; 20M+20F) aged 4-6 weeks old, weighing 150g –180g caged individually. A single oral exposure of test material (Pearl Millet and Mung Bean Cultivated Using nano nutrients) with a dose of 1g/5ml/rat, which is 2.5 times higher than maximum limit test, was administered. The test material is finely powdered and suspension was prepared in a concentration of 1g/5ml in distilled water for oral administration keeping in view of gastic empting time of 2.5ml. Approximately 5g/Kg (1g/200g Rat) rat twice (2.5ml/time) in a day.Subchronic - Rats The investigation was conducted in Sprague Dawley rats (n=100; 50M+50F), aged 6-8 weeks, weighing 180-200 gm. The rats were randomly divided into five groups viz., i. Control (c) ii. MB-MP (Mung bean Mega Particle) iii. MP-NP (Mung bean Nano Particle), iv). PM-MP (Pear millet Mega Particle), v. PM-NP (Pearl millet Nano Particle). As a part of routine examination all animals were subjected to qualitative urine analysis. This was followed by supplementation of pellet diet with respective test materials daily for 28 days to respective groups. This is followed by daily observation of animals for 28 days throughout the experimental period and 14 days recovery period after exposure to the test material. MUNG BEAN Acute – Rats The acute toxicity test (14 days) has been conducted in healthy Sprague Dawley Rats after taking ethical approval (P2F/ IAEC/NIN/2014/1/BDK) Appendix – II from National Center for Laboratory Animal Science (NCLAS), NIN, Hyderabad. Sprague Dawley rats of either sex (10M+10F) four to six weeks old, weighing 150g –180g caged individually for eight days acclimatization followed by single oral exposure to the test material in a dose 1g/5ml/rat which is 2.5 times higher than maximum limit test. The test material is finely powdered in miller and suspension has been prepared in a concentration of 1g/5ml in distilled water for oral administration keeping in view of gastric empting time of 2.5ml. Approximately 5g/Kg (1g/200g Rat) rat twice (2.5ml/time) in a day (SOP.No: NIN/PHARM/ ATI-001). Subchronic - Rats The investigation was conducted in Sixty Sprague Dawley rats (30M+30F), aged 6-8 weeks, weighing 180-200 gm. All rats used for experiment were brought from the colony and conditioned for 6 days in the experimental room. The conditioned rats were randomly divided into three groups viz., i. Control (c) ii. MB-MP (Mung bean Mega Particle) iii. MP-NP (Mung bean Nano Particle). As a part of routine examination all animals were subjected to qualitative urine analysis. This was followed by supplementation of pellet diet with respective test materials daily for 28 days to respective groups. This is followed by daily observation of animals for 28 days throughout the experimental period and 14 days

142
recovery period after exposure to the test material. Histopathological examination of vital organs is in progress.RESULTS : PEARL MILLET Acute - Rats : No pre-terminal deaths were recorded in rats which received test material 2.5 times higher than the maximum limit test of 2gm/kg. There were no abnormalities in live phase, physical activity and neurological activity throughout the study period. There was no significant difference in body weight of animals which received 1g/200g rat of test material. No gross necropsy changes were observed.Subchronic - Rats· No pre-terminal deaths were recorded in any group of animals. · There is no significant difference was observed in all group of animals in feed intake except first day of
test material exposure due to adaptation of animal to the diet regime.· There were no significant changes observed in body weight gain in all group of animals. · There were no abnormal changes in live phase, physical and neurological activity between the control
and test groups throughout the study period. · The clinical chemistry profile was normal in all groups in midterm and final term except decreased
creatinine levels were observed in both test groups when compared with control group in mid and final terms.
· The hematology profile was normal in all groups except a significant difference in final term WBC of both test groups when compared with control group. These changes are also in normal range.
· No significant difference was observed in organ weights.MUNG BEAN Acute – Rats : No pre-terminal deaths were recorded in rats which were received the test material 2.5 times higher than the maximum limit test of 2gm/kg. There were no abnormalities in live phase, physical activity and neurological activity throughout the study period. There was no significant difference in body weight of animals which received 1g/200g rat of test material. No gross necropsy changes were observed.Subchronic - Rats· No pre-terminal deaths were recorded in any group of animals.
st th· There were significant differences observed in MB-MP group on 1 and 12 day of observations where st th th rd thas in MB-NP group on 1 , 16 , 19 , 23 , 26 days of observations when compared with control group in
feed intake. · There were no significant changes observed in body weight gain in all group of animals. · There were no abnormal changes in live phase, physical and neurological activity between the control
and test groups throughout the study period. · The clinical chemistry profile was normal in all groups except significant differences were observed in
total protein and urea of MB-NP group and in AST levels of MB-MP group in midterm when compared with control group. Where as in final term creatinine levels were differed with control with MB-NP group and significant difference were observed between both test groups.
· The hematology profile was normal in all parameters except a significant difference was observed in WBC count in both test groups as compared to control in midterm. In final term WBC, neutrophils and lymphocyte values of both test groups are differed with control. These changes are also in normal range.
· There were no abnormal changes observed in organ weights of all groups in midterm. Where as in final term significant difference was observed in weights of heart in MB-MP group and testis weight in MB-NP group when compare to control.

143
CONCLUSIONSPEARL MILLETAcute - Rats: There was no mortality in rats exposed to [Pearl millet (Mega and Nano particles)] test material more than 2.5 times higher than the maximum limit test of 2gm/kg.Subchronic - Rats: There was no mortality in any group of animals which were fed with Pearl millet mega – p and nano – P which was replacement of wheat in the standard NIN pellet diet for 28 days. There was no significant difference in body weights, feed intake, and cage side activities. The clinical chemistry and hematology profile was in normal range. MUNG BEAN Acute – Rats: There was no mortality in rats exposed to [Mung bean (Mega and Nano particles)] test material more than 2.5 times higher than the maximum limit test of 2gm/kg.Subchronic – Rats: All animals were active, feed intake and body weight gain was normal though out the experiment. The Clinical chemistry and hematology profile indicate no abnormal changes in rats expose to test material.

144
LIBRARY AND DOCUMENTATION SERVICES
Library continued to cater to the documentation and information needs of the Institute and other Research Organizations, Home Science and Medical Colleges. The library has played a key role in reference activities by offering information dissemination services like MEDLINE Searches, Proquest Medical Library Full Text Database of journals and other online retrieval activities using the LAN Network of the Institute. Library continued to participate in exchange of data, journals and information using the URL<http://Groups.yahoo.com/group/ICMR Librarians>. Resource Sharing and User Education Programmes etc are continuously being undertaken by the Library. Institute's Scientific papers going in for publication in Scientific Journals etc., are being routed through the Library and a data-base of the published papers is also made accessible through on-line services using NIN Website (www.ninindia.org). The Library services are being further strengthened by continuously receiving support from Indian Council of Medical Research for accessing E-journals from JCCC@ICMR and J-Gate database. The Library is also a member of ERMED Consortia of National Medical Library, New Delhi provided by ICMR for accessing E-journals Online Subscription of 4 Core Journals such as LANCET, NATURE, NEJM, SCIENCE has been renewed by ICMR is also accessible. The Library has continued to provide an excellent Photostat support to the Scientists, technical as well as to the administrative staff. The following library services were expanded as detailed below:
1. NEW ADDITIONS
Books . . . . 6Reports . . . . 164Thesis / Dissertations . . . . 13CDROMS . . . . 28 PC Quest CD's . . . . 12 General CD's . . . 16
2. OTHER ACTIVITIES
Journals Bound . . . . 827 Visitors using the Library . . . . 4,456 Circulation of Books/Journals etc . . . . 1,492 No. of E-mails sent outside . . . . 1.904No. of E-mails received . . . . 5,010Photocopying ( No. of pages ) . . . . . 4,15,140Number of Annual Reports mailed . . . . 460 No. of INTERNET Searches provided . . . . 131 No. of Reprints sent . . . . 150

145
3. TOTAL LIBRARY COLLECTIONS
Books . . . . 18,106E – Books .�.�.�.� 36Journals (Bound Volumes) . . .�.� 39,983 Journals subscribed for 2015 . . . . 128E – Journals subscribed for 2015 . . . . 17 Journals received (Gratis/Exchange) for 2015 . . . . 108Microforms (Microfiche) . . . . 1,080Slides . . . . 280Reports . . . . 13,783 Theses & Dissertations . . . . 419MEDLINE CDROMS Discs . . . . 383Current Contents on Diskettes with abstracts . . . . 664Proquest (Full Text E-Journals) on CD ROMS . . . . 495General CD's . . .�.� 309

146
Ph.D PROGRAMMES
RESEARCH SCHOLARS REGISTERED FOR PhD
S. No
Research Scholar(Year of joining) Title of the thesis Supervisor University
1Golla Venkateswarlu (2010)
Role of dietary fatty acids in inducing endoplasmic reticulum stress in stromal vascular cells : implications in the development of obesity associated insulin resistance
Dr. Sudip Ghosh Osmania
2 M. Ankur (2011)Effect of excess nitric oxide in the patho physiology of motor neuron degeneration in neuroalthyrism
Dr. Arjun L. Khandare Osmania
3 V. Varsha (2011)
Evaluation of the impact of genetic polymorphism on pharmacodynamic activity of commonly prescribed antihypertensive drugs (thiazide diuretics, ace inhibitors, CCBs and ß-blockers).
Dr. B. Dinesh Kumar JNTUH
4 V.Anantha
Ch. Anuradha(2011)
Krishna (2011)Impact of nutritionally superior varieties of mustard oil on lipid metabolism.Role of quality of dietary fat on the developmentof obesity insulin resistance & its molecular link with Vitamin A metabolism
Dr. S. M.
Dr. S. M.
Jeyakumar
Jeyakumar
Osmania
Osmania
6
5
Naga muralidhar (2011)
Genetic and epigenetic approach towards obesogenicity in a rat Dr. K. Rajender Rao Osmania
7 K.Sandeep kumar (2011)
Role of miRNA in the development of obesity and diabetes Dr. Sudip Ghosh Osmania
8 N. Naveena (2011)
Studies on Polyphenols in some plant foods as a source of antioxidants
Dr. K. Bhaskarachary Osmania
9 A. Kiran Kumar(2012)
Metabolic response of zinc depletion and excess in contrasting cells: Studies in osteoblasts, myocytes and enterocytes.
Dr. K. Madhavan Nair
Osmania
10 M. PurnaChandra (2012)
Manipulation of dietary fat to enhance carotenoid bioavailability and bioconversion to vitamin A: Development of mechanism based strategies.
Dr. P. Raghu Osmania
11 N. Himaja (2012) Effects of Fos coated probiotics on fetal immune-programming and other health benefits Dr. R. Hemalatha Dr.NTRUHS
12 S Vishwaraj (2012)
Role of molecular chaperones in chronic tissue remodeling diseases
Dr. G. BhanuprakashReddy Osmania
13 Sneha Jakhotia (2012)
Role of small heat shock proteins in diabetic nephropathy
Dr. G. Bhanuprakash Reddy
Osmania
14 K Shruthi (2012) Role of Ubiquitin proteosome system In diabetic complications
Dr. G. Bhanuprakash Reddy Osmania
15 T Shalini (2012) Assessment of nutritional status of geriatric population
Dr. G. BhanuprakashReddy
Osmania

147
16 J Sugeetha (2012)
Impact of dietary saturated fatty acids on the progression of Nonalcoholic fatty liver disease in fructose induced model of Steatosis-Role of adipose tissue insulin sensitivity and secretory function.
S. Ahmed Ibrahim Osmania
17 Daniella Chyne (2012)
Studies on the biodiversity of food resources in Meghalaya Dr. R. Ananthan Osmania
18 K. Mangthya Naik (2012)
Studies gastro protective effects of Naga King chili Dr. R. Ananthan Osmania
19 S.Alekhya (2012)
Identifying microbiological and hygienic factors affecting safety of stress foods and addressing them through vendor education.
Dr. V. Sudershan Rao
Osmania
20 Prashanthi PS (2012)
Studies on Xanthophylls: dietary sources, processing, bioavailability and biological effects Dr. K. Bhaskarachary Osmania
21 J.Sreenivas Rao (2012)
Effect of Cooking / Processing onthe Bioavailability of Provitamin A carotenoids in Indian foods
Dr. K. Bhaskarachary Osmania
22 M. Srujana (2012)
Effect of pesticide exposure among the farm children and their mothers on the various biochemical parameters associated with reproduction, neurotoxic enzymes, oxidative stress and impact on the micronutrient status.
Dr. J. Padmaja Rambabu Osmania
23 Venkat Reddy.B (2012)
Monitoring of organophosphate pesticide metabolites in commonly used fruits, juices, vegetables and urine samples of urban children and its toxic effect
Dr. S. N. Sinha Osmania
24 Archana Konapur (2013)
Targeted nutrition communication for promoting consumption of variety of foods for improving micronutrient status of rural families
Dr. K. Madhavan Nair
Osmania
25Dripta Roy Choudhury (2013)
Functional benefits of inclusion of fruits in supplementary nutrition programme (SNP): A randomized community trial among ICDS preschool beneficiaries on micronutrient status, gut health, growth and development
Dr. K. Madhavan Nair Osmania
26 M Siva Prasad (2013)
Status of Micronutrients and its influence on Molecular Mechanisms in Diabetic Nephropathy
Dr. G. BhanuprakashReddy Osmania
27 PadmanavBehera (2013)
Studies on the potential of Islet-like Cell-Aggregates (ICAs) generated from Mesenchymal Stem Cells of Human Placenta for treating Type 1 Diabetes in NOD mice.
Dr. VijayalakshmiVenkatesan NTRUHS
S. No
Research Scholar(Year of joining) Title of the thesis Supervisor University

148
S. No
Research Scholar(Year of joining) Title of the thesis Supervisor University
28 Raja Gopal Reddy (2013)
Role of vitamin A metabolic pathway on the development of non-alcoholic fatty liver disease: A study on nutrient-nutrient interactions
Dr. S. M. Jeyakumar Osmania
29 MVS Prasad (2013)
Biochemical and Molecular studies on role of diet in the induction of obesity: Rat as a model system
Dr. K. Rajender Rao Osmania
30 D M Dinesh Yadav (2013)
Studies on identification of candidate gene(s) associated with obesity in WNIN/Ob rat Dr. K. Rajender Rao Osmania
31 Keren Susan Cherian (2013)
A study on body composition and energy balance in selected groups of junior athletes
Dr. Y. Venkata Ramana Osmania
32 Vilasagaram Srinivas (2013)
Role of maternal long chain fatty acids on angiogenic factors in first trimester placenta and their invasive properties:implication to feto placental growth
Dr. Sanjay Basak Osmania
33 Rishika Jada (2013)
Effect of Cowpea isoflavones as a natural source for treatment of os?teoporosis in MG-63 human osteosarcoma cells and to assess its synergetic role with Vitamin D in bone formation.
Dr. C. Suresh Osmania
Osmania34 G. Srividya (2014)
Anticancer and proteasome inhibitory potential of cinnamon in prostate cancer: In vitro and In vivo studies
Dr. Ayesha Ismail
35 P.Kondaiah (2014)
Effect of zinc supplementation prior to iron on iron absorption, and iron status in deficient rats: in vitro and in vivo studies
Dr. P. Raghu
36K.Narendra Babu(2014)
Probiotic potential and other beneficial effect of ocimum, ginger and piper nigum on immune-inflammatory disease conditions
Dr. R. Hemalatha Dr.NTR UHS
37 D.Vasundhara (2014)
Effect of probiotic supplementation on bacterial vaginosis (BV) in pregnant women Dr. R. Hemalatha Dr.NTR UHS
38 Nivedita Dubey(2014)
Nutritional composition bioavailability and allergenicity profile of nutritionally enriched GM food crops.
Dr. B. Dinesh Kumar Osmania
39 Anita Singh (2014)
Development of herbals (Asparagus racemosus, BacopaMonnieri, WithaniaSomnifera, Convolvulus pluricaulis, Tribulusterrestris, Phyllanthusamarus) and their combinationsas potential immunomodulators and anti-inflammatory products.
Dr. B. Dinesh Kumar
40 Rajeshkumar K (2014)
Role of advanced glycation end products in chronic tissue remodeling diseases
Dr.G.BhanuprakashReddy
Osmania
41 A. Kiranmayee(2014)
Impact of Statins in vitamin D deficiency and Genetic polymorphism in Indian population Dr. B. Dinesh Kumar

149
S. No
Research Scholar(Year of joining) Title of the thesis Supervisor University
42Bidyalakshmi Loukrakpam (2014)
Studies on the food system of the Meitei community of Manipur and its nutritional implications
Dr. R. Ananthan Osmania
43 Kondeti Suresh (2014)
Studies on regulation of FGF21 in obese and prediabetic rat models Dr. K. Rajender Rao
44S G D N Lakshmi Reddy (2014)
Development and validation of an index for assessing food safety at household level
Dr. V. Sudershan Rao
45Arnab
Chatterjee (2014)
Transcriptomic Analyses of Functionally Contrasting Tissues involved in Zinc Homeostasis
Dr. Sudip Ghosh Osmania
46 U.V. Rama Krishna (2014)
Isolation, characterization and anti cancerous activity of bio active molecules from camellia sinensis
Dr. S. N. Sinha
47 Neelima AS (2014)
Intracellular mechanism of naturally available neuroprotective compounds in mitigating the combined toxicity generated by Lead and beta amyloid peptides in human brain cells .
Dr. C. Suresh Osmania
48 Talari Aruna (2014)
Nutritional quality, prebioticpotential and other health benefits of Raffinose family oligosaccharides of Pigeon Pea (Cajanus Cajan, L)
Dr. S. Devindra Osmania
49 S.Kiruthika (2014)
Agricultural interventions for improving nutritional status among<5 year old rural Indian children.
Dr. Bharati Kulkarni
50 G.Sumalatha (2014)
Isolation and identification of Vit-B12 producing probiotic strains from dairy products Dr. M. Shiva Prakash
51
Mohd. Shujauddin (Yet to be registered)
Dynamics of intrauterine inflammation in relation to malnutrition during pregnancy –foetal outcome and metabolic changes in adulthood
Dr. R. Hemalatha
52
Ajumeera Rajanna(Yet to be registered)
Embryonic stem cells as model system to study the developmental origin of health with micronutrient deficiency- obesity/Type 2 diabetes
Dr. Vijayalakshmi Venkatesan
53 Mr.V.SudershanReddy
Iron homeostasis in adolescent girls with iron deficiency anemia –Role of genetic varients and gut microbiome
Dr. R. Hemalatha

150
New Enrollments
S. No Research Scholar Title of the thesis Supervisor
1 K. Divya Shoshanni
Assesment of nutritional status, morbitity status and utilisation of health care facilty in the elderly population age 60yrs and above
Dr. P. Suryanarayana
2 M.Thirupathi Reddy Big data and data mining techniques in nutrition Dr. M. Vishnu Vardhana Rao
3 Ankita Mondal Seasonal Variation in Malnutrition among Rural Women and Children Dr. Bharati Kulkarni
4 Richa Pande
Study the influence of media on food choices and development and assessment of a SBCC program in rural Telangana
Dr. Bharati Kulkarni
5 Chathyushya K BDevelopment of Multiplex PCR for rapid detection of probiotic microflora in human breast milk
Dr. M. Shiva Prakash
6 Ramesh. GMoleculed mechanism involved in vitamin D deficient induced muscle atrophy
Dr. Ayesha Ismail
7 Swetha BoddulaDevelopment and validation of a tool to assess diet quality and associated factors among adolescents in India
Dr. M. S. Radhika

151
AWARDS / HONOURS CONFERRED ON SCIENTISTS
Dr. G. Bhanuprakash Reddy, Scientist-F
Eminent Research Supervisor Award by Dr. K. V. Rao Scientific Society – 2015 (May 23, 2015) and selected as External Member, Departmental Research Committee, Department of Biochemistry, School of Life Sciences, University of Hyderabad, Hyderabad (for a period of two years from April 2015).
Gates Foundation Global Health Travel Award at the Keystone Symposium on Human Nutrition, Environment and Health in Beijing (China), October 14-18, 2015.
Associate Editor for the Journal of Food Science and Technology &As a governing council member for the Academy of Cardiovascular Sciences to represent the Indian Section of International Academy of Cardiovascular Sciences (IACS).
Mr. Ajumeera Rajanna, Scientist-C
Best Poster Award at 47 Annual National Conference, 9 -10 October 2015, Organised by Nutrition Society of India, National Institute of Nutrition, (NIN), Hyderabad, India.
Mr. Mehrajuddin Bhat, Research Fellow
Nutrition Investigator Award at the ACN, 2015 held in Yokohama Japan during May, 2015 for poster entitled "Vitamin D deficiency induces mild oxidative stress in rat muscle and treatment with 1,25 (OH)2D3 reverses oxidative stress related changes"

152
PARTICIPATION OF SCIENTISTS IN INTERNATIONAL MEETINGS/ WORKSHOPS/ CONFERENCES/ TRAINING PROGRAMMES
S.No Name of the Scientist Meeting/ Conference attended Date
1 Dr. A. Laxmaiah
Presented a Paper on “Dietary intakes in India and Descriptive Epidemiology” in the one day workshop on “Critical voice in the early strategy phase of developing a nutrition intervention to improve child nutrition and prevent stunting”, held at The Sackler Institute for Nutrition Sciences, The New York Academy of Sciences, New York, USA.
May 20-22
2 Dr. G.BhanuprakashReddy
Keystone Symposium on Human Nutrition, Environment and Health in Beijing, China and presented a paper on “Influence of micronutrients on biochemical pathways involved in diabetic complication”.
October 14-18, 2015
3 Dr. V. Vijayalakshmi Joint Meeting of The Islet Study Group & Beta Cell Workshop at the Menachem Begin Center, Jerusalem, Israel
May 3- 7
4 Dr. Sylvia Fernandez RaoInvestigators meeting of Infant Phase of Project Grow Smart and Symposium at Experimental Biology Conference, at University of Maryland, Boston, USA
Mar. 26 – Apr. 01
5 S. Vishwaraj(CSIR-SRF)
Presented a Paper on “Fibrocyte-driven accumulation of Wilms Tumor 1-positive lung-resident stromal cells in severe fibrotic lung disease (V Sontake, B DiPasquale, SK Shanmukhappa, GB Reddy, ES. White, SK. Madala)”, in the Annual meeting of American Thoracic Society, held at Denver, USA.
May 15-20
12th Asian Congress of Nutrition, at Paciffico Yokohama, Japan (May 14-18). The following scientists from the Institute participated in the conference and presented Papers:
1 Dr. R. Hemalatha Delivered a talk in the session entitled “Country/Regional Report on Health and Nutrition”
2 Dr. N. Harishankar Body weight lowering effect of Piper nigrum Linn extracts on HFD induced SD obese rats – A non-invasive study
3 Dr. P. Amrutha Rao Assessment of nutritional status of under five year tribal children in the districts of Meghalaya state

153
WORKSHOPS/ CONFERENCES/ SEMINARS/ TRAINING PROGRAMMES HELD AT NIN
1. Seminar on “Recent Practices for the Improvement of Animal Welfare” was organised as part of World Laboratory Animal Day celebrations in association with Committee for the Purpose of Control and Supervision of Experiments on Animals, New Delhi and Human Society
thInternational India, Hyderabad (25 April ).
2. Training of Trainers for “National Programme for Prevention and Control of Fluorosis”, in association with Directorate General of Health Services, Ministry of Health and Family Welfare, Government
rd thof India (23 -24 April).
3. Training for laboratory Technicians for “District Fluoride Monitoring Centre
th th(DFMC) Nalgonda, Telangana”, (25 -26 June).
4. Training of Trainers for “National Programme for Prevention and Control of Fluorosis”, in association with Directorate General of Health Services, Ministry of Health and Family Welfare, Government
th stof India ( 30 -31 July).
5. Nutrition Society of India successfully thheld it's 47 Annual National Conference
th th(9 -10 October).

154
th6. NIN, combinedly celebrated World Food Day and it's Foundation Day (16 October).
th rd th7. 11 International Food Data Conference was organized from 3 -5 November 2015.
8. Workshop on Research Metho-dology and Biostatistics for PhD Students was conducted in collaboration with Dr. NTR University of Health Sciences, Vijayawada from 16 -20, November 2015.

155
9. The PET division of NIN and CADC, Hyderabad jointly organized a one day workshop on 'Use of information and communication technology (ICT) for nutrition education, knowledge, sharing and awareness" on 10 December 2015. Approximately sixty members participated in this program.
10. ICMR in association with Tata Trusts held a meeting to explore collaborative research opportunities for promoting public health nutrition. Dr. Soumya Swaminathan, Secretary, DHR & DG, ICMR was present at
ndthe meeting held on 2 January 2016.
11. The 53rd batch of PGC course in Nutrition has been initiated on 6th January 2016.
12. A Training programme was conducted for the Trainers for District Fluoride Monitoring Centre (DFMC) of Nalgonda at NIN on 28-29, Jan 2016.

156
13. A five day training programme for the Laboratory Technicians under National Programme for Prevention and Control of Fluorosis was organized from 22- 26 Feb. 2016.
14. Seven days training program titled 'Food and feed safety of GM crops for faculties of agriculture universities of Gujarat', organized by Centre for Advanced Research for Pre-clinical Toxicology, Drug Toxicology Division, NIN in association with Gujarat State Biotechnology Mission, Dept. of Science and Technology, Govt. of Gujarat, 22-28 Feb. 2016.
15. L a b o ra t o r y A n i m a l S c i e n c e & Techniques Training course candidates and their faculty on the successful completion of the course.
16. Mini-Convocation of the 5th Batch of M.Sc. Applied Nutrition course was conducted on 24 March. Dr. Biplab K. Nandi, Sr. Food & Nutrition Officer (Retd.) FAO was the Chief Guest for the occasion.

157
SCIENTIFIC PUBLICATIONS
A. PAPERS PUBLISHED IN SCIENTIFIC JOURNALS
1. Annapurna VV, Hemalatha R, Raviteja A, Ramaraju AVS, Narendra Babu K, Thirupathaiah Y, Shujauddin Mohd, Harishankar N, Balakrishna N : Selective cecal bacterial changes mediate the adverse effects associated with high palmolein or high starch diets: prophylactic role of flax oil. Int J Pharm Pharm Sci. 7: 89-95, 2015.
2. Ashok Kumar Yadav, Ashish Tyagi, Ashwani Kumar, Surbhi Panwar, Sunita Grover, Asha Chandola Saklani, Hemalatha R, Virender Kumar B: Adhesion of lactobacilli and their anti-infectivity potential Crit Rev Food Sci Nutr. (Epub), 2015.
3. Baker CP, Bharati Kulkarni , Radhakrishna KV, Charyulu MS, Gregson J, Matsuzaki M, Taylor AE, Dorairaj Prabhakaran, Raja Sriswan M, Jonathan Wells, Ian Wilkinson, Carmel McEniery, Yasmin, Smith GD, Ben-Shlomo Y, Hannah Kuper, Sanjay Kinra :Is the Association between Vitamin D and cardiovascular disease risk confounded by obesity? Evidence from the Andhra Pradesh children and parents study (APCAPS). PloS one. 10(6): e0129468, 2015.
4. Bhanuprakash Reddy G, Sivaprasad M, Shalini T, Satyanarayana A, Seshacharyulu M, Balakrishna N, Viswanath K, Manisha Sahay: Plasma vitamin D status in patients with type 2 diabetes with and without retinopathy. Nurition. 31 : 959-963,2015
5. Bhaskarachary K, Naveena N, Kalpagam Polasa: Potential benefits of plant metabolites for human health. Indian J Nutr Dietet. 52: 213-225, 2015.
6. Bindu Noolu, Ayesha Ismail: Anti-proliferative and proteasome inhibitory activity of murraya koenigii leaf extract in human cancer cell lines. Discov Phytomed. 2: 1-9, 2015.
7. Chalamaiah M, Hemalatha R, Jyothirmayi T, Prakash V Diwan, Bhaskarachary K, Vajreswari A, Ramesh Kumar R, Dinesh Kumar B : Chemical composition and immunomodulatory effects of enzymatic protein hydrolysates from common carp (Cyprinus carpio) egg. Nutrition. 31: 388–398, 2015.
8. Chetan Nimgulkar, Sudip Ghosh, Sankar Anand B, Uday Kumar P, Surekha MV, Madhusudhanachary P, Annapurna BR, Raghu P, Dinesh Kumar B: Combination of spices and herbal extract restores macrophage foam cell migration and abrogates the athero-inflammatory signalling cascade of atherogenesis. Vascul Pharmacol. 72: 53–63, 2015.
9. Deethu Sara Varghese, Ashok S, Premraj D,Venkata Ramana Y : Comparison of body-composition assessed by air displacement plethysmography and skin-fold technique in post menopausal women. Indian J Nutr Dietet. 52: 360-368, 2015.
10. Deshpande J, Shankaranarayanan J, Bhanuprakash Reddy G, Sreenivasa RS, Juturu V: Soluble curcumin in the prevention of diabetic retinopathy via modulation of anti-oxidant activity and genetic pathways-in vivo model. Adv Ophthalmol Vis Syst. 3: 00077-, 2015.
11. Devindra SB: Estimation of glycemic carbohydrates from commonly consumed foods using modified anthrone method. Indian J Appl Res. 5: 45-47, 2015.
12. Farzana F, Sreekanth V, Mohiuddin MK, Mohan V, Balakrishna N, Ahuja YR: Can individual home-
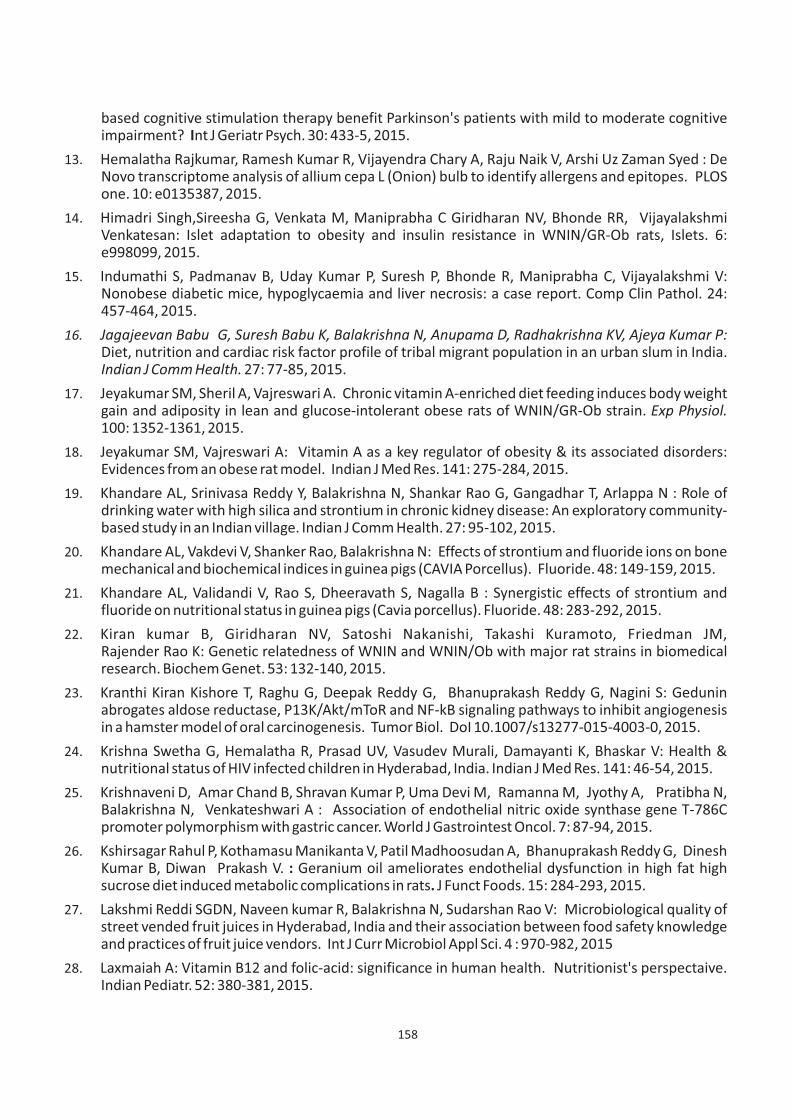
158
based cognitive stimulation therapy benefit Parkinson's patients with mild to moderate cognitive impairment? Int J Geriatr Psych. 30: 433-5, 2015.
13. Hemalatha Rajkumar, Ramesh Kumar R, Vijayendra Chary A, Raju Naik V, Arshi Uz Zaman Syed : De Novo transcriptome analysis of allium cepa L (Onion) bulb to identify allergens and epitopes. PLOS one. 10: e0135387, 2015.
14. Himadri Singh,Sireesha G, Venkata M, Maniprabha C Giridharan NV, Bhonde RR, Vijayalakshmi Venkatesan: Islet adaptation to obesity and insulin resistance in WNIN/GR-Ob rats, Islets. 6: e998099, 2015.
15. Indumathi S, Padmanav B, Uday Kumar P, Suresh P, Bhonde R, Maniprabha C, Vijayalakshmi V: Nonobese diabetic mice, hypoglycaemia and liver necrosis: a case report. Comp Clin Pathol. 24: 457-464, 2015.
16. Jagajeevan Babu G, Suresh Babu K, Balakrishna N, Anupama D, Radhakrishna KV, Ajeya Kumar P: Diet, nutrition and cardiac risk factor profile of tribal migrant population in an urban slum in India. Indian J Comm Health. 27: 77-85, 2015.
17. Jeyakumar SM, Sheril A, Vajreswari A. Chronic vitamin A-enriched diet feeding induces body weight gain and adiposity in lean and glucose-intolerant obese rats of WNIN/GR-Ob strain. Exp Physiol. 100: 1352-1361, 2015.
18. Jeyakumar SM, Vajreswari A: Vitamin A as a key regulator of obesity & its associated disorders: Evidences from an obese rat model. Indian J Med Res. 141: 275-284, 2015.
19. Khandare AL, Srinivasa Reddy Y, Balakrishna N, Shankar Rao G, Gangadhar T, Arlappa N : Role of drinking water with high silica and strontium in chronic kidney disease: An exploratory community-based study in an Indian village. Indian J Comm Health. 27: 95-102, 2015.
20. Khandare AL, Vakdevi V, Shanker Rao, Balakrishna N: Effects of strontium and fluoride ions on bone mechanical and biochemical indices in guinea pigs (CAVIA Porcellus). Fluoride. 48: 149-159, 2015.
21. Khandare AL, Validandi V, Rao S, Dheeravath S, Nagalla B : Synergistic effects of strontium and fluoride on nutritional status in guinea pigs (Cavia porcellus). Fluoride. 48: 283-292, 2015.
22. Kiran kumar B, Giridharan NV, Satoshi Nakanishi, Takashi Kuramoto, Friedman JM, Rajender Rao K: Genetic relatedness of WNIN and WNIN/Ob with major rat strains in biomedical research. Biochem Genet. 53: 132-140, 2015.
23. Kranthi Kiran Kishore T, Raghu G, Deepak Reddy G, Bhanuprakash Reddy G, Nagini S: Gedunin abrogates aldose reductase, P13K/Akt/mToR and NF-kB signaling pathways to inhibit angiogenesis in a hamster model of oral carcinogenesis. Tumor Biol. DoI 10.1007/s13277-015-4003-0, 2015.
24. Krishna Swetha G, Hemalatha R, Prasad UV, Vasudev Murali, Damayanti K, Bhaskar V: Health & nutritional status of HIV infected children in Hyderabad, India. Indian J Med Res. 141: 46-54, 2015.
25. Krishnaveni D, Amar Chand B, Shravan Kumar P, Uma Devi M, Ramanna M, Jyothy A, Pratibha N, Balakrishna N, Venkateshwari A : Association of endothelial nitric oxide synthase gene T-786C promoter polymorphism with gastric cancer. World J Gastrointest Oncol. 7: 87-94, 2015.
26. Kshirsagar Rahul P, Kothamasu Manikanta V, Patil Madhoosudan A, Bhanuprakash Reddy G, Dinesh Kumar B, Diwan Prakash V. : Geranium oil ameliorates endothelial dysfunction in high fat high sucrose diet induced metabolic complications in rats. J Funct Foods. 15: 284-293, 2015.
27. Lakshmi Reddi SGDN, Naveen kumar R, Balakrishna N, Sudarshan Rao V: Microbiological quality of street vended fruit juices in Hyderabad, India and their association between food safety knowledge and practices of fruit juice vendors. Int J Curr Microbiol Appl Sci. 4 : 970-982, 2015
28. Laxmaiah A: Vitamin B12 and folic-acid: significance in human health. Nutritionist's perspectaive. Indian Pediatr. 52: 380-381, 2015.

159
29. Laxmaiah A, Meshram II, Arlappa N, Balakrishna N, Mallikharjuna Rao K, Gal Reddy CH, Ravindranath M, Sharad Kumar, Hari Kumar, Brahmam GNV: Socio-economic & demographic determinants of hypertension & knowledge, practices & risk behavior of tribals in India. Indian J Med Res. 141: 697-708, 2015.
30. Liza Bowen,Taylor AE, Ruth Sullivan, Shah Ebrahim, Sanjay Kinra, Radhakrishna KV, Bharati Kulkarni, Ben-Shlomo Y, Ulf Ekelund, Jonathan CK Wells, Hannah Kuper : Associations between diet, physical activity and body fat distribution: a cross sectional study in an Indian population. BMC Public Health. 15: 281, 2015.
31. Madhavan Nair K, Little Flower Augustine: Limits of vitamins and minerals in dietary supplements: perception Vs scientific judgment. Indian Food Industry. 34: 50-51, 2015.
32. Madhavan Nair K, Ravinder P, Pareek K, Swarnim Gupta: Evaluation of sensory and storage characteristics and iron bioavailability of whole wheat flour fortified with ferrous sulphate and hydrogen reduced iron powder in humans. Indian J Nutr Dietet. 52: 1-15, 2015.
33. Maheshwar M, Raghunatha Rao D: Deforestation- A potential threat to nutrition. Int J Tech Res Appl 3: 226-232, 2015.
34. Mallikharjuna Rao K, Hari Kumar R, Sreerama Krishna K, Bhaskar V, Laxmaiah A: Diet & nutrition profile of chenchu population- a vulnerable tribe in Telangana & Andhra Pradesh, India. Indian J Med Res. 141 : 688-696, 2015
35. Matsuzaki M, Kuper H, Bharati Kulkarni, Ploubidis GB, Wells JC, Radhakrishna KV, Poornima Prabhakaran, Gupta V, Walia GK, Aggarwal A, Prabhakaran D, Rameshwar Sarma KV, Smith GD, Ben-Shlomo Y, Sanjay Kinra : Adolescent undernutrition and early adulthood bone mass in an urbanizing rural community in India. Arch Osteoporos. 10: 29, 2015.
36. Matsuzaki M, Rashmi Pant , Bharati Kulkarni, Sanjay Kinra : Comparison of bone mineral density between urban and rural areas: systematic review and meta-analysis. PLoS One. 10; 10(7): e0132239, 2015.
37. Mehrajuddin Bhat, Ayesha Ismail: Vitamin D treatment protects against and reverses oxidative stress induced muscle proteolysis. J Steroid Biochem Mol Biol. 152: 171-179, 2015.
38. Meshram II, Mallikharjun Rao K, Gal Reddy Ch, Ravindranath M, Sharad Kumar, Sreeramakrishna K, Venkaiah K, Laxmaiah A, Brahmam GNV: Influence of feeding practices and associated factors on nutritional status of infants in rural areas of Madhya Pradesh State, India. Asia Pac J Pub Health. 27: 1345-1361, 2015.
39. Meshram II, Stephan G, Pothraju B: Nutritional status and substance abuse among street children in South India. Indian J Comm Health. 27: 52-59, 2015.
40. Meshram II, Vishnu Vardhan Rao V, Sudershan Rao V, Laxmaiah A, Polasa K : Prevalence and correlates of hypertension & diabetes among ≥18 years urban population in India. Br Biomed Bull. 3: 176-189, 2015.
41. Nagabhushan Reddy K, Anil S, Rajender Rao K, Rajendher Reddy M, Praveen Kumar Y, Satyanarana S, Raghunath M: Effect of chromium (III)-amino acid (1:3) complexes of high sucrose induced insulin resistance, lipid abnormalities and oxidative stress n male Sprague dawley rats. J Diabetes Obes. 2: 1-8, 2015.
42. Nirupama Lal, Rajender Rao K, Suresh P, Md. Shahidul Islam, Harishankar N, Giridharan NV, Bharati Kulkarni, Vijayalakshmi V: Obesity associated mitochondrial dysfunction: evidences from WNIN mutant rats. World J Pharmaceut Res. 4: 1074-1096, 2015.
43. Padmaja RJ, Sudershan Rao V, Vishnu Vardhana Rao M, Kalpagam Polasa : Dietary exposure to pesticide residues by various physiological groups of population in Andhra Pradesh, South India. Int J Food Nutri Sci. 4: 139-148, 2015.

160
44. Ramesh A, Vishnu Vardhana Rao M, Madhavan Nair K: A meta-analysis combining parallel and cross-over randomized controlled trials to assess impact of iodine fortified foods on urinary iodine concentration among children. Asia Pacific J Clin Nutr. 24: 2015.
45. Ravinder Naik R, Abay Kumar P, Suresh P, Nagaraju T: Modulatory effects of andrographolide on attenuating the key enzymes activities of carbohydrate metabolism and glycogen content in streptozotocin induced diabetic rats. Eur J Biomed Pharma Sci. 2: 438-451, 2015.
46. Ravindranadh P, Purna Chandra M, Madhavan Nair K, Bhanuprakash Reddy G, Raghu P: Characterization of iron-binding phosphopeptide released by gastrointestinal digestion of egg white. Food Res. Int. 67: 308-314, 2015.
47. Reddy VS, Reddy GB: Emerging rde for αB-Crystallin as a therapeutic agent: pros and cons. Curr Mol Med. 15: 47-61, 2015.
48. Shadab Ahmad, Basak T, Anand Kumar K, Bharadwaj Gourav, Lalitha A, Yadav DK, Chandak GR, Raghunath M, Sengupta Shantanu: Maternal micronutrient deficiency leads to alteration in the kidney proteome in rat pups. J Proteomics. 127 Part A : 178-184, 2015.
49. Shweta Shrivastava, Manish Kumar J, Sudhakar Reddy V, Bhanuprakash Reddy G, Naidu VGM: Anticancer effect of celastrol on human triple negative breast cancer: Possible involvement of oxidative stress, mitochondrial dysfunction, apoptosis and P13K/AKt pathways. Exp Mol Pathol. 98: 313-327, 2015.
50. Snow Anson, Shieh Biehuoy, Chang Kun-Che, Pal Arttatrana, Lenhart Patricia, Ammar David, Ruzycki Philip, Suryanarayana P, Bhanuprakesh Reddy G, Mark Petrash J: Aldose reductase expression as a risk factor for cataract. Chem Biol Interact. 234 : 247-253, 2015.
51. Sravani E, Chaitanya Mannava MK, Kaur Damandeep, Annapurna BR, Ronaq Ali Khan, Suresh Kuthuru, Sudhir Mittapalli, Ashwini Nangia, Dinesh Kumar B: Preclinical bioavailability-bioequiva-lence and toxico-kinetic profile of stable succinc acid cocrystal of temozolomide. Curr Sci. 108: 1097-1106, 2015.
52. Srinivasa Rao M, Suryanarayana Murty U, Sriram Kumaraswamy, Madhusudhan Rao K, Balakrishna N: Impact of socioeconomic factors on the prevalence of lymphatic filariasis in Andhra, Pradesh, India. J Public Health. 23: 231-240, 2015.
53. Subba Rao GM, Madhavan Nair K: From farm to plate & beyond- A culture & context sensitive perspective for food safety. Indian J Med Res. 141: 377-379, 2015.
54. Subba Rao GM, Mallikarjuna Rao K, Balakrishna N, Laxmaiah A: Assessing differences in risk perceptions about obesity among “Normal-Weight” and “Overweight” adolescents- a qualitative study. J Nutr Edu Behav 47:488-497, 2015.
55. Sudharkar Reddy V, Sneha Jakhotia, Yadagiri Reddy P, Bhanuprakash Reddy G: Hyperglycemia induced expression, phosphorylation, and translocation of aB-Crystallin in rat skeletal muscle. IUBMB Life. 67: 291-299, 2015.
56. Swathi Chitra P, Swathi T, Rakesh Sahay, Bhanuprakash Reddy G, Menon RK, Anil Kumar P: Growth hormone induces transforming growth factaor-beta-induced protein in podocytes: Implications for podocyte depletion and proteinuria. J Cell Biochem. 116: 1947-1956, 2015.
57. Sylvia Fernandeez-Rao, Hurley K, Madhavan Nair K, Balakrishna N, Tilton N, Radhakrishna V, Reinhart G, Harding K, Black M: Multiple micronutrients and early learning interventions promote Infant micronutrient status and development, FASEB J. 29, No.1, Suppl 28.2, 2015.
58. Vasanthi S, Bhat RV: Assessing intake of spices by pattern of spice use, frequency of consumption and portion size of spices consumed from routinely prepared dishes in southern India. Nutr J. 14: 1-9, 2015.
59. Vasanthi S, Dinesh Kumar B, Raju Naik V, Vishnu Vardhana Rao M, Vibha Gupta, Goodman RE:

161
Evaluation of bar, barnase, and barstar recombinant proteins expressed in genetically engineered brassica juncea (Indian mustard) for potential risks of food allergy using bioinformatics and literature searches. Food Chem Toxicol. 83: 93-102, 2015.
60. Venkaiah K, Brahmam GNV, Vijayaraghavan K: Identification of dietary patterns by factor analysis and study of the relationship with nutritional status of rural adolescents using factor scores. J Health Popul Nutr. 34: 1-8, 2015.
61. Venkaiah K, Hemalatha R, Harikumar R, Paleswara Vara Parasad Saride, Srinivasan K, Brahmam GNV: Identification of socio-demographic behavioral patterns and their relationship with HIV status among female sex workers. World J AIDS. 5: 41-49, 2015.
62. Venkaiah K, Meshram II, Manohar G, Mallikharjuna Rao K, Sree Ramakrishna K, Laxmaiah A : Development of composite index and ranking the districts using nutrition survey data in Madhya Pradesh, India. Indian J Comm Health. 27: 204-10, 2015.
63. Vijayendrachary A, Hemalatha R, Seshacharyulu M, Vasudevan Murali M, Jayaprakash D, Dinesh Kumar B: Vitamn D deficiency in pregnant women impairs regulatory T cell function. J Steroid Biochem Mol. Biol. 147 : 48-55, 2015.
64. Vipin Gupta, Christopher Millett, Gagandeep Kaur Walia, Sanjay Kinra, Aastha Aggarwal, Poornima Prabhakaran, Santhi Bhogadi, Aniket Kumar, Ruby Gupta, Prabhakaran D, Srinath Reddy K, George Davey Smith, Yoav Ben-Shlomo, Radha Krishna KV, Shah Ebrahim : Socio-economic patterning of cardiometabolic risk factors in rural and peri-urban India: Andhra Pradesh children and parents study (APCAPS). J Public Health. 23: 129-136, 2015.
65. Vishwaraj S, Shiva KS, Betsy AD, Bhanuprakash Reddy G, Mario M, William DH, Eric SW, Satish KM : Fibrocytes regulate wilms tumor 1-positive cell accumulation in severe fibrotic lung disease. J Imunol. 195: 3978-3991, 2015.
B. PAPERS PUBLISHED IN PROCEEDINGS/BOOKS/CONFERENCES/ABSTRACTS1. Augustine LF, Nair KM, Sylvia Fernandez Rao, Balakrishna N, Rao MV, Ravinder P, Rao VV, Laxmaiah A
: A multi-component nutrition education programme aimed at increasing fruit and vegetable intake improves knowledge on micronutrients, serum retinol and haemoglobin among adolescents. Nutrition Society of India, 47th Annual National Conference, 9-10th October 2015, National Institute of Nutrition, Hyderabad, 2015.
2. Bhanuprakash Reddy G, Sivaprasad M, Shalini T, Balakrishna N: Influence of micronutrients on biochemical pathways involved in diabetic complications. Proceedings of the Keystone Symposium on Human Nutrition, Environment and Health, Beijing (China), October 14-18, 2015.
3. Bhat RV, Vasanthi S: Mycotoxin health hazards from millets. Paper presented at Global consultation on millet promotion for health and nutritional security. 18-20 December 2014. Published in Millets for food and Nutritional Security: In: Compendium of Lead lectures delivered in Global Consultation on Millets promotion for health and Nutritional Security. 2015. Ed by: Vilas Tonapi, B Dayakar Rao, JV Patil, Society for Millets Research, Rajendranaar, Hyderabad, ISBN: 81-98335-52-9, 356pp ,2015.
4. Konapur A, Gavaravarapu SM. Nair KM, Nagalla B, Rachakulla H: Assessing variables of food environment for practicing consumption of diversified diet. Nutrition Society of India, 47th annual national conference, 9-10th October 2015, National Institute of Nutrition, Hyderabad, 2015.
5. Laxmaiah A., Balakrishna N., Mallkharjuna Rao K, Ravindranath M: Prevalence and determinants of overweight and obesity among urban adolescents in Andhra Pradesh. In “Child's Development in India” Ed., by Dr. Vijayanthimala, Dr.A.Laxmaiah, Dr.K.Mallikharjuna Rao, Vandana Mallempati, Annol Publications Pvt. Ltd., New Delhi, 2015.
6. Mallkharjuna Rao K, Meshram II, Venkaiah K, Laxmaiah A: Antenatal care and Infant & young child

162
feeding practices among the tribes of Jhabua district in Madhya Pradesh”. In “Child's Development in India, Ed by Dr. Vijayanthimala, Dr.A.Laxmaiah, Dr.K.Mallikharjuna Rao, Vandana Mallempati, Annol Publications Pvt. Ltd, New Delhi, 2015.
7. Mallkharjuna Rao K, Venkaiah K, Laxmaiah A, Arlappa N, .Radhika MS, Galreddy Ch, Brahmam GNV: Levels of undernutrition among children of below five years of age in Koraput district of Odisha, India. In “Child's Development in India”, Ed by Dr. Vijayanthimala, Dr.A.Laxmaiah, Dr.K.Mallikharjuna Rao, Vandana Mallempati, Anmol Publications Pvt. Ltd, New Delhi, 2015.
8. Meshram II, Mallkharjuna Rao K, Galreddy Ch, Ravindranath M, Sharad Kumar, Sree Ramakrishna K., Harikumar R., Venkaiah K, Laxmaiah A: Antenatal care, delivery and infant feeding practices and their association with undernutrition among infants in urban ICDS areas of Gujarat, India. In “Child's Development in India” Ed by Dr. Vijayanthimala, Dr.A.Laxmaiah, Dr.K.Mallikharjuna Rao, Vandana Mallempati, Annol Publications Pvt. Ltd, New Delhi, 2015.
9. NairKM: Bioavailability of micronutrients from plant foods. 11th International food data conference on food composition and public health nutrition, 3-5th November 2015, National Institute of Nutrition, Hyderabad, 2015.
10. Nair KM: Food fortification is an effective strategy for controlling multiple micronutrient deficiency. International Conference on Maternal and Child Nutrition “Effective delivery through evidence and Innovative”, 23-24th November 2015, South Asia Infant Feeding Research Network (SAIFRN) in collaboration with the United Nations Children's Fund (UNICEF), Colombo, Sri Lanka, 2015.
11. Surekha A, Pullakhandam R, Tripuravenkata VGN, Ratnavathi CV, Nair KM, Neelamraju S: Bioavailability of iron and zinc from high iron and zinc rich lines using Caco-2 cell model. 11th International Food Data Conference on Food Composition and Public Health Nutrition, 3-5th November 2015, National Institute of Nutrition, Hyderabad, 2015.
C. POPULAR ARTICLES1. Bhanuprakash Reddy G: Nutrition and cataract. CRNSS-Nutrition in Disease Management. Update
Series 67, July 2015.2. Bhaskarachary K, Kalpagam Polasa: Scope, potential and prophylactic role of diet derived plant
metabolites. Nutrition in Disease management, CRNSS, Series 65: 1-15pp, January, 2015.3. Bhaskarachary K, Sudershen Rao V: Total diet study for food risk assessment. Food Safety and
Standards Authority of India(FSSAI) Newsletter, Vol 1,Issue 4,May 20154. Nair KM, Augustine LF: Cover story, Nutrients: Concepts of RDA, UTL and NOAEL, Protein Foods and
Nutrition Development Association of India, PFNDAI Bulletin, October, 2015.

163
SCIENTIFIC ADVISORY COMMITTEE
NIN/FDTRC
Dr. Anura Kurpad … ChairpersonProfessor of Physiology, St. John's Medical College, Sarjapur Road, Opp BDA Complex, Bengaluru – 560034, Karnataka
Dr. C. S. PandavImmediate Past President IAPSMCentre for community MedicineAll India Institute of Medical SciencesAnsari Nagar, New Delhi – 110 029
Dr. Sanjay MahandaleDirector, National Institute of Epidemiology, R-127, Tamil Nadu Housing Board, Ayapakkam, Chennai - 77
Dr. P. ReddannaDept. of Animal SciencesSchool of Life Sciences, University of Hyderabad Gachibowli, Hyderabad
Dr. Ashok B. VaidyaResearch DirectorKasturba Health Society - Medical Research Centre, Sthanakwasi Jain Aradhana Dham17, Khandubai Desai RoadVile Parle, Mumbai 400 056
Dr. Kumud KhannaDirector (Retired), IHEB9/21, Vasant ViharNew Delhi – 110 057
Dr. S. RadhakrishnaD-201, High Rise Apts, Lower Tank Bund Road, Gandhinagar, Hyderabad
Dr. NeelaveniAssociate ProfessorOsmania General Hospital, Hyderabad
Dr. M. NarendraAssociate ProfessorGandhi Hospital, Secunderabad
Dr. Anand K. KondapiDept. of Biotechnology, University of Hyderabad, Hyderabad
Prof. Venkataramana DeviHoD, Biochemistry, Osmania University Hyderabad
Prof. B. P. SanjayPro-VC, HCU, Dept. of CommunicationHyderabad
ICMR Officials
Dr. Soumya SwaminathanSecretary to Govt. of India Department of Health Research (Ministry of Health & Family Welfare) &Director General, Indian Council of Medial Research, V. Ramalingaswami BhawanAnsari Nagar, Post Box. 4911, New Delhi -29
Dr. G. S. TotejaScientist 'G' & Head- Nutrition Indian Council of Medical ResearchV.Ramalingaswami BhawanAnsari Nagar, Post Box. 4911New Delhi – 110 029
Dr. Rajesh Kumar, IASSr. Deputy Director General (Administration) & CVO, Indian Council of Medical ResearchV. Ramalingaswami BhawanAnsari Nagar, Post Box. 4911, New Delhi -29

164
NCLAS
Dr. D. Swarup … ChairpersonMember CPCSEA (MoEF)Former Director-CIRG & Head Division of Medicine, IVRI, B-102, Elita Promenade, JP Nagar Phase 7, Bangalore – 5600 078
Dr. P. Prakash BabuProfessor & HoD, Dept. of BiotechnologySchool of Life Sciences, University of HyderabadHyderabad - 500 046
Dr. Arun Kumar KPScientist & Head-Molecular Genetics Dept.,CDFD Bldg. 7, Gruhakalpa, 5-4-399 / B, Nampally, Hyderabad - 500 001,
Dr. V. V. KulkarniDirector, National Research Centre on Meat, Chengicherla, P.O.Box No.19, Hyderabad -92
Dr. K. NachimuthuFormer Director of Research,Tamilnadu Veterinary and Animal Sciences University, No.4, Damodaran Street, PanchavadiChetpet, Chennai – 600 031