Ar Budgetrev 2006
47
Board of Governors of the Federal Reserve System 2006
-
Upload
fraser-federal-reserve-archive -
Category
Documents
-
view
219 -
download
1
Transcript of Ar Budgetrev 2006

AN
NU
AL
RE
PO
RT
OF
TH
E F
ED
ER
AL
RE
SE
RV
E B
OA
RD
: BU
DG
ET
RE
VIE
W2006
Board of Governors of the Federal Reserve System
2006

Board of Governors of the Federal Reserve System
2006

April 2006
This publication is available from Publications Fulfillment, MS-127, Board of Governors of the Federal Reserve System, Washington, DC 20551. It is also available on the Board’s web site, www.federalreserve.gov.

Contents
Introduction 1 Summary of 2005 Income and Expenditures2 Operational Areas
The Budgets Chapter 1
7 FEDERAL RESERVE SYSTEM8 2006 System Budget Initiatives9 Trends in Expenses and Employment9 2006 Capital Budgets
Chapter 2 11 BOARD OF GOVERNORS 11 Planning Issues 11 Major Initiatives 12 Areas of Risk 12 Operations Budget by Operational Area 15 Capital Budget 15 Positions 16 2004–05 Budget Performance 16 Trends in Expenses and Employment 18 Office of Inspector General
Chapter 3 19 FEDERAL RESERVE BANKS 20 2005 Budget Performance 21 Factors Affecting the 2006 Budget 23 2006 Personnel Expenses 23 Risks in the 2006 Budget 24 2006 Capital Plan
Appendixes Appendix A
27 FEDERAL RESERVE BUDGET PROCESSES 27 Board of Governors 28 Reserve Banks
Appendix B 29 PRICED SERVICES 29 Annual Pricing Process

Appendix C 31 CURRENCY BUDGET 31 Printing of Federal Reserve Notes 32 Currency Transportation 32 Counterfeit-Deterrence Research 33 Treasury’s Office of Currency Standards
Appendix D 35 EXPENSES AND EMPLOYMENT AT THE BOARD OF GOVERNORS
Appendix E 39 EXPENSES AND EMPLOYMENT AT THE FEDERAL RESERVE BANKS
44 MAPS OF THE FEDERAL RESERVE SYSTEM

Introduction 1
Introduction
The Federal Reserve System consists of the Board of Governors in Washington, D.C., the twelve Federal Reserve Banks with their twenty-five Branches distributed throughout the nation, the Federal Open Market Committee (FOMC), and three advisory groups—the Federal Advisory Council, the Consumer Advisory Council, and the Thrift Institutions Advisory Council. The System was created in 1913 by Congress to establish a safe and flexible monetary and banking system. Over the years, Congress has given the Federal Reserve more authority and responsibility for achieving broad national economic and financial objectives.
-
-
-
-
As the nation’s central bank, the Federal Reserve has many, varied responsibilities. It acts to ensure that the nation’s economy grows at a pace consistent with price stability; it serves as the nation’s lender of last resort, with responsibility for forestalling national liquidity crises; and it is involved in bank supervision and regulation, with responsibilities for bank holding companies, financial holding companies (created under the Gramm-Leach-Bliley Act, enacted in November 1999), state-chartered banks that are members of the Federal Reserve System, the foreign activities of U.S. banks, and the U.S. activities of foreign banks. The Federal Reserve also administers the nation’s financial consumer protection laws.
--
The Federal Reserve System plays a major role in the nation’s payment mechanism. The Reserve Banks distribute currency and coin; process Fedwire, automated clearinghouse, and securities transfers; and collect checks. In addition, the Federal Reserve Banks serve as the
fiscal agents of the United States and provide a variety of financial services for the Treasury, other government agencies, and other fiscal principals. For a fuller discussion of the Federal Reserve’s responsibilities, see the Board publication
---
-
--
The Federal Reserve System: Purposes and Functions.
Summary of 2005 Income and Expenditures In carrying out its responsibilities in 2005, the Federal Reserve System incurred an estimated $1.6 billion in net operating expenses. Total spending of an estimated $2.9 billion was offset by an estimated $1.4 billion in revenue from priced services, claims for reimbursements, and other income.
-
The major source of Federal Reserve income is earnings from the portfolio of U.S. government securities in the System Open Market Account, estimated at $29.0 billion in 2005. Earnings in excess of expenses, dividends, and surplus are transferred to the U.S. Treasury—in 2005 an estimated $21.5 billion. (These earnings are treated as receipts in the U.S. budget accounting system and as anticipated earnings projected by the Office of Management and Budget in the U.S. budget.)
-
-
Beginning with the 1998–99 budget, the Board of Governors has operated on a two-year budget cycle and a four-year planning cycle. Given their current business needs, the Federal Reserve Banks maintain an annual budget cycle. For more information on the budget processes, see appendix A.
-
-

2 Annual Report: Budget Review, 2006
Operational Areas
In 2005 the Federal Reserve System accounted for costs using the following categories: monetary and economic policy, supervision and regulation of financial institutions, services to financial institutions and the public, services to the U.S. Treasury and other government agencies, and System policy direction and oversight.
Monetary and Economic Policy
The monetary and economic policy operational area encompasses Federal Reserve actions to influence the availability and cost of money and credit in the nation’s economy. In 2005, the FOMC held eight regularly scheduled meetings and adjusted the federal funds rate eight times.
A vast amount of banking and financial data flows through the Reserve Banks to the Board, where the data are compiled and made available to the public. The research staffs at the Board and the Reserve Banks use these data, along with information collected by other public and private institutions, to assess the state of the economy and the relationships between the financial markets and economic activity. Staff members provide background information for the Board of Governors and for each meeting of the FOMC by preparing detailed economic and financial analyses and projections for the domestic economy and international markets. The Board and the FOMC use these analyses and projections in setting reserve requirements, setting the discount rate (which affects the cost of borrowing), and conducting open market operations. Staff members also conduct longer-run economic studies on regional, national, and international issues.
Supervision and Regulation
The Federal Reserve System plays a major role in the supervision and regulation of banks and bank holding companies. The Board of Governors adopts regulations to carry out statutory directives and establishes System supervisory and regulatory policies. The Reserve Banks conduct on-site examinations and inspections of state member banks and bank holding companies; review applications for mergers, acquisitions, and changes in control from banks and bank holding companies; and take formal supervisory actions. In 2005, the Federal Reserve conducted 563 examinations of state member banks (some of them jointly with state agencies) and 496 inspections and 3,233 risk assessments of bank holding companies; it acted on 3,442 international and domestic applications.
The Board also enforces state member banks’ and certain foreign banking organizations’ compliance with the federal laws protecting consumers in their use of credit and deposit products. Between July 1, 2004, and June 30, 2005, the System conducted 239 consumer compliance examinations, including 220*
* Corrected since April 2006 release of report.
covering state member banks and 19 covering foreign banking organizations. Additionally, during the 2004 reporting period, the System performed 163 Community Reinvestment Act examinations.
The Board’s supervisory responsibilities also extend to the foreign operations of U.S. banks and, under the International Banking Act, to the U.S. operations of foreign banks. Beyond these activities, the Federal Reserve System maintains continuous oversight of the banking industry to ensure the overall safety and soundness of the financial system. This broader responsibility is reflected in the System’s presence in financial markets, through open market operations, and in its role as lender of last resort.

3 Introduction
Services to Financial Institutions and the Public The Federal Reserve System plays a central role in the nation’s payment systems by ensuring that enough currency and coin are in circulation to meet the public’s demand. The Bureau of Engraving and Printing prints currency and the U.S. Mint mints coin, which the Reserve Banks distribute to the public through depository institutions. Reserve Banks also receive deposits of currency and coin from depository institutions, identify suspect currency that they forward to the U.S. Secret Service, and destroy currency that is unfit for circulation. In 2005, the Reserve Banks received approximately $659.2 billion in currency and $5.4 billion in coin from depository institutions, distributed approximately $698.4 billion in currency and $6.7 billion in coin, and destroyed $83.2 billion in unfit currency.
-
-
-
The Reserve Banks also play a central role in the nation’s payment systems by collecting checks and providing a variety of electronic services for depository institutions. In 2005, the Reserve Banks collected approximately 12.2 billion commercial checks, with a total value of about $14.4 trillion. The Reserve Banks’ automated clearinghouse (ACH) service allows depository institutions to send or receive credit and debit payment transactions. ACH payments are typically used for check payments, such as payroll, dividend, mortgage, and bill payments. In 2005, the Reserve Banks processed approximately 8.3 billion ACH transactions, valued at about $16.0 trillion. Approximately 11.6 percent of the transactions were for the federal government; the rest were for commercial establishments.
-
-
-
-
--
The Reserve Banks’ Fedwire Funds Service allows depository institutions to draw on their reserve or clearing balances at the Reserve Banks and to trans
fer funds to other institutions that maintain accounts at the Reserve Banks. In 2005, the Reserve Banks processed more than 132 million Fedwire funds transfers, valued at more than $518 trillion.
--
-
The Reserve Banks’ National Settlement Service allows participants in private clearing arrangements to settle transactions through their Federal Reserve accounts. Approximately 55 local and national private arrangements, primarily check clearinghouse associations but also other types of arrangements, use the National Settlement Service. In 2005, the Reserve Banks processed over 440,000 settlement entries for these arrangements.
-
-
The Reserve Banks’ Fedwire Securities Service provides securities services for the handling of book-entry (computer-based) securities and the collection of physical interest coupons and miscellaneous items. The service allows participants to electronically transfer to other participants securities issued by the Treasury, federal government agencies, and other approved entities. In 2005, participants originated approximately 24 million transfers valued at about $378 trillion. The noncash collection service, through which maturing or called municipal coupons and bonds are presented for collection, processed about 117,000 transactions in 2005. In February 2005, the Board approved a plan to withdraw from the noncash service by the end of 2005. The Reserve Banks stopped accepting deposits on September 30, 2005, and withdrew from this service on December 30, 2005.
-
--
-
---
-
-
Services to the U.S. Treasury and Other Government Agencies Pursuant to the Federal Reserve Act, the Reserve Banks provide fiscal agency and depository services to the U.S. govern-

4 Annual Report: Budget Review, 2006
ment and other fiscal principals. These services relate to securities custody and transfer, payments, deposits, and customer support. The federal government and other fiscal principals reimburse the Reserve Banks for the cost to provide these services. In 2005, Reserve Banks sought reimbursement of approximately $400 million. Reimbursement was received or is expected for all of the expenses incurred.
-
-
-
Reserve Banks issue, service, and redeem marketable Treasury securities and savings bonds and process secondary-market Fedwire securities transfers. In 2005, the Reserve Banks processed nearly 68,000 competitive and noncompetitive bids for Treasury securities and printed and mailed more than 32 million savings bonds. The Reserve Banks operate two book-entry (computer-based) securities systems for the custody of Treasury securities—the Fedwire securities service and a separate computer application designed for retail investors who plan to hold these securities until maturity. Almost all book-entry Treasury securities are maintained on Fedwire, which is also the nation’s principal securities transfer mechanism.
-
Reserve Banks collect and disburse funds on behalf of the federal government. The Reserve Banks maintain the Treasury’s bank account, accept deposits, pay checks drawn on the Treasury’s account, and make Fedwire and automated clearinghouse payments for the Treasury. In 2005, the Reserve Banks continued to assist Treasury in its efforts to receive and make payments electronically. For example, the Reserve Banks operate the Pay.gov Internet portal, which
permits the public to pay Treasury and agencies over the Internet.
-
-
-
-
The Reserve Banks invest excess Treasury balances with more than 1,100 depository institutions, which pay interest to the Treasury for the use of the funds. In 2005, the Reserve Banks invested approximately $1.7 trillion of Treasury balances through the program. Some of these funds are callable on demand and pay interest equal to the federal funds rate less 25 basis points. The Reserve Banks also place Treasury funds with depository institutions for a set term, with the interest rate set at auction.
-
-
-
The Reserve Banks also provide fiscal agency and depository services to other domestic and international entities. Depending on the authority under which the services are provided, the Reserve Banks may maintain book-entry accounts of securities, provide custody for the stock of unissued, definitive (physical) securities, maintain and update balances of outstanding book-entry and definitive securities for issuers, and maintain related funds accounts.
System Policy Direction and Oversight This operational area encompasses activities by the Board of Governors in supervising Board and Reserve Bank programs. At the System level, the expenses for these activities are considered overhead and are therefore allocated across the other operational areas. At the Board level, these expenses are not treated as overhead nor allocated to other operational areas. �
---
-
-

The Budgets

Federal Reserve System
Millions of dollars, except as noted
Item 2004 (actual)
2005 (estimated)
2006 (budgeted)
Percent change
2004–05 2005–06
Total System operating expenses .................
LESS
Revenue from priced services .................. Other income ............................................ Claims for reimbursements1 ....................................
EQUALS Net System operating expenses ............
2,783.8
914.6 1.0
370.3
1,497.9
2,932.4
959.9 1.1
399.0
1,572.4
3,085.8
912.6 1.3
429.9
1,742.0
5.3 5.2
5.0 –4.9 10.0 18.2
7.8 7.7
5.0 10.8
NOTE: Components may not sum to totals and may not 1. Costs of fiscal agency and depository services pro-yield percentages shown because of rounding. vided to the U.S. Treasury, other government agencies,
Operating expenses reflect all redistributions for sup- and other fiscal principals that are billed to these port and overhead, and they exclude capital outlays. agencies.
See text note 3.
7
Chapter 1
Federal Reserve System
For 2006, total operating expenses are budgeted at $3,085.8 million, an increase of 5.2 percent from estimated 2005 expenses. Of this total, $2,786.3 million is for the Reserve Banks and $299.5 million is for the Board of Governors (tables 1.1 and 1.2).
-
-
-
1 Revenue from priced services provided to depository institutions is expected to total $912.6 million, or 29.6 percent of total budgeted operating expenses. This revenue, combined with claims for reimbursement and other income, results in the recovery of 43.5 percent of the System’s budgeted 2006 operating expenses.2 When these items
are deducted from budgeted 2006 operating expenses, the net expenses of the System show are 10.8 percent higher than estimated 2005 net operating expenses (table 1.1).
1. The Board of Governors budgets on a two-year cycle; in this chapter, 2006 values shown for the System and the Board reflect the estimated first-year effect of the Board’s 2006–07 budget.
2. Claims for reimbursement refers to costs of fiscal agency and depository services provided to the U.S. Treasury, other government agencies, and other fiscal principals that are billed to these
agencies.
Table 1.1
Not included in the budget for operations is the cost of new currency, budgeted at $494.0 million for 2006, an increase of 3.1 percent from the 2005 estimated cost of $479.0 million.
-
3 Including the cost of new currency, the distribution of expenses is similar to that in previous years, with the Reserve Banks’ expenses accounting for 78 percent of the total,
Other income comes from services provided on behalf of the U.S. Treasury that are paid for by the depository institutions using the services, which include the transfer of funds between depository institutions and the Treasury.
-
3. The Federal Reserve pays for the printing of new currency at the Bureau of Engraving and Printing. This cost is not included in the Federal Reserve operating expenses. For more information, see appendix C, “Currency Budget.”
Operating Expenses of the Federal Reserve System, Net of Receipts and Claims for Reimbursement, 2004–06

Millions of dollars, except as noted
Item 2004 (actual)
2005 (estimated)
2006 (budgeted)
Percent change
2004–05 2005–06
Reserve Banks1 ............................................ Personnel .................................................. Nonpersonnel ...........................................
Board of Governors2 .................................... Personnel .................................................. Nonpersonnel ...........................................
Total System operating expenses ............. Personnel ................................................. Nonpersonnel ..........................................
Currency3 .....................................................
2,517.7 1,551.7
966.0
266.1 196.3
69.8
2,783.8 1,748.0 1,035.8
514.0
2,652.2 2,786.3 5.3 5.1 1,755.4 1,810.9 13.1 3.2
896.8 975.4 –7.2 8.8
280.2 299.5 5.3 6.9 200.3 221.8 2.0 10.7
79.9 77.7 14.5 –2.8
2,932.4 3,085.8 5.3 5.2 1,955.7 2,032.7 11.9 3.9
976.7 1,053.1 –5.7 7.8
479.0 494.0 –6.8 3.1
NOTE: Components may not sum to totals and may not yield percentages shown because of rounding.
Operating expenses include costs for special projects and exclude capital outlays.
1. For detailed information on Reserve Bank expenses, see chapter 3.
2. Includes extraordinary items and expenses of the Office of Inspector General. See also chapter 2.
3. See appendix C.
8 Annual Report: Budget Review, 2006
Table 1.2
Expenses of the Federal Reserve System for Operations and Currency, 2004–06
new-currency expenses accounting for 14 percent, and Board expenses accounting for the remainder (chart 1.1).
-
System employment is budgeted at 21,749 for 2006, a decrease of 242 from the estimated 2005 level, largely because of planned staff reductions by the Reserve Banks, primarily in the check and support areas.
-
Chart 1.1 Distribution of Expenses of the Federal Reserve System, 2006
Currency, 14%
Board of Governors, 8%
Reserve Banks, 78%
2006 System Budget Initiatives In response to the continuing decline in check volume, the Reserve Banks have again established aggressive spending targets for their 2006 budgets. This spending restraint reflects the Banks’ efforts to reduce direct operating costs of the check service and to reduce Bank support and overhead costs, in keeping with a business and operational strategy to meet the System’s long-term financial and payment system objectives. The strategy focuses on reducing check-service operating costs by streamlining management and administrative structures, decreasing the number of check-processing locations, and increasing processing capacity at some locations. The Banks’ 2006 budgets include funding for initiatives to prepare for downsizing in the check service. Bank budget plans also fund increases in central bank functions, monetary policy, and supervision and regulation, as well as initiatives to improve the long-term efficiency of cash operations. The major fac-
-
-
--
-
--

Federal Reserve System 9
tors affecting the 2006 Reserve Bank budgets are outlined in more detail in chapter 3.
Trends in Expenses and Employment From actual 1997 levels to budgeted 2006 amounts, the operating expenses of the Federal Reserve System have increased an average of 3.8 percent per year (2.2 percent per year when adjusted for inflation) (chart 1.2). Over the same period, nondefense discretionary spending by the federal government has increased an annual average of 5.8 percent (chart 1.3). Over the 1997–2006 period, Federal Reserve System employment has decreased 2,972 (chart 1.4).
-
-
-
As mentioned above and detailed in chapter 3, the primary factors in Reserve Bank spending restraint and in the substantial staffing decreases are restructuring efforts in the check-processing function and efficiency measures in support and overhead functions. Over the same ten-year period, check costs increased by 0.7 percent and staffing levels declined by 5.0 percent. Support and overhead costs decreased by 0.8 percent and staffing levels declined by 5.2 percent.
-
--
Chart 1.2 Operating Expenses of the Federal Reserve System, 1997–2006
NOTE: For 2005, estimated; for 2006, budgeted. 1. Calculated with the GDP price deflator.
1997 1999 2001 2003 2005
Current dollars
2000 dollars1
Billions of dollars
1.0
3.0
2.0
Chart 1.3 Cumulative Change in Federal Reserve System Expenses and Federal Government Expenses, 1997–2006 Includes special projects
NOTE: Federal government expenses are discretionary spending less expenditures on defense.
For 2005, estimated; for 2006, budgeted.
1997 1999 2001 2003 2005
Percent
Federal government
Federal Reserve
60
40
20
2006 Capital Budgets The capital budget for the Reserve Banks and the Board totals $488.8 million, with $474.2 million budgeted for Reserve Banks and Federal Reserve Information Technology (FRIT) and $14.6 million budgeted for the Board. As in previous years, the 2006 capital budgets include funding for projects that support the strategic direction outlined by the individual Reserve Banks, System business leaders, and the Board. These strategic goals focus on investments that improve opera-
-
Chart 1.4 Employment in the Federal Reserve System, 1997–2006 Includes special projects
NOTE: For 2005, estimated; for 2006, budgeted.
1997 1999 2001 2003 2005
Thousands of persons
25
23
21

10 Annual Report: Budget Review, 2006
tional efficiencies and services to Bank customers and on providing a safe, quality work environment. More detailed discussions of the Board and Reserve Bank capital budgets are included in chapters 2 and 3, respectively. �
--

Board of Governors 11
Chapter 2
Board of Governors
Every two years, the Board and its senior staff undertake a process that produces a four-year strategic plan and a biennial budget. For the 2006–09 planning period and the 2006–07 budget period, the Committee on Board Affairs, assisted by a senior-level Staff Planning Group, and staff in the Planning and Budget Section of the Management Division, guided the process, which resulted in a budget objective of $609.5 million for operations. This budget objective was approved by the Board in September and the budget was approved in December.
-
-
-
Planning Issues The Staff Planning Group reviewed the planning materials submitted by the Board’s divisions and offices and identified the following major issues that will have a significant effect on Boardwide operations over the planning period:
-
• the full two-year cost of current initiatives such as reorganizations in the Division of Consumer and Community Affairs and the Management Division, creation of the Quantitative Unit in the Division of Banking Supervision and Regulation, and creation of the Monetary and Financial Studies Section in the Division of Monetary Affairs
-
-
• legislative and executive mandates for a number of activities, including physical and information security and electronic-government initiatives
• the need to attract and retain high-quality staff
• the need in the biennium to address office space requirements
These issues are reflected in the resource-allocation decisions of the Com
mittee on Board Affairs, which form the basis of the approved budget. They will also serve as the basis for the 2006–07 Performance Budget prepared as part of the Board’s voluntary compliance with the Government Performance and Results Act.
-
Major Initiatives To address these major planning issues, the approved budget includes the following initiatives and projects for the 2006– 07 period.
-
• Attract and retain high-quality staff. Initiatives to improve the Board’s ability to attract and retain staff include enhancements to the cash award program for staff and to the variable-pay program for economists, attorneys, and officers; a 3.8 percent merit increase for 2006 and a placeholder of 3.8 percent for the 2007 merit increase; a compensation study; and actions to enhance productivity and meet new requirements, such as improved information technology equipment, access to enhanced data sets, and a slight increase in staffing to assist with current analysis.
-
-
-
• Information technology (IT). Funding is provided for the Board to comply with electronic-government initiatives such as improved public access to data, federal information security management, and section 508 compliance.
-
• Workload. A small increase in the number of positions, a reallocation of positions to meet higher-priority requirements, and the filling of a number of vacant positions are necessary in order to comply with new laws that affect Board operations, such as our
-

12 Annual Report: Budget Review, 2006
expanded role relative to the Reserve Banks in the implementation of the Sarbanes-Oxley Act (SOX), Board implementation of the Committee on Sponsoring Organizations (COSO) framework and compliance with SOX, preparation for Basel II, and other key initiatives.
• Security and continuity of operations. Several factors have contributed to a significant increase in the budget for security and continuity of operations. These include market pressures in the security field as Washington agencies continue to expand security staff, a slight increase in overtime for coverage of additional security posts during construction of the security perimeter, some new overtime payments to remain competitive in the marketplace, and other actions to enhance employee safety and the Board’s ability to operate in a contingency environment.
---
-
• Facilities. In line with the Board’s strategic plan, capital investments are planned for the three Board facilities, as discussed in the capital budget section below. Additional noncapital improvements are also planned for all three facilities.
-
-
Areas of Risk Despite a careful and coordinated planning effort, future developments, such as the following, could require resources beyond what is currently approved:
-
• a merit increase greater than the 3.8 percent for 2007 or a higher rate of increase in health insurance costs
• changes to assumptions of turnover due to demographics and the estimated salaries of successors
• pressure in key areas requiring additional salary or benefit packages in order for the Board to remain competitive
-
• significant changes in or shocks to the economy or financial system that create a material increase in workload
-
• terrorist activity requiring additional security and contingency enhancements
-
• increased workload created by laws or decisions to expand or modify central bank operations
• changes to the position-vacancy-rate assumptions used in developing the salary budget and a need for more office space if the staff increases
Operations Budget by Operational Area The Board’s operations budget supports four broadly defined operational areas: monetary and economic policy, supervision and regulation, services to financial institutions and the public, and Federal Reserve System policy direction and oversight (tables 2.1 and 2.2). Following is a summary discussion of the resources, including support and overhead, budgeted for each area for 2006–07.
-
Monetary and Economic Policy The 2006–07 budget for the monetary and economic policy function is $243.6 million, an increase of $21.1 million, or an average of 4.1 percent per year.
-
As financial markets change, the monetary and economic policy function continues to evolve in order to develop effective monetary policy through open market operations, discount rates and the administration of the discount window, and reserve requirements. The Board has been evaluating the data used in crafting monetary policy, and it plans to make changes in the 2006–07 biennium. Initiatives will be taken to expand surveys and gather new data sets related to industrial output and commercial
-
-
-

Thousands of dollars, except as noted
Operational area orOffice of Inspector General
2004–05 (budgeted)
2004–05 (estimated)
2006–07 (budgeted)
Average annualpercent change
2004–05 estimated
compared with2004–05 budgeted
2006–07 budgeted
compared with2004–05 budgeted
Monetary and economic policy .. Supervision and regulation ......... Services to financial institutions
and the public ...................... System policy direction and
oversight ..............................
Total, Board operations ............
Office of Inspector General ........
224,590 217,990
10,156
85,834
538,570
8,533
224,273 217,682
10,142
85,712
537,809
8,533
243,583 247,015
11,668
107,209
609,475
10,237
–0.1 4.1 –0.1 6.4
–0.1 7.2
–0.1 11.8
–0.1 6.4
–0.0 9.5
NOTE: Operating expenses reflect all redistributions for capital outlays. Components may not sum to totals and support and allocations for overhead, and they exclude may not yield percentages shown because of rounding.
Operational area, support andoverhead, or
Office of Inspector General 2004–05
(budgeted) 2004–05
(estimated) 2006–07
(budgeted)
Average annualpercent change
2004–05 estimated
compared with2004–05 budgeted
2006–07 budgeted
compared with2004–05 budgeted
Monetary and economic policy .. Supervision and regulation ......... Services to financial institutions
and the public ...................... System policy direction and
oversight ..............................
Support and overhead1 ................
Subtotal ...................................
Reimbursable IRM support2 .......
Total, Board operations ............
Office of Inspector General ........
426 385
24
173
860
1,868
27
1,895
31
434 400
25
170
901
1,930
27
1,957
31
435 406
25
169
914
1,949
27
1,976
31
0.9 1.1 1.9 2.7
2.1 2.1
–0.9 –1.2
2.4 3.1
1.6 2.1
0.0 0.0
1.6 2.1
0.0 0.0
1. Includes seventeen youth positions, ten worker tions Examination Council for processing data collected trainee positions, and four summer intern positions. under the Home Mortgage Disclosure Act and the Com-
2. Positions in the Division of Information Technol- munity Reinvestment Act. ogy that provide support to the Federal Financial Institu-
Board of Governors 13
Table 2.1
Expenses of the Board of Governors for Operational Areas and Office of Inspector General, 2004–07
Table 2.2
Positions Authorized at the Board of Governors, by Operational Areas, Support and Overhead, and Office of Inspector General, 2004–07

14 Annual Report: Budget Review, 2006
activity and consumer and mortgage credit. At the same time, other data, such as those gathered for the M3 series, which are serving a less valuable purpose, will be discontinued.
A continuing challenge in this area is recruiting and retaining qualified staff. However, implementation of new compensation policies, such as variable pay, has been helpful.
-
Supervision and Regulation The 2006–07 budget for the supervision and regulation function is $247.0 million, an increase of $31.1 million, or an average of 6.4 percent per year.
-
The U.S. banking system has evolved into a sector with a small number of large complex banking organizations operating across wide geographic regions, and numerous smaller institutions focused on local communities or regional areas. The Division of Consumer and Community Affairs and the Division of Banking Supervision and Regulation have realigned their structures in response to these changes by creating Large Financial Institutions/Large Banking Organization units within their organizations and enhancing their oversight of the conduct of supervision. The changes will help the Board improve the quality and consistency of supervision for a range of institutions by promoting a more explicit portfolio-management approach as well as enhanced quality assurance within the supervision function. A number of significant automation projects supporting this work are included in the capital budget.
--
---
-
During the 2006–07 budget period, this function will also devote resources to the implementation of the Basel II capital accord and will lead the development of Electronic Applications (E-Apps), an electronic system that financial institutions will use to file applications and that will be used throughout the Federal Reserve System.
-
Services to Financial Institutions and the Public The 2006–07 budget for oversight of Reserve Bank services to financial institutions and the public is $11.7 million, an increase of $1.6 million, or an average of 7.2 percent per year.
-
-
A portion of the increase is attributable to enhancements to the CASH Statistical Data System and resolution of production issues. Additional funds were also provided for the administration of a survey to assess the effect of the Check Clearing for the 21
-
st Century Act (Check 21) on various aspects of check processing.
The Board expects its workload to comprise, among other things, ongoing assessment of the Reserve Banks’ (1) business strategies addressing long-term check services viability and check infrastructure, (2) cash infrastructure study, and (3) implementation of major technological projects.
System Policy Direction and Oversight The 2006–07 budget for System policy direction and oversight is $107.2 million, an increase of $17.0 million, or an average of 11.8 percent per year. The increase would have been 3.2 percent per year, but the budget for the audit of the Reserve Bank audits was moved from overhead to this functional area to better manage the budget.
-
This budget reflects increased funding for personnel costs, transfer of the Reserve Bank external auditor contract, including costs for financial-statement attestation, increases in foreign travel and software requirements, significant growth in the use of the System interchange program, and rate changes for services provided by the Division of Information Technology.
--
The Board expects that the workload in this area will continue to be influenced

Board of Governors 15
primarily by the key strategic, technological, environmental, and infrastructure changes affecting the Reserve Banks’ payment services, fiscal agency activities, and major support functions. In addition, staff will continue to participate on work groups and perform analysis in support of the Board’s international work on payments systems.
-
-
Capital Budget The Board’s proposed 2006–07 capital budget is $31.4 million. Of this total, $18.6 million supports continued security enhancements and large building projects. Major facility projects include enhancing the perimeter security, installing sprinklers in the Martin Building and in the data center, renovating the main cafeteria, replacing the sanitary risers in the Eccles/Martin complex, and installing vehicle barriers at all three buildings.
-
-
-
Information technology projects of $4.1 million include computer server replacements, network infrastructure, and data security enhancements. Software and other office automation–related expenses of $7.2 million include projects such as the Shared National Credit Program and the National Information Center Rearchitecture. The Division of Banking Supervision and Regulation plans to upgrade the Shared National Credit Program by developing an interagency central repository, standardizing the process of collecting data from external sources, and enhancing security. The division will also modify the infrastructure of the National Information Center to reduce redundant processes and simplify the system for end users.
-
--
--
The remaining $1.5 million is for non-automation-related expenses, such as purchases of furniture and office equipment.
Positions For the 2006–2007 budget period, staffing requests resulted in a net increase of eighteen positions in the Board’s position authorization, bringing the total to 1,976 positions (see appendix D, table D.2).
-
The Management Division received a net increase of eleven positions to meet the demands of an increasing workload. During the planning process, a full-time carpenter and an apprentice were approved to handle office reconfigurations, thus reducing contractual services. To meet the Board’s COSO/SOX requirements, three additional analyst positions were also approved. Five positions (four mail clerks and one technician) were approved for conversion to higher-level positions, to assist with workload saturation. In addition, the division is creating four permanent positions to allow it to eliminate four dual occupancies in the procurement, training, health, and travel functions. Beyond these position increases, the division plans to self-fund five positions in the compensation, administration, information systems, and workers’ compensation area. Some of these positions are offset by the abolishment of two positions (in program direction and planning and budget), and some of the funding will be from outside the personnel services area.
-
-
-
--
The Division of Consumer and Community Affairs had a net increase of five positions, one of which will be for information systems development support previously provided by the Division of Information Technology and four of which will be for overall compliance risk associated with management of large financial institutions and large complex banking organizations.
-
-
In the Division of Monetary Affairs, an additional economist position was added in the Monetary Studies Section because of the increasing applicability of academic research to the framework for monetary policy strategies and to the formu-
--

16 Annual Report: Budget Review, 2006
lation, implementation, and communication of monetary policy, as well as potential changes to analytical elements of the Bluebook.
--
2004–05 Budget Performance During the 2004–05 budget period, although the operating budget remained unchanged, a number of divisions reallocated funds to higher-priority projects, such as development of a web-enabled Check 21 survey. Final expenses for Board operations are expected to be close to the $538.6 million budget.
-
Average employment during the 2004– 05 biennium was approximately 1,819. This is 84 employees (4.8 percent) higher than the 2002–03 average of 1,735. The majority of additions are related to completion of the hiring of security staff approved in the prior budget cycle. In addition, the variable-pay program, which was created to increase recruitment and retention of economists, attorneys, and officers, has been successful in decreasing turnover and will continue as a Board program.
-
The largest contributing factor in the increase in the budget for goods and services is utilities. The cost of electricity rose sharply when a moratorium on rate increases ended. Also, during the 2004– 05 budget cycle, steam prices increased numerous times, and the General Services Administration, which provides steam, has told its customers that prices will again rise dramatically in the near future because the price of the natural gas used to generate steam continues to escalate.
-
Trends in Expenses and Employment The rate of increase within the 2006–07 budget is 6.4 percent per year, which is equal to the 6.4 percent projected average annual rate of increase since the
1996–97 biennium (chart 2.1). The increase is mainly attributable to security initiatives, strategic human capital initiatives, and the increasing complexity of Board work over this period. The increased complexity required a net increase in positions and higher average grades, higher salaries, and increasingly sophisticated automation systems to manage ever-increasing volumes of data. The sharply higher security costs are mainly attributable to additional personnel.
-
-
-
Chart 2.1 Operating Expenses of the Board of Governors, 1996–2007
1996 1998 2000 2002 2004 2006
Millions of dollars
320
240
160
80
Current dollars
2000 dollars
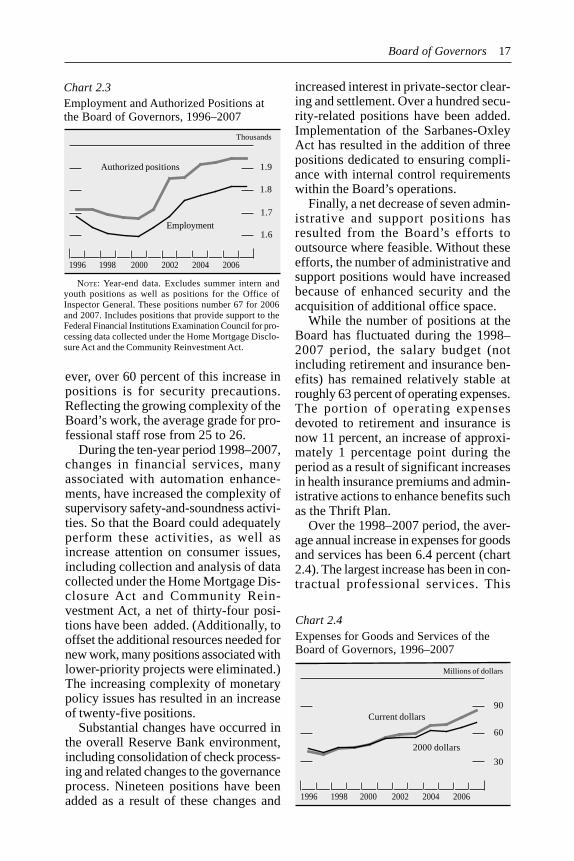
Approximately three-fourths of the Board’s operating expense is for personnel (chart 2.2); consequently, analysis of trends is heavily tied to staffing levels. From 1996 to 2007, the number of authorized positions for Board operations rose from 1,733 to 1,976, a net increase of 243, or 14.0 percent (chart 2.3). How-
-
Chart 2.2 Expenses for Personnel Services at the Board of Governors, 1996–2007
Millions of dollars
225
150
75
Current dollars
2000 dollars
1996 1998 2000 2002 2004 2006
Board of Governors 17
Chart 2.3 Employment and Authorized Positions at the Board of Governors, 1996–2007
Authorized positions
Employment
1.9
1.8
1.7
1.6
Thousands
1996 1998 2000 2002 2004 2006
NOTE: Year-end data. Excludes summer intern and youth positions as well as positions for the Office of Inspector General. These positions number 67 for 2006 and 2007. Includes positions that provide support to the Federal Financial Institutions Examination Council for processing data collected under the Home Mortgage Disclosure Act and the Community Reinvestment Act.
--
ever, over 60 percent of this increase in positions is for security precautions. Reflecting the growing complexity of the Board’s work, the average grade for professional staff rose from 25 to 26.
-
During the ten-year period 1998–2007, changes in financial services, many associated with automation enhancements, have increased the complexity of supervisory safety-and-soundness activities. So that the Board could adequately perform these activities, as well as increase attention on consumer issues, including collection and analysis of data collected under the Home Mortgage Disclosure Act and Community Reinvestment Act, a net of thirty-four positions have been added. (Additionally, to offset the additional resources needed for new work, many positions associated with lower-priority projects were eliminated.) The increasing complexity of monetary policy issues has resulted in an increase of twenty-five positions.
-
-
---
Substantial changes have occurred in the overall Reserve Bank environment, including consolidation of check processing and related changes to the governance process. Nineteen positions have been added as a result of these changes and
increased interest in private-sector clearing and settlement. Over a hundred security-related positions have been added. Implementation of the Sarbanes-Oxley Act has resulted in the addition of three positions dedicated to ensuring compliance with internal control requirements within the Board’s operations.
-
--
-
Finally, a net decrease of seven administrative and support positions has resulted from the Board’s efforts to outsource where feasible. Without these efforts, the number of administrative and support positions would have increased because of enhanced security and the acquisition of additional office space.
-
While the number of positions at the Board has fluctuated during the 1998– 2007 period, the salary budget (not including retirement and insurance benefits) has remained relatively stable at roughly 63 percent of operating expenses. The portion of operating expenses devoted to retirement and insurance is now 11 percent, an increase of approximately 1 percentage point during the period as a result of significant increases in health insurance premiums and administrative actions to enhance benefits such as the Thrift Plan.
-
-
-
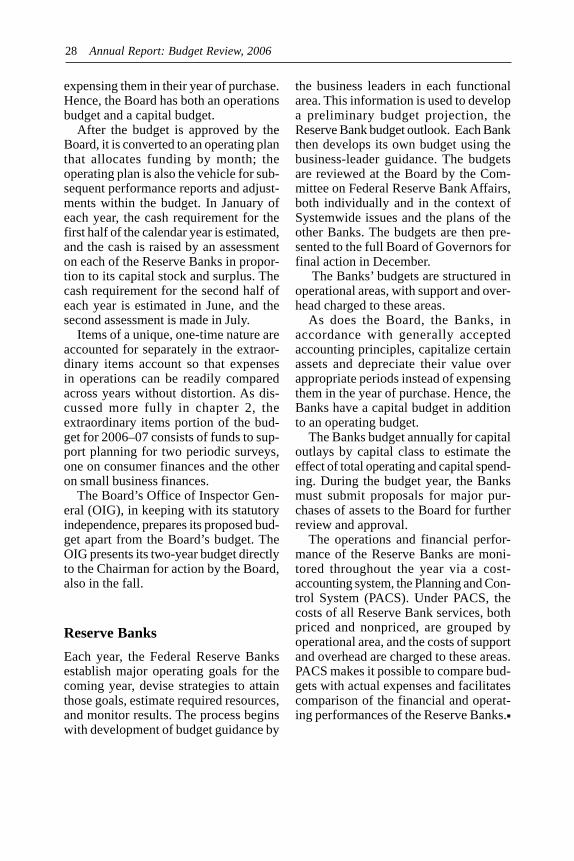
Over the 1998–2007 period, the average annual increase in expenses for goods and services has been 6.4 percent (chart 2.4). The largest increase has been in contractual professional services. This
-
-
Chart 2.4 Expenses for Goods and Services of the Board of Governors, 1996–2007
Current dollars
2000 dollars
90
60
30
Millions of dollars
1996 1998 2000 2002 2004 2006

18 Annual Report: Budget Review, 2006
growth has resulted primarily from four factors: (1) increased use of contracting services in the Information Technology, Management, and Banking Supervision and Regulation divisions; (2) significant increases in the amount and cost of data acquired from third parties; (3) procurement of outside legal services; and (4) development and implementation of software and office automation tools. Facility, security, and contingency planning projects also contributed to the increase. Partially offsetting the overall increase is the rental income received from New York Avenue and the Richmond relocation site.
-
-
-
Office of Inspector General The 2006–07 budget of $10.2 million for the Office of Inspector General (OIG) is separate from the Board’s budget. The OIG’s budget is prepared in a manner that is consistent with the preparation of the Board’s operating budget. In conformance with the statutory independence of the office, the OIG presents its budget directly to the Chairman of the Board of Governors for consideration by the Board. �
-

Federal Reserve BanksFederal Reserve Banks
Millions of dollars except as noted
Item 2005 (estimated)
2006 (budgeted)
Change
Amount Percent
Operations ...........................................................................
LESS Revenue from priced services ......................................... Other income ................................................................... Claims for reimbursement1 .............................................
EQUALS
Net expenses ..................................................................
2,652.2
959.9 1.1
399.0
1,292.2
2,786.3
912.6 1.3
429.9
1,442.5
134.1 5.1
–47.3 –4.9 0.2 18.2
30.9 7.8
150.3 11.6
NOTE: Excludes capital outlays. Includes expenses bud-geted by FRIT and OEB. Expenses from these entities have been charged to the Reserve Banks, as appropriate, and included in their budgets. Components may not sum to totals and may not yield percentages shown because of rounding.
Operating expenses reflect all redistributions for sup-port and allocations for overhead.
1. Costs of fiscal agency and depository services pro-vided to the U.S. Treasury, other government agencies, and other fiscal principals that are billed to these agencies.
19 19
Chapter 3
Federal Reserve Banks
The 2006 operating budgets of the twelve Reserve Banks total $2,786.3 million.1
The 2006 total is $134.1 million, or 5.1 percent, above estimated 2005 expenses. This increase is largely due to costs for further infrastructure changes and operational improvements in the check service and increased costs in the monetary policy and supervision and regulation functions. These increases are partially offset by savings from consolidated Treasury operations, efficiency initiatives in the cash area, savings from prior check-restructuring efforts, and continued efforts to streamline Reserve Bank support areas.
-
-
Approximately 48 percent of Reserve Bank expenses in the 2006 budget are
offset by revenues from priced services (33 percent) and reimbursable claims for services provided to the Treasury and other agencies (15 percent). Budgeted 2006 revenue is lower than the 2005 estimated level, primarily as a result of declining check volume. Reimbursable claims will increase 7.8 percent in 2006, reflecting additional initiatives performed by the Reserve Banks on behalf of the Treasury. (See table 3.1.)
1. These expenses include those budgeted by Federal Reserve Information Technology (FRIT) and the Office of Employee Benefits (OEB) that are chargeable to the Reserve Banks.
Table 3.1
Total 2006 projected average number of personnel (ANP) for the Reserve Banks, FRIT, and OEB is 19,869, a decrease of 264, or 1.3 percent, from 2005 estimated staff levels (see table 3.2).2 The 2006 staffing decrease contin-
2. ANP is the average number of employees in terms of full-time positions for the period. For instance, a full-time employee who works one-half of the year counts as 0.5 ANP for that calendar year; two half-time employees who work the full year count as 1 ANP.
Expenses of the Federal Reserve Banks, Net of Receipts and Claims for Reimbursement, 2005 and 2006

Average number of personnel except as noted
Item 2005 (estimated)
2006 (budgeted)
Change
Amount Percent
Reserve Banks ..................................................................... Federal Reserve Information Technology ........................... Office of Employee Benefits ...............................................
Total ....................................................................................
19,328 19,069 –259 –1.3 765 757 –8 –1.0
40 43 3 7.5
20,133 19,869 –264 –1.3
NOTE: Components may not sum to totals and may not yield percentages shown because of rounding. See text note 2 for definition of average number of personnel.
20 Annual Report: Budget Review, 2006
ues the trend of workforce reductions that began in the late 1990s. The 2006 budgeted staff reduction reflects the effect of infrastructure changes and volume declines in both check and currency processing, as well as the full-year effect of consolidation of Treasury retail securities operations. Lower staffing levels are also the result of efforts to increase efficiency in internal support areas such as information technology and human resources.
-
-
-
2005 Budget Performance Total 2005 expenses are estimated to be $2,652.2 million, a decrease of $10.9 million, or 0.4 percent, from the approved 2005 budget of $2,663.1 million. The Banks, FRIT, and OEB estimated 2005 ANP at 20,133, an increase of 166 from budgeted 2005 levels. The expense underrun was mainly due to lower costs for the Treasury Web Applications Infrastructure (TWAI) and FRIT.
-
-
3 A $12.0 million decrease in TWAI costs reflects lower vendor costs after contract terms were negotiated in 2005. A $3.0 million reduction in FRIT costs was largely attributable to lower hardware and soft
ware expenses resulting from efficiency initiatives such as server management and lower fees resulting from renegotiated vendor contracts.
3. TWAI provides a multi-tiered web environment that balances the business need for a secure access system with the need to provide public access to Treasury applications.
-
Also contributing to the underrun were a $2.6 million cost reduction in cash operations resulting from volume declines at several Banks and a $2.0 million reduction in costs for performing Treasury services resulting from a later-than-expected implementation of the new Go Direct campaign, an effort to convert recipients of Social Security and Supplemental Security Income checks to direct deposit.
-
-
These reductions were partially offset by higher-than-budgeted costs in several areas, including check operations ($7.3 million), information technology ($5.0 million), and security ($3.7 million) and by an infrastructure initiative in the cash area ($1.4 million). The increase in check costs were due to a lower-than-projected decline in volume, delays in the schedule to consolidate three offices’ check operations, and higher Check 21 expenses. Information technology costs increased because of initiatives in the Treasury and System open market areas. Other increases include higher costs in the security function and one-time costs related to infrastructure changes in cash operations. These changes, which were announced after the final 2005 budget was
-
Table 3.2
Employment at the Federal Reserve Banks, FRIT, and OEB, 2005 and 2006

Federal Reserve Banks 21
approved, involve transitioning cash services at several branches to cash depots.
-
Factors Affecting the 2006 Budget For 2006, the Reserve Banks have budgeted to expand economic research and community outreach efforts, to enhance expertise in the supervision and regulation function, and to continue to provide services as requested by the Treasury. The 2006 budget also supports Reserve Banks’ efforts to increase efficiency and reduce costs and includes funding of several initiatives to improve long-term operational efficiencies in both cash and check operations.
-
-
-
Central Bank Services Total costs for monetary policy and economic research are budgeted to increase by $25.3 million, or 8.5 percent, in the 2006 budget. Staffing levels are budgeted to increase by 51 ANP, in part because of the full-year effect of several Banks’ efforts initiated in 2005. In large part, the increase reflects Banks’ efforts to strengthen support to monetary policy formulation and increase emphasis on regional economic analysis and payments research.
-
Supervision and regulation costs are budgeted to increase by $31.0 million, or 6.0 percent, from the 2005 estimate. Staffing levels have declined slightly in recent years—primarily as a result of the loss of staff in a highly competitive job market— but are budgeted to increase by 101 ANP in the 2006 budget. Increases in the 2006 budget are related to efforts to bring staff up to optimal levels, recruit and retain staff with specialized skills, enhance the supervisory processes associated with compliance risk and risk-management practices, and develop revised capital adequacy guidance.
-
Reserve Banks are looking to enhance their presence and strengthen outreach
efforts, particularly in regions where there is only a limited Federal Reserve presence.
Therefore, costs for public programs, including outreach efforts aimed at depository institutions, are budgeted to increase by $6.6 million, or 4.6 percent, from the 2005 estimate, and staffing levels are budgeted to increase by 16 ANP.
-
The budget for cash operations was increased by $16.7 million, or 4.1 percent, to fund initiatives to improve the long-term efficiency of cash operations, define future software requirements, and upgrade high-speed currency-processing machines. These increases are offset slightly by staffing reductions due to declining volume at several Reserve Banks and infrastructure changes. As part of the effort to improve efficiency, three Reserve Bank offices will shift their currency-processing operations to other Reserve Banks and set up cash depots. In setting up a cash depot, the Federal Reserve contracts with a third party, usually an armored carrier, to accept currency deposits from, and distribute currency orders to, depository institutions. The Reserve Bank in the city nearest the depot processes the deposits, prepares the orders for the depots, and pays for transportation between the Reserve Bank and the depot operator.
-
-
-
Treasury-Related Functions Costs for Treasury services, which are fully reimbursed by the Treasury, are budgeted to increase by $30.4 million, or 8.0 percent, in the 2006 budget. The increase reflects investments in electronic payment technology, partially offset by efforts to improve the efficiency of other, more labor-intensive operations through consolidations. For several years, the Federal Reserve, at the request of the Treasury, has focused on improving its automation of electronic payments projects, including the development of the Trea-
-
---

22 Annual Report: Budget Review, 2006
sury Web Application Infrastructure (TWAI). Total costs for TWAI are budgeted to increase by $4.7 million, or 7.4 percent, to support TWAI enhancements and projected growth in use of TWAI.
-
Costs for the Treasury’s Payment Application Modernization (PAM) project are budgeted to increase by $5.8 million in the 2006 budget, mainly for additional technical staff. PAM will replace approximately 30 Financial Management Service (FMS) applications used to disburse one billion federal payments annually. Costs for the Treasury Check Information System (TCIS) will increase $3.0 million. TCIS will replace the FMS’s aging check payment and reconcilement system. The new system will provide an up-to-date, web-based means of managing 250 million Treasury check payments annually.
-
-
Costs related to electronic-government projects—Pay.gov, paper check conversion, and electronic check processing— are budgeted to increase by $2.3 million, primarily due to additional software amortization, transaction fees for user verification services, and staff additions of seven ANP. In addition, costs related to the stored-value card program will increase $2.2 million as a result of software and equipment depreciation and continued expansion of the program.
-
-
The consolidation of Treasury retail securities (TRS) operations, completed in October 2005, continues to produce savings in Treasury operations. The effort, which began in 2004, reduced the number of offices with savings bond and TreasuryDirect operations to two. Since 2003, costs for TRS have decreased $32.6 million, or 30 percent, and staffing levels have decreased 134 ANP.
-
-
-
Check Services Total check service expenses are budgeted to increase by $5.7 million, or 0.9 percent, from the 2005 estimate. The
increase reflects one-time costs to prepare for further consolidations of check operations, as well as other initiatives underway to improve the efficiency of check operations, including investments in Check 21 technology to accommodate increased volumes. These increases are offset partially by lower costs as a result of infrastructure changes in 2005 and early 2006. Check-processing staffing levels are budgeted to decrease by 338 ANP, a decrease slightly offset by an additional 24 in national administrative functions.
-
--
Since 2001, total check costs have declined $135.8 million and staffing levels have declined by 1,732 ANP. During this period, the Federal Reserve undertook two major efforts to improve the efficiency of check operations: (1) modernizing check operations by installing uniform software and hardware for check processing, imaging, and adjustments and (2) reducing the number of check processing sites to better align the Federal Reserve check-processing infrastructure with the evolving market. As of year-end 2005, a total of nineteen check-processing sites were consolidated, with an additional five sites planned to be consolidated by early 2007, reducing the number of sites from forty-five in 2003 to twenty-one.
-
-
-
-
-
Support Services After several years of dramatic decreases, costs for Reserve Bank support functions are budgeted to increase slightly ($9.3 million, or 1.2 percent) in 2006. The increase is due mainly to a $10.5 million increase in depreciation costs associated with completed security and building projects. These increases are offset partially by lower costs in other support areas. Since 2001, support costs have declined $90.8 million, or 10.1 percent, reflecting efforts to improve efficiencies in several support areas, including infor-
-

Federal Reserve Banks 23
mation technology, financial management, human resources, and business development. As has been the case in the last few years, staffing levels in the support functions will continue to decline; a 104 ANP decrease is projected in 2006.
-
-
In 2006, local information technology costs are budgeted to decrease by $5.2 million and 69 ANP as Banks continue to align services with their changing needs. Since 2001, local information technology costs have declined $62.2 million and staffing levels have declined 728 ANP, largely because of efficiencies gained by centralizing several functions and lower overall Bank staffing levels, which reduced demand for desktop services.
-
--
After several years of significant reductions, local human resource administrative costs are expected to decline slightly in 2006 ($1.3 million). Since 2001, costs in the human resource function have declined $14.2 million and staffing levels have declined by 246 ANP as the Banks move to more centralized functions. The reductions are a result of efficiencies gained through consolidations of PeopleSoft, payroll, and System medical plans, as well as outsourcing the responsibility for thrift and retirement plan administration to OEB.
--
-
--
-
2006 Personnel Expenses Budgeted officer and employee salaries and other personnel expenses total $1,810.9 million, which is 3.2 percent above the 2005 estimate. This total includes an increase of $58.3 million to fund salary administration programs for officers and employees.4 Reserve Bank merit pools are budgeted to increase by
3.7 percent for officers and 3.5 percent for employees, about the same as in 2005.
4. Salary administration represents the budgeted funds that are available to increase compensation to officers and employees in the upcoming year. It does not include adjustments for changes in staffing levels, turnover and lag in hiring, and overtime.
--
Variable-pay programs, which are budgeted to increase by $3.9 million, or 0.3 percent, account for 3.8 percent of 2006 salary expense. Of the increase, approximately 75 percent is related to incentive pay. The Reserve Banks’ salary administration programs continue to emphasize pay-for-performance in 2006.
-
-
The ANP at Reserve Banks, FRIT, and OEB is projected to decrease by 2,447 by 2006, primarily because of planned staff reductions associated with financial services restructuring. Turnover in 2006 is expected to be higher than in 2005, in large part as a result of continued consolidation in check and cash services.
-
Retirement and other benefit expenses, which account for 14.8 percent of 2006 Reserve Bank budgets, are anticipated to increase by approximately $18.0 million, or 4.6 percent. The primary driver of the increase is higher health care costs. Over the past several years, Reserve Banks have undertaken a number of initiatives to control the increase in health care costs, including increasing insurance deductibles and co-pays, replacing several local plans with national plans, consolidating prescription drug programs, and renegotiating administrative services contracts. In 2006, the Banks will continue to identify opportunities for controlling health care costs, such as implementing new wellness and disease-management programs that provide employees with information about healthy lifestyles and early detection of disease.
-
-
-
Risks in the 2006 Budget Risks to the 2006 budgets consistently cited by the Reserve Banks include the effect of material changes to check-restructuring schedules or plans, significant variances in check volume from budgeted assumptions, changes in the scope
--

24 Annual Report: Budget Review, 2006
or direction of the various Treasury projects, and possible additional cash infrastructure changes.
The check service continues to be an area in which Banks have identified a considerable amount of risk, primarily because of the number, scale, and dynamic nature of initiatives in the area. A total of four check-processing consolidations are planned for 2006. Check administrative functions are now handled from central locations, and the Reserve Banks have announced plans to further consolidate check-adjustment operations from twelve to five sites. Delays in the check-restructuring schedule could result in higher-than-budgeted personnel and facility costs. In addition, the budget would be affected by any unbudgeted write-offs as a result of restructuring. The Reserve Banks’ Retail Payments Office also cites a risk associated with increases in fuel costs.
-
-
Projected check volume reflects anticipated run-off at processing sites that have been consolidated at other locations and the increasing shift from paper-based to electronic payments. The combination of these two factors has resulted in a 2006 projected volume decrease of about 14 percent. If the decease in volume is not as great as planned, as several Banks experienced in 2005, the Banks would incur costs for higher-than-planned staff levels (which would be offset by the revenue associated with the increased volume).
-
-
As in the past, unforeseen requests from the Treasury or changes in scope and direction of projects would add costs and could require additional resources; however, the Reserve Banks are fully reimbursed for those costs by the Treasury. In the cash function, the infrastructure changes could increase costs at several Reserve Banks. If additional cash depot arrangements are approved, the affected offices could see an increase in personnel severance costs in 2006.
--
-
2006 Capital Plan The 2006 capital budget submitted by the Reserve Banks, FRIT, and OEB totals $474.2 million. As in previous years, the 2006 capital budget includes funding for projects that support the strategic direction outlined by the individual Reserve Bank and System plans. These strategies focus on improving operational efficiencies and services to Bank customers and providing a safe and quality work environment. In support of these strategies, the 2006 budget identifies seven major categories of capital outlays: building projects and facility improvements, security enhancements, automation and communication initiatives, payment system improvements, cash services initiatives, Treasury initiatives, and miscellaneous acquisitions.
-
-
-
--
The proposed capital budget includes $252.0 million for building-related projects and facility improvements and $64.2 million for security enhancements. Nearly $104.0 million of the capital budgeted for Reserve Bank facilities is for new building projects in Kansas City and Seattle.
-
The Reserve Banks and FRIT have included $73.0 million in funding for major automation and communication initiatives. These initiatives do not include the automation components of building or payment systems initiatives discussed separately. Of the total automation-related outlays, FRIT projects and acquisitions account for almost half, or $35.3 million.
-
Another $80.5 million in capital outlays is budgeted for payment systems, cash, and Treasury initiatives. Of this total, $50.2 million has been requested to fund Treasury initiatives, including $16.1 million for the TWAI project and $12.9 million for the electronic-government projects. �
-
-

Appendixes

Federal Reserve Budget Process 27
Appendix A
Federal Reserve Budget Processes
This appendix is an overview of the separate budgets and budgeting processes followed by the Board of Governors and the Reserve Banks. The purpose of this overview is to inform the reader of the data, assumptions, and initiatives considered when the Federal Reserve System budgets were developed and approved by the Board of Governors.
--
-
-
Board of Governors The Board’s budget covers a two-year period. Toward the end of the first year of the budget cycle—the even-numbered year—the strategic plan for the next four years is updated, and the second year is used to develop the budget for the next two years. The two-year cycle begins in the fall (thus, for the 2006–07 budget, in the fall of 2004). At that time, the Board’s divisions examine their operating environments and consider whether any adjustments to their mission, priorities, activities, and associated resources might improve the efficiency and effectiveness of the Board’s operations.
-
-
-
The management of each division discusses with the appropriate Board oversight committee the issues that arise in its review. After any adjustments, the division gives the results to the Staff Planning Group, a small group of senior managers with a Boardwide perspective, for use in their analysis of the Board’s budget options.
--
--
-
After consulting with a committee of governors—the Committee on Board Affairs—for final guidance, the Planning and Budget staff updates the strategic plan, one of several factors used to prepare a preliminary budget objective that identifies the resources needed to support
the plan. Individual division budget objectives are prepared on the basis of Boardwide priorities and planning assumptions. The Committee on Board Affairs reviews the plan and preliminary budget objective, clarifies outstanding planning issues with the Staff Planning Group and division directors, and at the end of summer in odd-numbered years submits the budget objective to the Board for its consideration.
-
The divisions use the budget objective approved by the Board to complete their budgeting under the approved plan. The Committee on Board Affairs, under authority delegated by the Chairman, oversees the process until the budget is submitted to the Board for action in the fall of the odd-numbered year. The budget memorandum is published on the Board’s public web site and becomes the primary source for this report and other similar documents.
-
The Board of Governors budgets its resources by division and accounts for its activities by division and across operational areas. Direct costs, such as those for salary, retirement, insurance, and travel, are billed to the operational areas. Costs for data processing are also charged as a direct expense to each of the areas according to service-level agreements (at prices derived from the cost of resources needed to provide the services and agreed upon before the budget year starts). Expenses for other elements of support and overhead are distributed among the operational areas in proportion to the share of direct costs attributable to each area.
-
The Board, in accordance with generally accepted accounting principles, capitalizes certain assets and depreciates their value over appropriate periods instead of
--
28 Annual Report: Budget Review, 2006
expensing them in their year of purchase. Hence, the Board has both an operations budget and a capital budget.
After the budget is approved by the Board, it is converted to an operating plan that allocates funding by month; the operating plan is also the vehicle for subsequent performance reports and adjustments within the budget. In January of each year, the cash requirement for the first half of the calendar year is estimated, and the cash is raised by an assessment on each of the Reserve Banks in proportion to its capital stock and surplus. The cash requirement for the second half of each year is estimated in June, and the second assessment is made in July.
--
-
Items of a unique, one-time nature are accounted for separately in the extraordinary items account so that expenses in operations can be readily compared across years without distortion. As discussed more fully in chapter 2, the extraordinary items portion of the budget for 2006–07 consists of funds to support planning for two periodic surveys, one on consumer finances and the other on small business finances.
-
-
--
The Board’s Office of Inspector General (OIG), in keeping with its statutory independence, prepares its proposed budget apart from the Board’s budget. The OIG presents its two-year budget directly to the Chairman for action by the Board, also in the fall.
-
-
Reserve Banks Each year, the Federal Reserve Banks establish major operating goals for the coming year, devise strategies to attain those goals, estimate required resources, and monitor results. The process begins with development of budget guidance by
the business leaders in each functional area. This information is used to develop a preliminary budget projection, the Reserve Bank budget outlook. Each Bank then develops its own budget using the business-leader guidance. The budgets are reviewed at the Board by the Committee on Federal Reserve Bank Affairs, both individually and in the context of Systemwide issues and the plans of the other Banks. The budgets are then presented to the full Board of Governors for final action in December.
-
-
The Banks’ budgets are structured in operational areas, with support and overhead charged to these areas.
-
As does the Board, the Banks, in accordance with generally accepted accounting principles, capitalize certain assets and depreciate their value over appropriate periods instead of expensing them in the year of purchase. Hence, the Banks have a capital budget in addition to an operating budget.
The Banks budget annually for capital outlays by capital class to estimate the effect of total operating and capital spending. During the budget year, the Banks must submit proposals for major purchases of assets to the Board for further review and approval.
-
-
The operations and financial performance of the Reserve Banks are monitored throughout the year via a cost-accounting system, the Planning and Control System (PACS). Under PACS, the costs of all Reserve Bank services, both priced and nonpriced, are grouped by operational area, and the costs of support and overhead are charged to these areas. PACS makes it possible to compare budgets with actual expenses and facilitates comparison of the financial and operating performances of the Reserve Banks.�
--
-
-
-

Priced Services 29
Appendix B
Priced Services
The Monetary Control Act of 1980 requires the Federal Reserve to charge depository institutions for certain services that the Federal Reserve had previously provided without explicit charge and only to member banks. As the act requires, the fees charged for providing these priced services are set to recover, over the long run, all direct and indirect costs of providing the services plus imputed costs, including the interest on items credited before actual collection (float), and the private-sector adjustment factor (PSAF). To calculate the PSAF, the Federal Reserve Banks impute the costs that would have been incurred, such as taxes that would have been paid, and the profits that would have been earned (return on equity) had the priced services been provided by a private business firm. Table B.1 provides details on projected revenue from priced services.
-
-
Annual Pricing Process To meet the requirement for the full recovery of costs over the long run, the
Federal Reserve has developed an annual pricing process that involves projecting Reserve Bank expenses, volumes, and revenues, as well as the PSAF and net income on clearing balances, for each major service category.
Table B.1
Revenue from Priced Services, 2004–2006 Millions of dollars
Service 2004 2005 (estimated)
2006 (budgeted)
Funds transfers and net settlement ....
Automated clearinghouse .....
Commercial checks ... Book-entry securities
transfers ............. Noncash collection ....
Total ..........................
57.1
75.1 760.1
20.4 1.9
914.6
64.9 69.3
84.6 86.8 788.2 734.4
22.1 1.2
Fees for Federal Reserve services must be approved by the product director for the respective service, by the Reserve Banks’ Financial Services Policy Committee, and ultimately by the Board of Governors.
-
1
The cost of float is projected by applying the federal funds rate to an estimate of the level of float to be generated in the coming year. Beginning in 2006, the PSAF targeted return on equity (ROE) capital is based on a simple capital asset pricing model using data from the equity market as a whole.
-
-
-
2 The ROE is applied to the level of priced-services equity that is imputed to finance the assets the Federal Reserve expects to use in providing priced services in the coming year. Estimates of income taxes are based on the tax rates derived using the financial data of the fifty largest U.S. bank holding companies.
The other components of the PSAF are derived from the budgets of the Reserve Banks and the Board: the imputed sales tax (based on budgeted outlays for materials, supplies, and capital); the imputed assessment for insurance by the Federal Deposit Insurance Corporation (based on expected clearing balances and
-
1. The product directors are the first vice presidents at selected Reserve Banks with responsibility for day-to-day policy guidance over specific services. The Financial Services Policy Committee (FSPC) is responsible for the overall direction of financial services for the Federal Reserve Banks.
--
-
2. Prior to 2006, the ROE was based on the average return on equity results of three economic models that used bank holding company data.
0.0
959.9 912.6
21.0
30 Annual Report: Budget Review, 2006
amounts deferred to depository institutions for items deposited for collection with the Reserve Banks); and the portion of the expenses of the Board of Governors directly related to providing priced services.
-
-
Investment income is imputed and netted with related direct costs associated with clearing balances to estimate net income on clearing balances. �
-

Currency Budget 31
Appendix C
Currency Budget
Federal Reserve Banks issue new and fit currency to the public through depository institutions and destroy currency already in circulation as it becomes unfit or when a new design is issued. Each year, under authority delegated by the Board, the director of the Division of Reserve Bank Operations and Payment Systems orders new currency from the U.S. Department of Treasury’s Bureau of Engraving and Printing (BEP). Upon reviewing the order, the BEP establishes billing rates for new currency, which the Board staff uses to prepare the annual budget for new currency. Once the Board approves the new currency budget, it assesses each Federal Reserve Bank through an accounting procedure similar to that used in assessing the Banks for the Board’s operating expenses.
Estimated currency expenditures for 2005 total $478.8 million, which is $54.1 million, or 10.2 percent, less than budgeted (table C.1). The underrun is due primarily to lower-than-expected printing costs, but also to lower transportation costs. Budgeted currency expenditures for 2006 total $494.4 million, which is $15.5 million, or 3.2 percent, more than estimated 2005 expenses (chart C.1). Increases in the overall BEP billing rates
are the primary drivers of the year-to-year budget increase.
-
Chart C.1 Federal Reserve Budget for New Currency, 1996–2006
NOTE: For 2005, estimated; for 2006, budgeted.
1996 1999 2002 2005
400
300
200
100
Millions of dollars
500
Printing of Federal Reserve Notes The Board ordered 8.5 billion new notes for the calendar year 2006 budget. The budget for printing the Board’s order is $471.2 million, or 95.3 percent of the total 2006 new currency budget. For January through September 2006 (the portion of the federal government’s 2006 fiscal year that falls within the 2006 calendar year), the BEP will produce 6.4 billion
-
Table C.1
Federal Reserve Budget for New Currency, 2005 and 2006 Thousands of dollars, except as noted
Item 2005 (estimated)
2006 (budgeted)
Percent change
Printing of new Federal Reserve notes ........................................................ Currency transportation ............................................................................... Counterfeit-deterrence research ................................................................... Reimbursement to the U.S. Treasury’s Office of Currency Standards .......
Total cost of currency ................................................................................
458,868 12,932
3,522 3,516
478,837
471,152 16,282
3,326 3,600
494,360
2.7 25.9 -5.6
2.4
3.2

Type of currency Number of
notes (millions)
Percentage oftotal notes
Cost perthousand notes
(dollars)
Total cost (thousands of
dollars)
Unthreaded ($1, $2) .................................
New Currency Design ($5S) ..................................................... ($100) ...................................................
Series-2004 ($10, $20, $50) .................... Average cost .............................................
Total .........................................................
4,833.3
860.5 775.8
1,983.1
8,452.7
57.2
10.2 9.1
23.5
100.0
42.97
57.27 70.10 80.58 55.74
207,686
49,280 54,386
159,800
471,152
32 Annual Report: Budget Review, 2006
Table C.2
Projected Federal Reserve Costs of Printing New Notes, by Type of Note, 2006
notes; for October through December 2006 (the remainder of the 2006 calendar year), it will produce another 2.1 billion notes.
--
The 2006 billing rates reflect four types of currency produced: unthreaded ($1s and $2s); New Currency Design (NCD) without color-shifting ink ($5s); NCD with color-shifting ink ($100s); and Series-2004 with new and enhanced security features, including color-shifting ink ($10s, $20s, and $50s) (table C.2).1
During 2006, 19.3 percent of the notes produced will be NCD notes, 23.5 percent will be Series-2004, and the remaining 57.2 percent will be unthreaded. The weighted average price that the Board will pay the BEP for producing notes in 2006 is $55.74 per thousand.
--
Currency Transportation The currency transportation budget consists of funds for shipping new currency from the BEP to the Reserve Banks and new and fit currency among the Reserve Banks. The 2006 currency transportation
budget is $16.3 million, which is $3.4 million, or 25.9 percent, more than the Board estimated for 2005. The 2006 budget for new currency shipments from the BEP is $12.5 million, which is 31.6 percent more than estimated 2005 expenses because of a reinstatement of postponed Series-2004 $10 note shipments, although expected growth in armored carrier costs also has some effect. The 2006 budget for currency shipments among Reserve Banks is $3.8 million, which is 10.3 percent more than estimated 2005 expenses. These shipments include moving currency from Reserve Bank offices with excess fit currency to offices that would otherwise require new currency from the BEP.
-
-
-
-
-
1. For NCD notes greater than the $5 denomination, the color of the ink shifts from green to black as the viewing angle of the note changes. For Series-2004 notes, the color shifts from copper to green.
-
-
Counterfeit-Deterrence Research The 2006 budget for the counterfeit-deterrence program is $3.3 million. The funds will support the Federal Reserve Board’s participation in the Central Bank Counterfeit Deterrence Group (formerly known as the SSG-2), which operates under the auspices of the G-10 central bank governors to combat digital counterfeiting, and membership to the Reprographic Research Center, a state-of-the-art adversarial testing facility to test bank note designs and counterfeit-deterrence features.
--

Currency Budget 33
Treasury’s Office of Currency Standards
The 2006 budget to reimburse the Treasury Department for expenses relating to its Office of Currency Standards (OCS) is $3.6 million. Because destroying unfit currency is a delegated function from the Treasury Department, the OCS develops Reserve Bank standards for the cancellation, destruction, and accountability of unfit currency and processes claims for the redemption of damaged or mutilated currency. �
-
-

Board Expenses and Employment
Division, office, or special account 2004–05 (budgeted)
2004–05 (estimated)
2006–07 (budgeted)
Average annualpercent change
2004–05 estimated
compared with2004–05 budgeted
2006–07 budgeted
compared with2004–05 budgeted
Board Members ..................................... Secretary ................................................ Staff Director for Management ............. Research and Statistics ......................... International Finance ............................. Monetary Affairs ................................... Banking Supervision and Regulation .... Consumer and Community Affairs ....... Legal ...................................................... Reserve Bank Operations
and Payment Systems1 .................. Information Technology ........................ Management .......................................... Special projects ..................................... Extraordinary items ............................... IRM income account2 ............................
Total, Board operations ......................
Office of Inspector General ..................
25,066 25,18811,521 11,602 16,105 16,25675,803 75,83028,163 28,54823,056 24,07084,382 84,07424,300 24,47823,846 23,846
38,100 38,29290,832 87,817
106,200 106,81220,504 19,598 10,000 10,000
(39,306) (38,602)
538,570 537,809
8,533 8,533
26,399 0.2 2.6 12,403 0.4 3.8 16,783 0.5 2.1 82,690 0.0 4.4 32,006 0.7 6.6 28,441 2.2 11.1 99,431 –0.2 8.6 29,515 0.4 10.2 26,083 0.0 4.6
51,357 0.3 16.1 91,155 –1.7 0.2
122,214 0.3 7.3 21,781 –2.2 3.1
9,000 0.0 –5.1 (39,784) –0.9 0.6
609,475 –0.1 6.4
10,237 0.0 9.5
1. Part of the increase is attributable to the transfer of 2. Income from various Board divisions for use of the Reserve Bank audit contract. central information resources management (IRM)
resources.
Thousands of dollars, except as noted
35
Appendix D
Expenses and Employment at the Board of Governors
Table D.1
Operating Expenses of the Board of Governors, by Division, Office, or Special Account, 2004–2007

Division, office, or special account 2004–05 (authorized)
2006–07 (budgeted) Change
Board Members ........................................................ Secretary ................................................................... Staff Director for Management ................................ Research and Statistics ............................................International Finance ................................................ Monetary Affairs ......................................................Banking Supervision and Regulation .......................Consumer and Community Affairs .......................... Legal .........................................................................Reserve Bank Operations
and Payment Systems ...................................... Information Technology1 ..........................................Management .............................................................
Concern2 ..........................................................
Subtotal ...............................................................
Reimbursable IT support1 ........................................
Total, Board operations .........................................
Office of Inspector General .....................................
7750 45
275116 74
25489
80
139 274427
31
1,931
27
1,958
31
78 5045
275 116 75
254 94 80
139 274 438
31
1,949
27
1,976
36
1 . . . . . . . . . . . .
1 . . .
5 . . .
. . . . . . 11
. . .
18
. . .
18
5
1. Positions in the Division of Information Technol- 2. Summer intern and youth positions handled by the ogy that provide support to the Federal Financial Institu- Management Division. tions Examination Council for processing data collected . . . Not applicable. under the Home Mortgage Disclosure Act and the Com-munity Reinvestment Act.
36 Annual Report: Budget Review, 2006
Table D.2
Positions Authorized at the Board of Governors, by Division, Office, or Special Account, 2004–2007

Account classification 2004–05 (budgeted)
2004–05 (estimated)
2006–07 (budgeted)
Average annualpercent change
2004–05 estimated
compared with2004–05 budgeted
2006–07 budgeted
compared with2004–05 budgeted
Personnel services Salaries .................................................. Retirement ............................................. Insurance ...............................................
Subtotal .............................................
Goods and services Travel ..................................................... Postage and shipping ............................ Telecommunications .............................. Printing and binding .............................. Publications ........................................... Stationery and supplies ......................... Software ................................................ Furniture and equipment ....................... Rentals ...................................................Books and subscriptions ....................... Utilities .................................................. Building repairs and alterations ............ Furniture repairs and maintenance ........ Contingency Processing Center
expenses ........................................ Contractual professional services ......... Tuition/registration, and membership
fees ................................................ Subsidies and contributions .................. Depreciation .......................................... All other .................................................
Subtotal .............................................
Total, Board operations ......................
Office of Inspector General ..................
331,65029,02628,605
389,281
13,8081,176
10,5762,9631,3812,292
14,5399,212
7482,0055,916 5,8613,569
89651,437
4,405 1,285
26,544(9,323)
149,289
528,570
8,533
329,353 30,633 29,004
388,989
13,599 1,176
10,576 2,963 1,381 2,292
14,651 8,838
748 2,0055,916
5,991 2,578
896 50,331
4,405 1,285
26,544 (7,354)
148,820
537,809
8,533
380,220 35,725 31,352
447,298
15,703 976
10,799 2,691 1,230 2,315
14,643 7,517 1,199 1,989 7,800 4,646 2,475
1,700 62,848
4,834 1,338
28,826 (11,353) 162,177
609,475
10,237
–0.3 7.1 2.7 10.9 0.7 4.7 0.0 7.2
–0.8 6.6 0.0 –8.9 0.0 1.1 0.0 –4.7 0.0 –5.6 0.0 0.5 0.4 0.4
–2.1 –9.7 0.0 26.6 0.0 –0.4 0.0 14.8 1.1 –11.0
–15.0 –16.7
. . . 37.8 –1.1 10.5
0.0 4.8 0.0 2.0 0.0 4.2
–11.2 10.3 –0.2 4.2
–0.1 6.4
0.0 9.5
NOTE: Components may not sum to totals and may not . . . Not applicable. yield percentages shown because of rounding.
Thousands of dollars, except as noted
Board Expenses and Employment 37
Table D.3
Operating Expenses of the Board of Governors, by Account Classification, 2004–2007

Bank Expenses and Employment
Thousands of dollars except as noted
District 2005 (budgeted)
2005 (estimated)
2006 (budgeted)
Percent change
2005 estimated compared with2005 budgeted
2006 budgetedcompared with2005 estimated
Boston ........................... New York ...................... Philadelphia ................... Cleveland ....................... Richmond ...................... Atlanta ........................... Chicago .......................... St. Louis ........................ Minneapolis ................... Kansas City ................... Dallas ............................. San Francisco ................
Total ..............................
155,553500,686128,516184,225192,960296,587254,035215,553144,866159,879170,815259,450
2,663,125
149,708 506,894 126,321 183,197 196,920 296,490 246,805 207,336 142,969 164,771 177,745 253,004
2,652,162
156,366 531,652 136,874 193,910 208,758
336,118 246,141 220,140 148,999 164,182 183,129 260,030
2,786,229
–3.8 4.4 1.2 4.9
–1.7 8.4 –0.6 5.8
2.1 6.0 0.0 13.4
–2.8 –0.3 –3.8 6.2 –1.3 4.2
3.1 –0.4 4.1 3.0
–2.5 2.8
–0.4 5.1
NOTE: Excludes capital outlays. Includes expenses Components may not sum to totals and may not yield budgeted by Federal Reserve Information Technology percentages shown because of rounding. (FRIT) and the System’s Office of Employee Benefits Operating expenses reflect all redistributions for sup-(OEB). port and allocations for overhead.
39
Appendix E
Expenses and Employment at the Federal Reserve Banks
Table E.1
Operating Expenses of the Federal Reserve Banks, by District, 2005 and 2006

Average number of personnel except as noted
District 2005 (budgeted)
2005 (estimated)
2006 (budgeted)
Amount change
2005 estimated compared with2005 budgeted
2006 budgetedcompared with2005 estimated
Boston ........................................ New York ................................... Philadelphia ................................ Cleveland .................................... Richmond ................................... Atlanta ........................................ Chicago ....................................... St. Louis ..................................... Minneapolis ................................ Kansas City ................................ Dallas .......................................... San Francisco .............................
Total, all Districts ....................
Federal Reserve Information Technology .........................
Office of Employee Benefits ......
Total ...........................................
1,0992,9471,110 1,5431,8322,0421,5771,1231,2981,4291,2431,924
19,168
759 40
19,967
1,055 2,9671,085
1,553 1,821 2,070 1,631 1,160 1,283 1,431 1,329 1,942
19,328
765 40
20,133
1,041 2,978 1,078 1,597 1,847 2,033 1,534 1,150 1,287 1,344 1,315 1,866
19,069
757 43
19,869
–43 –15 20 11
–25 –7 10 44
–11 25 28 –37 55 –98 37 –10
–15 4 1 –87
85 –14 18 –76
160 –259
6 –8 0 3
166 –264
The term average number of personnel (ANP) a full-time employee who starts work on July 1 counts as describes levels and changes in employment at the 0.5 ANP for that calendar year; two half-time employees Reserve Banks. ANP is the average number of employees who start on January 1 count as 1 ANP. in terms of full-time positions for the period. For instance,
Thousands of dollars except as noted
Operational area 2005 (budgeted)
2005 (estimated)
2006 (budgeted)
Percent change
2005 estimated compared with2005 budgeted
2006 budgetedcompared with2005 estimated
Monetary and economic policy ........ Services to U.S. Treasury and
other government agencies ....... Services to financial institutions
and the public ............................ Supervision and regulation ............... Fee-based services to financial
institutions .................................
Total ..................................................
291,841
403,619
672,802519,391
775,471
2,663,125
296,908
379,186
679,397519,407
777,264
2,652,162
322,242
409,546
708,310 550,446
795,755
2,786,299
1.7 8.5
–6.1 8.0
1.0 4.3 0.0 6.0
0.2 2.4
–0.4 5.1
40 Annual Report: Budget Review, 2006
Table E.2
Employment at the Federal Reserve Banks, by District, and at FRIT and OEB, 2005 and 2006
Table E.3
Operating Expenses of the Federal Reserve Banks, FRIT, and OEB, by Operational Area, 2005 and 2006

Average number of personnel except as noted
Operational area 2005 (budgeted)
2005 (estimated)
2006 (budgeted)
Amount change
2005 estimated compared with2005 budgeted
2006 budgetedcompared with2005 estimated
Monetary and economic policy ........Services to U.S. Treasury and
other government agencies ....... Services to financial institutions
and the public ............................ Supervision and regulation ............... Fee-based services to financial
institutions .................................Support and overhead .......................
Total ..................................................
878
1,303
2,7992,592
3,114 9,281
19,967
883
1,295
2,729 2,561
3,328 9,335
20,133
935
1,304
2,728 2,663
2,987 9,251
19,869
5 51
–8 9
–70 –1 –31 101
214 –341 54 –84
166 –264
Thousands of dollars except as noted
District 2005 (budgeted)
2005 (estimated)
2006 (budgeted)
Percent change
2005 estimated compared with2005 budgeted
2006 budgetedcompared with2005 estimated
Boston ............................................... New York .......................................... Philadelphia ....................................... Cleveland ........................................... Richmond .......................................... Atlanta ............................................... Chicago .............................................. St. Louis ............................................ Minneapolis ....................................... Kansas City ....................................... Dallas ................................................. San Francisco ....................................
Total, all Districts ............................
Federal Reserve Information Technology ....................................
Office of Employee Benefits .............
Total ..................................................
73,556 253,289
61,471 76,787
103,836 113,637 102,867
63,743 67,802 82,993 66,624
129,304
1,195,911
60,438 3,970
1,260,318
70,421 250,761
59,866 76,950
102,194 117,083 102,010
64,328 66,467 82,239 69,642
126,955
1,188,916
61,128 4,043
1,254,087
73,635 265,953
63,052 81,744
109,312 119,577 101,491
67,926 69,385 82,895 73,160
130,591
1,238,721
63,745 4,520
1,306,985
–4.3 4.6 –1.0 6.1 –2.6 5.3
0.2 6.2 –1.6 7.0
3.0 2.1 –0.8 –0.5
0.9 5.6 –2.0 4.4 –0.9 0.8
4.5 5.1 –1.8 2.9
–0.6 4.2
1.1 4.3 1.8 11.8
–0.5 4.2
Bank Expenses and Employment 41
Table E.4
Employment at the Federal Reserve Banks, FRIT, and OEB, by Operational Area, 2005 and 2006
Table E.5
Expenses of the Federal Reserve Banks for Salaries of Officers and Employees, by District, 2005 and 2006

Thousands of dollars except as noted
District 2005 (budgeted)
2005 (estimated)
2006 (budgeted)
Percent change
2005 estimated compared with2005 budgeted
2006 budgetedcompared with2005 estimated
Boston ............................................... New York .......................................... Philadelphia ....................................... Cleveland ........................................... Richmond .......................................... Atlanta ............................................... Chicago .............................................. St. Louis ............................................ Minneapolis ....................................... Kansas City ....................................... Dallas ................................................. San Francisco ....................................
Total, all Districts ...........................
Federal Reserve Information Technology ................................
Office of Employee Benefits .............
Total ..................................................
22,130 33,676 24,843 52.2 –26.2 59,454 48,588 69,737 –18.3 43.5 10,225 12,489 20,966 22.1 67.9 34,592 31,610 28,157 –8.6 –10.9 41,249 29,444 58,623 –28.6 99.1
9,521 10,815 17,335 13.6 60.3 71,651 97,524 20,841 36.1 –78.6 25,472 31,910 42,743 25.3 33.9
5,192 4,047 4,782 –22.1 18.2 28,339 34,430 74,738 21.5 117.1 33,113 40,989 9,874 23.8 –75.9 38,547 26,331 49,753 –31.7 89.0
379,484 401,852 422,392 5.9 5.1
51,010 39,278 51,771 –23.0 31.8 . . . 160 . . . . . . . . .
430,494 441,290 474,163 2.5 7.4
. . . Not applicable.
Thousands of dollars except as noted
Category 2005 (budgeted)
2005 (estimated)
2006 (budgeted)
Percent change
2005 estimated compared with2005 budgeted
2006 budgetedcompared with2005 estimated
Building-related projects and facility improvements ............................
Security enhancements ...................... Information technology ..................... Payment system improvement
initiatives ................................... Miscellaneous1 ..................................
Total ..................................................
245,245 251,762 252,029 2.7 0.1 35,431 30,959 64,156 –12.6 107.2 61,704 72,603 72,966 17.7 0.5
83,516 80,387 80,538 –3.7 0.2 4,599 5,578 4,472 21.3 –19.8
430,494 441,290 474,163 2.5 –7.4
1. Includes other equipment purchases.
42 Annual Report: Budget Review, 2006
Table E.6
Capital Outlays of the Federal Reserve Banks, by District, and of FRIT and OEB, 2005 and 2006
Table E.7
Capital Outlays of the Federal Reserve Banks, FRIT, and OEB, by Category, 2005 and 2006

Maps of the Federal Reserve System

CHICAGO
K CANSAS ITY
HAWAII
ALASKA
MINNEAPOLIS
DALLAS
S FAN RANCISCO
S LT. OUIS
CLEVELAND
RICHMOND
ATLANTA
PHILADELPHIA
N YEW ORK
BOSTON
10 12
11
9
8 6
7
1 2
3
5
4
44 Annual Report: Budget Review, 2006
The Federal Reserve System
LEGEND
Both pages
Federal Reserve Bank city
Board of Governors of the Federal Reserve System, Washington, DC
NOTE
The Federal Reserve officially identifies Districts by number and Reserve Bank city (shown on both pages) and by letter (shown on the facing page).
In the 12th District, the Seattle Branch serves Alaska and the San Francisco Bank serves Hawaii.
The System serves commonwealths and territories as follows: the New York
Bank serves the Commonwealth of Puerto Rico and the U.S. Virgin Islands; the San Francisco Bank serves American Samoa, Guam, and the Commonwealth of the Northern Mariana Islands. The maps show the boundaries within the System as of year-end 2005.
-
Facing page
• Federal Reserve Branch city
— Branch boundary

Maps of the Federal Reserve System 45
NH
MA
RI
ME
VT
CT
1−A
BOSTON
CT
NY
NY NJ
2−B
N YEW ORK
Buffalo
NJPA
DE
3−C
PHILADELPHIA
PA
OH
WV
KY
4−D
CLEVELAND
Cincinnati
Pittsburgh 5−E
RICHMOND
MD
WV
VA
NC
SC
Charlotte
Baltimore
New Orleans
Miami
GA
AL
FL
MS
TN
LA
6−F
ATLANTA
Birmingham
Jacksonville
Nashville
IN
WI MI
IA
IL
7−G
CHICAGO
Detroit
AR
MO
IL IN
MS
KY
TN
8−H
S LT. OUIS
Little Rock
Louisville
Memphis
ND
MT
SD WI
MN
MI
9−I
MINNEAPOLIS
Helena
NM
CO
WY
NE
MO KS
OK
10−J
K CANSAS ITY
Omaha
Denver
Oklahoma City
TX
LA
NM
11−K
San Antonio
HoustonEl Paso
DALLAS
ID
CA
OR
NV
AZ
WA
UT
HAWAII
ALASKA
12−L
Seattle
Portland
Los Angeles
Salt Lake City
SAN FRANCISCO

0406