Ar 2013
60
SHAPING LIVEABLE CITIES ANNUAL REPORT 2013
description
Â
Transcript of Ar 2013

shaping liveablecities
annual report 2013

CEO interview 3
RESULTS Profile 6 Key statistics 7 Directors’ Report 8
ACTIVITIES Cities for people 16 Transport is key for prosperity 24 Smart energy systems for cities 28
FINANCIAL STATUS Accounting policies 33 Financial statements 38 Notes 42 Management’s statement on the Annual Report 54 Independent Auditor’s Report 55 Board of Directors 56 Executive Board 57 Group Directors’ Forum 58
Read the report online here: www.ramboll.com/AR2013
Cover: Illustration of the proposed transformation of one of Copenhagen’s three inner city lakes into a rain park to safeguard Copenhagen against heavy cloudbursts. Visualisation: ramboll, atelier Dreiseitl – part of ramboll.
ramboll is a leading engineering, design and consultancy company founded in Denmark in 1945. today, we employ more than 10,000 experts and we constantly strive to achieve inspiring and exacting solutions that make a genuine difference to our customers, end-users and society as a whole. ramboll has a significant presence in northern europe, India and the Middle east. With close to 200 offices in 21 countries, we emphasise local experience combined with a global knowledge base. www.ramboll.com

3annual report 2013
all in all, 2013 has been a busy, demanding and in many respects an exciting year for ramboll. through the dedicated effort of our more than 10,000 employees, we managed to win major new projects, and continue growing, while making good progress towards achieving our 2016 strategy goals.
“Overall, I would say that 2013 was a challenging year, characterised by increasing competition and ongoing effects of the financial crisis. Nevertheless, with an organic growth rate of close to 4%, Ramboll has continued to grow above the GDP growth of the markets we operate in,” says Ramboll CEO Jens-Peter Saul.
The Group operating profit (EBITA) margin was 5.0%. This is a decrease of 0.4%, mainly as a result of fewer working days and increased investments into our internal improvement program.The underlying operating profit (EBITA) margin, however, improved by 0.4% despite heavy write-downs on a small number of large-scale projects, especially in the Middle East.
“The majority of our business is very healthy and has effectively improved its performance. A fact which is also evidenced by the extremely strong cash performance of our company in 2013,” explains Jens-Peter Saul.
Ramboll achieved a cash conversion at 129%, which is the highest level in ten years.
The revenue from our market areas Energy and Environment increased by 34%. Oil & Gas experienced a slight decrease due to the expiry of a major framework contract.
Strong market positionIn 2013, Ramboll managed to defend its home markets from international competition, so even though some markets have been characterised by economic
RaMping Up investMents
“the majority of our business is very healthy and has effectively improved its performance. a fact which is also evidenced by the extremely strong cash performance of our company in 2013.”
downturn and decreasing public and private investments leading to fierce price competition, Ramboll has managed to grow. This growth was particularly supported by strong organic growth in Energy, in Management Consulting, but also in our country business units such as Denmark and the UK.
“In total, the Ramboll Group has grown with approx. 400 people this year,” he elaborates. “And we have also seen a good financial performance even in difficult markets such as in Finland, which has further improved profit, despite restructuring efforts needed as a response to continuing effects of the financial crisis.”
Strategic investments in future competitiveness2013 was the first full year of Ramboll’s ‘Stronger Together’ strategy, with five elements at its core: profitability, growth, internationalisation, competitiveness and portfolio.
“By and large, we have made good progress on the implementation of the strategy,” says Jens-Peter Saul. “First and foremost, we have ramped up our investments and

4 InterVIeW WIth group Ceo
progressed well in our internal improvement programme ‘Competitive Platform’, which is aimed at lifting performance and competitiveness,” says Jens-Peter Saul and continues: “This includes large spends on common systems such as a new Group ERP system, improved internal processes, and not least investments in our employees and our Global Engineering Centre in India.”
With these investments and those to come in 2014 and 2015, Jens-Peter Saul is confident that the company is able to move further towards the ambitious 2016 targets.
“With a total cost of DKK 60 million, these additional investments into the future have affected the 2013 EBITA performance of the Group. But it was a conscious choice to make these investments even though we knew that it would result in a lower Group performance.” Jens-Peter Saul concludes.
Focusing on creating sustainable societies“Every day we find innovative solutions to the challenges posed by the global megatrends of demographic changes, urbanisation, climate change, environmental problems, resource scarcity and globalisation. Today, Ramboll has a strong
profile as a company that helps societies develop sustainably and make our cities become not only more sustainable but more liveable,” Jens-Peter Saul explains. “It is precisely in these areas that we benefit from having the unique combination of both our engineering competence as well as the socio-economic know-how of our management consulting business,” he adds.
As a further testament to world-class technical expertise, Ramboll was awarded for the geotechnical consultancy work on the Fehmarn Fixed Link project at the International Tunnelling Awards 2013, which recognises innovation and excellence in site investigation, surveying and monitoring on tunnelling projects.
Expanding international reachFurthermore, increased internationalisation and a strengthened portfolio are key goals in the strategy. A number of new companies have joined Ramboll during 2013, expanding both company competences and geographical reach:“For example, we have expanded into new regions by establishing a new presence in the US, Singapore and Beijing through targeted acquisitions

5annual report 2013
“every day we find innovative solutions to the challenges posed by the global megatrends of demographic changes, urbanisation, climate change, environmental problems, resource scarcity and globalisation. today, ramboll has a strong profile as a company that helps societies develop sustainably and make our cities become not only more sustainable but more liveable.”
within Oil & Gas and Environment. These acquisitions have also added to the diversity of our portfolio,” he explains.
Focused efforts in selected areasA formal ‘New Markets’ business unit has been formed during 2013. This unit encompasses Ramboll’s operations in the Middle East, India and the newly acquired Atelier Dreiseitl; an international consultancy with a presence in southern Germany, Singapore and Beijing.
“With a strong leadership team in place, we are confident that we can ensure future profitability and focused growth outside of our Nordic home markets,” Jens-Peter Saul concludes.
In addition, our portfolio was re-aligned through the closing down of the unprofitable tower production unit, while integrating the profitable tower engineering and field service business into our units within Energy and India.
“We also accomplished a successful turnaround of our business in the UK, with a new leadership and structure. This has converted it into a profitable
business unit with excellent market reputation and a solid organic growth of 13% in 2013,” Jens-Peter Saul says.
An exciting year to comeJens-Peter Saul expects to see a moderate improvement of the economy in general, and is as such more optimistic over 2014 for Ramboll. In the coming year, the investment effort in the competitive platform will continue. Acquisitions to increase internationalisation and strengthen the portfolio will also remain a focus area:
“We will continue our search for a new, large-scale acquisition, especially in the areas of Environment, Energy and Natural Resources with a focus on Northern America, in order to better balance our service portfolio and further improve our footprint in our target markets.”
He rounds off by saying: “We are confident that all of the major and minor improvements and investments of the last year and the next two years will result in better services for our customers, as well as more interesting jobs for our employees. Altogether, this will create a stronger Ramboll now and in future.”

6
eBIta, DKK MIllIon
profit before tax (left axis) rolling annual profit before tax (right axis)
pRofile
Ramboll is a leading engineering, design and consultancy company founded in Denmark in 1945. We employ more than 10,000 experts and have a significant presence in Northern Europe, India and the Middle East. With close to 200 offices in 21 countries, we emphasise local experience combined with a global knowledge base. We constantly strive to achieve inspiring and exacting solutions that make a genuine difference to our customers, end-users and society as a whole. Ramboll works across the Markets: Buildings, Transport, Environment, Energy, Oil & Gas and Management Consulting.
OwnershipThe Ramboll Foundation is the main owner of Ramboll Group A/S and its main objective is to promote the company’s continuance alongside the long-term development of the company, its employees and the communitiesit serves. All shares in Ramboll Group A/S are owned either by the Ramboll Foundation (97%) or by employees in Ramboll (3%).
VisionRamboll is committed to helping create inspirational and long-standing solutions that allow people and nature to flourish.
0 0
90 240
30 80
120 320
60 160
150
180
400
480
2009 Q
3
2010
Q2
2011
Q2
2010
Q4
2011
Q4
2009 Q
2
2010
Q1
2009 Q
1
2009 Q
4
2010
Q3
2011
Q3
2011
Q1
2012
Q1
2012
Q3
2012
Q2
2012
Q4
2013
Q1
2013
Q2
2013
Q3
2013
Q4
results profIle anD Key statIstICs

7annual report 2013
Key figures and financial ratios 2013 2013 2012 2011 2010 2009
Income statement, DKK million EUR m
Revenue 1,044.8 7,794.1 7,552.5 6,891.2 6,074.9 5,510.6 EBITA 52.3 389.9 405.6 356.0 393.7 320.4 Operating profit (EBIT) 38.5 287.2 290.3 312.4 296.7 236.6 Profit before tax 33.8 252.3 277.1 294.7 275.9 212.6 Profit for the year 19.1 142.8 168.5 204.1 174.7 124.7
Balance sheet, DKK millionTotal assets 575.0 4,289.5 4,268.4 3,749.5 3,619.6 3,077.3 Shareholders' equity 227.9 1,699.8 1,676.3 1,493.7 1,320.6 1,070.8 Net interest bearing cash / (debt) 79.1 590.0 372.2 270.9 187.4 108.1
Cash flow, DKK millionCash flow from operating activities 62.1 463.2 253.5 332.0 332.0 232.7 Investment in tangible assets, net (14.0) (104.4) (91.4) (95.7) (175.7) (45.5)Free cash flow 48.1 358.8 162.1 236.3 156.3 187.2 Acquisition of companies (15.4) (114.9) (51.6) (202.6) (81.2) (31.8)
employeesNumber of employees, end of year 10,161 9,759 9,521 8,970 8,758 Number of full time employee equivalents 9,593 9,125 8,718 8,229 8,141
financial ratios in %Revenue growth 3.2 9.6 13.4 10.2 (2.3)Organic growth 3.7 8.3 8.2 3.1 (0.9)EBITA margin 5.0 5.4 5.2 6.5 5.8 Operating margin (EBIT margin) 3.7 3.8 4.5 4.9 4.3 Return on invested capital (ROIC) 17.8 18.4 19.6 27.7 25.6 Return on equity (ROE) 8.5 10.6 14.5 14.6 12.5 Cash conversion ratio 129.3 75.1 86.5 94.9 107.6 Equity ratio (solvency ratio) 39.6 39.3 39.8 36.5 34.8
non-financial indicators
Average age of employees 38.3 39.6 39.6 39.7 39.2 Average age of management 45.3 44.7 44.7 45.0 44.9 Proportion of management who is female, % 17 15 14 15 17 Public sector revenue, % 42 41 42 41 45 Private sector revenue, % 58 59 58 59 55
The figures in EUR have been translated from DKK using an exchange rate of 7.46.
key statistics

8 results DIreCtors’ report
DiRectoRs’ RepoRtafter a weak start to the year, performance gradually increased. ramboll ended the year with strong cash conversion of 129%, solid organic growth of 4% and a healthy eBIta margin of 5.0%.
Considering the effect of fewer working days than last year and an increase in spending on our corporate change programme ’Competitive platform’, this effectively shows that the operational business units have been able to further strengthen performance compared with last year.
this solid performance is the result of the dedicated efforts of our employees and fruitful collaboration with our many customers and partners.
taking it fURtheR
Throughout our operations, focus has remained on strengthening our customer relations to secure the continuous intake of small and large orders, the mobility of our workforce, the efficiency of operations, and cooperation across our units. In order to stay competitive, we have had a diligent focus on costs, but at the same time invested significantly in an internal reform programme to improve performance and competitiveness called ‘Competitive Platform’.
Customer focusDuring the year, we have continued focusing on understanding our customers’ needs, on building and leveraging stronger customer relationships, and on our ability to meet changing local and global market demands.
A group-wide Project Management model has been introduced throughout Ramboll. In this way, customers benefit from consistent project delivery excellence,
innovative solutions, and access to the very best specialist expertise. Furthermore, it is a cornerstone in realising Ramboll’s ‘Stronger Together’ strategy, and essential in ensuring project profitability and reducing project write-downs.
Our focus on providing excellent consultancy to our customers was strengthened with the implementation of a global accounts programme in 2013, as well as with the establishment of key account programmes in several business units.
To obtain a better understanding of our customers’ needs, we ask our customers how satisfied they have been with Ramboll’s work. Our global customer satisfaction survey enables Ramboll to gain valuable feedback from our customers.During 2013, we measured customer satisfaction on 3,819 projects or services on a scale from 1 to 5 (2,905 projects or services in 2012). The overall customer satisfaction level was 4.26, which was slightly higher than in 2012 (4.24). We experienced
reVenue By MarKet share of total*, DKK MIllIon
bUILdINgS
33% 25% 14%
TRANSpORT ENVIRONmENT
2013
2012 2,661
* towers (discontinued) 2%
2,609 2013
2012
2013
2012
1,119
903 1,943
1,962

9annual report 2013
an improvement in ‘Ramboll’s ability to deliver on schedule’ (up from 4.14 to 4.18), while also seeing improvements in the remaining parameters surveyed in particular ‘understanding our customers’ needs’. The highest score was given to ‘Ramboll’s ability to cooperate’ (4.48).
project winsMajor new wins in 2013 include:
In Denmark, Ramboll and project partners, C. F. Møller and Alectia have been chosen as lead consultants for the expansion of Køge Hospital. The new EUR 0.5 billion university hospital will expand the floor area threefold to a total of 177,000 m2.
Ramboll has also won the detailed signalling design for a new 23.5 km double-track rail system in Norway, from the city of Larvik to Porsgrunn. This contract win is important for our strategic position in the Norwegian rail market, as similar projects are expected in the near future.
In the UK, Transport for London (TfL) appointed Ramboll and Parsons Brinckerhoff to develop designs for reconstruction and refurbishment work on several TfL bridges, flyovers, retaining walls and tunnels during the coming years.
Within the Energy area, Ramboll has been engaged by a major European power company to carry
1 2 3 4 5
Negative Neutral Positive
Results based on customer satisfaction survey responses between January 2013 and December 2013.
Ramboll's ability to cooperate
Likelihood of contacting Ramboll for future projects
The competences of the people involved
Ramboll's ability to understand your needs
Satisfaction with Ramboll as a whole in connection with the project
Ramboll's ability to deliver on schedule
Ramboll’s ability to go beyond expectations
CustoMer satIsfaCtIon surVey
the overall customer satisfaction level was 4.26 (on a scale from 1 to 5), which was slightly higher than last year.
10% 10% 6%
ENERgy OIL & gAS mANAgEmENT CONSULTINg
2013
2012
765
611
2013
2012
740
796
2013
2012
490
411
out a technical and economic feasibility study, examining the conversion from coal to biomass firing of a number of major UK power plant units, with a view to increasing the supply of low carbon power to the UK market.
Furthermore, our Oil & Gas business has been selected by Statoil for a major pipeline project. We will be undertaking detailed engineering of the pipeline for the Gina Krog field development - a task which comprises five sub-projects, and runs until 2017. Revised strategy2013 was the first full year with our revised strategy, ‘Stronger Together’.

10 results DIreCtors’ report
472
165
307
net profit
required return on Invested Capital
economic profit
2012 2013
434
194
240
eConoMIC Value CreatIon, DKK MIllIon
We have an ambition to become the leading ‘Sustainable Society Consultant’. We aim to achieve this by building on and strengthening our strong technical and socio-economic competencies in developing sustainable solutions for the future.
It is also our ambition to be ‘the undisputed market leader in the Nordics and widely recognised in the global arena’. While we have ambitious growth expectations, it is our target not simply to grow in size, but to become stronger, better balanced in terms of portfolio and international setup, and to improve our profitability significantly.
The five focus areas of profitability, growth, internationalisation, competitiveness and portfolio are at the core of our strategy, which is centred on four interlinked and reinforcing elements:
1. Strengthening and further developing our leading position in our home markets.
2. Strengthening our portfolio within Natural Resources, Energy and Environment. We aim to increase the share of revenue
from these services from today’s 24% to 50% by the end of 2016.
3. Expanding into regions that value what we offer. We aim to increase the international share of revenue outside the Nordics from today’s 18% to 50% by the end of 2016.
4. Developing and marketing ‘One Company’ offerings within sustainable cities, society building and sustainable natural resources focused on the Arctic region.
Investments in the futureA wealth of initiatives has been and remains to be launched to support the goals in the strategy.
We have invested significantly in making internal improvements to increase cooperation, efficiency and synergies across the company. We continued the launch of our common Group Enterprise Resource Planning (ERP) system in 2013, with our units in Sweden and Norway, Oil & Gas in the Middle East and Management Consulting in Germany joining our Danish and Finnish units on the common ERP platform. During 2014, the rollout will continue with the launch in newly acquired companies in Germany and Romania, and in
our Global Engineering Centre in India. In early 2015, our business in the UK will join.
We also continued to focus heavily on people excellence. In addition to strengthening succession planning across Ramboll, a global process for dialogue between managers and employees has been introduced and carried out during 2013. The introduction of the annual dialogue cycle ensures that all managers and employees provide mutual feedback on performance and development, based on individual goals and development plans.
Furthermore, we introduced our ‘Horizon Programme’, which is dedicated to developing and retaining Ramboll’s ‘high potential’ employees. The main aims are to develop leaders, project managers and specialists from across the organisation who demonstrate extraordinary growth potential and strong business understanding.
We also continued to invest in our Global Engineering Centre in India. This will help keep Ramboll strong as a company, it will make us more competitive in the global marketplace and it will enable us to attract more interesting projects in all parts of Ramboll.
AcquisitionsThrough a total of eleven acquisitions in 2013, we have strengthened our knowledge base by adding around 270 new, highly skilled employees to our workforce.
In the first quarter, Ramboll acquired a 12 people strong company in Finland, Vinnea Oy, providing project management services within infrastructure and adding new railway competences.
In April, Ramboll acquired Atelier Dreiseitl, an international consultancy and thought leader in urban water projects with a presence in southern Germany, Singapore and Beijing, with 63 employees. The acquisition strengthens Ramboll’s position within Liveable Cities. With its presence in emerging markets, it paves the way for growth

11annual report 2013
options for a wider range of services in the region.
Also in April, Ramboll acquired Witraz, a Danish architectural company with 28 employees, specialising in refurbishment of buildings.
In May, Ramboll acquired The Performance Group in Norway. The 17 new employees with expertise in strategy implementation have strengthened our Management Consulting business in Norway.
In October, Ramboll acquired Excel Engineering, a US engineering consultancy within the oil and gas industry based in Houston, Texas. The acquisition has added 50 highly specialised employees to our business and enables us to service existing and new customers in one of the most important oil and gas regions in the world.
In November, Ramboll acquired the engineering consultancy Blom Romania, which has built a strong market position within water and waste water in Romania. The acquisition of the 60 people strong company strengthens our position within urban water services and creates a solid platform for further expansion in Eastern Europe. The acquisition of Blom Romania is subject to anti-trust authority approval.
Also in November, we strengthened our presence in the Northern part of Norway by acquiring ÅF’s activities in Bodø with 25 people working within buildings.
In addition, a number of smaller acquisitions were made. In Denmark, we acquired WestSoft within the transport area. In Norway, we acquired Sivilingeniør Tore Mathisen AS and in Finland, we acquired Fortum oil laboratory services and Symo Oy.
divestmentsDuring 2013, we have discontinued the unprofitable parts of our Towers business and integrated the profitable engineering and design capabilities into our Danish and Indian businesses.
financial DevelopMentRevenue increased by 3% from DKK 7,552 million in 2012 to DKK 7,794 million. The decrease of the reporting currency DKK against foreign currencies (NOK, GBP, AED and INR in particular), affected the revenue negatively by 2%, i.e. excluding currency effect revenue increased by 5%.
Organic growth was 4%, which was primarily attributable to strong organic growth in the UK, Middle East, Denmark and Norway and in our international business units within Energy and Management Consulting, and only partly offset by negative organic growth in Oil & Gas. The negative growth in our Oil & Gas Business unit was caused by a large framework contract which ended in 2013.
Net growth from acquisitions and divestments was 1%.
Operating profit before goodwill amortisation (EBITA) was DKK 390 million compared to DKK 406 million in 2012, giving an EBITA margin of 5.0% compared to 5.4% in 2012.
Fewer working days in Norway and Sweden compared to 2012 had a negative impact on EBITA margin of 0.4%. Consequently, on a like-for-like comparison, the Group EBITA margin was on same level as in 2012.
In 2013, we have also expensed approximately DKK 60 million (2012: DKK 45 million) related to our competitive platform initiatives, and unexpectedly we had to expense DKK 14 million related to final ruling on an old arbitration case.
Considering these effects, the EBITA margin increased by 0.4% compared to last year.
Net other operating income/(costs) amounted to DKK 4 million (2012: DKK -4 million). Other operating income, totalling DKK 4 million, was mainly related to reversal of warranty accruals made in prior years.
Goodwill amortisation decreased by 4% to DKK 107 million compared to DKK 112 million in 2012.
Net financial expenses were DKK 35 million compared to net financial expenses of DKK 13 million in 2012. The net financial expenses were primarily related to interest rate hedging, net foreign exchange losses and interest on arbitration case.
Profit before tax decreased by 9% to DKK 252 million compared to DKK 277 million in 2012.
Tax on profit was DKK 109 million (2012: DKK 109 million). The effective tax rate was 30.5% (2012: 29.5%) calculated as Tax on profit divided by Profit before tax adjusted for Goodwill amortisation,
0
6
2
-2
8
4
reVenue groWth, %
organic growth acquisition growth, net foreign exchange adjustment
2011
8.2
3.9
1.4
8.3
3.7
-1.0
1.0
2.4
-1.5
2012 2013
eBIta MargIn, %
2
8
4
0
10
6
2011 2012 2013
5.05.2 5.4
12 results DIreCtors’ report
Cash ConVersIon ratIo
100
2011 2012 2013
75
129
87
Other operating income (gain on divestments) and Income from associates. The effective tax rate is impacted by the fact that tax losses in the Middle East have not been capitalised as a deferred tax asset.
Net profit was DKK 143
million compared to DKK 168 million in 2012.
The result was satisfactory given the difficult market situation and the investments made in improving our competitive platform.
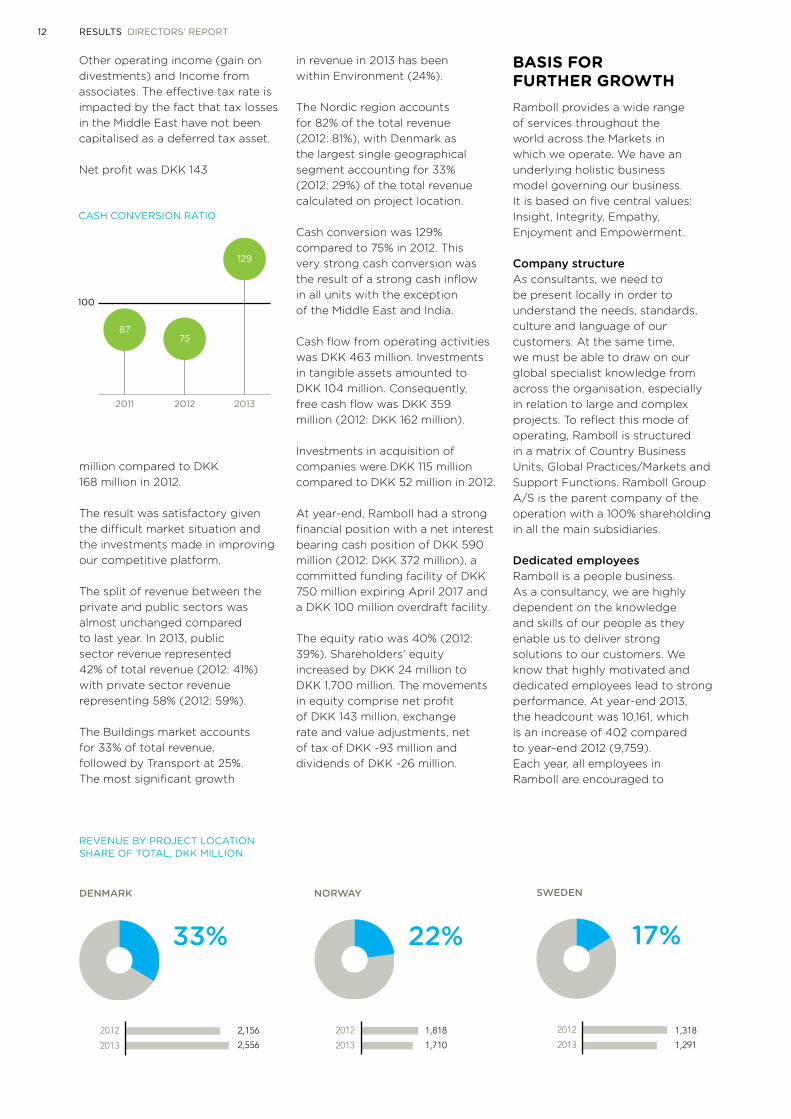
The split of revenue between the private and public sectors was almost unchanged compared to last year. In 2013, public sector revenue represented 42% of total revenue (2012: 41%) with private sector revenue representing 58% (2012: 59%).
The Buildings market accounts for 33% of total revenue, followed by Transport at 25%. The most significant growth
reVenue By projeCt loCatIon share of total, DKK MIllIon
dENmARK
33%
2013
2012 2,156
2,556
SwEdEN
17%
2013
2012
NORwAy
22%
2013
2012
1,710
in revenue in 2013 has been within Environment (24%). The Nordic region accounts for 82% of the total revenue (2012: 81%), with Denmark as the largest single geographical segment accounting for 33% (2012: 29%) of the total revenue calculated on project location.
Cash conversion was 129% compared to 75% in 2012. This very strong cash conversion was the result of a strong cash inflow in all units with the exception of the Middle East and India.
Cash flow from operating activities was DKK 463 million. Investments in tangible assets amounted to DKK 104 million. Consequently, free cash flow was DKK 359 million (2012: DKK 162 million).
Investments in acquisition of companies were DKK 115 million compared to DKK 52 million in 2012.
At year-end, Ramboll had a strong financial position with a net interest bearing cash position of DKK 590 million (2012: DKK 372 million), a committed funding facility of DKK 750 million expiring April 2017 and a DKK 100 million overdraft facility.
The equity ratio was 40% (2012: 39%). Shareholders’ equity increased by DKK 24 million to DKK 1,700 million. The movements in equity comprise net profit of DKK 143 million, exchange rate and value adjustments, net of tax of DKK -93 million and dividends of DKK -26 million.
basis foR fURtheR gRoWthRamboll provides a wide range of services throughout the world across the Markets in which we operate. We have an underlying holistic business model governing our business. It is based on five central values: Insight, Integrity, Empathy, Enjoyment and Empowerment.
Company structureAs consultants, we need to be present locally in order to understand the needs, standards, culture and language of our customers. At the same time, we must be able to draw on our global specialist knowledge from across the organisation, especially in relation to large and complex projects. To reflect this mode of operating, Ramboll is structured in a matrix of Country Business Units, Global Practices/Markets and Support Functions. Ramboll Group A/S is the parent company of the operation with a 100% shareholding in all the main subsidiaries.
dedicated employeesRamboll is a people business. As a consultancy, we are highly dependent on the knowledge and skills of our people as they enable us to deliver strong solutions to our customers. We know that highly motivated and dedicated employees lead to strong performance. At year-end 2013, the headcount was 10,161, which is an increase of 402 compared to year-end 2012 (9,759).Each year, all employees in Ramboll are encouraged to
1,318
1,291
1,818

13annual report 2013
participate in the Employee Satisfaction and Engagement Survey (ESES). The results of the survey are used to gather insight on creating engagement among our employees and how we can increase their level of engagement.
A record number of employees completed the ESES questionnaire in 2013 (88%). It was also the fifth consecutive year in which the response rate increased.
The overall result shows a satisfaction and engagement index of 3.94 on a 5-point scale, which is a slight improvement from last year’s 3.91. Among the highlights of this year’s result: 600 more employees are satisfied with their job compared to last year, and most units see an improved score on the questions related to their Immediate Manager.
Strong market positionIn several of our home markets, we continued to see high scores for Ramboll in industry and image rankings also in 2013, as well as some prestigious award wins.
Nordic engineering students have again this year ranked Ramboll as the second most attractive employer in the Nordic region in the Universum survey ‘Nordic’s Most Attractive Employers’. The Universum Student Survey is based on input from over 47,900 students at top academic institutions in Sweden, Denmark, Norway and Finland.
In the rankings published by ENR (Engineering News Record),
a record number of employees completed the employee survey in 2013. the overall result for ramboll shows a satisfaction and engagement index of 3.94 on a 5 point scale.
response rate, % (left axis) employee satisfaction and engagement index (right axis)
eMployee surVey
50
80
60
90
100
70
3.4
4.0
3.6
4.2
4.4
3.8
20092008 2010 2011 2012 2013
FINLANd UK REST OF wORLd
10% 6% 12%
2013
2012 770
803 2013
2012 565
498 2013
2012 926
936
Ramboll maintained its position as 24th in the Top 225 International Design Firms list that ranks companies according to the revenue generated outside their home market. In the category of Top 150 Global Design Firms, which includes home market revenue, we advanced from 29th to 28th. Furthermore, Ramboll maintains a top 5 position in Europe by revenue.
distribution of profitIn Ramboll, our economic value creation is shared between our employees (distributed by way of annual bonuses) and our shareholders (distributed by
way of either a dividend or as a reinvestment in the company’s further development).
Our Economic Profit of DKK 240 million (2012: DKK 307 million) was distributed as DKK 129 million (2012: DKK 145 million) in bonuses to our employees and the remaining DKK 111 million to the shareholders (2012: DKK 162 million), of which DKK 26 million (2012: DKK 26 million) was distributed to the shareholders in the form of dividends.

14 results DIreCtors’ report
raMBoll Co2 eMIssIons froM energy use anD WorK-relateD transport
35% 27% 20% 11% 7% 0%% of total C02 emission.
reporting period 1 july 2012 to 30 june 2013.
air Carelectricity heatingpublic
transport ferry
coRpoRate ResponsibilityRamboll acts responsibly towards people, the environment, and the economy. We conduct business based on trust, transparency, integrity, professionalism and dialogue. We take responsibility for our impacts on society, acknowledge our obligation to act, and use our sphere of influence.
Our corporate responsibility is based on our values, legacy and international principles. Ramboll adheres to the UN Global Compact Principles and we incorporate respect for human and labour rights, the environment and anti-corruption throughout our policies and operations, and we communicate on progress.
Human rights Ramboll is committed to respect human rights. We realise that the contexts in which we operate will influence how we address adverse impacts. Based on an assessment of gaps between Ramboll’s policies and procedures and the United Nations Guiding Principles on Business and Human Rights (UNGP), we identified that our policy on human rights did not cover all aspects of the UNGP. Therefore, a new policy commitment was prepared in 2013. The policy commitment was informed by relevant internal and external expertise and stipulates Ramboll’s expectations
of employees, business partners and other parties.
In 2013, we also conducted a health and safety gap analysis workshop to establish a unified view of Ramboll’s health and safety risks and mitigation measures. Based on this, recommendations were made to take health and safety further. Also, extended travel, security and medical advice were made available for employees travelling to high risk countries.
Labour rights In Ramboll, we respect the right to non-discrimination and therefore support the principle of equal representation of gender in boards and management positions and we acknowledge the need for diversity and high professional competence criteria. In 2013, we introduced a new equal gender policy, with the target for the Board of Directors in Ramboll Group A/S, that each gender is represented with two members elected at the general meeting at one of the forthcoming general meetings. Furthermore, the purpose of the policy is to ensure that each gender is proportionally represented in management positions by a number reflecting the actual proportion of each gender in the industry in general (2013: approximately 30% female and 70% male).A way to ensure equal opportunities when making appointments to new management positions - provided that the
31% 69%
gender distribution in total 2013.
appointed candidate fulfils the requirements of seniority and competence for the position in question - is to include the target 30% female and 70% male in our high potential employee identification and development process. Currently the distribution is 22% female versus 78% male for identified high potentials. In 2013, Merete Helene Eldrup joined the Ramboll Group Board of Directors and thereby the Board is closer to fulfilling its target.
Environment For the third year we measured our worldwide CO2 emissions caused by our own energy use and work-related transport for approx. 10,000 employees. Based on learning from previous years, we are improving the quality of the data collection. We also achieve more accurate results as we make increasing use of national emission factors where possible, instead of

15annual report 2013
using IEA international average standards. All Principal Business Units show an improvement in their data collection and calculation methods and more than half of our units also show a decrease in their CO2 emissions.
In 2013, we measured Ramboll’s total CO2 emission to 19,748 tonnes (2012: 20,043) equal to 2.11 tonnes per Full Time Employee Equivalent (FTEE) (2012: 2.17). Despite an increase in employees of 5%, we managed to decrease our total emissions as well as the emission per employee.
The CO2 emission caused by energy use (electricity and heating) was 0.80 tonnes per FTEE (2012: 0.81) which is a slight decrease mainly caused by a decrease in electricity use. This is especially the result of our continuous focus on optimising office space and centralising office facilities. The CO2 emission caused by work-related transport was 1.32 tonnes per FTEE (2012: 1.36), which is also a decrease and is satisfactory, especially as we are becoming more international. A Group environmental policy was developed to create a unified approach to reducing impact on the environment and climate. Furthermore, we established a best practice method for data collection and calculation of CO2 emissions from rental cars in 2013.
Anti-corruption Ramboll’s wish to combat any form of corruption and bribery and a tightening regulatory
framework require effective assessment, mitigation, prevention and monitoring processes. Based on the learning from a company-wide corruption risk assessment and review, we have in 2013 prioritised measures ensuring that we have adequate procedures in place and addressing areas that present the greatest challenges. These findings have been fed into the development of the Ramboll Group Compliance Programme.
CR reportingAccording to the Danish Financial Statements Act § 99A, Ramboll discloses its corporate responsibility policies, actions and results in a ‘Communication on Progress’ report under the United Nations Global Compact. For further information on this report, please see the UN website: www.unglobalcompact.org/participant/7863-Ramboll-Group or the Ramboll website: www.ramboll.com/CRreport2013
Subsequent eventsWith the exception of events described in this Annual Report, Ramboll is not aware of events subsequent to 31 December 2013 that are expected to have a material impact on Ramboll’s financial position.
Executive boardRamboll’s Group Executive Board consists of a Group CEO and three other Group Executives, each responsible for one of the three dimensions in our operating model: Markets/Global Practices, Country Business
Units and Support Functions. See page 57 for a presentation of the Group Executive Board.
board of directorsRamboll’s Group Board of Directors is composed of professionals with a broad mix of experience. At an extraordinary general assembly on 26 September 2013, Merete Helene Eldrup joined the Board with immediate effect. See page 56 for a presentation of the Board members.
dividendThe Group Board of Directors proposes a dividend of DKK 26,250 thousand, equivalent to the dividend distributed last year.
A dividend of DKK 26,250 thousand corresponds to 75% of the nominal share value, 18% of net profit and 7% of free cash flow for the year.
looking to the fUtUReThe overall market situation for Ramboll in 2014 is expected to continue to be challenging, however, with a slightly positive trend. With the strategic initiatives and actions taken during 2013, we do see ourselves as being prepared for the tough market conditions and find Ramboll in a good position to deal with these challenges. Consequently, operating profit before goodwill amortisation is expected to improve from 2013, despite the fact that we plan to invest even more in our competitive platform initiatives in 2014 than we did in 2013.
In line with Ramboll’s deeply rooted business approach, Ramboll is signatory to the UN Global Compact. We report Ramboll’s CR efforts separately under the UN Global Compact in a “Communication on Progress” report.
www.unglobalcompact.org/participant/7863-ramboll-group and www.ramboll.com/Crreport2013

16 aCtIVItIes CItIes for people
cities foR people
Cities around the world are aspiring to enhance their liveability. The City of Copenhagen is investing massively in improving liveability for its citizens.

17annual report 2013
half of the world’s inhabitants – 3.6 billion people – live in urban areas. Cities are the leading source of global economic growth, resource consumption and carbon gas emissions. urban superpower in the 21st century is all about human capital. But how do cities attract the right people? liveability is part of the answer.
half of the world’s inhabitants – 3.6 billion people – live in urban areas. Cities are the leading source of global economic growth, resource consumption and carbon gas emissions. urban superpower in the 21st century is all about human capital. But how do cities attract the right people? liveability is part of the answer.

18 aCtIVItIes CItIes for people
The global number of urbanites is the highest in history and growing fast. This prognosis calls for urgent planning and design solutions to create cities that are liveable –today and for posterity. This means putting the human dimension at the core.
Enhancing liveabilityOne example of this approach is Copenhagen, Denmark, which has been rated as the most liveable city in the world by Monocle, an international lifestyle magazine, and has been named the European Green Capital 2014 by the European Union.
The City of Copenhagen is investing massively in improving schools, street safety and public transport, the last by expanding the metro system and building better bike lanes. Green and clean are the catchwords, and the vision is that Copenhageners and visitors should be able to swim in the harbour and enjoy a wealth of parks and recreational areas.
Over the years, Ramboll has played a central role in the overall city planning of Copenhagen as well as in vital projects within Buildings, Transport, Environment and Energy which have all contributed to raising city liveability. Examples of projects include the city metro system, the Danish national opera house, large urban development projects such as Nordhavn and Ørestad,
top image: herbert Dreiseitl, Director of the ramboll liveable Cities lab. above: henrik rosenberg seiding, ramboll group Director for sustainable society. Below: Bishan-ang Mo Kio park in singapore. Image: atelier Dreiseitl – part of ramboll.
the city district heating system, cloud burst mitigation plans, and strategies for Copenhagen to become a CO2-neutral capital.
And Copenhagen is not alone. Cities around the world are aspiring to enhance their liveability. According to Herbert Dreiseitl, Director of the Liveable Cities Lab at Ramboll, success in this endeavour requires a long, conscious effort. Since 1980 he has specialised in integrating art, urban hydrology, environmental engineering and landscape architecture in an urban context.
Long-term visions drive city-wide change“After years of ideological discussions on sustainability, smart technology and resource management, we need a wider perspective to be more creative and holistic in urban planning. Topics like natural resources, connectivity, well-being and proactive policy development are essential conditions for ensuring liveability in cities and settlements, but they often require a change in mindset,” he says, drawing on his own experience working with some of the world’s megacities – London, Berlin, Singapore and Beijing.
“Liveability varies, depending on regional and cultural differences. We can’t formulate a uniform definition, but cities can nudge people to change their mindset and behaviour patterns. In Singapore,
each year, lifestyle magazine Monocle releases a top-25 list of most liveable cities. Important criteria are safety/crime, international connectivity, climate, public transportation and urban design.
the world’s most liveable cities 20131. copenhagen2. Melbourne3. helsinki4. tokyo5. vienna

30%70%
30%
1945 2008 2050
70%
50%
50%
pERCENTAgE OF wORLd pOpULATION LIVINg IN URbAN ANd RURAL AREAS
19annual report 2013
“It is a top priority for me to ensure that Copenhagen continues to be a city for everybody. With this in mind, we are working hard to create new jobs, to increase liveability and to make improvements in the everyday lives of Copenhagen families.”Frank Jensen, Lord Mayor, City of Copenhagen
for instance, most men want a fast car if they can get it. This amounts to more pollution and most likely a lack of exercise. If people were culturally raised to believe that success meant having time to bike to work every day, many urban challenges would be eliminated. City planners can be catalysts for such a change of mindset, through long-term visions and strategic planning,” he explains.
A new Ramboll research study on sustainable society development shows that a holistic and integrated approach to economic, social, environmental and spatial development is the key to ensuring the greatest success.
An integrated approachHenrik Rosenberg Seiding, Group Director for Sustainable Society at Ramboll, explains: “In our work with liveable cities development in areas as diverse as the Middle East, Europe and the Arctic, we have identified the driving forces of modern society development: social coherence, economic growth, environmental sustainability and good governance. Through our research study, we have established an analytical framework that has shown its relevance throughout the world when we give strategic advice to city planners and executives. Whatever the size and geography of the city, the fundamental dynamics are universal. The difficult task is to integrate universal dilemmas and local solutions while respecting culture, tradition and endowments.”
The defining driving forcesSuccessful urban development occurs when these driving forces reinforce each other and allow people and society to develop prosperously. Ultimately, however, the goal is singular:
“In all its complexity, city development is about people. Human capital is, after all, a city’s main asset,” he says.
19
urbanrural
Data source: United Nations.

20 aCtIVItIes CItIes for people
cReating MoDeRn aRab citiesBetween 1970 and 2010, urban populations in the Arab region have more than quadrupled. In many cities, the resulting water scarcity and large pollution problems are now affecting the environment and the quality of life of citizens.
Saudi Arabia has realised the urgency of tackling urban challenges, and authorities have selected the city of Jeddah as the focus of a large-scale effort to make the city more liveable for its 3.5 million inhabitants. This demonstration project will provide a blueprint for other Saudi cities to follow.
planning for a better futureRamboll has been hired to create the master plan that will ensure the future sustainable development of the 4,600 km2 city of Jeddah. The project, initiated in the late summer of 2012 and finalised at the end of 2013, involved expertise from 15 different disciplines, such as air, water, and waste. Ramboll assessed and evaluated countless environmental and social factors over the course of the project, and drew up a master plan describing the most efficient ways of dealing with them. The following four high priority
areas were identified: air quality, water, waste and green spaces.
Neel Strøbæk, Group Market Director of Environment explains: “Ramboll has valuable experience from the Nordics and from assisting European states when preparing them for entrance into the European Union. We are building on this experience when we deal with the challenges in the Arab region. The basic problems are the same.”
The cost of inactionShe continues: “In order to create awareness and as a baseline for future improvements, we have also calculated the cost of doing nothing. This so-called ‘cost of environmental degradation’ study shows that the cost of no-action will reach a staggering 2-4% of total GDP in Jeddah, a total of EUR 1-2 billion annually.”
Neel Strøbæk explains further: “Using this figure as a basis, we can demonstrate that it is wise to invest in environmental improvement and also show the urgency of taking action. By combining the baseline with cost-benefit analyses of the initiatives we are proposing, the authorities can prioritise main action areas.”
Seeing the resultsAwareness raising and outreach are also essential to project success. Ramboll has recommended using a combination of traditional awareness campaigns and introducing pilot demonstration areas to show the impact of the proposed initiatives.
According to Neel Strøbæk, taking the idea from plan to action is imperative: “One thing is to prepare a master plan, another thing is to ensure its successful implementation. In Ramboll, we want to see the Jeddah plans succeed in real life, and experience their ultimate effect on the city, nature and inhabitants. We are therefore committed to ensuring that Jeddah will become a more sustainable and liveable city for citizens, businesses and visitors.”
top image: ramboll has created the master plan to help authorities make the the saudi arabian city of jeddah more liveable for its 3.5 million inhabitants.above: neel strøbæk, ramboll group Market Director of environment.
Consensus oriented Accountable
GOODGOVERNANCE
TransparentParticipatory
ResponsiveFollows the rule of law
E�ective and e�cient
Equitable and inclusive
21annual report 2013
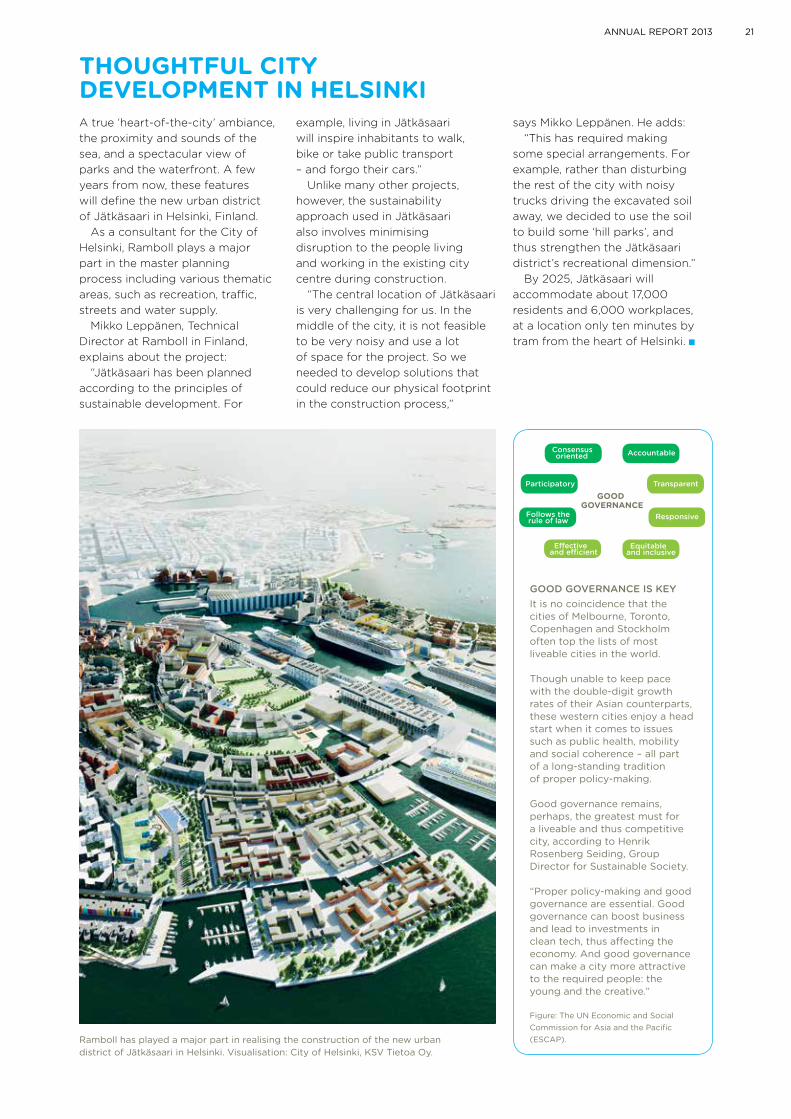
thoUghtfUl city DevelopMent in helsinki A true ‘heart-of-the-city’ ambiance, the proximity and sounds of the sea, and a spectacular view of parks and the waterfront. A few years from now, these features will define the new urban district of Jätkäsaari in Helsinki, Finland.
As a consultant for the City of Helsinki, Ramboll plays a major part in the master planning process including various thematic areas, such as recreation, traffic, streets and water supply.
Mikko Leppänen, Technical Director at Ramboll in Finland, explains about the project:
“Jätkäsaari has been planned according to the principles of sustainable development. For
gOOd gOVERNANCE IS KEyIt is no coincidence that the cities of Melbourne, toronto, Copenhagen and stockholm often top the lists of most liveable cities in the world. though unable to keep pace with the double-digit growth rates of their asian counterparts, these western cities enjoy a head start when it comes to issues such as public health, mobility and social coherence – all part of a long-standing tradition of proper policy-making. good governance remains, perhaps, the greatest must for a liveable and thus competitive city, according to henrik rosenberg seiding, group Director for sustainable society. “proper policy-making and good governance are essential. good governance can boost business and lead to investments in clean tech, thus affecting the economy. and good governance can make a city more attractive to the required people: the young and the creative.”
example, living in Jätkäsaari will inspire inhabitants to walk, bike or take public transport – and forgo their cars.”
Unlike many other projects, however, the sustainability approach used in Jätkäsaari also involves minimising disruption to the people living and working in the existing city centre during construction.
“The central location of Jätkäsaari is very challenging for us. In the middle of the city, it is not feasible to be very noisy and use a lot of space for the project. So we needed to develop solutions that could reduce our physical footprint in the construction process,”
says Mikko Leppänen. He adds:“This has required making
some special arrangements. For example, rather than disturbing the rest of the city with noisy trucks driving the excavated soil away, we decided to use the soil to build some ‘hill parks’, and thus strengthen the Jätkäsaari district’s recreational dimension.”
By 2025, Jätkäsaari will accommodate about 17,000 residents and 6,000 workplaces, at a location only ten minutes by tram from the heart of Helsinki.
ramboll has played a major part in realising the construction of the new urban district of jätkäsaari in helsinki. Visualisation: City of helsinki, KsV tietoa oy.
figure: the un economic and social Commission for asia and the pacific (esCap).

FIVE dRIVINg FORCESthe five driving forces that drive urban competitiveness: economy, society, urban planning, environment and good governance.
22 aCtIVItIes CItIes for people
a lanDMaRk bUilDing foR aRtCities use distinctive buildings and attractions to draw people into the city and add new dimensions and experiences for the people visiting them. In Oslo, the Norwegian national planning authority, Statsbygg, is planning to create a new National Museum of Art, Architecture and Design, which will gather the national collections of visual art in one central location.
The new building is to increase annual visitor numbers from 500,000 to 750,000, and also has ambitious sustainability targets. The goal is to create a visually striking building that emits less than 50% of CO2 compared with current practice.
Ramboll is providing full engineering consultancy for the project. Through our design and by applying building information modelling (BIM), we are seeking to realise the architectural visions while achieving the ambitious sustainability targets, reducing construction costs, maximising the use of space for tenants, as well as considerably reducing building and operating costs.
the new national Museum of art, architecture and Design combines architectural ambitions and high sustainability targets. ramboll provides full engineering consultancy for the project. Visualisation: Kleihues+schuwerk, gesellschaft von architecten mbh, MIr Kommunikasjon and statsbygg.
bATTLE OF THE CITIES around the globe, cities are competing to become the most competitive, most liveable, most dynamic city of them all.
this is not merely a branding showdown, but a serious contest driven by globalisation, a state of affairs that testifies to the cities’ emergence as a dominant force for innovation and growth. “nation states and cities are competing against each other to attract talent, jobs and growth. Cities are at once both each other’s best friends and their worst enemies. as a city, if you can find a way to balance your strengths, your force of attraction will put you right in the sweet spot of this global race,” says henrik rosenberg seiding, group Director for sustainable society.
a city’s competitiveness no longer comes down to a single strongpoint or a few specific factors, such as economic power.
ramboll has identified five forces that drive urban competitiveness: economy, society, urban planning, environment and, lastly, good governance. take london. More than a decade ago, this financial epicentre of the twentieth century realised that a city’s economic growth goes hand-in-hand with its ability to attract talent. as a result, central london has since done its utmost to make the city an attractive place in which to live and work. achieving this goal means taking initiatives like putting pedestrians first, cars second.
ECONOMY
URBANPLANNING
SOCIETY
ENVIRONMENT
GOVERNANCE
23annual report 2013
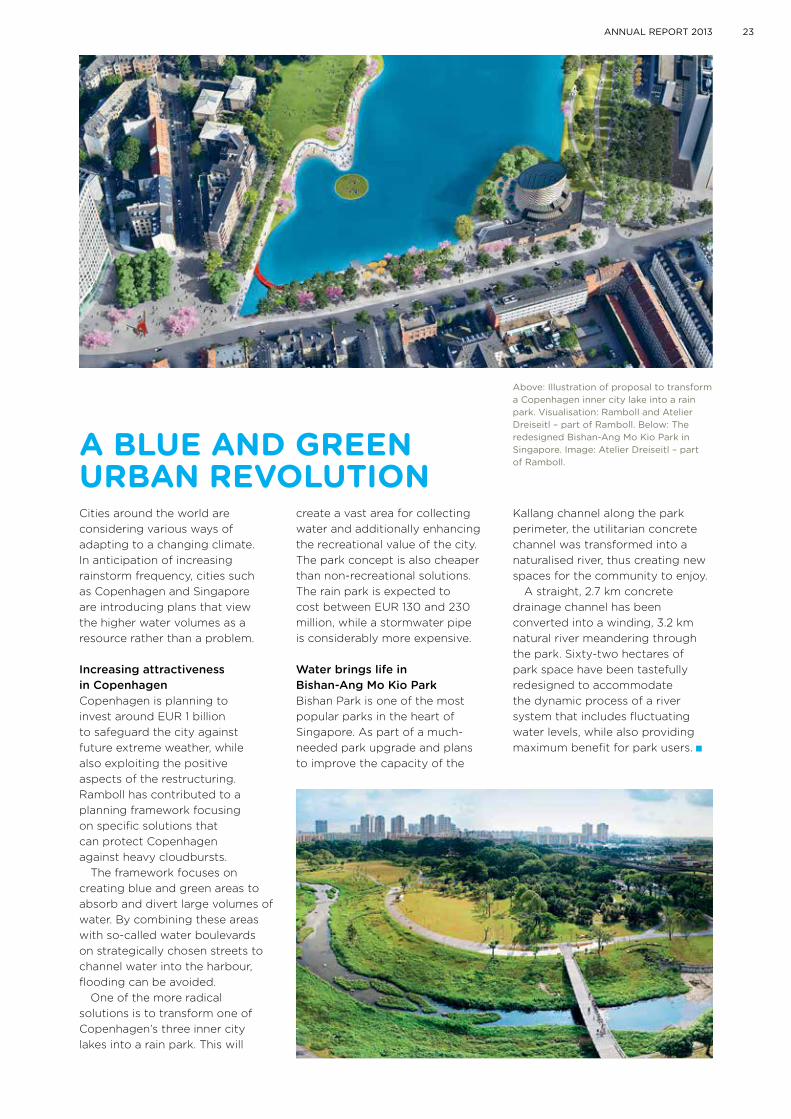
a blUe anD gReen URban RevolUtionCities around the world are considering various ways of adapting to a changing climate. In anticipation of increasing rainstorm frequency, cities such as Copenhagen and Singapore are introducing plans that view the higher water volumes as a resource rather than a problem.
Increasing attractiveness in Copenhagen Copenhagen is planning to invest around EUR 1 billion to safeguard the city against future extreme weather, while also exploiting the positive aspects of the restructuring. Ramboll has contributed to a planning framework focusing on specific solutions that can protect Copenhagen against heavy cloudbursts.
The framework focuses on creating blue and green areas to absorb and divert large volumes of water. By combining these areas with so-called water boulevards on strategically chosen streets to channel water into the harbour, flooding can be avoided.
One of the more radical solutions is to transform one of Copenhagen’s three inner city lakes into a rain park. This will
create a vast area for collecting water and additionally enhancing the recreational value of the city. The park concept is also cheaper than non-recreational solutions. The rain park is expected to cost between EUR 130 and 230 million, while a stormwater pipe is considerably more expensive. water brings life in bishan-Ang mo Kio parkBishan Park is one of the most popular parks in the heart of Singapore. As part of a much-needed park upgrade and plans to improve the capacity of the
above: Illustration of proposal to transform a Copenhagen inner city lake into a rain park. Visualisation: ramboll and atelier Dreiseitl – part of ramboll. Below: the redesigned Bishan-ang Mo Kio park in singapore. Image: atelier Dreiseitl – part of ramboll.
Kallang channel along the park perimeter, the utilitarian concrete channel was transformed into a naturalised river, thus creating new spaces for the community to enjoy.
A straight, 2.7 km concrete drainage channel has been converted into a winding, 3.2 km natural river meandering through the park. Sixty-two hectares of park space have been tastefully redesigned to accommodate the dynamic process of a river system that includes fluctuating water levels, while also providing maximum benefit for park users.

24 aCtIVItIes transport Is Key for prosperIty
Congestion and inadequate public transport are familiar problems in modern cities, where population growth leads to clogged roads and new urban areas poorly linked to the city centre and vital facilities.
Europeans are grappling with long hours of waiting on the roads. According to the international TomTom Traffic Index 2013 (Asia not included because of insufficient data), four of the most congested cities are European: Moscow, Russia in first place; Istanbul, Turkey second; Warsaw, Poland fourth; and Palermo, Italy fifth.
Transport affects liveability and economyLong hours sitting in traffic and failure to get to school or work on time are the most direct consequences of gridlock, but poor infrastructure will eventually have much broader effects on our cities and impede positive development:
“Our transport systems influence most aspects of community life. They are the means for moving people, goods and services around our cities and regions, and play a significant role in shaping growth patterns, facilitating economic prosperity and influencing the
tRanspoRt is key foR pRospeRity
character and liveability of our communities,” explains Alan Pauling, Group Market Director of Transport at Ramboll, continuing:
“If people have trouble getting where they want to go, our cities will lose resourceful people, suburbs become isolated and life and community quality reduced. The result can be extremely painful – not only economically, but also socially and environmentally. Public transport, cycling and walking, provide great local community benefits.”
A need for holistic traffic planningThe future infrastructure challenges that our cities will face are difficult to forecast, as is the extent of population growth or the city area that will undergo the greatest expansion. Despite these uncertainties, however, it pays to create thorough long-term traffic plans and to take into account all aspects of urban life and transport solutions.
Alan Pauling rounds off by saying:“It is important to think about
people and why they need to move, and then think about the mode. We have to see cars as a secondary priority.
We need roads, but providing cities with other alternatives is more sustainable, healthier and creates a more liveable city than expanding roads does.”
according to the tomtom traffic Index, these are the five cities that experienced the sharpest increases in travel times between non-congested periods and peak periods. Cities in asia are not included in the index due to insufficient data.
source: the tomtom traffic Index 2013.
above: alan pauling, ramboll group Market Director of transport. to the right: the Copenhagen metro represents an important public transportation link in the city. far right: the City of london increasingly focuses on promoting public transport, cycling and walking.
the five most traffic-congested cities in 2013 1. Moscow, Russia2. istanbul, turkey3. Rio de Janeiro, brazil4. Warsaw, poland5. palermo, italy

tRanspoRt is key foR pRospeRity
In the course of a year, big-city commuters can easily spend the equivalent of an entire working week stuck in traffic. Inefficient infrastructure makes urban areas less liveable and can even hold back economies. long-term transport planning is the key to eliminating gridlock.
25annual report 2013

26 aCtIVItIes transport Is Key for prosperIty
above: Map of the West link rail project, to be constructed beneath the city, will facilitate a denser city centre in gothenburg. Below: for the railway yard in helsinki, ramboll prepared a feasibility study for the future layout and operations.
Liseberg Station
Gothenburg C Station
Korsvägen Station
HagaStation
Station locationNew railway above groundNew railway below groundExisting railwayTunnel
tyinggothenbURgcloseRtogetheR Gothenburg, Sweden, is a sprawling city mainly connected by roads, creating a less liveable city in itself. The fact that the myriad roads and motorways can be difficult to cross has a dividing effect on the city – quite the opposite of what people and companies want.
“The West Link rail project, to be completed in 2028, is not only important in meeting the demand for effective and reliable transport in Gothenburg, but also indispensable to the overall goal of a denser city centre created by investing in public transport, rather than roads and parking facilities,” explains Niclas Sundgren, Director for Civil & Structural Engineering at Ramboll in Sweden.
Ramboll is taking on the traffic planning during construction, and is, together with Sweco, in charge of all disciplines for the railroad tunnel and the underground Haga Station.
iMpRoving RailWay tRaffic in helsinki Finland’s busiest and most important railway yard in the capital of Helsinki needs more capacity and a more flexible track layout. In a feasibility study for the Finnish Transport Agency, Ramboll used unique indicator-derived evaluation tools to plan the layout and operations of the city’s future railway traffic, including rail capacity, adherence to schedule, and traffic functionality within the railway yard.

27annual report 2013
keeping lonDon Moving
above: air passenger numbers could grow by 60% on 2005 levels by 2050. source: Committee on Climate Change. Below: arial photo of heathrow airport.
To ensure a well-functioning public transportation system for London’s more than 13 million inhabitants and millions of tourists each year, Ramboll works for Transport for London (TfL) on various infrastructure projects.
To maintain the mega-city’s position as one of the most important aviation hubs in Europe, there is strong pressure to expand the airport capacity, either with additional runways in the existing airports or a completely new mega airport. In a partnership with Oxford Economics, Ramboll has conducted a high-profile study of the socio-economic impact of a new hub airport, comprising technical engineering, aviation insights and management consultancy.
The study will provide important evidence to London’s Mayor in dealing with the Davis Commission - a governmental body that will advise British Government on the preferred solution and location of the future London airport.
Furthermore, Ramboll and Parsons Brinckerhoff are developing designs for reconstruction and refurbishment of a number of important TfL structures, bridges and tunnels during the next few years. This innovative work, ensuring London’s roads remain fully operational for future years, is part of TfL’s broader GBP 3.8 billion investment into the capital’s road network over the next decade.

28 aCtIVItIes sMart energy systeM s for CItIes
as more and more people move to urban areas, energy needs increase, so the quest is on to find the most efficient, environmentally friendly and cost-effective means of producing energy. luckily, the answer lies in the urban structure itself.

29annual report 2013
sMaRt eneRgy systeMs foR cities
left: the greater Copenhagen area is connected to a vast district heating network. above: anders Dyrelund, ramboll senior Market Manager within energy.right: avedøre power station, one of the facilities connected to the Copenhagen district heating network.
In cities, people have the same energy needs at the same time, so it makes sense to look at energy supply on a much larger scale, according to Anders Dyrelund, Senior Market Manager within Energy at Ramboll: “The density of a city enables thermal energy to be produced and stored centrally and then distributed throughout the city via city energy grids.”
A smarter use of energyIn hot climates, the electricity grid is often stretched to the maximum in the middle of the day because every building is running its air-conditioning. But if people could cover their cooling needs with a district cooling system, rather than having to run individual air-conditioning units, they could stay cool all day and at lower cost:
“A district cooling facility could produce and store cooling in large chilled water tanks for an entire neighbourhood at night, when electricity is cheaper and easily available. This cooling could then be used during the day. Moreover, the total investment costs in cooling plants are reduced due to economy of scale,” he explains. What is more, the space otherwise
used for local cooling production – basements or rooftops, for instance – could be used for car parks or even a rooftop terrace.
The same goes for cold weather climates, where the demand for heating is great. Distributing heat from centralised plants frees up urban space and increases energy efficiency – thus lowering socio-economic costs and improving the environment. Moreover, the district heating system can utilise and store for instance surplus heat from power production and industrial processes, geothermal heat, large heat pumps, large scale solar heating and biomass boilers.
City planning requiredIntroducing these centralised, large-scale energy grids requires city planning. Whenever urban developments are projected, planners can establish the basic network for district heating, which will gradually spread to the surrounding areas.
“In this instance, it’s important not to limit the focus only on the area being developed, but to prepare for future expansion,” says Anders Dyrelund.“You have to look at sustainability
and energy efficiency from a socio-economic standpoint – taking into account the economic, social and environmental aspects,” he concludes. “We should develop solutions that are as smart as possible – and by smart, I don’t mean technically complicated, but as simple and cost-efficient as possible for society in general.”
20%of Denmark’s total heating requirement is covered by the integrated and optimised Greater Copenhagen district heating network, which supplies 1,000,000 people with heating.

30 aCtIVItIes sMart energy systeMs for CItIes
above: ramboll is developing a district heating energy master plan for the ten local authorities of greater Manchester. Below: the largest solar heating plant in norway at akershus district heating station.
ReneWable eneRgy in noRWayAs part of a large investment in renewable energy, a new biomass power plant for district heating has been built in Lillestrøm outside Oslo. It is one of Europe’s most modern and innovative district heating stations, operating on woodchips and biogas, to deliver heat to commercial and domestic buildings in the Oslo area. Ramboll was consultant to Akershus Fjernvarme AS on the project and assisted with planning and procurement. In addition, the largest solar heating plant in Norway (13,000 m2) is positioned next to the power plant. Ramboll was involved in procurement, technical specifications, connection to existing systems, as well as project management during the construction period.
DistRict heating in gReateR ManchesteRInspiration from the Greater Copenhagen energy system has meant that over the past several years, district heating has experienced a breakthrough in the UK.
Ramboll has been commissioned to develop a district heating energy master plan for the ten local authorities of Greater Manchester. Ramboll’s study has been conducted in three phases:
Phase 1: Heat mapping and initial opportunity mapping within the Greater Manchester area to establish a longlist of project opportunities.
Phase 2: Screening and ranking of the identified project opportunities in order to develop a shortlist for more detailed pre-feasibility stage appraisal.
Phase 3: Evaluation of the project shortlist according to barriers and opportunities to development so that selected projects can be taken to full feasibility stage assessment.

31annual report 2013
Deep WateR innovation secURes eneRgy sUpply Despite progress in identifying alternative energy sources, the steady supply of oil and gas remains a prerequisite for well-functioning societies and cities. The Polarled pipeline, a record-breaking 481 km offshore pipeline system crossing the Arctic circle, is step one in developing a new gas region in Europe. In 2012 alone, twelve new gas fields were found in the Norwegian Sea and the potential of the region leads to great optimism in order to secure energy supply to Europe for many years to come.
Advanced 3d solutions for cost-effective designStatoil’s Polarled is the world’s first pipeline of its size to be built at water depths of up to 1,300 meters – a pioneering aspect that calls for high-class expertise and technical understanding of the challenging environment while keeping future expansion opportunities in mind.
To meet the challenge, Ramboll’s specialists have ensured a systematic optimisation of the amount of steel for the pipeline, and used advanced software for fatigue analysis and developed tailored models for 3D analyses, which will reduce the overall costs of the project. The innovative
solutions for multiple, longer free spans of the pipeline will save money by circumventing the need for costly installations of rock support at the seabed.
Project Manager Lars Eriksen explains: “Due to the project size, there are huge possibilities to optimise the various technical solutions. In particular, we have developed finite element models for assessing very complicated 3D design challenges. The models provide us with an exceptional understanding of the true physical behaviour of the pipeline and enable us to optimise the pipeline design.”

32 fInanCIal status aCCountIng polICIes
coUntRy officesNORdICS Denmark Finland Greenland Norway Sweden
REST OF EUROpE Belgium Cyprus Estonia Germany Poland Romania Russia Switzerland United Kingdom
INdIA ANd mIddLE EAST India Kingdom of Saudi Arabia Qatar United Arab Emirates
NORTH AmERICA USA
ASIA China Singapore

annual report 2013 33
Foreign currency transactions are translated into DKK using the exchange rates prevailing at the dates of the transactions.
Foreign exchange gains and losses resulting from the settlement of such transactions and from the translation at year-end exchange rates of monetary assets and liabilities denominated in foreign currencies are recognised in financial income and expenses in the income statement.
Intercompany loans, which are part of a net investment in subsidiaries, are not considered to be monetary items, but are considered as equity investments. The fluctuations in exchange rates are recognised directly through equity.
The results and financial position of foreign subsidiaries and associates with a functional currency different from the presentation currency of the Group are translated into the presentation currency as follows:
• assetsandliabilitiesforeach balance sheet item presented are translated at the closing rate at the date of the balance sheet,• incomeandexpensesare translated at the dates of the transactions (or approximate average rates), and• allexchangedifferences arising from the difference between closing and average rates and between opening and closing rates are recognised as a separate component of equity.
In relation to consolidation exchange differences arising from the translation of the net investment in foreign entities,
basis of consolidationThe Consolidated Financial Statements comprise the Parent Company, Ramboll Group A/S, and entities in which the Parent Company has control, i.e. the power to govern the financial and operating policies generally accompanying a shareholding of more than half of the voting rights. Subsidiaries are fully consolidated from the date on which control is transferred to Ramboll Group A/S.
The cost of an acquisition is measured as the fair value of the assets given, equity instruments issued and liabilities incurred or assumed at the date of exchange plus costs directly attributable to the acquisition. Identifiable assets acquired and liabilities assumed in a business combination are measured initially at their fair values at the acquisition date. The excess of the cost of an acquisition over the fair value of Ramboll Group A/S’ share of the identifiable net assets acquired is recorded as goodwill.
If an investment includes deferred consideration, this is recognised at cost at the time of investment and subsequently measured at amortised cost in subsequent periods. Changes in deferred consideration are reflected in the value of goodwill.
Intercompany transactions, balances, realised and unrealised gains and losses on transactions between Group companies are eliminated.
presentation currency and foreign currency translationThe financial statements for the Group and the Parent Company are presented in DKK thousands.
The Annual Report of Ramboll Group A/S is prepared in accordance with the provisions applicable to large enterprises in accounting class C under the Danish Financial Statements Act.
The Consolidated Financial Statements and the Parent Company Financial Statements has been prepared under the same accounting policies as last year.
Ramboll Group A/S has chosen to deviate from the form requirements of the Danish Financial Statements Act relating to the income statement. EBITA has been inserted as a subtotal. Income from associated companies and joint ventures is presented as part of EBITA and other operating income and costs is presented after EBITA in order to provide a fair view of the Group’s operations.
Recognition and measurementOn initial recognition, assets and liabilities are measured at cost. Subsequently, assets and liabilities are measured as described for each individual item below. Certain financial assets and liabilities are recognised at amortised cost. Amortised cost is stated as original cost less any principal payments plus or minus the cumulative amortisation of any difference between cost and the nominal amount. In this way, capital losses and gains are amortised over the maturity. Recognition and measurement take into consideration anticipated losses and risks that arise before approval of the Annual Report and which confirm or invalidate affairs and conditions existing at the balance sheet date.
accoUnting policiesbasis of pRepaRation

34 fInanCIal status aCCountIng polICIes
and of borrowings and other currency instruments designated as hedges of such investments, are taken to shareholders’ equity.
Goodwill and fair value adjustments arising on the acquisition of a foreign entity are treated as assets of the foreign entity and translated at the closing rate.
derivative financial instrumentsDerivative financial instruments are initially recognised in the balance sheet at cost and are subsequently remeasured at their fair values. Positive and negative fair values of derivative financial instruments are classified as “Other receivables” and “Other payables”, respectively.
Changes in the fair values of derivative financial instruments are recognised in the income statement unless the derivative financial instrument is designated and qualifies as hedge accounting. Changes in fair values of derivative financial instruments, which qualify as hedge accounting, are recognised in equity. Where the expected future transaction results in the acquisition of non-financial assets, any amounts deferred under equity are transferred from equity to the cost of the asset. Where the expected future transaction results in income or expense, amounts deferred under equity are transferred from equity to the income statement in the same item as the hedged transaction.
minority interests In the statement of Group results and Group equity, the elements of the profit and equity of subsidiaries attributable to minority interests are stated as separate items in the income statement and the balance sheet.
LeasesLeases of property, plant and equipment where substantially all the risks and rewards of ownership are transferred to the Group are classified as finance leases. Finance leases are capitalised at the lease’s inception at the lower of the fair value of the leased property and the present value of the minimum lease payments. Lease payments are allocated between
the liability and finance charges so as to achieve a constant rate of interest on the finance balance outstanding. The corresponding
lease obligations, net of finance charges, are included in other long-term payables. The interest element of the finance cost is charged to the income statement. The property, plant and equipment acquired under finance leases are depreciated over the shorter of the useful life of the asset or the lease term taking into consideration bargain purchase options.
All other leases are classified as operating leases. Payments made under operating leases are charged to the income statement over the period of the lease.
Income statementrevenueRevenue in the Group consists of the fair value of the consideration received or receivable for the sale of goods and services in the ordinary course of the Group’s activities. Revenue is shown net of value-added tax, returns, rebates and discounts and after eliminating sales within the Group.
The Group recognises revenue when the amount of revenue can be reliably measured, and it is probable that future economic benefits will flow to the entity and when specific criteria have been met for each of the Group’s activities as described below. The amount of revenue is not considered to be reliably measurable until all contingencies relating to the sale have been resolved. The Group bases its estimates on historical results, taking into consideration the type of customer, the type of transaction and the specifics of each arrangement.
The Group sells services within engineering, environment and management. These services are provided on a time and material basis or as a fixed-price contract, with contract terms generally ranging from less than one year up to ten years.
Revenue from time and material contracts is recognised at the contractual rates as labour hours are delivered and direct expenses are incurred.
Revenue from fixed-price contractsis recognised under the percentageof-completion (POC) method. Under the POC method, revenue is generally recognised based on the services performed to date as a percentage of the total serviceto be performed.
If circumstances arise that may change the original estimates of revenues, costs or extent of progress toward completion, estimates are revised. These revisions may result in increases or decreases in estimated revenues or costs and are reflected in income during the period in which the circumstances that give rise to the revision become known by Management.
revenue segment informationRevenue information is provided on markets. The revenue by markets is based on the Group’s six markets. Revenue by geographical market is based on the location of the projects.
project costsProject costs consist of costs directly related to projects, such as travel expenses, costs of external services and other project costs. Staff costs are not included in project costs. external costsExternal costs consist of costs such as administration, marketing, travel and accommodation, office rent, IT costs and other external costs.
staff costsStaff costs consist of costs such as wages and salaries, pension costs and other social security benefits of employees and of the Executive and Supervisory Boards.
other operating income and costsOther operating income and other operating costs comprise items of a secondary nature to the core activities of the enterprises, including gains and losses on the sale of companies,

annual report 2013 35
calculated on the basis of the Group’s accounting policies and after deduction or addition of the Group’s share of any unrealised intra-group gains or losses. Investments in associates are initially recognised at cost.
On acquisition of associated companies, the difference between the cost and the book net assets of the acquired company is calculated at the date of acquisition after adjustment to fair value of the identifiable assets and liabilities (purchase method). Any remaining positive balances (goodwill) are recognised as investments in associated companies in the balance sheet and amortised in the income statement on a straight-line basis over the estimated useful life of the investment.
In the income statement, income is recognised from associates which comprise the share of profit after tax less amortisation of goodwill.
joint venturesUndertakings which are contractually operated jointly with one or more other undertakings (joint ventures) and which arethus jointly controlled are recognised in accordance with the equity method.
In the income statement, income is recognised from joint ventures which comprise the share of profit before tax.
Impairment of assetsImpairment tests are performed if indications of impairment are present. If the carrying amount is found to be greater than the implied fair value, then impairment has occurred and the book value of the asset is written down to its recoverable amount. The recoverable amount is the higher of the net selling price and value in use.
other investmentsOther investments comprise listed securities, deposits and other receivables. Deposits and other receivables are measured at cost less any write-down according to individual assessment. Listed securities are
assets of the acquired subsidiary at the date of acquisition. Goodwill in the Group on acquisitions of subsidiaries is included in intangible assets, and is amortised over
the following expected useful lives. Other intangible assets, comprising software, patents and licences, are capitalised and amortised over an appropriate expected useful life, within the ranges shown below.
The following useful lives are applied: Goodwill: 5-20 years. Software, patents and licences: 3-7 years.
property, plant and equipment and leasehold improvementsProperty, plant and equipment and leasehold improvements are measured at historical cost less accumulated depreciation. Historical cost includes expenditure that is directly attributable to the acquisition of the items. Depreciation is calculated on a straight-line basis over the estimated useful lives of the assets.
The following useful lives are applied: Buildings: 10–50 years.IT: 3 years. Plant and equipment: 5 years. Leasehold improvements: 1-10 years.
The assets’ residual values and useful lives are reviewed, and adjusted if appropriate, at each balance sheet date.
Conversely, property, plant and equipment and leasehold improvements purchased for DKK 50,000 or less are expensed.
Gains and losses on disposal are determined by comparing proceeds with the carrying amount. These are included in the income statement.
associatesAssociates are all entities over which Group has significant influence but not control, generally accompanying a shareholding of between 20% and 50% of the voting rights. Investments in associates are accounted for by the equity method of accounting,
intangible assets and property, plant and equipment. Furthermore integration and restructuring costs are presented as other operating costs. Restructuring costs comprise
redundancies and rent related to vacant properties, when part of a larger restructuring scheme.
financial itemsFinancial income and expenses consist of interest income and expenses, foreign exchange gain or loss and other interest income and expenses.
Corporation tax and deferred taxTax consists of current tax and changes in deferred tax for the year. The tax relating to the income for the year is recognised in the income statement. Current tax receivable is recognised in the balance sheet if excess tax has been paid on account and a current tax payable is recognised if a liability exists.
Deferred tax is measured by using the balance sheet liability method on all temporary differences arising between the book values of assets and liabilities and the amounts used for taxation purposes. Deferred tax is not recognised on temporary differences relating to goodwill not deductible for tax purposes. Deferred tax is measured according to the tax rules and at the tax rates under the legislation at the balance sheet date that are expected to apply when the temporary differences are eliminated. Changes in deferred tax due to changes in the tax rates are recognised in the income statement.
Deferred tax assets, including the tax base of tax losses carried forward, are measured at the value at which it is expected that they can be utilised by elimination against tax on future earnings or by set-off against deferred tax liabilities.
balance sheetIntangible assets Goodwill represents the excess of the cost of an acquisition plus costs directly attributable to the acquisition over the fair value of the Group’s share of the net identifiable

36 fInanCIal status aCCountIng polICIes
recognised at fair value at the trade date and subsequently measured at market price. Fair value adjustments are recognised in the income statement.
receivablesAccounts receivables, trade are recognised initially at fair value and subsequently measured at cost less allowance for bad debt. A allowance for bad debt of trade receivables is established when there is objective evidence that Ramboll Group will not be able to collect all amounts due according to the original terms of receivables.
Work in progressWork in progress is measured at the sales price of the work performed, corresponding to direct and indirect costs incurred plus a proportionate share of the expected profit calculated on the basis of an assessment of the percentage of completion. The sales price is reduced by progress billings. Invoices on account beyond the percentage of completion of contracts are calculated separately for each contract and recognised as “payments from customers” under short-term liabilities.
prepayments Prepayments consist of expenses paid relating to subsequent financial years and consist primarily of prepaid interest, rent and insurance.
equityDividend distribution proposed by Management for the year is disclosed as a separate equity item.
provisionsA provision is recognised when the Group has a present legal or constructive obligation as a result of past events and it is probable that an outflow of resources will be required to settle the obligation. Provisions are recognised for items such as legal claims, restructuring provisions, pension provisions, uncertain tax provisions and any other necessary provisions.
provision for pensionsContributions payable under defined contribution plans are recognised as an expense along
with delivery of employee service giving rise to the obligation to pay the contribution. Costs under defined benefit plans are recognised in line with the performance of the employee services entitling the employees to the benefits. The obligation is measured at the present value of the expected pension payments attributable to the services delivered at the balance sheet date. The obligation is measured on the basis of actuarial assumptions, which are re-assessed on a regular basis.
Plan assets are recognised at their fair value at the balance sheet date. Plan assets and related obligations are presented on a net basis in the balance sheet.
Gains and losses arising from changes in actuarial assumptions are recognised in the year where they arise. Multi-employer plans for which sufficient information is not available are treated as defined contribution plans.
provision for claimsProvision for claims from customers concerning single projects that are not covered by insurance are recognised at their fair value at the balance sheet date.
financial obligationsLoans from banks that are expected to be held to maturity are recognised on the date of borrowing as the net proceeds received less transaction costs incurred. In subsequent periods, the loans are measured at amortised cost, corresponding to the capitalised value using the effective interest rate. Accordingly, the difference between the proceeds and the nominal value is recognised in the income statement during the term of the loan. Other financial obligations are measured at amortised cost, which substantially corresponds to their nominal value.
other payablesOther payables mainly consist of salary related items (bonuses, pension, tax, holiday accruals etc.), accrued interest and not received or approved vendor invoices.
parent CompanyInvestmentsInvestments in subsidiaries are recognised and measured according to the equity method. Investments in subsidiaries arerecognised in the Parent Company’s income statement at the proportionate share of profit.
On acquisition of subsidiaries, the difference between the cost and the book net assets of the acquired company is calculated at the date of acquisition after adjustment to fair value of the identifiable assets and liabilities (purchase method). Any remaining positive balances (goodwill) are recognised as investments in subsidiaries in the balance sheet and amortised in the income statement on a straight-line basis over the estimated useful life of the investment. The portion of the subsidiaries’ profits for the year that is not distributed as dividend becomes retained earnings according to the equity method.
Cash flowThe cash flow statement shows the Group’s cash flows for the year from operating, investing and financing activities, respectively, and also includes cash and cash equivalents at the beginning and at the end of the year. Cash flows from operating activities are presented indirectly and are calculated as the income for the year adjusted for non-cash operating items, changes in working capital and income taxes paid. Cash flows from investing activities consist of payments in connection with acquisitions and disposals of intangible assets, property, plant and equipment, and investments. Cash flows from financing activities consist of repayments on long-term debt and increase of bank loans. Cash and cash equivalents consist of cash at bank, cash in hand and current securities with a maturity period shorter than three months, less short-term bank loans due on demand.The cash flow statement cannot be immediately derived from the published financial statements.
annual report 2013 37
number of employees, end of year = Number of all permanent and temporary employees at the end of the year, regardless of their working hours.
number of full time employee equivalents =hours registered in time sheetsstandard working hours during the year
eBIta margin = eBIta x 100revenue
operating margin (eBIt margin) = operating profit x 100revenue
return on invested capital (roIC) = eBIta x 100average invested capital including goodwill
return on equity (roe) = profit for the year x 100average shareholders’ equity
Cash conversion ratio = eBIta + Change in working capital x 100eBIta
equity ratio (solvency ratio) shareholders’ equity x 100total assets
free Cash flow =Cash flow from operating activities -Investment in tangible assets, net
economic profit =net profit - return on invested capital
The financial ratios have been prepared
in accordance with the guidelines of the
Danish Society of Financial Analysts (Den
Danske Finansanalytikerforening).
fInanCIal ratIos

38 fInanCIal status fInanCIal stateMents
incoMe stateMent
financialstateMents
group parent Company
note dKK thousand 2013 2012 2013 2012
1 Revenue 7,794,074 7,552,483 91,214 81,458 Project costs (1,054,565) (1,031,532) (6,091) (878) External costs (1,259,572) (1,271,539) (87,596) (74,407)
2 Staff costs (4,987,453) (4,764,439) (58,607) (52,857) 3 Depreciation (115,019) (100,894) (382) (451) 12 Income from associates
and joint ventures12,411 21,531 - -
eBIta 389,876 405,610 (61,462) (47,135)
3 Goodwill amortisation (106,439) (111,762) - - Other operating income 3,844 20,037 3,291 9,267 Other operating costs (113) (23,615) (142) (79)
11 Income from subsidiaries - - 199,546 198,889 operating profit 287,168 290,270 141,233 160,942
4 Financial income 18,032 36,495 9,935 32,3365 Financial expenses (52,918) (49,633) (25,626) (36,760)
profit before tax 252,282 277,132 125,542 156,518
6 Tax (109,218) (108,834) 17,260 11,951 profit before minority 143,064 168,298 142,802 168,469
Minority interest (262) 171 - - profit for the year 142,802 168,469 142,802 168,469
proposed profit appropriation:Proposed dividend 26,250 26,250Retained earnings 116,552 142,219
142,802 168,469

annual report 2013 39
cash floW stateMent
group
note dKK thousand 2013 2012
operating activities:Profit before tax 252,282 277,132
8 Gain from divestment of companies (3,000) (16,744) 3 Depreciation and amortisation 221,458 212,656
Income from associates and joint ventures (12,411) (21,531) Unrealised exchange loss/(gain), net 7,162 (2,953) Cash flow from operating activities before change in working capital 465,491 448,560
Change in work in progress 24,060 (138,204) Change in receivables 61,319 (260,138) Change in payments from customers (41,606) 174,211 Change in payables 70,607 123,200 Change in working capital 114,380 (100,931)
Change in provisions 10,270 (11,373) Income tax paid (126,915) (82,801) Cash flow from operating activities 463,226 253,455
Investing activitites:Investment in tangible assets, net (104,436) (91,374)
7 Acquisition of companies (114,888) (51,617) 8 Divestment of companies - 21,514
Investment in intangible assets (7,413) 173 Investment in other financial assets 34,862 9,365 Cash flow from investing activities (191,875) (111,939)
financing activities:Loan payments, net 4,754 (43,044) Dividend to minority interest (465) (474) Dividend to shareholders (26,250) (26,250) Cash from financing activities (21,961) (69,768)
net cash flow for the year 249,390 71,748
total cash and cash equivalents at 1 january 485,186 398,452Net cash flow for the year 249,390 71,748Exchange rate adjustments (11,782) 14,986 total cash and cash equivalents at 31 December 722,794 485,186

40 fInanCIal status fInanCIal stateMents
balance sheet, assets
group parent Company
note dKK thousand 31.12.2013 31.12.2012 31.12.2013 31.12.2012
Goodwill 807,889 866,990 - - Software, licences, patents etc. 17,251 8,485 - -
9 Intangible assets 825,140 875,475 - -
Property 30,375 33,305 - - Plant and equipment 208,693 224,343 703 1,257 Leasehold improvements 43,747 44,584 - -
10 property, plant and equipment 282,815 302,232 703 1,257
11 Investments in subsidiaries - - 1,943,140 1,962,144 12 Investments in associates
and joint ventures
33,383 52,632 - 290Amounts owed by subsidiaries - - 249,400 133,726
13 Other investments 3,260 4,439 187 187 Other receivables 111 519 - -
14 Deposits 28,526 29,448 - - Investments 65,280 87,038 2,192,727 2,096,347
total fixed assets 1,173,235 1,264,745 2,193,430 2,097,604
Accounts receivables, trade 1,445,744 1,592,884 - - 15 Work in progress 611,736 634,758 174 85
Other receivables 151,988 99,241 17,640 3,344 Amounts owed by subsidiaries - - 24,316 57,659 Amounts owed by associates 71 29 - - Tax receivables 21,410 20,483 - -
6 Deferred tax assets 32,792 29,906 3,733 2,033 Prepayments 129,717 141,146 1,896 2,223 receivables 2,393,458 2,518,447 47,759 65,344
Cash at bank and in hand 722,794 485,186 567,429 316,972
total current assets 3,116,252 3,003,633 615,188 382,316
total assets 4,289,487 4,268,378 2,808,618 2,479,920

annual report 2013 41
balance sheet, eqUity anD liabilities
group parent Company
note dKK thousand 31.12.2013 31.12.2012 31.12.2013 31.12.2012
16 Share capital 35,000 35,000 35,000 35,000 Retained earnings 1,638,516 1,615,076 1,638,516 1,615,076 Proposed dividend 26,250 26,250 26,250 26,250
17 shareholders' equity 1,699,766 1,676,326 1,699,766 1,676,326
Minority interest 2,712 3,332 - -
18 Provision for pensions 4,924 9,161 - - 6 Provision for deferred tax 133,296 165,130 - -
Provision for claims, etc. 56,321 43,276 - - total provisions 194,541 217,567 - -
Bank loans 63,460 75,000 63,460 75,000 Other payables 61,034 40,731 - -
19 total long-term liabilities 124,494 115,731 63,460 75,000
Bank loans 11,706 - 11,540 - 15 Prepayments from customers 588,854 640,749 - -
Trade payables 324,704 304,087 26,879 10,360 Amounts owed to subsidiaries - - 942,017 625,875 Amounts owed to associates 371 889 - - Corporation tax 104,931 89,388 6,712 6,385
20 Other payables 1,237,408 1,220,309 58,244 85,974 total short-term liabilities 2,267,974 2,255,422 1,045,392 728,594
total liabilities 2,392,468 2,371,153 1,108,852 803,594
total liabilities and shareholders' equity 4,289,487 4,268,378 2,808,618 2,479,920
21 Contingent liabilities22 Operational lease obligations23 Auditors' fee24 Related parties and ownership25 Financial risk management

42 fInanCIal status notes
notes Dkk thoUsanD
group
Note 1 - Segment information 2013 2012
revenue by markets:Buildings 2,608,544 2,660,892Transport 1,961,999 1,942,893Environment 1,118,590 903,150Energy 764,928 611,419Oil & Gas 740,195 796,416Management Consulting 489,817 411,128Towers (discontinued) 110,001 226,585
7,794,074 7,552,483revenue by project locations:Denmark 2,555,852 2,155,948Norway 1,709,798 1,817,910Sweden 1,291,274 1,317,935Finland 803,197 769,538UK 497,772 565,232Middle East 402,019 386,412India 62,568 61,596Rest of the world 471,594 477,912
7,794,074 7,552,483
group parent Company
Note 2 - Staff costs 2013 2012 2013 2012
employees:Wages and salaries (4,251,792) (4,072,457) (33,328) (29,564)Pension costs (318,991) (303,034) (3,427) (3,057)Other social security costs (395,260) (377,103) (442) (925)
(4,966,043) (4,752,594) (37,197) (33,546)
Executive Board (19,045) (17,114) (19,045) (17,114)Board of Directors (2,365) (2,197) (2,365) (2,197)
(4,987,453) (4,771,905) (58,607) (52,857)
staff costs are recognised as follows inthe income statement:Staff costs (4,987,453) (4,764,439) (58,607) (52,857)Other operating costs - (7,466) - -
(4,987,453) (4,771,905) (58,607) (52,857)
number of employees:Number of employees end of year 10,161 9,759 37 41 Number of full time employee equivalents 9,593 9,125 33 35

annual report 2013 43
group parent Company
Note 3 - depreciation and amortisation 2013 2012 2013 2012
Software, licences, patents etc. (5,301) (5,404) - - Leasehold improvements (8,022) (6,845) - - Property (1,763) (706) - - Plant and equipment (99,933) (87,939) (382) (451) Depreciation (115,019) (100,894) (382) (451) see note 9 and 10
Goodwill (106,439) (111,762) - - goodwill amortisation (106,439) (111,762) - - see note 9
Depreciation and amortisation (221,458) (212,656) (382) (451)
group parent Company
Note 4 - Financial income 2013 2012 2013 2012
Interest income from subsidiaries - - 5,436 13,709 Interest income from securities - 144 - - Foreign exchange gain 12,118 20,244 2,135 10,922 Interest income, external 5,367 9,991 2,364 2,550Other financial income 547 6,116 - 5,155
18,032 36,495 9,935 32,336
group parent Company
Note 5 - Financial expenses 2013 2012 2013 2012
Interest expense to subsidiaries - - (3,075) (5,001) Foreign exchange loss (21,197) (21,850) (5,585) (13,803) Interest expense, external (26,604) (24,660) (16,835) (17,956)Other financial expenses (5,117) (3,123) (131) -
(52,918) (49,633) (25,626) (36,760)

44 fInanCIal status notes
group
Note 7 - Acquisition of companies 2013 2012
Intangible-/Tangible assets (2,636) (704)Other investments (1,839) (330)fixed assets (4,475) (1,034) Work in progress (24,253) (2,001) Operating receivables (55,750) (8,366) Cash and cash equivalents (17,759) (23,087) Long-term liabilities 328 - Current liabilities 49,714 7,490Group goodwill (86,286) (56,187) purchase price (138,481) (83,185)
Cash in acquired companies 17,759 23,087 Deferred consideration 5,834 8,481acquisition of companies (114,888) (51,617)
group parent Company
Note 6 - Tax 2013 2012 2013 2012
Current tax on profit for the year (157,002) (86,093) 16,194 15,334 Movements in deferred tax 35,043 (22,087) 1,700 (2,677) Adjustments in respect of prior years 7,929 (158) (5,446) (210) tax for the year (114,030) (108,338) 12,448 12,447
tax for the year is allocated in the following way:Tax on profit for the year (109,218) (108,834) 17,260 11,951 Tax on equity movements (4,812) 496 (4,812) 496 tax for the year (114,030) (108,338) 12,448 12,447
Deferred tax:Goodwill 298 577 - - Licences (676) (281) - - Plant and equipment 9,752 10,434 318 394 Leasehold improvements 1,173 692 - - Accounts receivable, trade 12,542 4,958 - - Work in progress (154,864) (166,858) - - Deferred income/(expenses), net (1,434) (7,838) 805 (2,854) Provisions 18,430 11,100 2,610 4,493 Tax loss for future use 14,275 11,992 - -total deferred tax (100,504) (135,224) 3,733 2,033
recognised in balance sheet as follows:Deferred tax, assets 32,792 29,906 3,733 2,033Deferred tax, liabilities (133,296) (165,130) - -
Deferred tax is allocated using the estimated tax rate at time of utilisation.

annual report 2013 45
group
Note 8 - divestment of companies 2013 2012
Fixed assets - 1,924 Work in progress - 15,781 Operating receivables - 13,185Cash and cash equivalents - 2,360 Current liabilities 3,000 (22,280) Minority - (3,840)Gain from divestment of companies (3,000) 16,744 sales price - 23,874 Cash in divested companies - (2,360) Divestment of companies - 21,514
group parent Company
Note 9 - Intangible assets Goodwill Intangible assets Goodwill Intangible assets
2013
Opening cost 1,569,601 29,270 - 143Additions from acquired companies 86,286 794 - -Additions - 8,186 - -Disposals - (1,225) - -Exchange rate and other adjustments (79,425) 4,748 - -Closing cost 1,576,462 41,773 - 143
Opening amortisation (702,611) (20,785) - (143)Disposals - 1,127 - -Amortisation for the year (106,439) (5,301) - -Exchange rate and other adjustments 40,477 437 - -Closing amortisation (768,573) (24,522) - (143)
Book value at 31 December 807,889 17,251 - -
Amortisation period (years) 5-20 3-7 - 3
2012
Opening cost 1,469,957 55,546 - 143 Additions from acquired companies 56,187 66 - - Additions - 5,038 - - Disposals from divested companies - (5,993) - -Disposals - (26,396) - - Exchange rate and other adjustments 43,457 1,009 - - Closing cost 1,569,601 29,270 - 143
Opening amortisation (568,949) (45,108) - (143) Disposals from divested companies - 4,783 - -Disposals - 25,711 - - Amortisation for the year (111,762) (5,404) - - Exchange rate and other adjustments (21,900) (767) - - Closing amortisation (702,611) (20,785) - (143)
Book value at 31 December 866,990 8,485 - -
Amortisation period (years) 5-20 3-7 - 3

46 fInanCIal status notes
group parent Company
Note 10 - property, plant and equip-ment
Property Plant and equipment
Leaseholdimprovements
Property Plant and equipment
Leaseholdimprovements
2013
Opening cost 38,277 590,692 62,185 - 3,966 - Additions from acquired companies - 1,498 344 - - - Additions 1,284 101,195 7,343 - - - Disposals (1,380) (16,044) (37) - (2,725) - Exchange rate and other adjustments (1,164) (39,309) (1,178) - - - Closing cost 37,017 638,032 68,657 - 1,241 -
Opening depreciation (4,972) (366,349) (17,601) - (2,709) - Disposals 15 11,768 23 - 2,553 -Depreciation for the year (1,763) (99,933) (8,022) - (382) - Exchange rate and other adjustments 78 25,175 690 - - -Closing depreciation (6,642) (429,339) (24,910) - (538) -
Book value at 31 December 30,375 208,693 43,747 - 703 -
Depreciation period (years) 10-50 3-5 1-10 - 3-5 -
The net book value of finance leases amount to DKK 10,299 thousand.
2012
Opening cost 38,362 751,315 68,271 - 3,528 - Additions from acquired companies - 638 - - - - Additions 114 91,647 11,334 - 489 - Disposals from divested companies - (3,476) - - - - Disposals (1,105) (224,243) (18,744) - (515) - Exchange rate and other adjustments 906 (25,189) 1,324 - 464 - Closing cost 38,277 590,692 62,185 - 3,966 -
Opening depreciation (3,274) (524,884) (29,483) - (2,128) - Disposals from divested companies - 2,762 - - - - Disposals (970) 213,008 19,435 - 335 - Depreciation for the year (706) (87,939) (6,845) - (451) - Exchange rate and other adjustments (22) 30,704 (708) - (465) - Closing depreciation (4,972) (366,349) (17,601) - (2,709) -
Book value at 31 December 33,305 224,343 44,584 - 1,257 -
Depreciation period (years) 10-50 3-5 1-10 - 3-5 -
The net book value of finance leases amount to DKK 9,490 thousand.

annual report 2013 47
parent Company
Note 11 - Investment in subsidiaries 2013 2012
Opening cost 2,121,987 1,697,605Additions 84,541 392,002Disposals - (2,411)Exchange rate and other adjustments (60,521) 34,791Closing cost 2,146,007 2,121,987
Opening revaluation (159,843) (109,101)Share of profit for the year 229,836 229,095Dividend paid (195,312) (252,140)Disposals - (11,467)Amortisation group goodwill (30,290) (30,206)Exchange rate and other adjustments (47,258) 13,976Closing revaluation (202,867) (159,843)
Book value at 31 December 1,943,140 1,962,144
specification: Equity in subsidiaries 1,675,196 1,652,045Value of goodwill 267,944 310,099Book value at 31 December 1,943,140 1,962,144
Specification of parent Company's shareholdings in group companies % of capital and votes
Share capital DKK thousand
name and registered officeDirectly ownedRambøll Danmark A/S, Copenhagen, Denmark 100 35,000Ramböll Sverige AB, Stockholm, Sweden 100 125Rambøll Norge AS, Oslo, Norway 100 3,542Ramboll Finland Oy, Helsinki, Finland 100 1,790Rambøll Management Consulting A/S, Copenhagen, Denmark 100 2,500Ramboll UK Holding Ltd., London, United Kingdom 100 160,551Ramboll Eesti AS, Tallinn, Estonia 100 477Ramboll Towers Sp. z o.o., Warsaw, Poland 100 1,798Ramboll Singapore Pte Ltd, Singapore 100 76,922Ramboll Whitbybird Australia Pty Ltd., Queensland, Australia 100 484Ramboll Ireland Ltd., Dublin, Ireland 100 758Ramboll GmbH, Hamburg, Germany 100 149Ramboll US Holding Inc., Houston, USA 100 33,559Ramboll Russia, Moscow, Russia 100 215

48 fInanCIal status notes
group parent Company
Note 12 - Investments in associates and joint ventures
2013 2012 2013 2012
Opening cost 6,702 6,882 290 290 Additions 970 269 - - Disposals (290) (16) (290) - Exchange rate and other adjustments (4,236) (433) - - Closing cost 3,146 6,702 - 290
Opening revaluation 45,930 32,343 - - Disposals (361) 6 - -Profit for the year 12,411 21,531 - - Dividend paid (24,555) (11,052) - - Exchange rate and other adjustments (3,188) 3,102 - - Closing revaluation 30,237 45,930 - -
Book value at 31 December 33,383 52,632 - 290
Associates Registred office
% of capital and votes
Equity DKK thousand
Profit for the year DKK thousand
L&T Ramboll Consulting Engineers Ltd. *India 50 60,602 4,572Odeon A/S ***Lyngby, DK 22 2,574 685Fehily Timoney Ramboll Limited **Cork, Ireland 50 207 84Georent i Sverige AB **Täby, Sweden 50 1,642 98Ramboll Kalisperas **UK 50 767 (148)
*Annual Report 31 March 2013 **Annual Report for 2012***Annual Report 30 September 2013
A list of Joint Ventures can be found on page 53 of the Annual Report.
group parent Company
Note 13 - Other investments 2013 2012 2013 2012
Opening cost 4,439 5,644 187 187 Additions 9 995 - - Disposals (1,010) (2,382) - - Exchange rate and other adjustments (178) 182 - - Book value at 31 December 3,260 4,439 187 187
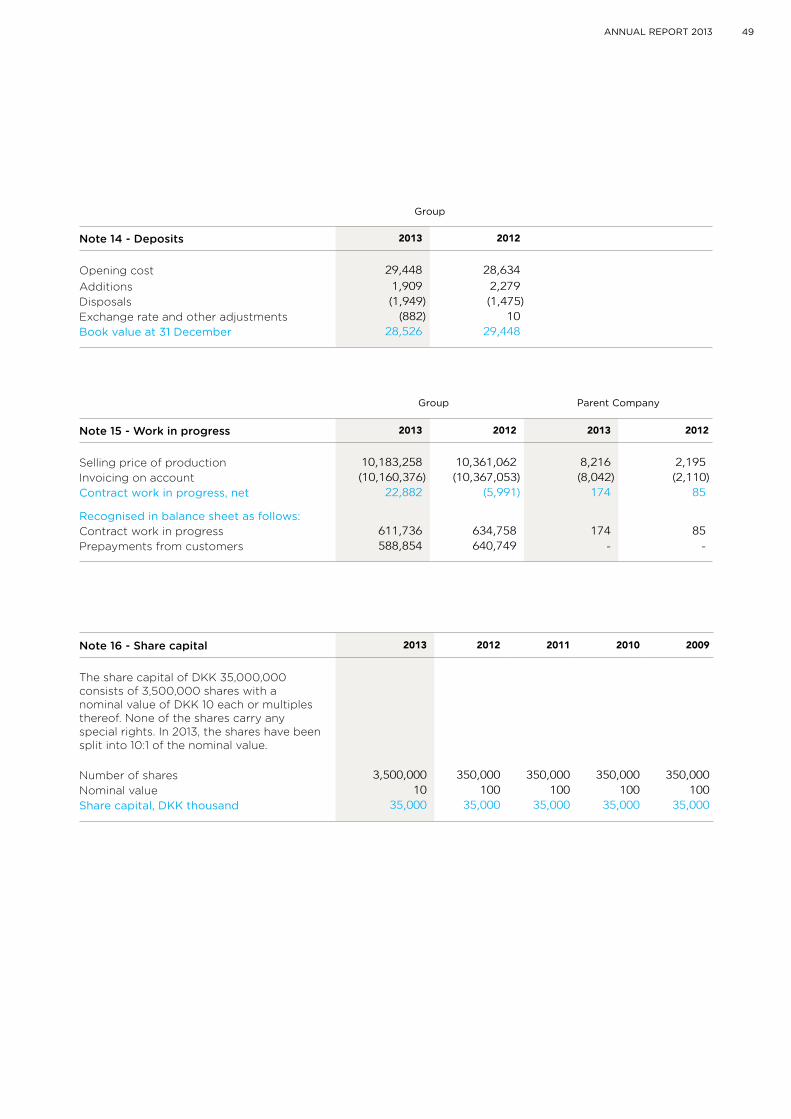
annual report 2013 49
group parent Company
Note 15 - work in progress 2013 2012 2013 2012
Selling price of production 10,183,258 10,361,062 8,216 2,195Invoicing on account (10,160,376) (10,367,053) (8,042) (2,110)Contract work in progress, net 22,882 (5,991) 174 85
recognised in balance sheet as follows:Contract work in progress 611,736 634,758 174 85Prepayments from customers 588,854 640,749 - -
group
Note 14 - deposits 2013 2012
Opening cost 29,448 28,634
Additions 1,909 2,279 Disposals (1,949) (1,475) Exchange rate and other adjustments (882) 10 Book value at 31 December 28,526 29,448
Note 16 - Share capital 2013 2012 2011 2010 2009
The share capital of DKK 35,000,000 consists of 3,500,000 shares with a nominal value of DKK 10 each or multiples thereof. None of the shares carry any special rights. In 2013, the shares have been split into 10:1 of the nominal value.
Number of shares 3,500,000 350,000 350,000 350,000 350,000 Nominal value 10 100 100 100 100 share capital, DKK thousand 35,000 35,000 35,000 35,000 35,000

50 fInanCIal status notes
Note 17 - Shareholders’ equity Share capital
Retained earnings
Proposed dividend Total
2013
Total equity at 1 January 2013 35,000 1,615,076 26,250 1,676,326 Exchange rate adjustments related to foreign subsidiaries and associates - (107,547) - (107,547) Value adjustment of hedging instruments - 19,247 - 19,247 Tax effects - (4,812) - (4,812) Paid dividend - - (26,250) (26,250) Proposed dividend - (26,250) 26,250 - Profit for the year - 142,802 - 142,802 Book value at 31 December 2013 35,000 1,638,516 26,250 1,699,766
2012
Total equity at 1 January 2012Exchange rate adjustments related to foreign 35,000 1,432,498 26,250 1,493,748subsidiaries and associates - 41,935 - 41,935Value adjustment of hedging instruments - (2,072) - (2,072)Tax effects - 496 - 496Paid dividend - - (26,250) (26,250)Proposed dividend - (26,250) 26,250 -Profit for the year - 168,469 - 168,469Book value at 31 December 2012 35,000 1,615,076 26,250 1,676,326
group parent Company
Note 18 - provision for pensions 2013 2012 2013 2012
Present value of defined benefit plans 128,012 132,541 - -Fair value of plan assets 123,088 123,380 - - Book value 31 December 4,924 9,161 - -
Defined benefit plans exist in the UK and Sweden.
group parent Company
Note 19 - Long-term liabilities 2013 2012 2013 2012
Due after 5 years - - - -Due 1-5 years 124,494 115,731 63,460 75,000Book value 31 December 124,494 115,731 63,460 75,000
Of which finance leases 7,429 6,557

annual report 2013 51
group parent Company
Note 20 - Other payables 2013 2012 2013 2012
Provision holiday pay 425,161 402,742 3,278 3,237VAT 237,602 208,818 1,527 1,206Social security contributions 70,175 48,102 79 120Payroll tax 76,781 72,174 - 34Pension insurance 16,796 13,265 - -Accrued salary 215,227 251,166 11,461 8,692Accrued expenses 195,666 224,042 41,899 72,685Book value 31 December 1,237,408 1,220,309 58,244 85,974
group parent Company
Note 21 - Contingent liabilities 2013 2012 2013 2012
Pension commitments 1,515 1,450 - - Surety given, subsidiaries - - 246,407 157,928 Performance and payment bonds 252,484 214,864 - - Contract sum joint ventures 3,413,899 2,864,177 - - Other contingent liabilities 126,683 135,748 - -
3,794,581 3,216,239 246,407 157,928
The Group has some lawsuits. Management confirms that they are not expected to have material effect on the Group’s financial statements.
Danish Group companies are jointly and severally liable for tax on consolidated taxable income and other public liabilities. The total amount is stated in the Annual Report of Ramboll Group A/S, which is the mangement company in the relation to joint taxation.
group parent Company
Note 22 - Operational lease obligations 2013 2012 2013 2012
operational lease obligations:Due within 1 year 25,069 36,065 527 656 Due within 1 to 5 years 27,609 44,425 357 398
rent obligations:Due within 1 year 291,212 303,365 - - Due within 1 to 5 years 841,011 996,539 - - Due after 5 years 605,478 731,459 - -

52 fInanCIal status notes
group parent Company
Note 23 - Auditors’ fee 2013 2012 2013 2012
statutory audit:Fees to PricewaterhouseCoopers 3,168 3,570 276 443 Fees to other audit firms 818 384 - - total fees 3,986 3,954 276 443
other statements with assurance:Fees to PricewaterhouseCoopers 598 912 - - Fees to other audit firms 483 185 - - total fees 1,081 1,097 - -
tax consultancy:Fees to PricewaterhouseCoopers 1,120 2,004 286 220 Fees to other audit firms 515 1,011 150 130 total fees 1,635 3,015 436 350
other services:Fees to PricewaterhouseCoopers 3,240 5,076 612 3,114 Fees to other audit firms 294 562 93 20 total fees 3,534 5,638 705 3,134
Note 24 - Related parties and ownership
TransactionsRelated parties comprise Rambøll Fonden, Board of Directors, Executive Board, Managers and other key employees, subsidiaries and associates.
OwnershipRamboll Group A/S is controlled by Rambøll Fonden (The Ramboll Foundation), Hannemanns Allé 53, 2300 Copenhagen S, Denmark which owns 97% of the shares. The board of the Ramboll Foundation consist of present and former employees. Employees in Ramboll own the rest of the shares, 3%.
number of shares at 31 December 2013:Owned by the Foundation 3,390,328 97%Owned by employees 109,672 3 %
3,500,000

annual report 2013 53
Note 25 - Financial risk management
Liquidity riskAt year-end 2013, Ramboll had a strong financial position with a net cash position of DKK 590 million (2012: DKK 372 million), a committed funding facility of DKK 750 million expiring April 2017 and a DKK 100 million overdraft facility. The Group has been operating comfortable within its financial covernants in 2013.
Interest rate riskThe Group’s debt to credit institutions amounts to DKK 75 million (2012: DKK 75 million) and consists of a fixed interest rate bank loan in recognised credit institutions. The loan is running until January 2016 with the possibility of an additional 4 years. The Group will repay the loan in five instalments on interest payment dates. The first instalment on the first interest payment date will be in 2014. The loan has consequently been split into short-term and long-term debt as per end of 2013.
The interest rate risk policy is to hedge between 30-70% of all Group debt with floating interest rates. Hedging maturity is between 2 and 10 years. At the end of 2013, there was no debt with floating interest rates. Currency riskThe Group’s transaction currency risk exposure is limited by the fact that payments received and made in each country are primarily performed in the same local currency. However, Ramboll is contracting international projects in which payments are received and made in different currencies. Ramboll’s currency risk policy aims to secure significant amounts in foreign currencies through hedging transactions. In addition to the transaction risk related to international projects, the Group is exposed to risk relating to trans-lation of income statements and equity of foreign subsidiaries into DKK, and intercompany items such as loans, royalties, management fees and interest payments between entities with different functional currencies. Currently, currency exposure on foreign investments and intercompany loans are not hedged. The Group also has a currency risk to the extent that borrowings and interest payments are not denominated in the same currencies as the Group’s operating income. Most of the external loans are in DKK to reflect the group’s main cash flows. Operating cash is being held mainly in DKK, EUR, SEK, GBP and NOK accounts. All currencies used in more than one territory are collected in cash pools to minimise the overall cost. Credit risk Ramboll aims to limit credit risks by assessing new customers with the Business Integrity Management System (BIMS) and by requiring payments in advance on projects when possible. The Group has methods and procedures to constantly monitor the economic status of projects ensuring adherence to budgets. A quality control system has been implemented to monitor the total project quality from start to completion.
Joint Ventures
Forth Design Joint Venture I/S, Copenhagen, Denmark, 40%. Rambøll Arup Dorsch Joint Venture, Copenhagen, Denmark, 100%. Joint Venturet Rambøll Atkins, Copenhagen, Denmark, 50%. JV RDK - RRO - Halcrow, Romania, 20%. Rådgivergruppen DNU I/S, Aarhus, Denmark, 17%. Rambøll - Arup - Tec Joint Venture I/S, Copenhagen, Denmark, 50%. Rambøll - Atkins - Emch + Berger - Parsons Joint Venture, Copenhagen, Denmark, 34%. Rambøll - Halcrow - Consilier Joint Venture, Romania, 24%. Rambøll Arup Joint Venture, Copenhagen, Denmark, 75%. Consortium Ecostiler, Denmark, 3%. Mott MacDonald Rambøll TEC Ostc Milleu JV, England, 22%. Rambøll, Fichtner, PM Joint Venture, Romania, 23%. Consortium Rambøll, Naturebureau, Croatia, 52%. Unisamarbejds: Nanosystems for early Dianosis of Neuro., Denmark, 2%. Universitetssamarbejde, Belgium, 15%. SEMANCO, Spain, 12%. JV Alter-Ramboll, Turkey, 9%. Consortium NRNSAD DZZD, Bulgaria, 15%. Rambøll C.F.Møller, Denmark, 50%.

54 fInanCIal status ManageMent’s stateMent anD InDepenDent auDItor’s report
As Group Executives and Board of Directors of Ramboll Group A/S, we have today considered and adopted the Annual Report for the financial year 2013.
The Annual Report has been prepared in accordance with the Danish Financial Statements Act. We consider the accounting policies applied appropriate and the accounting estimates made reasonable.
In our opinion, the Consolidated Financial Statements and the Financial Statements for the Parent Company give a true and fair view of the financial position at 31 December 2013 of the Group and the Parent Company and of the results of the Group and Parent Company operations and the Group’s consolidated cash flows for the financial year 1 January 2013 - 31 December 2013.
In our opinion, the Directors’ Report includes a true and fair account of the development in the operations and financial circumstances of the Group and the Parent Company, of the results for the year and of the financial position of the Group and the Parent Company as well as a description of the most significant risks and elements of uncertainty facing the Group and the Company.
We recommend the Annual Report to be adopted at the Annual General Meeting.
Copenhagen, 6 March 2014
Executive boardJens-Peter Saul, Chief Executive OfficerMichael Rosenvold, Chief Financial OfficerKnut Akselvoll, Group Executive Director, Country UnitsSøren Holm Johansen, Group Executive Director,Markets and Global Practices
board of directorsPeter Højland, ChairmanJeff GravenhorstNiels de Coninck-SmithØyvind IsaksenPer NielsenMerete Helene EldrupSteen ChristensenSteen Nørbæk MadsenAnders Rytter
ManageMent’s stateMent on the annUal RepoRt

annual report 2013 55
to the shareholders of ramboll group a/s Report on Consolidated Financial Statements and parent Company Financial StatementsWe have audited the Consolidated Financial Statements and the Parent Company Financial Statements of Ramboll Group A/S for the financial year 1 January - 31 December 2013, which comprise the income statement, balance sheet, notes and accounting policies, for the Group as well as for the Parent Company. Furthermore, the Consolidated Financial Statements comprise Cash Flow Statements. The Consolidated Financial Statements and the Parent Company Financial Statements are prepared in accordance with the Danish Financial Statements Act.
Management’s responsibility for the Consolidated financial statements and the parent Company financial statementsManagement is responsible for the preparation of Consolidated Financial Statements and Parent Company Financial Statements that give a true and fair view in accordance with the Danish Financial Statements Act, and for such internal control as Management determines is necessary to enable the preparation of Consolidated Financial Statements and Parent Company Financial Statements that are free from material misstatement, whether due to fraud or error.
auditor’s responsibility Our responsibility is to express an opinion on the Consolidated Financial Statements and the Parent Company Financial Statements based on our audit.
We conducted our audit in accordance with International Standards on Auditing and additional requirements under Danish audit regulation. This requires that we comply with ethical requirements and plan and perform the audit to obtain reasonable assurance whether the Consolidated Financial Statements and the Parent Company Financial Statements are free from material misstatement.
An audit involves performing procedures to obtain audit evidence about the amounts and disclosures in the Consolidated Financial Statements and the Parent Company Financial Statements. The procedures selected depend on the auditor’s judgment, including the assessment of the risks of material misstatement of the Consolidated Financial Statements and the Parent Company Financial Statements, whether due to fraud or error. In making those risk assessments, the auditor considers internal control relevant to the Company’s preparation of Consolidated Financial Statements and Parent Company Financial Statements that give a true and fair view in order to design audit procedures that are appropriate in the circumstances, but not for the purpose of expressing an opinion on the effectiveness of the Company’s internal control. An audit also includes evaluating the appropriateness of accounting policies used and the reasonableness of accounting estimates made by Management, as well as evaluating the overall presentation of the Consolidated Financial
Statements and the Parent Company Financial Statements. We believe that the audit evidence we have obtained is sufficient and appropriate to provide a basis for our audit opinion. The audit has not resulted in any qualification.
opinionIn our opinion, the Consolidated Financial Statements and the Parent Company Financial Statements give a true and fair view of the Group’s and the Parent Company’s financial position at 31 December 2013 and of the results of the Group’s and the Parent Company’s operations and the Group’s cash flows for the financial year 1 January - 31 December 2013 in accordance with the Danish Financial Statements Act.
Statement on director’s ReportWe have read the Director’s Report in accordance with the Danish Financial Statements Act. We have not performed any procedures additional to the audit of the Consolidated Financial Statements and the Parent Company Financial Statements. On this basis, in our opinion, the information provided in Director’s Report is consistent with the Consolidated Financial Statements and the Parent Company Financial Statements.
Copenhagen, 6 March 2014
PricewaterhouseCoopersStatsautoriseret Revisionspartnerselskab
John van der Weerd, State Authorised Public AccountantRasmus Friis Jørgensen, State Authorised Public Accountant
inDepenDent aUDitoR’s RepoRts

56 fInanCIal status BoarD of DIreCtors anD eXeCutIVe BoarD
pETER HØJLANd, BSc in International Business, Chairman, Chairman of the board of Bikubenfonden, Copenhagen Capacity - Fonden til Markedsføring og Erhvervsfremme i Hovedstadsregionen, Soldaterlegatet and Siemens A/S, Deputy Chairman of the board of Hjerteforeningen and on the boards of Frederiksberg Fonden and The Denmark-America Foundation. JEFF gRAVENHORST, MSc Bus. Adm. and Auditing, Deputy Chairman, Group CEO of ISS A/S, Member of the board of Danish Crown A/S and Statsaut. revisor Ove Haugsted og hustru Lissi Haugsteds familiefond. Member of the central board of the Confederation of Danish Industry (DI) and DI’s Permanent Committee on Business Policies. mERETE HELENE ELdRUp, MSc Economics, CEO TV 2 DANMARK A/S, Deputy Chairman of the board of Gyldendal A/S, Member of the board of Nykredit A/S. NIELS dE CONINCK-SmITH, MSc and MBA, Chairman of the boards of Royal Greenland A/S, Orifarm A/S, Rayner&Keeler Ltd and Encase Limited. Member of the boards of Dovista A/S, Decon Advisory Limited, ncs 4 A/S and Nordic Aviation Capital A/S. pER NIELSEN, MSc (Eng), Chairman of the board of Waterjet AB and member of the boards of Infobric AB, European International Contractors EIC and DPR FCI Construction AB. Senior Advisor to NCC AB. ØyVINd ISAKSEN, MSc. (PhD), Chairman of the board of EPSIS AS. STEEN NØRbÆK mAdSEN, BSc (Eng)*, Head of Department, Rambøll Danmark A/S, employee representative at the board of Rambøll Danmark A/S. ANdERS RyTTER, MSc (Civ.Eng.), PhD*, Head of Department, Rambøll Danmark A/S. STEEN CHRISTENSEN, Grad. Dipl. in Business Administration (Org.), Advanced Com. Studies (Strategy)*, Business Manager, Rambøll Management Consulting A/S. *Elected by the employees.
NON-EXECUTIVE dIRECTORStop image (from left): Øyvind Isaksen Merete helene eldrupniels De Coninck-smithsteen nørbæk MadsenBottom image (from left):anders rytterjeff gravenhorstpeter højland (Chairman)per nielsensteen Christensen
boaRD of DiRectoRs

57annual report 2013
JENS-pETER SAULMSc (Eng)Managing Director and Chief Executive Officer, Ramboll Group A/S Chairman of the board of the Danish-German Chamber of Commerce Member of the Permanent Committee on Business Policies of the Confederation of Danish Industry
SØREN HOLm JOHANSENMSc (Econ)Executive Director, Markets and Global Practices, Ramboll Group A/SMember of the board of Federation of Danish Knowledge Advisors
KNUT AKSELVOLLMSc (Mech. Eng.), PhD (Mech. Eng.)Executive Director, Country Units, Ramboll Group A/S
mICHAEL ROSENVOLdMSc (Business Economics and Auditing)Chief Financial Officer, Ramboll Group A/SMember of the Permanent Committee on Tax Policy of the Confederation of Danish Industry
EXECUTIVE dIRECTORS from left: Michael rosenvoldsøren holm johansenjens-peter saulKnut akselvoll
eXecUtive boaRD

58 fInanCIal status group DIreCtors’ foruM
1
4
7
10
13
2
5
8
11
14
3
6
9
12
15
1716

editors: jens-peter saul and Michael rosenvoldgroup finance and accounting: lars Devantier Kallestrup and Charlotte Mersebachgroup Communications and Branding: Morten peick and roos nederveen jørgensenWriters:Kristine Barenholdt Bruun, louise riis Kibsgaard, Martin Zoffmann, Morten lund, Karen Klarskovart Director: lone olaiphotographers: Morten larsen, Carsten snejbjerg/polfoto, lars hansen/polfoto, social stock/topfoto, esben Zøllner olesen/scanpix, lars laursen/scanpix, Michael Daugaard/scanpix, yadid levy/scanpix, alex Bartel/science photo library, ruta saulyte-laurinavicieneprinters: Cool gray a/s.
gRoUp DiRectoRs’ foRUMJENS-pETER SAUL, Group Chief Executive Officer 1SØREN HOLm JOHANSEN, Group Executive Director, Markets and Global Practices 2KNUT AKSELVOLL, Group Executive Director, Country Units 3mICHAEL ROSENVOLd, Group Chief Financial Officer 4RObERT ARpE, Managing Director, Denmark 5bENT JOHANNESSON, Managing Director, Sweden 6OLE-pETTER THUNES, Managing Director, Norway 7mARKKU mOILANEN, Managing Director, Finland 8STEVE CANAdINE, Managing Director, United Kingdom 9JOHN SØRENSEN, Managing Director, Oil & Gas 10THOmAS RANd, Managing Director, Energy 11TONNy JOHANSEN, Managing Director, Management Consulting 12yAVER AbIdI, Managing Director, New Markets 13LARS OSTENFELd RIEmANN, Group Market Director, Buildings 14ALAN pAULINg, Group Market Director, Transport 15NEEL STRØbÆK, Group Market Director, Environment 16SØREN CARLSEN, Group Director, HR 17
ramboll group a/s Danish CVr no. 10160669 City of Copenhagen, Denmark Date of annual general Meeting 26 March 2014

WWW.raMBoll.CoM