Aquatic Life Water Quality Criteria Derived via the UC ...
37
Aquatic Life Water Quality Criteria Derived via the UC Davis Method: III. Diuron Tessa L. Fojut, Amanda J. Palumbo, and Ronald S. Tjeerdema 1 Introduction Diuron is a phenylurea herbicide that has been frequently detected in surface waters (the US Environmental Protection Agency, USEPA 2003), including periods when relatively low amounts were used, because it is moderately persistent in the water column (Ensminger et al. 2008). Diuron poses a risk to aquatic life because it, and other herbicides, can cause adverse effects on algae and vascular plants, which are the foundation of the aquatic food chain. Water quality standards are used to regulate pesticides in surface waters, and these standards are typically based on water quality criteria for the protection of aquatic life. When pesticide concentrations do not exceed water quality criteria, no adverse effects on aquatic life are expected. The derivation of acute and chronic water quality criteria for diuron using a new methodology developed by the University of California, Davis (TenBrook et al. 2010), is described in this chapter. The UC Davis methodology (UCDM) was designed to be more flexible than the USEPA method (1985) for deriving water quality criteria, although many aspects of the methods are similar. 2 Data Collection and Evaluation Diuron (N 0 -(3,4-dichlorophenyl)-N, N-dimethylurea) is a phenylurea herbicide that is moderately soluble in water. Based on its physical–chemical properties, the herbicide is not likely to partition to sediments or to volatilize (Table 1), and it is considered to be moderately persistent because it is stable to hydrolysis (Table 2). T.L. Fojut (*) • A.J. Palumbo • R.S. Tjeerdema Department of Environmental Toxicology, College of Agricultural and Environmental Sciences, University of California, Davis, CA 95616-8588, USA e-mail: [email protected] R.S. Tjeerdema (ed.), Aquatic Life Water Quality Criteria for Selected Pesticides, Reviews of Environmental Contamination and Toxicology 216, DOI 10.1007/978-1-4614-2260-0_3, # Springer Science+Business Media, LLC 2012 105
Transcript of Aquatic Life Water Quality Criteria Derived via the UC ...

Aquatic Life Water Quality Criteria Derived
via the UC Davis Method: III. Diuron
Tessa L. Fojut, Amanda J. Palumbo, and Ronald S. Tjeerdema
1 Introduction
Diuron is a phenylurea herbicide that has been frequently detected in surface waters
(the US Environmental Protection Agency, USEPA 2003), including periods when
relatively low amounts were used, because it is moderately persistent in the water
column (Ensminger et al. 2008). Diuron poses a risk to aquatic life because it, and
other herbicides, can cause adverse effects on algae and vascular plants, which are
the foundation of the aquatic food chain. Water quality standards are used to
regulate pesticides in surface waters, and these standards are typically based on
water quality criteria for the protection of aquatic life. When pesticide
concentrations do not exceed water quality criteria, no adverse effects on aquatic
life are expected. The derivation of acute and chronic water quality criteria for
diuron using a new methodology developed by the University of California, Davis
(TenBrook et al. 2010), is described in this chapter. The UC Davis methodology
(UCDM) was designed to be more flexible than the USEPA method (1985) for
deriving water quality criteria, although many aspects of the methods are similar.
2 Data Collection and Evaluation
Diuron (N0-(3,4-dichlorophenyl)-N, N-dimethylurea) is a phenylurea herbicide that
is moderately soluble in water. Based on its physical–chemical properties, the
herbicide is not likely to partition to sediments or to volatilize (Table 1), and it is
considered to be moderately persistent because it is stable to hydrolysis (Table 2).
T.L. Fojut (*) • A.J. Palumbo • R.S. Tjeerdema
Department of Environmental Toxicology, College of Agricultural and Environmental Sciences,
University of California, Davis, CA 95616-8588, USA
e-mail: [email protected]
R.S. Tjeerdema (ed.), Aquatic Life Water Quality Criteria for Selected Pesticides,Reviews of Environmental Contamination and Toxicology 216,
DOI 10.1007/978-1-4614-2260-0_3, # Springer Science+Business Media, LLC 2012
105

Approximately 86 original studies on the effects of diuron on aquatic life were
identified and reviewed. These studies are available in the open literature or may be
requested from the USEPA or the California Department of Pesticide Regulation
(CDPR). Studies that fell into three categories were evaluated according to the
UCDM: (1) single-species effects, (2) ecosystem-level studies, and (3) terrestrial
wildlife studies.
According to the UCDM scheme, single-species effect studies were rated for
relevance and reliability, in a manner which was summarized by Palumbo et al.
(2012). Studies that were rated as relevant (R) or less relevant (L) were also rated
for reliability, whereas those that were rated as not relevant (N) were not further
rated. There were three categories of study reliability: reliable (R), less reliable (L),
or not reliable (N). The reliability ratings were determined by how many test
parameters (e.g., nominal concentrations, source of dilution water, etc.) were
reported, and if they were acceptable according to standard methods. Studies
were then assigned a two-letter code in which their degree of relevance and
reliability were rated. Studies that were rated not relevant (N) or not reliable (RN
or LN) were not used for criteria derivation. All data rated as acceptable (RR) or
supplemental (RL, LR, LL) for criteria derivation are summarized in Tables 3–7.
Acceptable data rated as relevant and reliable (RR) were used for numeric criteria
derivation. Supplemental data that were rated as less relevant and/or less reliable
(RL, LR, or LL) for particularly sensitive, threatened, or endangered species were
compared to the criteria to ensure protection of these species. Data summary records
Table 1 Physical–chemical properties of diuron
Molecular weight 233.10
Density 1.4 g/mL (IUPAC 2008)
Water solubility 38 mg/L (geomean, n ¼ 2; Tomlin 2003; IUPAC 2008)
Melting point 158�C (Lide 2003)
Vapor pressure 1.15 � 10�3 mPa (IUPAC 2008)
Henry’s constant (KH) 173,205 Pa m3 mol�1 (geomean, n ¼ 2; Mackay et al. 2006; IUPAC 2008)
Log Koca 2.61 (geomean, n ¼ 20; Mackay et al. 2006)
Log Kowb 2.78 (geomean, n ¼ 3; Hansch et al. 1995; Sangster Research
Laboratories 2008; IUPAC 2008)aLog-normalized organic carbon–water partition coefficientbLog-normalized octanol–water partition coefficient
Table 2 Environmental fate of diuron
Half-life Water Temp (�C) pH Reference
Hydrolysis >4 months Phosphate buffer 20 5–9 Mackay et al. (2006)
Stable Sterile buffer 25 5, 7, 9 USEPA (2003)
Aqueous
photolysis
2.25 h Distilled NR NR Mackay et al. (2006)
43 days NR NR NR USEPA (2003)
Biodegradation
(aerobic)
~20 days Filtered sewage water 20 NR Mackay et al. (2006)
NR not reported
106 T.L. Fojut et al.

Table
3Final
acute
toxicitydatasetfordiuron
Species
Testtype
Meas/
Nom
Chem
ical
grade(%
)
Duration
(h)
Tem
p
(�C)
Endpoint
Age/size
LC/EC50(mg/L)
(95%
CI)
Reference
Dap
hnia
mag
naS
Nom
80.0
48
19.9
Mortality/
immobility
<24h
12,000
(10,000–13,000)
Baer(1991)
Daphn
iapulex
SR
Meas
99.8
96
22
Mortality
5days
17,900
(14,200–22,600)
Nebeker
andSchuytema
(1998)
Hyalellaazteca
SR
Meas
99.8
96
22
Mortality
<11days
19,400
(17,700–21,300)
Nebeker
andSchuytema
(1998)
AllstudieswereratedRR(dataratedas
acceptable)
SStatic,SRstatic
renew
al,FTflowthrough
Aquatic Life Water Quality Criteria Derived via the UC Davis Method: III. Diuron 107

Table
4Final
chronic
planttoxicitydatasetfordiuron
Species
Test
type
Meas/
Nom
Chem
ical
grade(%
)Duration
Tem
p(�C)
Endpoint
Age/size
NOECa
(mg/L)
LOECb
(mg/L)
MATCc
(mg/L)
EC50(mg/L)
(95%
CI)
Reference
Lem
nagibb
aG3
SMeas
99.1
7days
24.7
Growthinhibition
(biomass
yield),
relative
growth
rate
(biomass)
Plantwith
4 fronds
2.47
8.11
4.48
14.4 (9
.26–19.6)d
Ferrell
(2006)
Naviculapelliculosa
SNom
99.1
72h
22–24
Growthinhibition
(biomass)
Cells
11
33
19.1
22(9–56)
Dengler
(2006b)
N.pelliculosa
SNom
99.1
72h
22–24
Growthinhibition
(growth
rate)
Cells
11
33
19.1
65(33–160)
Dengler
(2006b)
N.pelliculosa
Growthinhibition
19.1
Geomean
Pseudokirchneriella
subcapitata
(form
erly
Selenastrum
capricornutum
Printz)
SMeas
96.8
120h
24
Growthinhibition
2-day-old
algal
cells
1.3
2.5
1.8
2.9
(2.5–3.5)
Blasberg
etal.
(1991)
Scenedesmus
obliqu
usS
Nom
Technical
24h
21
Growthinhibition
Algal
cells
NR
NR
NR
10
Geoffroy
etal.
(2002)
Synechococcus
leop
oliensis
SNom
99.1
72h
22–25
Growthinhibition
(biomass)
Algal
cells
3.7
11
6.4
26(4–100)
Dengler
(2006a)
AllstudieswereratedRR
SStatic,SRstatic
renew
al,FTflowthrough,NRnotreported,n/anotapplicable
Speciesmeanchronic
valueisin
bold
aNo-observed
effect
concentration
bLowest-observed
effect
concentration
cMaxim
um
acceptable
toxicantconcentration
dEC50based
onbiomassyield
endpoint
108 T.L. Fojut et al.

Table
5Final
chronic
anim
altoxicitydatasetfordiuron
Species
Test
type
Meas/
Nom
Chem
ical
grade(%
)
Duration
(days)
Tem
p
(�C)
Endpoint
Age/size
NOEC
(mg/L)
LOEC
(mg/L)
MATC
(mg/L)
Reference
Chiron
omus
tentans
SR
Meas
99.8
10
24
Mortality
2days,first
instar
1,900
3,400
2,540
Nebeker
and
Schuytema
(1998)
Daph
nia
pulex
SMeas
99.8
7NR
Reducednumber
of
young/m
ortality
5days
4,000.0
7,700
5,550
Nebeker
and
Schuytema
(1998)
Hyalellaazteca
SR
Meas
99.8
10
22
Mortality/reduced
weight
<11days
7,900
15,700
11,140
Nebeker
and
Schuytema
(1998)
Lum
briculus
variegatus
SR
Meas
99.8
10
23
Reducedweight
Small,short
adults
1,800
3,500
2,510
Nebeker
and
Schuytema
(1998)
Physa
gyrina
SR
Meas
99.8
10
24
Reducedweight
2days,first
instar
13,400
22,800
17,480
Nebeker
and
Schuytema
(1998)
Pimepha
les
promelas
FT
Meas
98.6
64
25
Deform
ity,mortality
Eggs<24h,
hatched
fry
33.4
78
51
Callet
al.(1983,
1987)
Pseuda
crisregilla
SR
Meas
99.8
14
20
Tadpole
14,500
21,100
17,490
(continued)
Aquatic Life Water Quality Criteria Derived via the UC Davis Method: III. Diuron 109

Table
5(continued)
Species
Test
type
Meas/
Nom
Chem
ical
grade(%
)
Duration
(days)
Tem
p
(�C)
Endpoint
Age/size
NOEC
(mg/L)
LOEC
(mg/L)
MATC
(mg/L)
Reference
Growth
inhibition
(length)
Schuytemaand
Nebeker
(1998)
Ran
aau
rora
SR
Meas
99.8
720
Growth
inhibition
(wet
weight)
Tadpole
7,600
14,500
10,500
Schuytema
andNebeker
(1998)
Ran
acatesbeian
aSR
Meas
99.8
21
24
Growth
inhibition
(dry
weight)
Tadpole
11,690a
16,430a
12,450a
Schuytemaand
Nebeker
(1998)
Xenopu
slaevis
SR
Meas
99.8
4days
24
Growth
inhibition
(length)
Embryo
10,490b
20,540b
14,680b
Schuytemaand
Nebeker
(1998)
AllstudieswereratedRR
Sstatic,SRstatic
renew
al,FTflowthrough,NRnotreported
aSMCVcalculatedfrom
threevalues
bSMCVcalculatedfrom
twovalues
110 T.L. Fojut et al.

Table
6Acceptable
excluded
dataratedRRwithgiven
reasonforexclusion
Species
Test
type
Meas/
Nom
Chem
ical
grade(%
)Duration
Tem
p
(�C)
Endpoint
Age/size
LC/EC50(mg/L)
(95%
CI)
MATC
(mg/L)
Reference
Reason
for
exclusion
Chiron
omus
tentans
SR
Meas
99.8
10days
24
Reducedweight
2days,first
instar
–4,910
Nebeker
and
Schuytema
(1998)
A
Dap
hnia
magn
aS
Nom
80.0
24h
19.9
Mortality/
immobility
<24h
68,000
(55,000–86,000)
–Baer(1991)
D
Lem
nagibba
G3
SMeas
99.1
7days
24.7
Growth
inhibition
(biomass)
Plantwith
4fronds
15.7
(10.06–20.8)
4.48
Ferrell(2006)
A
L.gibb
aG3
SMeas
99.1
7days
24.7
Growth
inhibition
(frondcount)
Plantwith
4fronds
19.1
(13.4–24.8)
14.47
Ferrell(2006)
A
L.gibb
aG3
SMeas
99.1
7days
24.7
Growth
inhibition
(frondcount
yield)
Plantwith
4fronds
17.5
(11.8–23.2)
14.47
Ferrell(2006)
A
L.gibb
aG3
SMeas
99.1
7days
24.7
Relativegrowth
rate
(frond
count)
Plantwith
4fronds
–14.5
Ferrell(2006)
A
P.promelas
SR
Meas
99.8
7days
25
Reducedweight
2.5
days
embryo
–5,900
Nebeker
and
Schuytema
(1998)
C
P.promelas
SR
Meas
99.8
10days
24
Mortality
1.5
months
juvenile
–23,280
Nebeker
and
Schuytema
(1998)
B
Pseud
acris
regilla
SR
Meas
99.8
10days
20
Increased
deform
ity
Embryo
–20,540
Schuytemaand
Nebeker
(1998)
A
(continued)
Aquatic Life Water Quality Criteria Derived via the UC Davis Method: III. Diuron 111

Table
6(continued)
Species
Test
type
Meas/
Nom
Chem
ical
grade(%
)Duration
Tem
p
(�C)
Endpoint
Age/size
LC/EC50(mg/L)
(95%
CI)
MATC
(mg/L)
Reference
Reason
for
exclusion
P.regilla
SR
Meas
99.8
14days
20
Growth
inhibition
(wet
weight)
Tadpole
–24,720
Schuytemaand
Nebeker
(1998)
A
P.regilla
SR
Meas
99.8
14days
20
Growth
inhibition
(dry
weight)
Tadpole
–24,750a
Schuytemaand
Nebeker
(1998)
A
Ran
a catesbeian
aSR
Meas
99.8
21days
24
Growth
inhibition
(length)
Tadpole
–18,950a
Schuytemaand
Nebeker
(1998)
A
R.catesbeiana
SR
Meas
99.8
21days
24
Growth
inhibition
(wet
weight)
Tadpole
–22,560a
Schuytemaand
Nebeker
(1998)
A
Synecho
coccus
leop
oliensis
SNom
99.1
72h
22–25
Growth
inhibition
(growth
rate)
Algal
cells
–19.1
Dengler(2006a)
A
Xenopu
slaevis
SR
Meas
99.8
4days
24
Deform
ity
Embryo
–22,560
Schuytemaand
Nebeker
(1998)
A
Reasonsforexclusion
A.Less-sensitiveendpoint
B.Less-sensitivelife
stage
C.Testtypenotpreferred
(staticvs.flowthrough)
D.Notthemostsensitiveorappropriateduration
aSMCVcalculatedfrom
twovalues
112 T.L. Fojut et al.

Table
7SupplementaldiurondataratedRL,LR,LLwithgiven
reasonforratingandexclusion(listedat
theendoftable)
Species
Test
type
Meas/
Nom
Chem
ical
grade(%
)Duration
Tem
p
(�C)
Endpoint
Age/size
LC/EC50(mg/
L)(95%
CI)
MATC(mg/L)
Reference
Rating/
reason
Achnanthes
brevipes
SNom
Technical
3days
20
Reducedoxygen
evolution
Algal
cells
24(SE¼
1.0)
–Hollisterand
Walsh
(1973)
LL/1,2,6
Americam
ysis
bahia
FT
Meas
96.8
28days
25.3
Number
of
young
surviving
<24hjuvenile
–1,400
Wardand
Boeri
(1992b)
RL/2
Amphoraexigua
SNom
Technical
3days
20
Reducedoxygen
evolution
Algal
cells
31(SE¼
4)
–Hollisterand
Walsh
(1973)
LL/1,2,6
Apium
nodiflorum
SNom
>99
14days
NR
Relativegrowth
rate
Single
stem
nodewith
leaf
2.808
NOEC¼
0.05
Lam
bertet
al.
(2006)
LL/1,5,6
A.no
diflo
rum
SNom
>99
14days
NR
Growth
inhibition
(roots)b
Single
stem
nodewith
leaf
0.00026
NOEC<
0.0005
Lam
bertet
al.
(2006)
LL/1,5,6,
7
A.no
diflo
rum
SNom
>99
14days
NR
Changein
chlorophyll
fluorescence
ratio
Single
stem
nodewith
leaf
>5.0
NOEC¼
5Lam
bertet
al.
(2006)
LL/1,5,6
Artem
iasalina
SNR
NR
24h
25
Mortality
Instar
II–III
larvae
12,010
(11,420
–12,100)
–Koutsaftisand
Aoyam
a
(2007)
LL/2,5
Asellus
brevicaudu
sS
Nom
95.0
96h
15
Mortality
Mature
15,500
(7,200–
33,400)
–Johnsonand
Finley
(1980)
LL/5,6
Cha
ravulgaris
SNom
>99
14days
NR
Relativegrowth
rate
Terminal
lengthsof
shootswith
3nodes
0.35
NOEC¼
0.0005
Lam
bertet
al.
(2006)
LL/1,5,6
(continued)
Aquatic Life Water Quality Criteria Derived via the UC Davis Method: III. Diuron 113

Table
7(continued)
Species
Test
type
Meas/
Nom
Chem
ical
grade(%
)Duration
Tem
p
(�C)
Endpoint
Age/size
LC/EC50(mg/
L)(95%
CI)
MATC(mg/L)
Reference
Rating/
reason
C.vulgaris
SNom
>99
14days
NR
Changein
chlorophyll
fluorescence
ratio
Terminal
lengthsof
shootswith
3nodes
4.033
NOEC¼
0.5
Lam
bertet
al.
(2006)
LL/1,5,6
Chlam
ydom
onas
moewusii
Gerloff
SNom
80.0
7days
21
Growth
inhibition
7-day-old
algal
cellstock
559.44
–CainandCain
(1983)
RL/1,6
Chlam
ydom
onas
sp.
SNom
Technical
3days
20
Reducedoxygen
evolution
Algal
cells
37(SE¼
3)
–Hollisterand
Walsh
(1973)
LL/1,2,6
Chlam
ydom
onas
sp.
SNom
99.8
20min
21.5
Changein
chlorophyll
fluorescence
ratio
2–4-w
eek-old
algal
cells
10.8
(8.5–13.6)
0.22
Podola
and
Melkonian
(2005)
RL/1,5,8
Chlorella
pyrenoidosa
SNom
95.0
4days
25
Growth
inhibition
Algal
cells
25
–Mauleand
Wright
(1984)
LR/1,6
C.pyrenoidosa
SNom
50.0
96h
25
Growth
inhibition
Algal
cells
1.3
–Maet
al.
(2001),Ma
(2002)
LL/1,3,6
Chlorella
sp.
SNom
Technical
10days
20.5
Growth
inhibition
Algal
cells
EC66¼
4–
Ukeles
(1962)
LL/1,2,6
Chlorella
sp.
SNom
Technical
3days
20
Reducedoxygen
evolution
Algal
cells
19(SE¼
2)
–Hollisterand
Walsh
(1973)
LL/1,2,6
114 T.L. Fojut et al.

Chlorella
vulgaris
SNom
50.0
96h
25
Growth
inhibition
Algal
cells
4.3
–Ma(2002)
LL/1,3,6
C.vulgaris
SAG211-11b
SNom
99.8
20min
21.5
Changein
chlorophyll
fluorescence
ratio
2–4-w
eek-old
algal
cells
27.4
(21.1–
35.5)
0.22
Podola
and
Melkonian
(2005)
RL/1,8
Chlorococcumsp.
SNom
Technical
7days
20
Growth
inhibition
Algal
cells
EC62¼
10
NOEC
<1.0
Walsh
and
Grow
(1971)
RL/1,2
Chlorococcumsp.
SNom
Technical
10days
20
Growth
inhibition
Algal
cells
10
–Walsh
(1972)
RL/1,2
Chlorococcumsp.
SNom
Technical
90min
20
Reducedoxygen
evolution
Algal
cells
20
–Walsh
(1972)
RL/1,2
Chlorococcumsp.
SNom
Technical
3days
20
Reducedoxygen
evolution
Algal
cells
20(SE¼
4)
–Hollisterand
Walsh
(1973)
LL/1,2,6
Crassostrea
virginica
FT
Meas
96.8
96h
23
Shelldeposition
Neonates,
<24h
4,800(4,400–
5,200)
NOEC
¼2,400
Wardand
Boeri
(1991)
RL/2
Cryptom
onas
sp.
SNom
99.8
20min
21.5
Changein
chlorophyll
fluorescence
ratio
2–4-w
eek-old
algal
cells
6.4
(5.3–7.8)
0.22
Podola
and
Melkonian
(2005)
RL/1,5,8
Cteno
phary-
ngodon
idella
FT
NR
100.0
96h
13
Mortality
1+year,15.8
g,
9.5
cm
31,000
(28,000
–34,000)
–Toobyet
al.
(1980)
LL/1,5,6
Cyclotellana
naS
Nom
Technical
3days
20
Reducedoxygen
evolution
Algal
cells
39(SE¼
7)
–Hollisterand
Walsh
(1973)
LL/1,2,6
Cyprino
don
variegates
FT
Meas
96.8
32days
30
Mortality
<24h
–2,500
Wardand
Boeri
(1992a)
RL/2
(continued)
Aquatic Life Water Quality Criteria Derived via the UC Davis Method: III. Diuron 115

Table
7(continued)
Species
Test
type
Meas/
Nom
Chem
ical
grade(%
)Duration
Tem
p
(�C)
Endpoint
Age/size
LC/EC50(mg/
L)(95%
CI)
MATC(mg/L)
Reference
Rating/
reason
Dap
hnia
mag
naS
Nom
Technical
26h
21.1
Mortality/
immobility
Firstinstar
47,000
(41,600
–53,100)
–Crosbyand
Tucker
(1966)
LL/1,5,6
Dap
hnia
pulex
SNom
95.0
48h
15
Mortality/
immobility
Firstinstar
1,400(1,000–
1,900)
–Johnsonand
Finley
(1980)
LL/5,6
Dun
aliella
euchlora
Lerche
SNom
Technical
10days
20.5
Growth
inhibition
Algal
cells
EC56¼
0.4
–Ukeles
(1962)
LL/1,2,6
Dun
aliella
tertiolecta
SNom
99.0
96h
20
Growth
inhibition
Algal
cells
5.9
–Gatidouand
Thomaidis
(2007)
LL/2,5
D.tertiolecta
SNom
Technical
3days
20
Reducedoxygen
evolution
Algal
cells
10(SE¼
3)
–Hollisterand
Walsh
(1973)
LL/1,2,6
D.tertiolecta
Butcher
SNom
Technical
10days
20
Growth
inhibition
Algal
cells
20
–Walsh
(1972)
RL/1,2
D.tertiolecta
Butcher
SNom
Technical
90min
20
Reducedoxygen
evolution
Algal
cells
10
–Walsh
(1972)
RL/2,6,8
Eud
orinaelegans
SNom
99.8
20min
21.5
Changein
chlorophyll
fluorescence
ratio
2–4-w
eek-old
algal
cells
13.2
(10.4–
16.9)
0.22
Podola
and
Melkonian
(2005)
RL/1,5,8
Gam
marus
fasciatus
SNom
Technical
24h
15.5
Mortality
Early
instar
2,500(1,000–
5,500)
–Sanders
(1970)
LL/1,5,6
G.fasciatus
SNom
Technical
48h
15.5
Mortality
Early
instar
1,800(800–
5,200)
–Sanders
(1970)
LL/1,5,6
G.fasciatus
SNom
Technical
96h
15.5
Mortality
Early
instar
700(190–
8,200)
–Sanders
(1970)
LL/1,5,6
116 T.L. Fojut et al.

Gam
marus
lacustris
SNom
Technical
24h
21.1
Mortality
2months
700(590–
8,300)
–Sanders
(1969)
LL/1,5,6
G.lacustris
SNom
Technical
48h
21.1
Mortality
2months
380
(290–500)
–Sanders
(1969)
LL/1,5,6
G.lacustris
SNom
Technical
96h
21.1
Mortality
2months
160
(130–190)
–Sanders
(1969)
LL/1,5,6
Isochrysis
galban
aS
Nom
Technical
3days
20
Reducedoxygen
evolution
Algal
cells
10(SE¼
3)
–Hollisterand
Walsh
(1973)
LL/1,2,6
I.ga
lbanaParke
SNom
Technical
90min
20
Reducedoxygen
evolution
Algal
cells
10
–Walsh
(1972)
RL/1,2,8
I.ga
lbanaParke
SNom
Technical
10days
20
Growth
inhibition
Algal
cells
10
–Walsh
(1972)
RL/1,2
Lem
nagibb
aG3
SNom
98.0
7days
25
Growth
inhibition
NR
29(27–31)
–Okam
ura
etal.
(2003)
LR/6
Lem
naminor
SNom
98.0
48h
21
Reducedoxygen
evolution
Plantfronds
–LOEC¼
5Eullaffroy
etal.
(2007)
LL/1,6,7
L.minor
1769
SNom
98.0
7days
25
Growth
inhibition
NR
30(28–31)
–Okam
ura
etal.
(2003)
LR/6
L.minor
SNom
98.0
7days
25
Growth
inhibition
Plantfronds
25
LOEC¼
5Teisseire
etal.
(1999)
RL/1,6
Lepom
ismacrochirus
SNom
Technical
96h
12.7
Mortality
0.6–1.5
g8,900(8,200–
9,600)
–Macek
etal.
(1969)
LL/1,5,6
L.macrochirus
SNom
Technical
96h
18.3
Mortality
0.6–1.5
g7,600(7,000–
8,200)
–Macek
etal.
(1969)
LL/1,5,6
L.macrochirus
SNom
Technical
96h
23.8
Mortality
0.6–1.5
g5,900(5,300–
6,500)
–Macek
etal.
(1969)
LL/1,5,6
(continued)
Aquatic Life Water Quality Criteria Derived via the UC Davis Method: III. Diuron 117

Table
7(continued)
Species
Test
type
Meas/
Nom
Chem
ical
grade(%
)Duration
Tem
p
(�C)
Endpoint
Age/size
LC/EC50(mg/
L)(95%
CI)
MATC(mg/L)
Reference
Rating/
reason
Lym
naea
spp.
SNom
NR
96h
NR
Mortality
Adult
15,300
–Christianand
Tate
(1983)
LL/1,3,6
Mon
ochrysis
lutheri
SNom
Technical
3days
20
Reducedoxygen
evolution
Algal
cells
18(SE¼
3)
–Hollisterand
Walsh
(1973)
LL/1,2,6
M.lutheriDroop
SNom
Technical
10days
20.5
Growth
inhibition
Algal
cells
EC100¼
0.02
–Ukeles
(1962)
LL/1,2,6
M.lutheriDroop
SNom
Technical
10days
20.5
Mortality
Early
instar
2,500(1,000–
5,500)
–Sanders
(1970)
LL/1,5,6
Myrioph
yllum
spicatum
SNom
>99
14days
NR
Relativegrowth
rate
Terminal
lengthsof
shootswith
3nodes
5NOEC
¼0.0005
Lam
bertet
al.
(2006)
LL/1,5,6
M.spicatum
SNom
>99
14days
NR
Changein
chlorophyll
fluorescence
ratio
Terminal
lengthsof
shootswith
3nodes
>5
NOEC
¼5
Lam
bertet
al.
(2006)
LL/1,5,6
Naviculaforcipata
SNom
99.0
96h
20
Growth
inhibition
Algal
cells
27
–Gatidouand
Thomaidis
(2007)
LL/2,5
Naviculainserta
SNom
Technical
3days
20
Reducedoxygen
evolution
Algal
cells
93(SE¼
12)
–Hollisterand
Walsh
(1973)
LL/1,2,6
Neochlorissp.
SNom
Technical
3days
20
Reducedoxygen
evolution
Algal
cells
28(SE¼
5)
–Hollisterand
Walsh
(1973)
LL/1,2,6
Nitzschia
(Ind.
684)
SNom
Technical
3days
20
Reducedoxygen
evolution
Algal
cells
169
(SE¼
17)
–Hollisterand
Walsh
(1973)
LL/1,2,6
118 T.L. Fojut et al.

Nitzschia
closterium
SNom
Technical
3days
20
Reducedoxygen
evolution
Algal
cells
50(SE¼
6)
–Hollisterand
Walsh
(1973)
LL/1,2,6
Oscillatoriacf.
chalybea
SNom
80.0
96h
25
Growth
inhibition
Algal
cells
28
LOEC¼
280
Schrader
etal.
(1998)
LR/1,6
Oncorhynchu
sclarki
(Salmo
clarki)
SNom
95.0
96h
10.0
Mortality
3.00g
1,400(1,100–
1,900)
–Johnsonand
Finley
(1980)
LL/5,6
Oncorhynchu
smykiss(Salmo
gairdn
eri)
SNom
95.0
96h
13
Mortality
0.8
g4,900(4,100–
5,900)
–Johnsonand
Finley
(1980)
LL/5,6
O.mykiss(Salmo
gairdn
eri)
SNom
80.0
96h
13
Mortality
1.2
g16,000
(11,300
–22,700)
–Johnsonand
Finley
(1980)
LL/5,6
O.mykiss
SNom
95
7days
10
Mortality
Juveniles,
hatched
<24hago
74,000
(29,000–
3,681,000)
–Okam
ura
etal.
(2002)
LR/1,6
O.mykiss
SNom
95
14days
10
Mortality
Juveniles,
hatched
<24hago
15,000
(11,000
–29,000)
–Okam
ura
etal.
(2002)
LR/1,6
O.mykiss
SNom
95
21days
10
Mortality
Juveniles,
hatched
<24hago
5,900(4,700–
7,700)
–Okam
ura
etal.
(2002)
LR/1,6
O.mykiss
SNom
95
28days
10
Mortality
Juveniles,
hatched
<24hago
230(8.9–590)
–Okam
ura
etal.
(2002)
LR/1,6
Pha
eoda
ctylum
tricornutum
SNom
Technical
3days
20
Reducedoxygen
evolution
Algal
cells
10(SE¼
3)
–Hollisterand
Walsh
(1973)
LL/1,2,6
P.tricornu
tum
Bohlin
SNom
Technical
90min
20
Reducedoxygen
evolution
Algal
cells
10
–Walsh
(1972)
RL/1,2,8
(continued)
Aquatic Life Water Quality Criteria Derived via the UC Davis Method: III. Diuron 119

Table
7(continued)
Species
Test
type
Meas/
Nom
Chem
ical
grade(%
)Duration
Tem
p
(�C)
Endpoint
Age/size
LC/EC50(mg/
L)(95%
CI)
MATC(mg/L)
Reference
Rating/
reason
P.tricornu
tum
Bohlin
SNom
Technical
10days
20
Growth
inhibition
Algal
cells
10
–Walsh
(1972)
RL/1,2
P.tricornu
tum
Bohlin
SNom
Technical
10days
20.5
Growth
inhibition
Algal
cells
EC21¼
0.4
–Ukeles
(1962)
LL/1,2,6
Pimepha
les
prom
elas
FT
Meas
98.6
96h
24.3
Mortality
30days
14,200
(13,400–
15,000)
–Callet
al.
(1983,
1987)
RL/1,5
Platymonas
sp.
SNom
Technical
3days
20
Reducedoxygen
evolution
Algal
cells
7(SE¼
3)
–Hollisterand
Walsh
(1973)
LL/1,2,6
Porph
yridium
cruentum
SNom
Technical
3days
20
Reducedoxygen
evolution
Algal
cells
24(SE¼
3)
–Hollisterand
Walsh
(1973)
LL/1,2,6
Protcoccussp.
SNom
Technical
10days
20.5
Growth
inhibition
Algal
cells
EC48¼
0.02
–Ukeles
(1962)
LL/1,2,6
Pseudokirch-
neriella
subcapitata
(Selenastrum
capricor-
nutum)
SNom
80.0
96h
25
Growth
inhibition
Algal
cells
36.4
LOEC¼
280
Schrader
etal.
(1998)
LR/1,6
P.subcapitata
(S.capricorn
utum
)
SNom
98.0
3days
25
Growth
inhibition
Algal
cells
6.6
(5.9–7.2)
–Okam
ura
etal.
(2003)
LL/5,6
P.subcapitata
(S.capricorn
utum
)
SNom
99.8
20min
21.5
Changein
chlorophyll
fluorescence
ratio
2–4-w
eek-old
algal
cells
13.8
(9.3–20.4)
0.22
Podola
and
Melkonian
(2005)
RL/1,8
120 T.L. Fojut et al.

P.subcapitata
(S.capricorn
utum
)
SNom
98
120h
24
Growth
inhibition
Algal
cells
22
NOEC¼
10
Douglasand
Handley
(1988)
RL/6
P.subcapitata
(S.capricorn
utum
)
SNom
98
72h
24
Growth
inhibition
Algal
cells
18
–Douglasand
Handley
(1988)
RL6
Pterona
rcys
californica
SNom
95.0
96h
15
Mortality
Secondyear
class
1,200(900–
1,700)
–Johnsonand
Finley
(1980)
LL/5,6
P.californica
SNom
Technical
24h
15.5
Mortality
30–35mm
3,600(2,800–
4,700)
–Sandersand
Cope
(1968)
LL/1,5,6
P.californica
SNom
Technical
48h
15.5
Mortality
30–35mm
2,800(2,100–
3,800)
–Sandersand
Cope
(1968)
LL/1,5,6
P.californica
SNom
Technical
96h
15.5
Mortality
30–35mm
1,200(870–
1,700)
–Sandersand
Cope
(1968)
LL1,5,6
Rap
hido
celis
subcapitata
SNom
50.0
96h
25
Growth
inhibition
Algal
cells
0.7
–Maet
al.
(2006)
LL/3,5,6
Salvelinus
namaycush
SNom
95.0
96h
10
Mortality
1.5
g2,700(2,400–
3,000)
–Johnsonand
Finley
(1980)
LL/5,6
Scenedesmus
obliqu
usS
Nom
50.0
96h
25
Growth
inhibition
Algal
cells
4.09
–Ma(2002)
LL/1,3,6
S.ob
liqu
usS
Nom
98.0
1min
22
Changein
chlorophyll
fluorescence
ratio
Algal
cells
1a
–Eullaffroyand
Vernet
(2003)
LL/1,4,6,
8
(continued)
Aquatic Life Water Quality Criteria Derived via the UC Davis Method: III. Diuron 121

Table
7(continued)
Species
Test
type
Meas/
Nom
Chem
ical
grade(%
)Duration
Tem
p
(�C)
Endpoint
Age/size
LC/EC50(mg/
L)(95%
CI)
MATC(mg/L)
Reference
Rating/
reason
Scenedesmus
quadricaud
aS
Nom
50.0
96h
25
Growth
inhibition
Algal
cells
2.7
–Ma(2003)
LL/1,3,6
Scenedesmus
subspicatus
SNom
Technical
24h
20
Growth
inhibition
Algal
cells,3-
day
old
NR
NOEC
¼4
Schafer
etal.
(1994)
LR/5,6
S.subspicatus
SNom
Technical
72h
20
Growth
inhibition
Algal
cells,3-
day
old
36
NOEC
¼10
Schafer
etal.
(1994)
LR/5,6
Scherffeliadu
bia
SNom
99.8
20min
21.5
Changein
chlorophyll
fluorescence
ratio
2–4-w
eek-old
algal
cells
3.9
(2.5–6.2)
0.22
Podola
and
Melkonian
(2005)
RL/1,8
Simocepha
lus
serrulatus
SNom
95.0
48h
15
Mortality
Firstinstar
2,000(1,400–
2,800)
–Johnsonand
Finley
(1980)
LL/5,6
Stau
rodesm
usconvergens
SNom
99.8
20min
21.5
Changein
chlorophyll
fluorescence
ratio
2–4-w
eek-old
algal
cells
4.1
(2.5–6.9)
0.22
Podola
and
Melkonian
(2005)
RL/1,5,8
Stau
roneis
amph
oroides
SNom
Technical
3days
20
Reducedoxygen
evolution
Algal
cells
31(SE¼
2)
–Hollisterand
Walsh
(1973)
LL/1,2,6
Synechocystissp.
SNom
99.8
20min
21.5
Changein
chlorophyll
fluorescence
ratio
2–4-w
eek-old
algal
cells
7.6
(5.5–10.5)
0.22
Podola
and
Melkonian
(2005)
RL/1,5,8
Tetraselmis
elegans
SNom
99.8
20min
21.5
Changein
chlorophyll
fluorescence
ratio
2–4-w
eek-old
algal
cells
3.0
(2.3–3.8)
0.22
Podola
and
Melkonian
(2005)
RL/1,8
122 T.L. Fojut et al.

Tha
lassiosira
fluviatilis
SNom
Technical
3days
20
Reducedoxygen
evolution
Algal
cells
95(SE¼
10)
–Hollisterand
Walsh
(1973)
LL/1,2,6
Ulothrixfim
briata
SNom
95.0
7days
25
Growth
inhibition
Algal
cells
540
–Mauleand
Wright
(1984)
LR/1,6
SStatic,SRstatic
renew
al,FTflowthrough,NRnotreported,95
%CI95%
confidence
interval,SE
standarderror
Reasonsforratings
1.Notastandardmethod
2.Saltwater
3.Low
chem
ical
purity
orpurity
notreported
4.Toxicityvaluenotcalculable
5.Controlnotdescribed
and/orresponse
notreported
6.Low
reliabilityscore
7.Endpointnotlinked
togrowth,reproduction,orsurvival
8.Inappropriatetestduration
aValuereported
astoxicitythreshold,whichisconceptually
verysimilar
toan
MATC,butcalculateddifferentlythan
anMATCoran
ECx
bGrowth
inhibitionofrootsisnotastandardendpoint
Aquatic Life Water Quality Criteria Derived via the UC Davis Method: III. Diuron 123

including the rationale for the scores and ratings were created for each study, all of
which are included in the Supporting Material (http://extras.springer.com/).
Because diuron is a herbicide, many of the single-species studies were plant
toxicity tests. Plant data are more difficult to interpret than animal data because a
variety of end points may be used, but the significance of each one is not clear.
According to the UCDM, all plant studies were considered as chronic because the
typical end points of growth or reproduction are inherently chronic. Only end points
of growth or reproduction (measured by biomass) and tests lasting at least 24 h had
the potential to be rated highly, and to be used for criteria calculation, which is in
accordance with standard methods (ASTM 2007a, 2007b, USEPA 1996). The four
main end points identified in plant toxicity tests are described below, including
whether the end point is clearly linked to survival, growth, or reproduction.
2.1 Growth Inhibition
All of these end points are evaluated relative to a control growth measurement.
Depending on the plant, the endpoint measurement may have been assessed by
direct cell counts with a hemacytometer, cell counts with a spectrophotometer, cell
counts with an electronic particle counter, chlorophyll concentration measured by
absorbance, turbidity measured by absorbance, or number of fronds (Lemna spp.).
In all cases, growth of exposed samples was compared statistically to controls.
2.2 Relative Growth Rate
The biomass of macrophytes was measured before and after exposure to calculate a
growth rate as (final mass–initial mass)/initial mass � 100. This end point is very
similar to growth inhibition, except that it is expressed as a positive effect while
growth inhibition is expressed as a negative effect. In all cases, the growth rate of
exposed samples was compared statistically to controls.
2.3 Change in Chlorophyll Fluorescence Ratio
Chlorophyll fluorescence was measured at a maximal fluorescence and either a
variable or steady-state fluorescence and a ratio were computed. An increase in the
ratio indicates a disruption of photosystem II (PSII), which may lead to a decrease
in carbohydrate production and thus decreased growth. With this end point, one
measures physiological stress in plants (Lambert et al. 2006). This ratio is a valid
measurement that is related to algal growth according to ASTM Standard Method
E1218-04 (ASTM 2004), but is described as being less definitive than measuring
124 T.L. Fojut et al.

chlorophyll a content, and is therefore not a preferred end point if one more directly
related to growth is available.
2.4 Reduced Oxygen Evolution
Plants evolve oxygen during photosynthesis, and reduced photosynthesis has been
shown by Walsh (1972) to correlate well with the concentrations that inhibit
growth, but it is not clear that this end point is a good predictor of growth inhibition
across all plant species. The value for this end point is always calculated as being
relative to controls.
To ensure that the derived criteria are protective of ecosystems and used all
available data, all multispecies mesocosm, microcosm, and ecosystem (field and
laboratory) studies that were rated as being acceptable and reliable (R) or less
reliable (L) were compared to the criteria. Studies on the effects of diuron on
mallard ducks were rated for reliability using the terrestrial wildlife evaluation
table. Mallard studies that were rated as being reliable (R) or less reliable (L) were
used to evaluate the bioaccumulation of diuron.
3 Data Reduction
The data reduction procedure is described by Palumbo et al. (2012). Multiple
toxicity values for diuron for the same species were reduced down to a species
mean acute value (SMAV) or a species mean chronic value (SMCV). Acceptable
(RR) data were excluded from the final data sets that were employed for criteria
calculations for the following reasons: more appropriate exposure durations were
available, flow-through tests are preferred over static tests, a test with a more
sensitive life stage of the same species was available, and tests with more sensitive
end points were available. Excluded data are given in Table 6. The final acute data
set contains three animal SMAVs (Table 3), the final chronic plant data set contains
three SMCVs (Table 4), and the final chronic animal data set contains ten SMCVs
(Table 5).
4 Acute Criterion Calculation
Although plants are more sensitive to diuron, the acute criterion was calculated
from acute animal toxicity data because plant toxicity tests are considered as being
chronic. Three SMAVs from two different taxa were available: planktonic
crustaceans (Daphnia magna and Daphnia pulex) and a benthic invertebrate
(Hyalella azteca). Because there were so few data, the acute criterion was not
Aquatic Life Water Quality Criteria Derived via the UC Davis Method: III. Diuron 125

calculated using a species sensitivity distribution (SSD). At least five data values
are required to fit an SSD to a data set, and the data must fulfill five different taxa
requirements (planktonic crustacean, benthic invertebrate, fish from the family
Salmonidae, warm water fish, and insect). Instead, the acute criterion was calcu-
lated using the assessment factor (AF) procedure (TenBrook et al. 2010). The AFs
in the UCDM were derived by randomly sampling 12 organic pesticide data sets to
give estimates of the median fifth percentile of a distribution (TenBrook et al.
2010). AFs are recognized as a conservative approach for dealing with uncertainty
in assessing risks posed by chemicals and are widely used in other methods for
deriving criteria.
The acute criterion was calculated by dividing the lowest SMAV (12 mg/L for
D. magna) from the acceptable (RR) data set by an AF. The magnitude of the AF
was determined by the number of taxa available in the data set. The acute data set
fulfilled two of the five taxa requirements, corresponding to an AF of 36 (TenBrook
et al. 2010). The acute value calculated using the AF represents an estimate of the
median fifth percentile of the SSD, which is the recommended acute value. The
recommended acute value is divided by a factor of 2 to calculate the acute criterion.
Because the toxicity datum used to calculate the criterion was presented in only two
significant figures, the criterion is rounded to two significant figures.
Acute value ¼ LowestSMAV
Assessment factor;
¼ 0:33 mg=L:(1)
Acute criterion ¼ Acutevalue
2;
¼ 0:17 mg=L (170 mg=L):(2)
5 Chronic Criterion Calculation
The chronic data demonstrate that plants are more sensitive to diuron than animals.
Because diuron is a herbicide and the data demonstrates that plants are the most
sensitive taxon, only plant data were used to derive the chronic criterion. The chronic
criterion is likely to also be protective of animals because they are less sensitive to
diuron. Four acceptable maximum acceptable toxicant concentrations (MATCs) and
five acceptable EC50s were available for vascular plants or alga. MATCs are
recommended for derivation of the chronic criterion because they approximate a
no-effect concentration (unlike EC50s). ECx toxicity values are not recommended
for chronic criteria derivation unless there is data for the relevant species indicating
what level of x corresponds to a no-effect level, which was not available for the
diuron data set. Since there were too few MATCs to fit a distribution to the data, the
chronic criterion was derived by setting the chronic criterion equal to the lowest
126 T.L. Fojut et al.

NOEC from an important alga or vascular aquatic plant species that has measured
concentrations and a biologically relevant end point (TenBrook et al. 2010). In this
scheme, the NOEC of 1.3 mg/L for the green algae Pseudokirchneriella subcapitata(formerly Selenastrum capricornutum) serves as the chronic criterion.
6 Water Quality Effects and Bioavailability
Temperature and pH do not appear to have a significant effect on the toxicity of
diuron, as it is only a very weak base and no such effects have been documented in
the literature. Because diuron has a moderate octanol–water partition coefficient
(log Kow ¼ 2.78), decreased bioavailability due to surface sorption is possible.
Knauer et al. (2007) demonstrated that the addition of black carbon (BC) in its
native form to water only slightly decreased the toxicity of diuron to the freshwater
green algae P. subcapitata (formerly S. capricornutum). BC is ubiquitous in the
environment because it is a product of incomplete combustion and can act as a
supersorbent for some organic contaminants as a result of its large surface area, but
it represents only a small fraction of total organic carbon, which is usually respon-
sible for the majority of sorption to solids. Studies in which the sorption of diuron to
dissolved organic carbon and clays were investigated are not currently available in
the literature, but sorption to these materials is also likely to inhibit bioavailability
in a similar manner as sorption to BC. Because there is little information regarding
which phases of diuron (freely dissolved, sorbed to dissolved organic carbon, or
sorbed to suspended solids) are bioavailable, it is recommended that criteria
compliance is based on whole water concentrations.
7 Chemical Mixtures
Diuron is a PSII inhibitor, as are all phenylurea herbicides. Other widely used
herbicides, such as the triazines, are also PSII inhibitors, but have different binding
sites than the phenylurea herbicides. The concentration addition model is
recommended because it has been tested and shown to successfully predict the
toxicity of compound mixtures that possess the same mode of action (Mount 2003).
It has been confirmed in several studies that the toxicity of a mixture of PSII-
inhibitor herbicides, including diuron, can be predicted by the concentration addi-
tion method (Arrhenius et al. 2004; Backhaus et al. 2004; Knauert et al. 2008).
When diuron is detected with other PSII-inhibitor herbicides, the toxicity of the
mixture should be predicted by the concentration addition model and used to
determine criteria compliance. If numeric water quality criteria are not available
for other PSII-inhibitor herbicides, the model cannot be used and diuron should be
considered alone.
Aquatic Life Water Quality Criteria Derived via the UC Davis Method: III. Diuron 127

The toxicity of diuron in mixtures with other chemicals that work by different
modes of action has been reported (e.g., Hernando et al. 2003; Walker 1965), but
interaction coefficients for multiple species have not been calculated. Therefore,
nonadditive mixture toxicity cannot yet be incorporated into criteria compliance.
Lydy and Austin (2005) demonstrated a nonadditive form of toxicity when mixtures
of diuron and organophosphate insecticides were tested; these authors found that
some acted as synergists with diuron. Teisseire et al. (1999) examined the
phytotoxicity of the herbicide combined with two fungicides (copper and folpet)
on duckweed (Lemna minor) because these pesticides are often used in combination
in vineyards. They found that growth inhibition from the combination of diuron and
copper depended on the concentrations of both chemicals used, whereas it only
depended on the herbicide’s concentration when combined with folpet. Diuron is
widely used as an antifouling biocide in paint for ship hulls and is often used in
combination with other antifouling agents. Several articles were found in which
researchers studied the toxicity of mixtures of diuron or diuron metabolites and
other antifouling agents, including Irgarol (cybutryne), Sea nine 211 (4, 5-dichloro-
2-n-octyl-3(2H)-isothiazolone), copper, chlorothalonil, copper pyrithione, zinc
pyrithione, and tri-n-butyltin (Chesworth et al. 2004; Fernandez-Alba et al. 2002;
Gatidou and Thomaidis 2007; Koutsaftis and Aoyama 2007; Manzo et al. 2008;
Molander et al. 1992). Resulting toxicities were synergistic, additive, or antagonis-
tic for different mixtures, and were sometimes dependent on concentration ratios
and how many compounds were in the mixture.
8 Sensitive Species
The derived criteria were compared to the most sensitive toxicity values in both the
acceptable (RR) and supplemental (RL, LR, LL) data sets to ensure that these
species are adequately protected. The lowest acute value in the data sets is 160 mg/Lfor the amphipod Gammarus lacustris (Sanders 1969), which is below the derived
acute criterion of 170 mg/L. This study was rated LL because the control response
was not reported, many other study details were not documented, and the test
concentrations were not measured. Additionally, data for another amphipod,
Gammarus fasciatus, is the next lowest acute value in the data set (700 mg/L),indicating that Gammarus species are particularly sensitive to diuron. Because the
G. lacustris toxicity value is based on nominal, instead of measured,
concentrations, the acute criterion was not adjusted downward. If measured data
that is highly rated becomes available for Gammarus species in the future, it shouldbe examined to determine if the acute criterion is protective of this sensitive genus.
Although there are several supplemental chronic data values that are below the
derived chronic criterion (1.3 mg/L), the criterion was not adjusted because the lowertoxicity values were lacking at least one of the following critical parameters: (1) the
use of an end point that directly related to survival, growth, or reproduction; (2) the
use of an exposure duration of �24 h (ASTM 2007a, 2007b; USEPA 1996);
128 T.L. Fojut et al.

(3) proper design of hypothesis tests and reporting of parameters used to evaluate the
reasonableness of the resulting toxicity values; (4) the use of diuron �80% purity;
and (5) the use of freshwater species. These studies are discussed in detail below.
The lowest measured chronic value in the data sets is an EC50 of 0.00026 mg/Lfor the rooted macrophyte Apium nodiflorum—for a nonstandard end point of root
growth (Lambert et al. 2006). This value was calculated by extrapolation, not
interpolation, is lower than the NOEC reported for this test, and is below the lowest
concentration tested; thus, it was not used for criterion adjustment. There are
several other NOECs reported in this study for an appropriate end point (relative
growth rate) that are below the proposed chronic criterion (0.0005–0.05 mg/L), butit was not possible to evaluate the reasonableness of these NOECs because the
control responses were not reported, the p-value selected was not reported, and a
minimum significant difference was not calculated.
Podola andMelkonian (2005) report NOEC and LOEC values of 0.1 and 0.5 mg/L,respectively, for nine different algae. These values are below the proposed criteria,
but this study used a less preferred end point, change in chlorophyll fluorescence,
and a nonstandard exposure duration of 20 min. The authors proposed the use of a
biosensor to detect and identify herbicides in the environment, and do not discuss the
link between the effects they quantify and survival, growth, or reproduction of the
algal strains. Similarly, Eullaffroy and Vernet (2003) reported a toxicity threshold of
1 mg/L for green algae, which is slightly below the chronic criterion. The exposure
duration was only 1 min, and its purpose was to rapidly detect herbicides in the
environment. This study did not follow a standard method, used extremely short
exposure durations, and did not include an acceptable toxicity value (e.g., NOEC,
LOEC, MATC, or ECx). Values from these studies cannot be directly related to
survival, growth, or reproduction, and probably only demonstrate exposure to
diuron, not adverse effects. Therefore, the chronic criterion was not adjusted down-
ward based on these data.
Ma et al. (2001) and Ma (2002) performed studies that contained the same data
for the alga Chlorella pyrenoidosa, an EC50 equal to the derived criterion. These
studies used diuron with a purity of 50% and did not report a control response. In
another study byMa et al. (2006), an EC50 below the derived criterion (0.7 mg/L) wasreported, but also used diuron of 50% purity. The low-purity compound used in these
tests precludes the use of them for criterion adjustment. One study that used saltwater
organisms (Ukeles 1962) reported toxicity values below the derived chronic criterion
(0.02 and 0.4 mg/L), but such organisms are suspected to have different sensitivities
than freshwater species; therefore, they are not used to derive or adjust freshwater
criteria.
9 Ecosystem-Level Studies
The chronic criterion was compared to multispecies studies to ensure that the results
from single-species studies are protective of multispecies systems. Ten mesocosm,
microcosm, or ecosystem (field and laboratory) studies were identified (Table 10),
Aquatic Life Water Quality Criteria Derived via the UC Davis Method: III. Diuron 129

which were almost all indoor or laboratory studies mimicking small river or pond
natural environments and in which microbial, phytoplanktonic, or bacterial
communities were examined. An initial drop in phytoplankton biomass was noted
in most of these studies, which led to a decrease in dissolved oxygen from the decay
of the phytoplankton.
Planktonic communities have displayed varying degrees of response to diuron,
depending on, among other things, the concentrations applied. Hartgers et al.
(1998) set up microcosms containing phyto-, peri-, bacterio-, and zoo-plankton
and monitored them for a 28-day exposure to a mixture of diuron, atrazine, and
metolachlor, followed by a 28-day recovery period. An NOEC for the mixture
based on phytoplankton was determined to be 1.5 mg/L diuron; thus, the criterion of
1.3 mg/L would likely be protective of phytoplankton based solely on diuron. Flum
and Shannon (1987) reported a 96-h EC50 of 2,205 mg/L (1,630–3,075 mg/L 95%
CI) for an artificial microecosystem containing zooplankton, amphipods, ostracods,
unicellular and filamentous algae, protozoans, and microbes, which is much higher
than the derived chronic criterion. The EC50 was based on monitoring the redox
potential, pH, and dissolved oxygen as a measure of toxicity.
Planktonic and algal communities exposed to diuron have been studied in regard
to the aquaculture industry because some algae give fish an “off” flavor, yet
plankton is necessary for healthy ponds. Zimba et al. (2002) assessed the effect of
9 weeks of diuron application (10 mg/L) on catfish pond ecology. The only signifi-
cant effect from the exposure was a change in the phytoplankton composition; its
biomass was not altered. Perschbacher and Ludwig (2004) also studied plankton
communities in outdoor pool mesocosms simulating aquaculture ponds. Three
diuron concentrations were tested and monitored for 4-weeks post application.
Diuron depressed primary production and biomass of phytoplankton for at least
4-weeks post application, which in turn caused a decrease in dissolved oxygen to
levels that are potentially lethal to fish. The concentrations were not measured, and
were reported as field rate (1.4 kg a.i./ha), 1/10 field rate, and 1/100 field rate of
Direx without adjuvants.
Tlili et al. (2008) studied biofilm communities in a small river with chronic
exposure to 1 mg/L diuron, as well as 3-h pulses of 7 or 14 mg/L diuron with and
without prior exposure. The results indicate that photosynthesis was never signifi-
cantly inhibited by any of the treatments, but the pulses did alter the community
structure of the microalgae. The pulses affected the eukaryotic community structure
in microcosms that did not have prior chronic diuron exposure, but had no signifi-
cant impact on those that did have prior exposure. Dorigo et al. (2007) assessed
prokaryotic and eukaryotic communities and microalgae exposed to vineyard
runoff water in a small stream containing diuron concentrations of 0.09 and
0.43 mg/L. The diuron tolerance in these communities increased in the downstream
direction and the pristine control site had the lowest tolerance, following the
concept that contaminant exposure increases the tolerance of biofilms either by
adaptation or species changes. The end points in these studies are not clearly linked
to survival, growth, and reproduction and do not exhibit a clear dose–response
relationship, so it is not clear if diuron exposure at these levels impacted the
130 T.L. Fojut et al.

diversity of species in biofilm communities. Community restructuring may have
long-term effects on an ecosystem; however, the studies available only provide
preliminary data on this subject. The authors of two other studies also reported
adverse effects on microbes from diuron exposure (Pesce et al. 2006; Sumpono
et al. 2003), but the concentrations tested were well-above the derived criteria and
do not provide information regarding protection at levels near the criterion.
The literature shows that herbicides in aquatic ecosystems may have detrimental
effects on the bottom trophic levels of the food chain, which may indirectly impact
species up the food chain via changes in water quality or decreased food supply.
However, many of these studies only tested a single concentration, and no
dose–response relationship can be inferred and no-effect concentrations are not
available. Considering the available studies, it appears that the derived acute and
chronic criteria could be protective of these types of negative effects because most
studies used much higher exposure concentrations. The only studies that reported
effects at concentrations lower than the derived chronic criterion examined biofilm
community restructuring, and provided preliminary data that cannot be incorporated
into criteria derivation until more in-depth studies are available.
10 Threatened and Endangered Species
Threatened and endangered species (TES) may be more sensitive than standard test
species, and their protection is considered by comparing toxicity values for TES to
the derived criteria. Several listed animal species are represented in the data set
(CDFG 2010a, 2010b; USFWS 2010). There is an RR study for Rana aurora, whichhas a related subspecies that is endangered (California red-legged frog, R. a.draytonii). The R. aurora 14-day LC50 is 22.2 mg/L, which is well above the
acute criterion of 0.17 mg/L. The supplemental data set includes acute toxicity
values for the listed salmonids Oncorhynchus mykiss and Oncorhynchus clarki(listed subspecies is Oncorhynchus clarki henshawi). There are two 96-h LC50s
for O. mykiss of 4.9 (4.1–5.9) mg/L and 16 (11.3–22.7) mg/L, and an LC50 of 1.4
(1.1–1.9) mg/L for cutthroat trout (O. clarki), which are both well above the acute
criterion of 0.17 mg/L.
The USEPA interspecies correlation estimation (Web-ICE v. 3.1; Raimondo
et al. 2010) software was used to estimate toxicity values for the listed animals
represented in the acute data set by members of the same family or genus.
The estimated toxicity values (Table 8) range from 0.729 to 4.491 mg/L for various
salmonids.
No plant studies used in the criteria derivation were performed on state or federal
endangered, threatened, or rare species. Plants are particularly sensitive to diuron
because it is a herbicide, but there are no aquatic plants listed as state or federal
endangered, threatened, or rare species; so they could not be considered in this
section.
Aquatic Life Water Quality Criteria Derived via the UC Davis Method: III. Diuron 131

11 Bioaccumulation and Partitioning to Air and Sediment
Diuron has a log Kow of 2.78 (Sangster Research Laboratories 2008), and amolecular
weight of 233.1, which indicates a low bioaccumulative potential. There is a USEPA
pesticide tolerance established for farm-raised freshwater finfish tissue of 2.0 mg/kg
(USEPA 2007), but there are no FDA food tolerances for diuron (USFDA 2000).
The bioconcentration of diuron has been measured in various species (Table 9) and
these bioconcentration factors (BCFs) indicate that it has a low potential for
bioaccumulation in the environment. Because diuron has a low potential to bioaccu-
mulate and low toxicity to mallard ducks (lowest dietary LC50 ¼ 1,730 mg/kg feed;
USEPA 2003), the protection of terrestrial wildlife from bioaccumulation was not
assessed further. Because diuron has a low vapor pressure and a moderate log Kow, it
is also not likely to partition to the air or sediment, and currently there were no state or
federal air quality or sediment quality standards identified for diuron (CARB 2008;
CDWR 1995; NOAA 1999).
Table 8 Threatened, endangered, or rare species predicted values by Web-ICE (v. 3.1; Raimondo
et al. 2010)
Surrogate Predicted
Species LC50 (mg/L) Species LC50 (95%
confidence
interval) (mg/L)
Rainbow trout
(Oncorhynchus mykiss)4.9 Oncorhynchus aguabonita
whiteiOncorhynchus gilae apacheOncorhynchus gilaeOncorhynchus nerkaOncorhynchus tshawytschaOncorhynchus kisutchOncorhynchus clarki
henshawi
4.491 (3.613–5.581)
4.491 (3.613–5.581)
4.491 (3.613–5.581)
4.491 (3.613–5.581)
5.983 (3.225–11.097)
8.086 (6.104–4.016)
4.758 (3.545–6.387)
Cutthroat trout (O. clarki) 1.4 Oncorhynchus clarkiihenshawi
Oncorhynchus clarkiiseleniris
Oncorhynchus clarkiistomias
O. gilae apacheO. gilaeO. kisutchO. nerkaO. tshawytscha
1.206 (0.967–1.504)
1.206 (0.967–1.504)
1.206 (0.967–1.504)
0.729 (0.290–1.832)
0.729 (0.290–1.832)
1.673 (1.156–2.421)
1.206 (0.967–1.504)
1.206 (0.967–1.504)
132 T.L. Fojut et al.
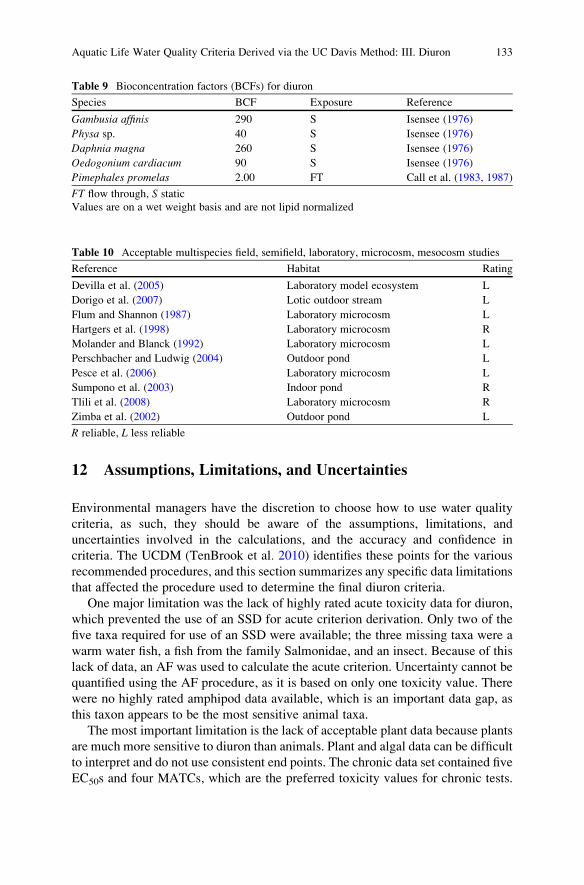
12 Assumptions, Limitations, and Uncertainties
Environmental managers have the discretion to choose how to use water quality
criteria, as such, they should be aware of the assumptions, limitations, and
uncertainties involved in the calculations, and the accuracy and confidence in
criteria. The UCDM (TenBrook et al. 2010) identifies these points for the various
recommended procedures, and this section summarizes any specific data limitations
that affected the procedure used to determine the final diuron criteria.
One major limitation was the lack of highly rated acute toxicity data for diuron,
which prevented the use of an SSD for acute criterion derivation. Only two of the
five taxa required for use of an SSD were available; the three missing taxa were a
warm water fish, a fish from the family Salmonidae, and an insect. Because of this
lack of data, an AF was used to calculate the acute criterion. Uncertainty cannot be
quantified using the AF procedure, as it is based on only one toxicity value. There
were no highly rated amphipod data available, which is an important data gap, as
this taxon appears to be the most sensitive animal taxa.
The most important limitation is the lack of acceptable plant data because plants
are much more sensitive to diuron than animals. Plant and algal data can be difficult
to interpret and do not use consistent end points. The chronic data set contained five
EC50s and four MATCs, which are the preferred toxicity values for chronic tests.
Table 9 Bioconcentration factors (BCFs) for diuron
Species BCF Exposure Reference
Gambusia affinis 290 S Isensee (1976)
Physa sp. 40 S Isensee (1976)
Daphnia magna 260 S Isensee (1976)
Oedogonium cardiacum 90 S Isensee (1976)
Pimephales promelas 2.00 FT Call et al. (1983, 1987)
FT flow through, S static
Values are on a wet weight basis and are not lipid normalized
Table 10 Acceptable multispecies field, semifield, laboratory, microcosm, mesocosm studies
Reference Habitat Rating
Devilla et al. (2005) Laboratory model ecosystem L
Dorigo et al. (2007) Lotic outdoor stream L
Flum and Shannon (1987) Laboratory microcosm L
Hartgers et al. (1998) Laboratory microcosm R
Molander and Blanck (1992) Laboratory microcosm L
Perschbacher and Ludwig (2004) Outdoor pond L
Pesce et al. (2006) Laboratory microcosm L
Sumpono et al. (2003) Indoor pond R
Tlili et al. (2008) Laboratory microcosm R
Zimba et al. (2002) Outdoor pond L
R reliable, L less reliable
Aquatic Life Water Quality Criteria Derived via the UC Davis Method: III. Diuron 133

The methodology requires that MATCs are used to derive chronic criteria by the
SSD procedure, unless studies are available with ECx values that show what level of
x is appropriate to represent a no-effect level. Thus, the chronic criterion was
calculated as the lowest NOEC in the data set. In this approach, the chronic criterion
was derived with the absolute minimum amount of data, and uncertainty cannot be
quantified because it is based on only one toxicity value.
Other limitations include the lack of information about diuron and mixture
toxicity and ecosystem-level effects. There is evidence that diuron exhibits syner-
gism with some other chemicals, including organophosphate pesticides, but there is
a lack of multispecies interaction coefficients available to incorporate the presence
of chemical mixtures into criteria compliance. Biofilms displayed sublethal effects
to low-level diuron exposures, but these effects need to be further investigated to
determine if the exposures are linked to survival, growth, or reproduction of
organisms in biofilms. Another issue to consider is the averaging periods of the
acute and chronic criteria. The chronic 4-day averaging period should be protective
based on available data. However, the acute criterion is very high when compared
to plant data, and it may allow for a pulse that could kill off a large amount of algae,
resulting in increased biological demand and potential fish kills due to low
dissolved oxygen, as discussed in Sect. 9. Clear data on the timing and
concentrations that could cause this effect are not currently available, but should
be considered when more data is available.
13 Comparison to Existing Criteria
The European Union has derived an environmental quality standard for diuron of
20 mg/L as a maximum allowable concentration and 2 mg/L as the annual average
(Killeen 1997), which are analogous to the acute and chronic criterion, respectively.
The maximum allowable concentration is lower than the UCDM acute criterion
of 170 mg/L, and the annual average is very similar to the UCDM chronic criterion of
1.3 mg/L. These criteria were derived using safety factors, which are analogous to
assessment factors. A safety factor of 10 was applied to the lowest credible lethal
concentration, which was an LC50 of 160 mg/L for G. fasciatus, to calculate the
maximum allowable concentration. A safety factor of 100 was applied to this datum
to calculate the annual average. The authors noted that while algae demonstrated
higher sensitivity to diuron, the effects on algae were algistatic, not algicidal, and
that based on the algal data the environmental quality standards derived from the
animal data are sufficiently protective of these species.
The Netherlands has derived a maximum permissible concentration (MPC) for
diuron of 0.43 mg/L (Crommentuijn et al. 2000), which is analogous to a UCDM
chronic criterion. This MPC was derived using a statistical extrapolation on the
combined freshwater and marine data set, which included data for algae,
crustaceans, insects, plants, and fish (Crommentuijn et al. 1997). The lowest
reported NOEC was 0.056 mg/L for Scenedesmus subspicatus, which is more
sensitive than any data in the acceptable UCDM data set.
134 T.L. Fojut et al.
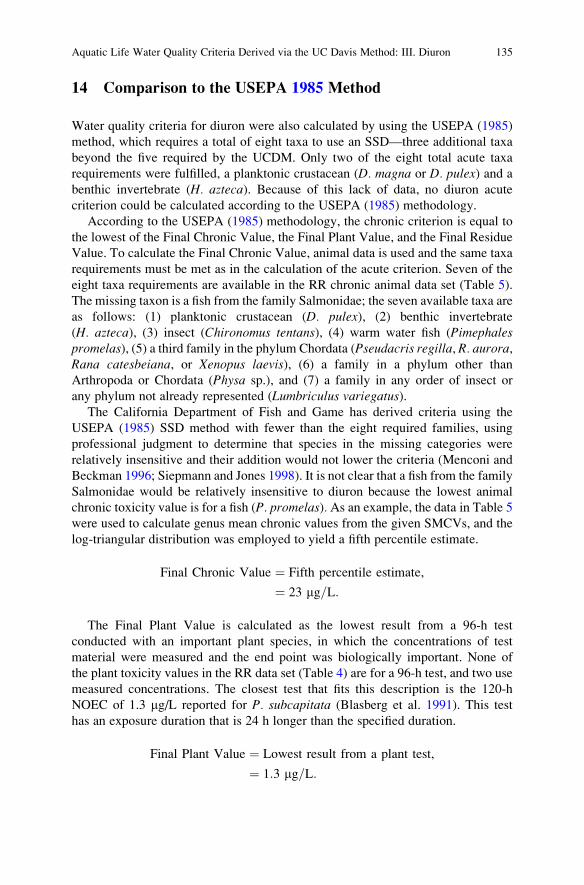
14 Comparison to the USEPA 1985 Method
Water quality criteria for diuron were also calculated by using the USEPA (1985)
method, which requires a total of eight taxa to use an SSD—three additional taxa
beyond the five required by the UCDM. Only two of the eight total acute taxa
requirements were fulfilled, a planktonic crustacean (D. magna or D. pulex) and a
benthic invertebrate (H. azteca). Because of this lack of data, no diuron acute
criterion could be calculated according to the USEPA (1985) methodology.
According to the USEPA (1985) methodology, the chronic criterion is equal to
the lowest of the Final Chronic Value, the Final Plant Value, and the Final Residue
Value. To calculate the Final Chronic Value, animal data is used and the same taxa
requirements must be met as in the calculation of the acute criterion. Seven of the
eight taxa requirements are available in the RR chronic animal data set (Table 5).
The missing taxon is a fish from the family Salmonidae; the seven available taxa are
as follows: (1) planktonic crustacean (D. pulex), (2) benthic invertebrate
(H. azteca), (3) insect (Chironomus tentans), (4) warm water fish (Pimephalespromelas), (5) a third family in the phylum Chordata (Pseudacris regilla, R. aurora,Rana catesbeiana, or Xenopus laevis), (6) a family in a phylum other than
Arthropoda or Chordata (Physa sp.), and (7) a family in any order of insect or
any phylum not already represented (Lumbriculus variegatus).The California Department of Fish and Game has derived criteria using the
USEPA (1985) SSD method with fewer than the eight required families, using
professional judgment to determine that species in the missing categories were
relatively insensitive and their addition would not lower the criteria (Menconi and
Beckman 1996; Siepmann and Jones 1998). It is not clear that a fish from the family
Salmonidae would be relatively insensitive to diuron because the lowest animal
chronic toxicity value is for a fish (P. promelas). As an example, the data in Table 5
were used to calculate genus mean chronic values from the given SMCVs, and the
log-triangular distribution was employed to yield a fifth percentile estimate.
Final Chronic Value ¼ Fifth percentile estimate,
¼ 23 mg=L:
The Final Plant Value is calculated as the lowest result from a 96-h test
conducted with an important plant species, in which the concentrations of test
material were measured and the end point was biologically important. None of
the plant toxicity values in the RR data set (Table 4) are for a 96-h test, and two use
measured concentrations. The closest test that fits this description is the 120-h
NOEC of 1.3 mg/L reported for P. subcapitata (Blasberg et al. 1991). This test
has an exposure duration that is 24 h longer than the specified duration.
Final Plant Value ¼ Lowest result from a plant test,
¼ 1:3 mg=L:
Aquatic Life Water Quality Criteria Derived via the UC Davis Method: III. Diuron 135

The Final Residue Value is calculated by dividing the maximum permissible
tissue concentration by an appropriate BCF or bioaccumulation factor (BAF).
A maximum allowable tissue concentration is either (a) an FDA action level for
fish oil or for the edible portion of fish or shellfish or (b) a maximum acceptable
dietary intake based on observations on survival, growth, or reproduction in a
chronic wildlife feeding study or long-term wildlife field study. While no FDA
action level exists for fish tissue, there is an EPA pesticide tolerance for farm-raised
freshwater finfish tissue of 2.0 mg/kg (USEPA 2007). There is no relevant study
that meets the requirement of part (b) above. A BCF of 2.0 for P. promelas (Table 9)was used to calculate the Final Residue Value.
Final Residue Value ¼ Maximum permissible tissue concentration
BCF;
¼ 1 mg=L ð1; 000 mg=LÞ:
The Final Plant Value is lower than both the Final Chronic Value and the Final
Residue Value; therefore, the chronic criterion by the USEPA (1985) methodology
would be 1.3 mg/L, and the example USEPA chronic criterion is equivalent to the
UCDM chronic criterion.
15 Summary and Final Criteria Statement
Acute and chronic water quality criteria for the protection of aquatic life were
derived for diuron using the UCDM. The acute criterion is based only on acute
animal data and was derived using an assessment factor because there were insuffi-
cient data to use a SSDwhile the chronic criterion was derived using only plant data,
which are more sensitive to diuron. The lowest NOEC of a highly rated plant study
was used as the criterion because there were insufficient data for use of an SSD for
criterion calculation. Plant toxicity data are essential when considering diuron usage
and regulations because plants and algae are the most sensitive taxa; however, plant
data are difficult to interpret. The criteria should be updated whenever relevant and
reliable new data become available.
Aquatic life in the Sacramento River and San Joaquin River basins should not be
affected unacceptably if the 4-day average concentration of diuron does not exceed
1.3 mg/L (1,300 ng/L) more than once every 3 years on the average and if the 1-h
average concentration does not exceed 170 mg/L more than once every 3 years on
the average. Mixtures of diuron and other PSII-inhibitor herbicides should be
considered to be additive (see Sect. 7).
Acknowledgments We thank the following reviewers: D. McClure (CRWQCB-CVR), J. Grover
(CRWQCB-CVR), S. McMillan (CDFG), J. P. Knezovich (Lawrence Livermore National Labo-
ratory), and X. Deng (CDPR). This project was funded through a contract with the Central Valley
Regional Water Quality Control Board of California. Funding for this project was provided by the
136 T.L. Fojut et al.

California Regional Water Quality Control Board, Central Valley Region (CRWQCB-CVR).
The contents of this document do not necessarily reflect the views and policies of the CRWQCB-
CVR, nor does mention of trade names or commercial products constitute endorsement or
recommendation for use.
References
Arrhenius A, Gronvall F, Scholze M, Backhaus T, Blanck H (2004) Predictability of the mixture
toxicity of 12 similarly acting congeneric inhibitors of photosystem II in marine periphyton and
epipsammon communities. Aquat Toxicol 68:351–367.
ASTM (2004) Standard Guide for Conducting Static Toxicity Tests with Microalgae. In: ASTM
E1218 (Environmental Toxicology Standards). American Society for Testing and Materials.
ASTM (2007a) Standard Guide for Conducting Static Toxicity Tests with Microalgae. Designa-
tion: E 1218–07. American Society for Testing and Materials.
ASTM (2007b) Standard Practice for Algal Growth Potential with Pseudokirchneriellasubcapitata. Designation: D 3978–07. American Society for Testing and Materials.
Backhaus T, Faust M, Scholze M, Gramatica P, Vighi M, Grimme LH (2004) Joint algal toxicity of
phenylurea herbicides is equally predictable by concentration addition and independent action.
Environ Toxicol Chem 23:258–264.
Baer KN (1991) Static, Acute 48-hour EC50 of DPX-14740-165 (Karmex DF) to Daphnia magna.Haskell laboratory report No. 508-91. Unpublished study prepared by E. I. du Pont de Nemours
and Company, Newark, DE, submitted to the U. S. Environmental Protection Agency. EPA
MRID 42046003.
Blasberg J, Hicks SL, Bucksaath J (1991) Acute Toxicity of Diuron to Selenastrum capricornutumPrintz. DuPont study number AMR-2046-91. ABC laboratory project ID, final report #39335.
Unpublished study prepared by ABC Laboratories, Inc. Columbia, MO, submitted to the U. S.
Environmental Protection Agency. EPA MRID 42218401.
Cain JR, Cain RK (1983) The effects of selected herbicides on zygospore germination and growth
of Chlamydomonas moewusii (Chlorophyceae, Volvocales). J Phycology 19:301–305.
Call DJ, Brooke LT, Kent RJ (1983) Toxicity, Bioconcentration and Metabolism of 5 Herbicides
in Freshwater Fish. Environmental Research Laboratory-Duluth. U. S. Environmental Protec-
tion Agency report, EPA MRID 00141636/TRID 452601029.
Call DJ, Brooke LT, Kent RJ, Knuth ML, Poirier SH, Huot JM, Lima AR (1987) Bromacil and
Diuron Herbicides - Toxicity, Uptake, and Elimination in Freshwater Fish. Arch Environ
Contam Toxicol 16:607–613.
CARB (2008) California Ambient Air Quality Standards (CAAQS). California Air Resources
Board, Sacramento, CA.
CDFG (2010a) State and federally listed endangered and threatened animals of California.
California Natural Diversity Database. California Department of Fish and Game, Sacramento,
CA. Available from: http://www.dfg.ca.gov/biogeodata/cnddb/pdfs/TEAnimals.pdf.
CDFG (2010b) State and federally listed endangered, threatened, and rare plants of California.
California Natural Diversity Database. California Department of Fish and Game, Sacramento,
CA. Available from: http://www.dfg.ca.gov/biogeodata/cnddb/pdfs/TEPlants.pdf.
CDWR (1995) Compilation of Sediment and Soil Standards, Criteria, and Guidelines. California
Department of Water Resources, State of California, The Resources Agency, Sacramento, CA.
Chesworth JC, Donkin ME, Brown MT (2004) The interactive effects of the antifouling herbicides
Irgarol 1051 and Diuron on the seagrass Zostera marina (L.). Aquat Toxicol 66:293–305.
Christian FA, Tate TM (1983) Toxicity of Fluometuron and Diuron on the Intermediate Snail Host
(Lymnaea Spp) of Fasciola hepatica. Bull Environ Contam Toxicol 30:628–631.
Aquatic Life Water Quality Criteria Derived via the UC Davis Method: III. Diuron 137

Crommentuijn T, Kalf DF, Polder MD, Posthumus R, van de Plassche EJ (1997) Maximum
permissible concentrations and negligible concentrations for pesticides. RIVM report number
601501002. National Institute of Public Health and the Environment, Bilthoven, The
Netherlands.
Crommentuijn T, Sijm D, de Bruijn J, van Leeuwen K, van de Plassche E (2000) Maximum
permissible and negligible concentrations for some organic substances and pesticides.
J Environ Manag 58:297–312.
Crosby DG, Tucker RK (1966) Toxicity of Aquatic Herbicides to Daphnia magna. Science154:289–291.
Dengler D (2006a) Testing of toxic effects of diuron technical on the blue-green alga
Synechococcus leopoliensis. Final report. Unpublished study prepared by GAB Biotechnologie
GmbH & GAB Analytik GmbH, Germany, sponsored by DuPont de Nemours France S.A.
Crop Protection, submitted to the U.S. Environmental Protection Agency. EPA MRID
47936501.
Dengler D (2006b) Testing of toxic effects of diuron technical on the diatom Navicula pelliculosa.Final report. Unpublished study prepared by GAB Biotechnologie GmbH & GAB Analytik
GmbH, sponsored by DuPont de Nemours France S.A. Crop Protection, submitted to the U.S.
Environmental Protection Agency. EPA MRID 47936502.
Devilla RA, Brown MT, Donkin M, Tarran GA, Aiken J, Readman JW (2005) Impact of
antifouling booster biocides on single microalgal species and on a natural marine phytoplank-
ton community. Marine Ecology-Progress Series 286:1–12.
Dorigo U, Leboulanger C, Berard A, Bouchez A, Humbert JF, Montuelle B (2007) Lotic biofilm
community structure and pesticide tolerance along a contamination gradient in a vineyard area.
Aquat Microbial Ecol 50:91–102.
Douglas MT, Handley JW (1988) The algistatic activity of diuron technical. Unpublished study
prepared by Huntingdon Research Centre Ltd., Huntingdon, England, sponsored by Du Pont de
Nemours (France) S. A., submitted to the U.S. Environmental Protection Agency. EPA MRID
47936503.
Ensminger MP, Starner K, Kelley K (2008) Simazine, diuron, and atrazine detections in California
surface waters. California Department of Pesticide Regulation, Sacramento, CA.
Eullaffroy P, Frankart C, Biagianti S (2007) Toxic effect assessment of pollutant mixtures in
Lemna minor by using polyphasic fluorescence kinetics. Toxicol Environ Chem 89:683–393.
Eullaffroy P, Vernet G (2003) The F684/F735 chlorophyll fluorescence ratio: a potential tool for
rapid detection and determination of herbicide phytotoxicity in algae.Water Res 37:1983–1990.
Fernandez-Alba AR, Hernando MD, Piedra L, Chisti Y (2002) Toxicity evaluation of single and
mixed antifouling biocides measured with acute toxicity bioassays. Anal Chim Acta
456:303–312.
Ferrell BD (2006) Diuron (DPX-14740) technical: Static, 7-day growth inhibition toxicity test
with Lemna gibba G3. Laboratory project ID: DuPont 20775. Unpublished study prepared by
E.I. du Pont de Nemours and Company Haskell Laboratory for Health and Environmental
Sciences, Newark, DE, submitted to the U.S. Environmental Protection Agency. EPA MRID
46996701.
Flum TF, Shannon LJ (1987) The Effects of 3 Related Amides on Microecosystem Stability.
Ecotoxicol Environ Saf 13:239–252.
Gatidou G, Thomaidis NS (2007) Evaluation of single and joint toxic effects of two antifouling
biocides, their main metabolites and copper using phytoplankton bioassays. Aquat Toxicol
85:184–191.
Geoffroy L, Teisseire H, Couderchet M, Vernet G (2002) Effect of oxyfluorfen and diuron alone
and in mixture on antioxidative enzymes of Scenedesmus obliquus. Pestic Biochem Physiol
72:178–185.
Hansch C, Leo A, Hoekman D (1995) Exploring QSAR. Hydrophobic, Electronic, and Steric
Constants. American Chemical Society, Washington, DC.
138 T.L. Fojut et al.

Hartgers EM, Aalderink GH, Van Den Brink PJ, Gylstra R, Wiegman JWF, Brock TCM (1998)
Ecotoxicological threshold levels of a mixture of herbicides (Atrazine, diuron and metolachlor)
in freshwater microcosms. Aquat Ecol 32:135–152.
Hernando MD, Ejerhoon M, Fernandez-Alba AR, Chisti Y (2003) Combined toxicity effects of
MTBE and pesticides measured with Vibrio fischeri and Daphnia magna bioassays. Water Res
37:4091–4098.
Hollister T, Walsh GE (1973) Differential responses of marine phytoplankton to herbicides -
oxygen evolution. Bull Environ Contam Toxicol 9:291–295.
Isensee AR (1976) Variability of Aquatic Model Ecosystem-Derived Data. Int J Environ Studies
10:35–41.
IUPAC (2008) IUPAC Agrochemical Information - Diuron. URL �http://sitem.herts.ac.uk/aeru/
iupac/260.htm�.
Johnson WW, Finley MT (1980) Handbook of Acute Toxicity of Chemicals to Fish and Aquatic
Invertebrates. Resource Publication 137. United States Fish and Wildlife Service, Washington,
DC. EPA MRID 40094602.
Killeen S (1997) Development and use of environmental quality standards (EQS) for priority
pesticides. Pestic Sci 49:191–195.
Knauer K, Sobek A, Bucheli TD (2007) Reduced toxicity of diuron to the freshwater green alga
Pseudokirchneriella subcapitata in the presence of black carbon. Aquat Toxicol 83:143–148.
Knauert S, Escher B, Singer H, Hollender J, Knauer K (2008)Mixture toxicity of three photosystem
II inhibitors (atrazine, isoproturon, and diuron) toward photosynthesis of freshwater phyto-
plankton studied in outdoor mesocosms. Environ Sci Technol 42:6424–6430.
Koutsaftis A, Aoyama I (2007) Toxicity of four antifouling biocides and their mixtures on the
brine shrimp Artemia salina. Sci Total Environ 387:166–174.
Lambert SJ, Thomas KV, Davy AJ (2006) Assessment of the risk posed by the antifouling booster
biocides Irgarol 1051 and diuron to freshwater macrophytes. Chemosphere 63:734–743.
Lide DR (ed) (2003) Handbook of Chemistry and Physics. 84th Edition. CRC Press,
Boca Raton, FL.
Lydy MJ, Austin KR (2005) Toxicity assessment of pesticide mixtures typical of the Sacramento-
San Joaquin Delta using Chironomus tentans. Arch Environ Contam Toxicol 48:49–55.
Ma J, LiangW, Xu L,Wang S, Wei Y, Lu J (2001) Acute toxicity of 33 herbicides to the green alga
Chlorella pyrenoidosa. Bull Environ Contam Toxicol 66:536–541.
Ma J (2002) Differential sensitivity to 30 herbicides among populations of two green algae
Scenedesmus obliquus and Chlorella pyrenoidosa. Bull Environ Contam Toxicol 68:275–281.
Ma J, Lin F, Wang S, Xu L (2003) Toxicity of 21 herbicides to the green alga Scenedesmusquadricauda. Bull Environ Contam Toxicol 71:594–601.
Ma JY, Wang SF, Wang PW, Ma LJ, Chen XL, Xu RF (2006) Toxicity assessment of 40
herbicides to the green alga Raphidocelis subcapitata. Ecotoxicol Environ Saf 63:456–462.
Ma JY, Xu LG, Wang SF, Zheng RQ, Jin SH, Huang SQ, Huang YJ (2002) Toxicity of 40
herbicides to the green alga Chlorella vulgaris. Ecotoxicol Environ Saf 51:128–132.
Macek KJ, Hutchins C, Cope OB (1969) Effects of Temperature on Susceptibility of Bluegills and
Rainbow Trout to Selected Pesticides. Bull Environ Contam Toxicol 4:174–183.
Mackay D, Shiu WY, Ma KC, Lee SC (2006) Handbook of Physical-Chemical Properties and
Environmental Fate for Organic Chemicals. 2nd edn. CRC Press, Boca Raton, FL.
Manzo S, Buono S, Cremisini C (2008) Predictability of copper, irgarol, and diuron combined
effects on sea urchin Paracentrotus lividus. Arch Environ Contam Toxicol 54:57–68.
Maule A, Wright SJL (1984) Herbicide effects on the population-growth of some green-algae and
cyanobacteria. J Appl Bacteriol 57:369–379.
Menconi M, Beckman J (1996) Hazard assessment of the insecticide methomyl to aquatic
organisms in the San Joaquin river system. Administrative report 96–6. California Department
of Fish and Game, Rancho Cordova, CA.
Molander S, Blanck H (1992) Detection of Pollution-Induced Community Tolerance (Pict) in
Marine Periphyton Communities Established under Diuron Exposure. Aquat Toxicol
22:129–144.
Aquatic Life Water Quality Criteria Derived via the UC Davis Method: III. Diuron 139

Molander S, Dahl B, Blanck H, Jonsson J, Sjostrom M (1992) Combined Effects of Tri-Normal-
Butyl Tin (Tbt) and Diuron on Marine Periphyton Communities Detected as Pollution-Induced
Community Tolerance. Arch Environ Contam Toxicol 22:419–427.
Mount DR, Ankley GT, Brix KV, Clements WH, Dixon DG, Fairbrother A, Hickey CW, Lanno
RP, Lee CM, MunnsWR, Ringer RK, Staveley JP, Wood CM, Erickson RJ, Hodson PV (2003)
Effects assessment: Introduction. In: Reevaluation of the State of the Science for Water-QualityCriteria Development, Reiley MC, Stubblefield WA, Adams WJ, Di Toro DM, Hodson PV,
Erickson RJ, Keating FJ Jr, eds., SETAC Press, Pensacola, FL.
Nebeker AV, Schuytema GS (1998) Chronic effects of the herbicide diuron on freshwater
cladocerans, amphipods, midges, minnows, worms, and snails. Arch Environ Contam Toxicol
35:441–446.
NOAA (1999) Sediment Quality Guidelines Developed for the National Status and Trends
Program. National Oceanographic and Atmospheric Agency Office of Response and Restora-
tion, Department of Commerce.
Okamura H, Nishida T, Ono Y, Shim WJ (2003) Phytotoxic effects of antifouling compounds on
nontarget plant species. Bull Environ Contam Toxicol 71:881–886.
Okamura H, Watanabe T, Aoyama I, Hasobe M (2002) Toxicity evaluation of new antifouling
compounds using suspension-cultured fish cells. Chemosphere 46:945–951.
Palumbo AJ, TenBrook PL, Fojut TL, Faria IR, Tjeerdema RS (2012) Aquatic life water quality
criteria derived via the UC Davis method: I. Organophosphate insecticides. Rev Environ
Contam Toxicol 216:1–49.
Perschbacher PW, Ludwig GM (2004) Effects of diuron and other aerially applied cotton
herbicides and defoliants on the plankton communities of aquaculture ponds. Aquaculture
233:197–203.
Pesce S, Fajon C, Bardot C, Bonnemoy F, Portelli C, Bohatier J (2006) Effects of the phenylurea
herbicide diuron on natural riverine microbial communities in an experimental study. Aquat
Toxicol 78:303–314.
Podola B, Melkonian M (2005) Selective real-time herbicide monitoring by an array chip
biosensor employing diverse microalgae. J Appl Phycol 17:261–271.
Raimondo S, Vivian DN, Barron MG (2010) Web-based Interspecies Correlation Estimation
(Web-ICE) for Acute Toxicity: User Manual. Version 3.1. Office of Research and Develop-
ment, U.S. Environmental Protection Agency, Gulf Breeze, FL. EPA/600/R-10/004.
Sanders HO (1969) 25. Toxicity of Pesticides to the Crustacean Gammarus lacustris. Bureau of
Sport Fisheries and Wildlife. United States Department of the Interior Fish and Wildlife
Service, Washington, DC.
Sanders HO (1970) Toxicities of some herbicides to 6 species of freshwater crustaceans. J Water
Pollut Cont Fed 42:1544–1550.
Sanders HO, Cope OB (1968) Relative Toxicities of Several Pesticides to Naiads of 3 Species of
Stoneflies. Limnol Oceanogr 13:112–117.
Sangster Research Laboratories (2008) LOGKOW A databank of evaluated octanol-water parti-
tion coefficients (Log P). URL <http://logkow.cisti.nrc.ca/logkow/index.jsp>.
Schafer H, Hettler H, Fritsche U, Pitzen G, Roderer G, Wenzel A (1994) Biotests using unicellular
algae and ciliates for predicting long-term effects of toxicants. Ecotoxicol Environ Saf 27:64–81.
Schrader KK, de Regt MQ, Tidwell PD, Tucker CS, Duke SO (1998) Compounds with selective
toxicity towards the off-flavor metabolite-producing cyanobacterium Oscillatoria cf. chalybea.Aquaculture 163:85–99.
Schuytema GS, Nebeker AV (1998) Comparative toxicity of diuron on survival and growth of
Pacific treefrog, bullfrog, red-legged frog, and African clawed frog embryos and tadpoles.
Arch Environ Contam Toxicol 34:370–376.
Siepmann S, Jones MR (1998) Hazard assessment of the insecticide carbaryl to aquatic organisms
in the Sacramento-San Joaquin River system. Administrative report 98–1. California Depart-
ment of Fish and Game, Office of Spill Prevention and Response, Rancho Cordova, CA.
140 T.L. Fojut et al.

Sumpono, Perotti P, Belan A, Forestier C, Lavedrine B, Bohatier J (2003) Effect of Diuron on
aquatic bacteria in laboratory-scale wastewater treatment ponds with special reference to
Aeromonas species studied by colony hybridization. Chemosphere 50:445–455.
Teisseire H, Couderchet M, Vernet G (1999) Phytotoxicity of diuron alone and in combination
with copper or folpet on duckweed (Lemna minor). Environ Pollut 106:39–45.
TenBrook PL, Palumbo AJ, Fojut TL, Hann P, Karkoski J, Tjeerdema RS (2010) The University of
California-Davis Methodology for deriving aquatic life pesticide water quality criteria. Rev
Environ Contam Toxicol 209:1–155.
Tlili A, Dorigo U, Montuelle B, Margoum C, Carluer N, Gouy V, Bouchez A, Berard A (2008)
Responses of chronically contaminated biofilms to short pulses of diuron – An experimental
study simulating flooding events in a small river. Aquat Toxicol 87:252–263.
Tomlin C (2003) The Pesticide Manual, A World Compendium. 13th edition. The British Crop
Protection Council, Alton, Hampshire, UK.
Tooby TE, Lucey J, Stott B (1980) The tolerance of grass carp, Ctenopharyngodon idella val to
aquatic herbicides. J Fish Biol 16:591–597.
Ukeles R (1962) Growth of pure cultures of marine phytoplankton in presence of toxicants. Appl
Microbiol 10:532–537.
USEPA (1985) Guidelines for deriving numerical national water quality criteria for the protection
of aquatic organisms and their uses, PB-85-227049. United States Environmental Protection
Agency, National Technical Information Service, Springfield, VA.
USEPA (1996) Algal Toxicity, Tiers I and II, Ecological Effects Test Guidelines, OPPTS 850.5400,
EPA 712/C/96/164. United States Environmental Protection Agency, Washington, DC.
USEPA (2003) Reregistration Eligibility Decision (RED) for Diuron. United States Environmental
Protection Agency, Office of Prevention, Pesticides, and Toxic Substances, Washington, DC.
USEPA (2007) Diuron, Pesticide Tolerance. Federal Register, Docket # EPA-HQ-OPP-2006-
0559, 72, 32533–32540.
USFDA (2000) Industry Activities Staff Booklet. URL <http://www.cfsan.fda.gov/~lrd/fdaact.
html>.
USFWS (2010) Species Reports. Endangered Species Program. U.S. Fish and Wildlife Service.
Available from: http://www.fws.gov/endangered/; http://ecos.fws.gov/tess_public/pub/
listedAnimals.jsp; http://ecos.fws.gov/tess_public/pub/listedPlants.jsp.
Walker CR (1965) Diuron, fenuron, monuron, neburon, and TCAmixtures as aquatic herbicides in
fish habitats. Weeds 13:297–301.
Walsh GE (1972) Effects of Herbicides on Photosynthesis and Growth of Marine Unicellular
Algae. Water Hyacinth J 10:45–48.
Walsh GE, Grow TE (1971) Depression of Carbohydrate in Marine Algae by Urea Herbicides.
Weed Sci 19:568–570.
Ward T, Boeri R (1991) Acute Flow-through Mollusc Shell Deposition Test with DPX-14740-166
(Diuron). Haskell laboratory outside report No. MR-4581-911. Unpublished study prepared by
EnviroSystems Division Resource Analysts, Inc., Hampton, NH, sponsored by E.I. du Pont de
Nemours and Company, Newark, DE, submitted to the U. S. Environmental Protection
Agency. EPA MRID 42217201.
Ward T, Boeri R (1992a) Early life stage toxicity of DPX-14740-166 (Diuron) to Sheepshead
minnow, Cyprinodon variegatus. Haskell laboratory outside report No. 866-91. Unpublished
study prepared by EnviroSystems Division Resource Analysts, Inc., Hampton, NH, sponsored
by E.I. du Pont de Nemours and Company, Newark, DE, submitted to the U. S. Environmental
Protection Agency. EPA MRID 42312901.
Ward T, Boeri R (1992b) Life-cycle Toxicity of DPX-14740-166 (Diuron) to the Mysid,
Mysidopsis bahia. Haskell laboratory outside report No. 203-92. Unpublished study prepared
by EnviroSystems Division Resource Analysts, Inc., Hampton, NH, sponsored by E.I. du Pont
de Nemours and Company, Newark, DE, submitted to the U. S. Environmental Protection
Agency. EPA MRID 42500601.
Zimba PV, Tucker CS, Mischke CC, Grimm CC (2002) Short-term effect of diuron on catfish pond
ecology. North Am J Aquacult 64:16–23.
Aquatic Life Water Quality Criteria Derived via the UC Davis Method: III. Diuron 141


![3.3 Aquatic Resources - California State Water Resources ... · Section 3.3.5 [Aquatic Resources] Potential Impacts and Mitigation. 3.3.2.1 Aquatic Species Numerous aquatic species](https://static.fdocuments.in/doc/165x107/5fdf05efaeffa42ca171b579/33-aquatic-resources-california-state-water-resources-section-335-aquatic.jpg)