Aquamonitor User Guide - Home Water and Energy ...aquamonitor.com.au/download/Aquamonitor GreenStar...
10
1 GreenStar Monitor User Guide Model: M290 Revision J, June 2019 Thank you for purchasing an Aquamonitor product. Please read this guide carefully and keep it for future reference. The details included in this guide, such as pictures, symbols and descriptions are for reference only and may not exactly represent the physical detail of your item. This is because we are continually updating and improving Aquamonitor products. Therefore features, technical specifications and physical appearance are subject to change. CONTENTS 1 Safety and Usage Precautions ……………………….. p 1 2 Specifications ………………………………………………… p 1 3 Aquamonitor Features ..………………………………… p 2 4 Information Display Settings …………………………. p 2 4.1 Setting Time and Date ………………………………. p 3 4.2 Setting Serial Number ………………………………. p 3 5 Pre-Installation …………………………………………….. p 4 6 Mounting the Sensor ….……………………………….. p 4 7 Water Meter Sensor Installation ………………….. p 5 8 Energy Sensor Installation ……………………………. p 6 9 Software Utility ……………………………………………. p 7 10 Troubleshooting ………………………………………….. p 9 1) SAFETY AND USAGE PRECAUTIONS Please read and understand all instructions contained in this guide prior to installation and use. If clarification or further details are needed, contact us at support@aquamonitor .com.au. This product is a radio transmitting device and may cause interference with sensitive electronic equipment such as wireless, audio, visual, vehicle and medical equipment and systems. This product is also a radio receiving device and may be affected by other equipment or systems that emit radio frequencies, such as two-way radios, wireless remote controllers and in-home wireless products. Always ensure safe working conditions during installation. Only use the DC power adaptor that was supplied with the Display. Do not use other types as this may damage the electronics. The Display is not waterproof and contains sensitive electronic circuitry. Use it only in dry, cool environments. The Display and sensors operate at low radio power levels to ensure good battery life. Locate the Display as close as possible to the sensors to ensure wireless operation. Avoid locating the sensors or Display within or near metallic structures. Ensure that there is clear space around the sensors and Display to allow the radio signals to propagate. Install the sensors in locations away from areas that fill or pool with water. When replacing batteries please ensure that the battery is the type specified in this guide. The sensors will not operate and may be damaged if the battery voltage is incorrect. Installation of the energy sensor current transformer must be performed by a qualified electrician according to safe work practices. If this product does not operate normally then refer to the troubleshooting information contained in this guide. There are no operator serviceable parts inside aside from batteries. Please refer servicing and repair to qualified service personnel or request support through the Aquamonitor web site. There is a range of Aquamonitor sensors to suit a variety of water meters with a pulse output facility. Please check that your water meter is suitable for use with the supplied water meter sensor. All rights are reserved. No part of this document may be photocopied, reproduced or translated into another language without the written consent of Aquamonitor Pty Ltd. The information contained within this manual is subject to change without notice. Aquamonitor Pty Ltd shall not be liable for errors contained herein or for consequential damages in connection with the furnishing, performance, non-use or use of this guide or of associated information. 2) GENERAL SPECIFICATIONS Wireless range 50 metres line of sight 30 metres in urban location Operating temperature 5 to 45 Celsius RF (radio) Output 10mW approx. 434 MHz Battery Type Water meter sensor Energy sensor Lithium AA 3.6V ER14505 Lithium AA 3.6V ER14505 DC Power – Display 5V DC Energy Sensor current range 0.04 (10W) – 100 Amps LED Indicators Sensors LED flashes every minute Wireless connection OK Display All buttons blue OK button is green OK button flashing red Wake mode No New Alarm Alarm condition
Transcript of Aquamonitor User Guide - Home Water and Energy ...aquamonitor.com.au/download/Aquamonitor GreenStar...

1
GreenStar Monitor User Guide
Model: M290 Revision J, June 2019
Thank you for purchasing an Aquamonitor product. Please read this guide carefully and keep it for future reference. The details included in this guide, such as pictures, symbols and descriptions are for reference only and may not exactly represent the physical detail of your item. This is because we are continually updating and improving Aquamonitor products. Therefore features, technical specifications and physical appearance are subject to change.
CONTENTS 1 Safety and Usage Precautions ……………………….. p 1
2 Specifications ………………………………………………… p 1
3 Aquamonitor Features ..………………………………… p 2
4 Information Display Settings …………………………. p 2
4.1 Setting Time and Date ………………………………. p 3
4.2 Setting Serial Number ………………………………. p 3
5 Pre-Installation …………………………………………….. p 4
6 Mounting the Sensor ….……………………………….. p 4
7 Water Meter Sensor Installation ………………….. p 5
8 Energy Sensor Installation ……………………………. p 6
9 Software Utility ……………………………………………. p 7
10 Troubleshooting ………………………………………….. p 9
1) SAFETY AND USAGE PRECAUTIONS Please read and understand all instructions contained in this guide prior to installation and use. If clarification or further details are needed, contact us at support@aquamonitor .com.au. This product is a radio transmitting device and may cause interference with sensitive electronic equipment such as wireless, audio, visual, vehicle and medical equipment and systems. This product is also a radio receiving device and may be affected by other equipment or systems that emit radio frequencies, such as two-way radios, wireless remote controllers and in-home wireless products.
Always ensure safe working conditions during installation. Only use the DC power adaptor that was supplied with the Display. Do not use other types as this may damage the electronics. The Display is not waterproof and contains sensitive electronic circuitry. Use it only in dry, cool environments. The Display and sensors operate at low radio power levels to ensure good battery life. Locate the Display as close as possible to the sensors to ensure wireless operation. Avoid locating the sensors or Display within or near metallic structures. Ensure that there is clear space around the sensors and Display to allow the radio signals to propagate. Install the sensors in locations away from areas that fill or pool with water. When replacing batteries please ensure that the battery is the type specified in this guide. The sensors will not operate and may be damaged if the battery voltage is incorrect. Installation of the energy sensor current transformer must be performed by a qualified electrician according to safe work practices. If this product does not operate normally then refer to the troubleshooting information contained in this guide. There are no operator serviceable parts inside aside from batteries. Please refer servicing and repair to qualified service personnel or request support through the Aquamonitor web site. There is a range of Aquamonitor sensors to suit a variety of water meters with a pulse output facility. Please check that your water meter is suitable for use with the supplied water meter sensor. All rights are reserved. No part of this document may be photocopied, reproduced or translated into another language without the written consent of Aquamonitor Pty Ltd. The information contained within this manual is subject to change without notice. Aquamonitor Pty Ltd shall not be liable for errors contained herein or for consequential damages in connection with the furnishing, performance, non-use or use of this guide or of associated information.
2) GENERAL SPECIFICATIONS Wireless range 50 metres line of sight
30 metres in urban location Operating temperature 5 to 45 Celsius RF (radio) Output 10mW approx. 434 MHz Battery Type Water meter sensor Energy sensor
Lithium AA 3.6V ER14505 Lithium AA 3.6V ER14505
DC Power – Display 5V DC Energy Sensor current range 0.04 (10W) – 100 Amps
LED Indicators
Sensors LED flashes every minute
Wireless connection OK
Display All buttons blue OK button is green OK button flashing red
Wake mode No New Alarm Alarm condition

2
3) FEATURES • Three monitoring channels for water meters or energy
usage. • Consumption displays: Energy and water usage. • Current cost display: Total of water and energy cost per
hour with optional Tiered Billing function. • Daily and average cost totals display: Overall cost and
individual cost for water and energy. • Display of energy usage and 7 day history. • Display of water usage and 7 day history. • Resettable Totaliser for usage of energy and water and
associated costs. • Graphical display of consumption: 7 day consumption,
daily consumption. • Configurable alarms: Leak alarm, time alarm (prolonged
usage), current (amps) alarm and daily limit alarm. • Status Bar display of date and time, sensor wireless
connection status, and sensor battery level. • Navigation bar with display of button functions. • Illuminated buttons for indication of alarms.
4) INFORMATION DISPLAY ON MONITOR
Connect power cable to display monitor to power up device.
1 - Status Bar, with sensor health indicators. 2 - Title Bar, describing the value displayed. 3 - Value displayed, updates every minute. 4 - Seven day history of the displayed value. 5 - Navigation bar showing button functions.
Button Operation – Navigation Bar
• The function of each button is shown on the navigation bar (see item 5 in the above figure).
• The first button press will activate the backlight and illuminate the buttons (blue). If there is an alarm then the alarm sound will be cancelled.
• Pressing OK will bring up the Menu Guide for display of graphs and settings (see below).
Menu Guide
24HR Graph:
Bar graphs for the past 24 hour period are displayed for each sensor: 1 bar for each hour of consumption with the leftmost bar representing consumption from midnight to 1 am.
Weekly Graph: Bar graphs for the past 7 days are displayed for each sensor: 1 bar for each day of consumption.
General Setup: Time: Current time of day in 24 hour format. Date: Current date. Day: Current day of week. Sound: Turns the sound on or off. Reset Totaliser: Clears the accumulated usage and cost of the resettable totaliser. The resettable totaliser can be used to check consumption over long or short periods for consumption tests. The logged data is not cleared. Reset All Data*: Clears the internal logged data memory, all current values and the resettable totalisers. The configuration settings are not affected.
METER SETUP (WATER):
Daily Limit: An alarm is raised when the water consumption today exceeds this setting.
Leak Alarm: Set this to the period that the premise is unattended (eg 8 hours). The alarm checks the past 24 hours of usage for a continuous period (eg 8 hours) of zero consumption: if not found then the alarm is raised.

3
Time Alarm: Allows an alarm to be raised if there is continuous usage for the set period of time. For example, when set to 20 min, an alarm would be raised if a hose was left running for more than 20 minutes.
Pulse Volume: This setting is used to convert the pulses from the water meter output to litres and must be set at installation time. See Section 7: Determining Pulse Volume. Cost per unit: This can be obtained from your water statement, cost per kilolitre or gallon. Serial Number: See Section 4.2 below.
Alarm reset: To Reset an alarm it must be turned off/ set to zero, before setting the alarm to anther value.
METER SETUP (ENERGY):
Daily Limit: An alarm is raised when the energy consumption today exceeds this setting.
Amps Alarm: An alarm is raised if the measured electrical current exceeds the set value. Factor: This is a user adjustable factor to calibrate the energy reading where required. Voltage: The nominal mains voltage. CT Amps: The energy sensor is supplied with a Current Transformer and the rated value of the full scale current is entered here. Cost per kWh: This can be obtained from your energy statement, cost per kWh. Serial Number: See Section 4.2 below.
4.1 SETTING UP TIME, DATE and DAY
• Press the down arrow button to General Setup and press OK.
• The TIME function is already highlighted, press OK and use the down arrow to start changing the values. Press OK to set value and move on to the next value. Press up button to go back to main menu.
• Do the same for setting DATE and DAY of the week.
Alarm reset: To Reset an alarm it must be turned off/ set to zero, before setting the alarm to anther value.
4.2 SETTING THE SERIAL NUMBER Every sensor has a unique serial number that needs to be entered into the Display to allow a wireless connection to be made between the sensor and Display. The serial number is located inside the battery cover of each sensor. Every Aquamonitor comes with their own set serial number.
To install a new sensor, enter the serial number using the Display setup below or the Aquamonitor Greenstar software utility. To assign one of the meters in the Aquamonitor as an energy sensor the software utility must be used. See the section 9 under Configure Sensors. Do not assign an energy sensor as a water sensor or a water sensor as an energy sensor.
(example serial number only)
NOTE: For one sensor, Meter 1 serial number must be entered with no serial numbers in Meter 2 and Meter 3. If two sensors are used, the serial numbers must be entered in Meters 1 and Meter 2 but meter 3 but not 3.
If the serial number is incorrect then a wireless connection cannot be made between the sensor and Display.

4
5) PRE-INSTALLATION Please read and understand the Safety and Usage Precautions in this guide prior to installation.
Step 1: Installing the Display
Choose a location for the Display, which must be within wireless range of the sensors. The wireless range will depend on the presence of objects, such as walls and vegetation between the Display and each sensor.
The Display can be wall mounted using the wall bracket. To place it on a bench remove the wall bracket and rotate the footstand outwards.
Wireless range is usually best when the sensor and Display are located away from the ground and the antenna is more than one foot above the ground.
Unpack the Display and connect the DC plug pack to the Display and switch the power on at the wall.
Refer to previous Section on Menu setup, and enter the menu system by pressing the OK button. Use the menu to check and set energy and water meter settings and alarms. The date and time can also be changed if needed. Refer to Section 7 for pulse volume setting.
Step 2: Battery Insertion
Unpack the Energy or Water Meter sensors and install new 3.6 volt Lithium AA battery in the sensors by removing the two outer screws and sliding off the battery compartment.
Check the polarity (+ and -) which is shown inside the battery cover. Drop the battery into to cover first then fit the cover to the sensor. As the compartment is refitted, check
that the LED indicator on the sensor flashes briefly after one minute. If the LED indicator does not flash, check the orientation and type of battery used.
Step 3: Observe the Display Monitor
Observe the Display after a few minutes to check that a wireless connection has been established for each sensor. The wireless update rate is once per minute. Note that each bar of the wireless status icon means a successful transmission for each minute, with a maximum of 5 bars. A wireless status of 5 bars means the communications have been 100% successful for the past 5 minutes.
6) MOUNTING THE SENSOR Mounting Bracket
The sensor mounting bracket is a two-part design that securely clips to the rear of the sensor enclosure.
Mounting the Sensors
The bracket can be used for surface mounting or for pipe mounting. A surface mounting example is shown below.
Alternately, the mounting foot can be removed so that the sensor bracket can clip over a pipe. Remove the mounting bracket screw and slide the bracket off the mounting foot. Then slide the bracket over the pipe and refit and tighten the screw. A padlock may also be fitted for security.
The flexible cord between the sensor enclosure to the water meter allows the enclosure to be mounted in an area that provides good wireless signal coverage. In general, the wireless range improves when the enclosure is mounted higher above the ground.
NOTE: If you use more than one sensor, ensure that they are installed more than one foot away from each other. Failure to do so will result in compromised radio communications and potential data corruption.

5
7) WATER METER SENSOR INSTALLATION
The Aquamonitor GreenStar Display allows for connection of a maximum of three (3) water meters. Each water meter sensor is designed to work with a pulse-output water meter.
Most common water meters have a facility for an electronic pulse output from the meter, such as a reed switch probe. The number and frequency of the pulses depends on the water flow rate and the pulse value of water meter. No part of the Aquamonitor comes in direct contact with the water. There are many types of water meters and the following section applies to Elster V100 meters which are commonly found in many countries. Instructions to suit other meters are supplied with the package to suit your meter.
Locating and Inserting the Probe:
The hole for inserting the probe is positioned in the V100 water meter counter (or register) and is protected with a removable plastic plug.
Remove and discard the plastic plug and check that the hole is free of debris. Insert the probe into the hole and align with screw hole. Fit the M3 screw to align and fasten the probe within the meter body.
For installation of the sensor enclosure, try to position the sensor away from nearby objects and walls but still close enough that the probe can be inserted in the meter. The sensor can be pipe mounted: the bracket is designed to fit 25 to 30 mm diameter pipes using the supplied rubber insert and 30 to 35mm tubes without the insert. Alternately the pipe mount bracket can be clipped onto the surface mount bracket to allow the sensor to be mounted on a wall or lid.
Sensor probe location for a V100 Meter
Secure the probe with an M3 Screw
Determining the Pulse Volume
For water meters such as V100 types, the rotating display counter has a small magnet fitted within the end roller. As the counter rotates the Aquamonitor probe detects magnetic ‘pulses’ for each revolution of the end roller. The volume of water per pulse is a function of the water meter and the Aquamonitor is designed to work with a range of values.
Some models of water meters produce one pulse for every 5 litres of water flow whilst others provide one pulse for every 0.5 litres of water. Enter the pulse volume at the water meter setup menu to ensure that the Aquamonitor displays an accurate reading of the water consumed – as detailed below: If your V100 water meter counter has four red rollers as shown in the figure below, then enter “00.500” as the pulse volume, meaning 500 ml per pulse.
4 3 2 1 0 0 0 0 If the meter has thee red rollers as show below, enter “05.000” as the pulse volume, meaning 5000 ml per pulse.
5 4 3 2 1 0 0 0 Checking the Wireless Connection Allow a few minutes then check the wireless connection to the sensor by checking the status bar on the Display. Allow ten minutes for three sensors to connect and display all five bars. The status bar will show one small icon for each connected sensor. The Status screen also shows the wireless connection status and in more detail: the number of bars shows the success rate of communications between Display and sensor.

6
At first power on the Display searches for a reliable wireless channel and it can take a few minutes to establish communications with the sensor. If the wireless status is poor after a few minutes, then try moving the Display to a different location. Often the wireless range can be improved by small changes in position, and particularly by raising the sensor above the ground. Wireless range is usually best when the Display antenna (a thin black wire at the rear of the unit) is not in contact with a metal or stone bench top. The wall mount bracket can be used to fit the display up and away from the bench. With the Display powered on, the LED on the sensor will flash briefly every minute when the wireless connection is good.
8) ENERGY SENSOR INSTALLATION
The Energy Sensor is designed to measure the electrical consumption at a selected point in the building. Usually the point will be the incoming mains supply so that the energy of the whole building, house, or apartment may be monitored.
Energy is calculated by measuring electrical current flow and then multiplying by a fixed voltage and factor. The voltage is the normal AC mains supply voltage and is typically 240 or 110. A setting is also provided for a factor which allows the user to calibrate the Aquamonitor to adjust for the effects of power factor and current transformer accuracy.
The Aquamonitor energy sensor is normally supplied with a current transformer with a 100 ampere current range. However, it is possible to use the sensor with current transducers of other ranges. Please contact Aquamonitor technical for further details.
Locating and Fitting the Current Transformer
The current transformer is a split core style for easy fitting. Lift the clip to open the transformer as shown. Fit the transformer over a single phase wire and clip the transformer together to secure.
For installation of the energy sensor enclosure, try to position the unit away from nearby objects and walls. It can be pipe mounted: the bracket is designed to fit 25 – 30 mm diameter pipes using the supplied rubber insert and 30- 35mm without the insert. Alternately the pipe mount bracket can be clipped onto the surface mount bracket to allow the sensor to be mounted on a wall or lid.
Energy Sensor Menu items The settings for the energy sensor relate to the scaling and adjustment of the current measurement and to a fixed voltage setting that is used to convert the measured current to energy. The CT Amps setting must match the value shown on the current transformer, which is normally 100 amps full-scale. The voltage setting is normally 110, 120, 230 or 240 depending on the country of installation. The factor setting allows the system to be calibrated to a greater degree of accuracy. Checking the Wireless Connection Whenever an energy sensor is first powered up (or after battery or power is removed and restored) the sensor will not transmit or count readings to the display for the first 10 minutes to allow settling of the sensors readings. After 10 minutes the readings will be transmitted to the display and will counted toward power used. See previous section on Checking Wireless Connection on Water Meter Installation.
7
9) SOFTWARE UTILITY
Software The Aquamonitor Greenstar Software utility is used to configure sensor types (water or energy), measurement units and other advanced settings and to download and view stored data from the Display unit. Further details are provided in this guide.
Features • MS Windows compatible only. • Provides access to advanced setup options including
sensor type configuration, measurement units and tiered billing function.
• Facilitates detailed analysis and long term storage of data from an Aquamonitor Display Unit.
• Downloads up to 1 year of historical data (recorded hourly) from the Display Unit) using an USB connection.
• Collection of data from the display unit to a data file. Files are stored for each meter and can be selected as a single or a multiple.
• Exports stored data from the internal database to a Comma Separated Value (CSV) file for easy use with spreadsheets and other software packages.
Download Software and Drivers
The Windows compatible software and driver are provided on the Aquamonitor website here at:
http://aquamonitor.com.au/download.html
Once the USB driver has been installed, the software utility will run without needing to be setup or installed. The latest USB drivers can also be downloaded from here:
http://www.silabs.com/products/mcu/Pages/USBtoUARTBridgeVCPDrivers.aspx
The application is supplied as an executable file (.exe). Make sure the .dll files are with the .exe file in your hard drive folder. The recommended folder is C:\Aquamonitor.
Connect the Display Unit Connect the Display Unit to the computer using the supplied USB cable. It is recommended to power the Display Unit from the DC power adaptor when the USB is connected, however the Display Unit will operate from USB power. The LCD backlight function is disabled when powered from USB. Run the Software
The Aquamonitor software utility is an .exe file that was downloaded and is run by double clicking on the Aquamonitor GreenStar.exe application. The software will locate and connect to the Display Unit and begin to collect historical and current values.
A message will appear if connection is not possible. Reasons may be that the Display Unit is not connected by USB to the
computer or if there is a USB driver problem. Check the driver is ok using Windows Control Panel, Device Manager, Ports, which should list Silicon Labs CP210x USB to UART Bridge.
Note: At least one serial number must be entered into the display before connection to the software utility is possible.
Note: Do not configure the Aquamonitor with the display while connected to the software. Use the software to update the display.
Note: The display and the PC must be running the same version number to work. Connecting display version 1.3 to software version 1.5 will not work; it’s not backwards compatible.
Set the Database Start Date
The Display Unit stores historical data for up to one year. The software utility stores the historical data in a database on the computer hard drive. When the software first connects to a new Display Unit, the database start date needs to be set. Normally this will be today’s date.
If the Display Unit has been powered and collecting data from for some days or weeks prior to using the software, then the database start date can be set to an earlier date to collect the previous data.
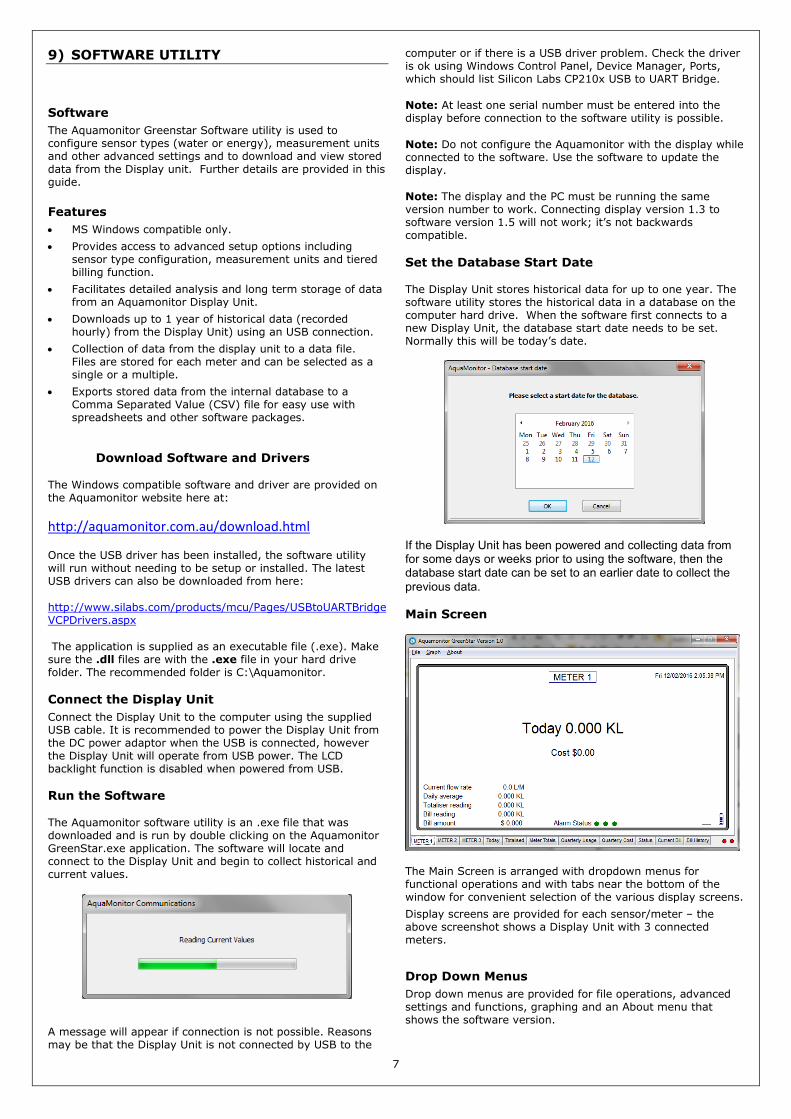
Main Screen
The Main Screen is arranged with dropdown menus for functional operations and with tabs near the bottom of the window for convenient selection of the various display screens. Display screens are provided for each sensor/meter – the above screenshot shows a Display Unit with 3 connected meters.
Drop Down Menus Drop down menus are provided for file operations, advanced settings and functions, graphing and an About menu that shows the software version.

8
File | Export Data to CSV Data collected from the Display Unit is saved to a default folder in Comma Separated Value (CSV) format which can be imported by Excel and other third party software. One CSV file is created and saved for each connected meter and the filename contains the name and serial number of the sensor. Columns are created with summary data, hourly totals and 10-minute interval values. The files can be found by clicking on File | Open Data Folder. File | Synchronise Data Data from the Display Unit is automatically synchronised when the software is started. The Synchronise Data function allows the date to be re-collected from the Display Unit to refresh the data displayed by the software. File | Open Data Folder This handy feature opens Windows Explorer and shows the folder where exported CSV and database files are automatically stored by the Aquamonitor software. Settings Opens a new window for advanced settings and allows setting of the date and time of the Display Unit and other operations.
Set to PC Time The Display Unit Date and Time are set to the computer date and time. Reset Totals Clears the resettable totaliser screen for each meter. Reset Current Bill If the water billing function is enabled, the current billing value is reset to $0.00. Erase Memory Clears all data in the Display Unit – including the historical data. The configuration settings are not altered.
Configure Sensors
The configure sensors window allows the sensor types (water or energy) to be configured the Display Unit and allows setting of the units (litres or gallons). The names for each meter can also be changed from the defaults of Meter 1, Meter 2 and Meter 3. The Update Configuration button sends any changes in configuration to the Display Unit.

9
Tiered Billing Schedule The Display Unit has two cost calculation functions: a flat rate cost per kilo unit (kilolitre, cost per 1000 Gallons or cost per kilowatt) and an optional Tiered Billing function. The flat rate calculation function can be set from the display unit menu or from the configure sensors window. Costs are displayed on the Display Unit. Enabling the Tiered Billing function does not alter the flat rate cost calculation and the flat rate costs will still show on the Display Unit.
When the Enable tiered billing check box is ticked, the Display Unit will show a Billing screen called “Current Billing Period”. This screen shows calculated costs based on the settings in the Tiered Billing Schedule, as shown above. Billing is calculated based on one or more price tiers and on a billing period. To enter the price tier, the volume for each tier is entered as a trigger point to go to the next tier. The example above shows 0 – 50 kilolitres will be billed at $0.1 per kilolitre. Above 50KL the cost will be $0.5 until the third tier is triggered when the usage is greater than 100 kilolitres. There are no further volume triggers so any consumption above 100 kilolitres will be billed at $1.0. Note: A third arbitrary tier volume must be entered for the tier system to work properly. The example above shows the billing period set for two months, meaning the billing totals will be reset every 2 months: the start date is 1 so the reset will occur on the 1st day of every second month. The Start Month setting allows the billing period to be set for Half Yearly and Yearly calendar periods.

10
10) TROUBLESHOOTING
LCD Backlight not Working The LCD backlight is disabled when the Display Unit is powered only from the USB connection.
USB Connection Problems If the display unit is not connecting to the software utility, it is not attached properly and turned on or the drivers have not been installed. Check the Control Panel, Device Manager, Ports to check that a COM port has been established when the display is connected via USB.
I Can’t Find My Data Files Use the File dropdown menu to select Open Data Folder to automatically open the folder that contains the database (.dba) file for the display and the .csv files for exported data.
Battery Replacement
Energy and water meter sensors contain a battery that can be replaced by removing the two outer screws that secure the battery cover to the housing (see page 4). When replacing batteries, check that the battery polarity is correct as shown on the inside of the battery cover.
Suitable Batteries Use only ER14505 Lithium AA 3.6V with a capacity of 2100mAh or greater. These batteries are widely used for computer memory backup. Suitable replacement models can be purchased from battery shops and computer stores.
Battery Performance The following tips will help to ensure good battery life: • Keep the Display powered on. When the Display is off
the sensors scan for a wireless connection more often and therefore consume more power.
• Use only the recommended type, voltage and capacity (mAh rating) of battery.
• Locate the sensor in a cool, dry environment. A good quality battery should last approximately one and a half years on average.
Battery Status Indication The Status Bar (see Information Display) shows a battery icon representing the lowest battery health of all connected sensors. The battery status of each sensor is shown individually on the Status screen.
*Reset All Data: The Display stores internal data to allow display of information such as the quarterly consumption. When the Reset All Data function is used then all internal stored information including totalised, weekly and daily consumption figures will be erased. It is recommended to only use this function when the Display is moved to a new site or installation and to download the data prior.
Water Meter Resolution
The Aquamonitor works by detecting ‘pulses’ from the water meter. Some meters produce a pulse for every 2.5 litres of water flow. This means the Aquamonitor may not receive an updated reading if less than 2.5 litres of water is used. This is due to the construction of the water meter and not to the function or operation of the Aquamonitor.
Energy Sensor Measurement The Energy Sensor measures electrical current using a split core current transformer. Electrical current readings are multiplied by a nominal ac voltage to calculate energy usage. A factor can be entered to allow for calibration and power factor differences.
Data retention and storage The Aquamonitor display stores accumulated readings and statistical data to non-volatile memory once every hour. Information stored in non-volatile memory is not lost when the power is removed from the display. The display holds up to 365 days of data before over writing. In situations where the sensor is not able to send data to the display, the sensor can hold up to one days of readings before over writing. Support For further help with your Aquamonitor please refer to the place of purchase or email [email protected].
Aquamonitor Pty Ltd


![User Manual for Greenstar i Junior Manufactured From Aug 09[1]](https://static.fdocuments.in/doc/165x107/544b1715b1af9f88588b49a8/user-manual-for-greenstar-i-junior-manufactured-from-aug-091.jpg)