
AquaChem, Phreeqc
33
Introduction to hydrogeochemical data evaluation and modeling (AquaChem, Phreeqc) Part 1 [email protected] Lectures Outline Aqueous geochemical data management Creation of a hydrogeochemical database Graphical illustration of hydrochemical data Simple hydrochemical calculations (e.g. unit conversation, simple mixing…) Geochemical Modeling General Approach Modeling Resources Speciation Batch-Reaction One-Dimensional Transport Inverse Geochemical Calculations
Transcript of AquaChem, Phreeqc
1
Introduction to hydrogeochemical data evaluation and modeling(AquaChem, Phreeqc)
Part [email protected]
Lectures Outline
Aqueous geochemical data managementCreation of a hydrogeochemical databaseGraphical illustration of hydrochemical dataSimple hydrochemical calculations (e.g. unit conversation, simple mixing…)
Geochemical ModelingGeneral ApproachModeling ResourcesSpeciation Batch-Reaction One-Dimensional TransportInverse Geochemical Calculations
2
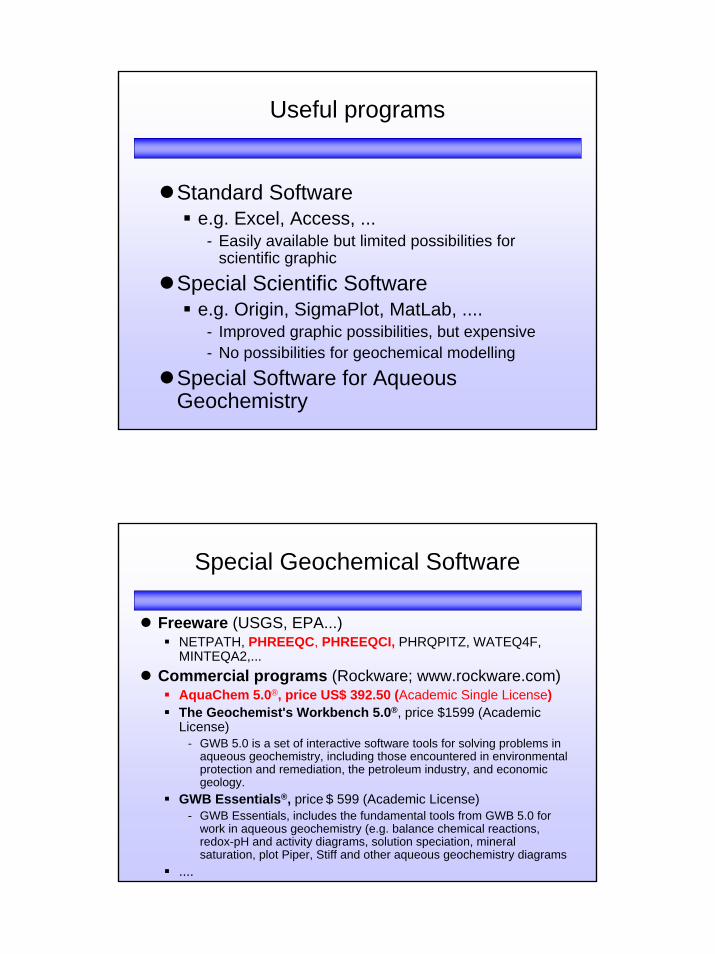
Useful programs
Standard Software e.g. Excel, Access, ...
- Easily available but limited possibilities for scientific graphic
Special Scientific Softwaree.g. Origin, SigmaPlot, MatLab, ....
- Improved graphic possibilities, but expensive- No possibilities for geochemical modelling
Special Software for Aqueous Geochemistry
Special Geochemical Software
Freeware (USGS, EPA...)NETPATH, PHREEQC, PHREEQCI, PHRQPITZ, WATEQ4F, MINTEQA2,...
Commercial programs (Rockware; www.rockware.com) AquaChem 5.0®, price US$ 392.50 (Academic Single License) The Geochemist's Workbench 5.0®, price $1599 (Academic License)
- GWB 5.0 is a set of interactive software tools for solving problems in aqueous geochemistry, including those encountered in environmental protection and remediation, the petroleum industry, and economicgeology.
GWB Essentials®, price $ 599 (Academic License)- GWB Essentials, includes the fundamental tools from GWB 5.0 for
work in aqueous geochemistry (e.g. balance chemical reactions, redox-pH and activity diagrams, solution speciation, mineral saturation, plot Piper, Stiff and other aqueous geochemistry diagrams
....
3
AquaChem 5.0
AquaChem - Introduction
AquaChemis a software package developed specifically for graphical and numerical analysis and modeling of water quality data.
features a fully customizable database of physical and chemical parameters.
provides a comprehensive selection of analysis tools, calculations and graphs for interpreting, plotting and modeling water quality data.

4
AquaChem – Analysis tools
AquaChem’s analysis tools include:
simple unit transformations, charge balances, statisticssample mixingcommon geochemical calculationscorrelation matricesgeothermometer calculations.
AquaChem - Data Management
DatabaseAquaChem utilizes an MSAccess™ relational data management system and is capable of supporting an unlimited number of parameters.
Data Querying and Filtering
Two-click access to user-defined data filters for fast isolation and retrieval of selected samples.
Water Quality StandardsComes with built-in standards from WHO, USEPA, and CCME
Importing Data Fast, flexible, and easy data entry using tabular views of multiple samples, form views of individual samples, or using the improved data import wizard with automatic matching of CAS Registry Numbers
5
AquaChem - Plotting
AquaChem - Selection of graphical techniques for representing and interpreting aqueous geochemical data:
Correlation plots: X-Y Scatter, Ludwig-Langelier, and Wilcox
Summary plots: Frequency Histogram, Depth Profile, Schoeller, Box and Whisker, Meteoric Water Line, Quantile plot
Trilinear plots: Piper, Durov, Ternary, and Giggenbach
Time-Series plot: Multiple parameters for a selected station, or a single parameter for multiple stations
Geothermometer plot
Sample plots: Radial, Stiff, and Pie
Thematic Map plots: Bubble, Pie, Radial and Stiff plots at sample locations
AquaChem - Geochemical modeling
Direct link to PHREEQCto calculate the saturation indices, activities or pH for selected water quality samples and seamlessly save the results back into the AquaChem sample database
Built-in link to the USGS PHREEQC-Interactive program
for complex water quality modeling using solutions generated from AquaChem samples
6
AquaChem - Overview
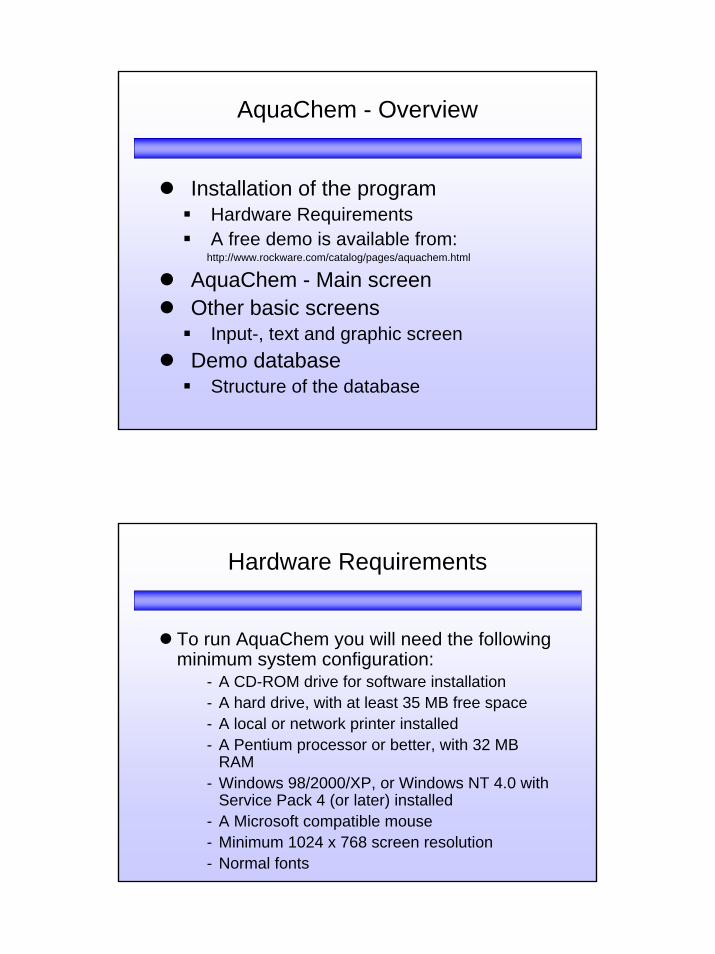
Installation of the programHardware RequirementsA free demo is available from:
http://www.rockware.com/catalog/pages/aquachem.html
AquaChem - Main screenOther basic screens
Input-, text and graphic screenDemo database
Structure of the database
Hardware Requirements
To run AquaChem you will need the following minimum system configuration:
- A CD-ROM drive for software installation- A hard drive, with at least 35 MB free space- A local or network printer installed- A Pentium processor or better, with 32 MB
RAM- Windows 98/2000/XP, or Windows NT 4.0 with
Service Pack 4 (or later) installed- A Microsoft compatible mouse- Minimum 1024 x 768 screen resolution- Normal fonts
7
Starting AquaChem
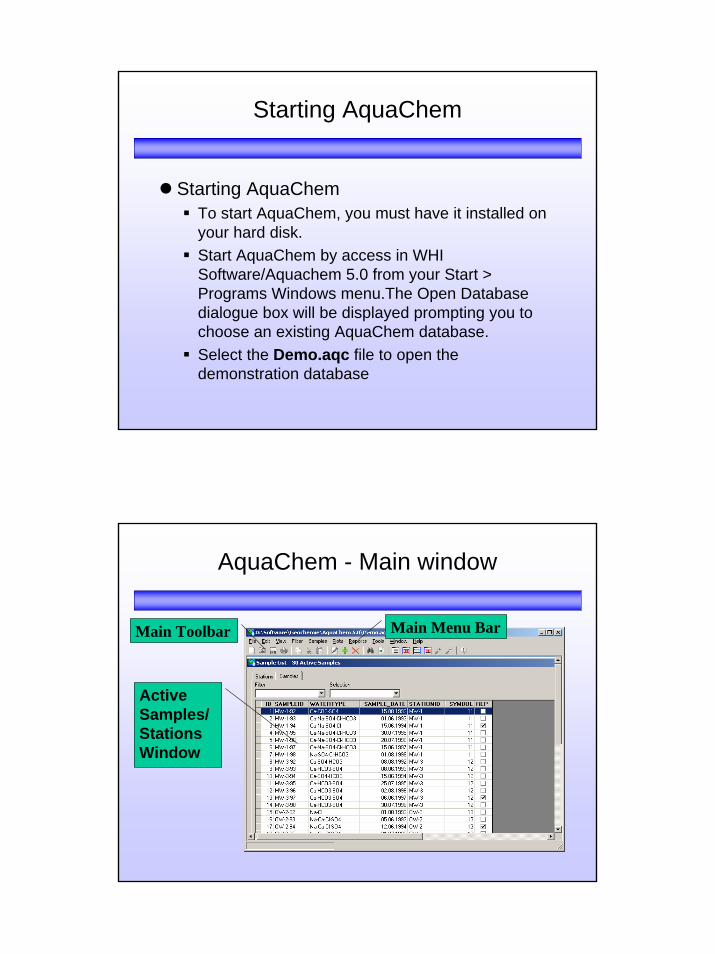
Starting AquaChemTo start AquaChem, you must have it installed on your hard disk. Start AquaChem by access in WHI Software/Aquachem 5.0 from your Start > Programs Windows menu.The Open Database dialogue box will be displayed prompting you to choose an existing AquaChem database. Select the Demo.aqc file to open the demonstration database
AquaChem - Main window
Active Samples/Stations Window
Main Toolbar Main Menu Bar

8
Active Sample/Stations window
Samples and Stations
Sample Details Window

9
Station Details Window
Data Input
Data can be entered into the *.aqcdatabase file by either;
1. Importing a MS Exel or a tab-delimited ASCII text file;
2. Using the input window, or3. Using the spreadsheet window.
10
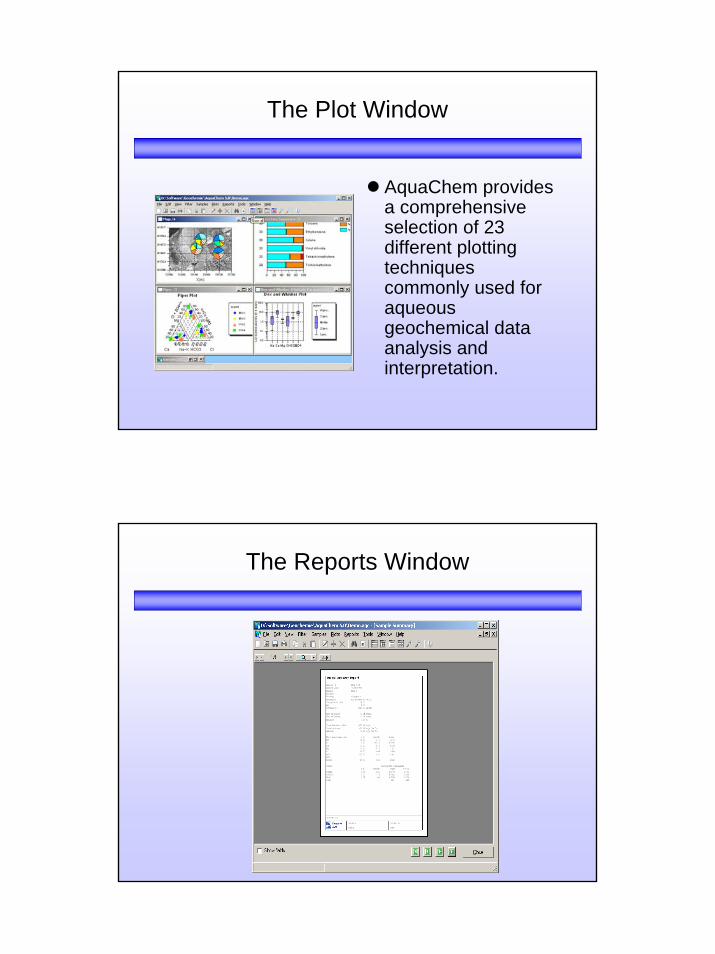
The Plot Window
AquaChem provides a comprehensive selection of 23 different plotting techniques commonly used for aqueous geochemical data analysis and interpretation.
The Reports Window
11
AquaChem - Database
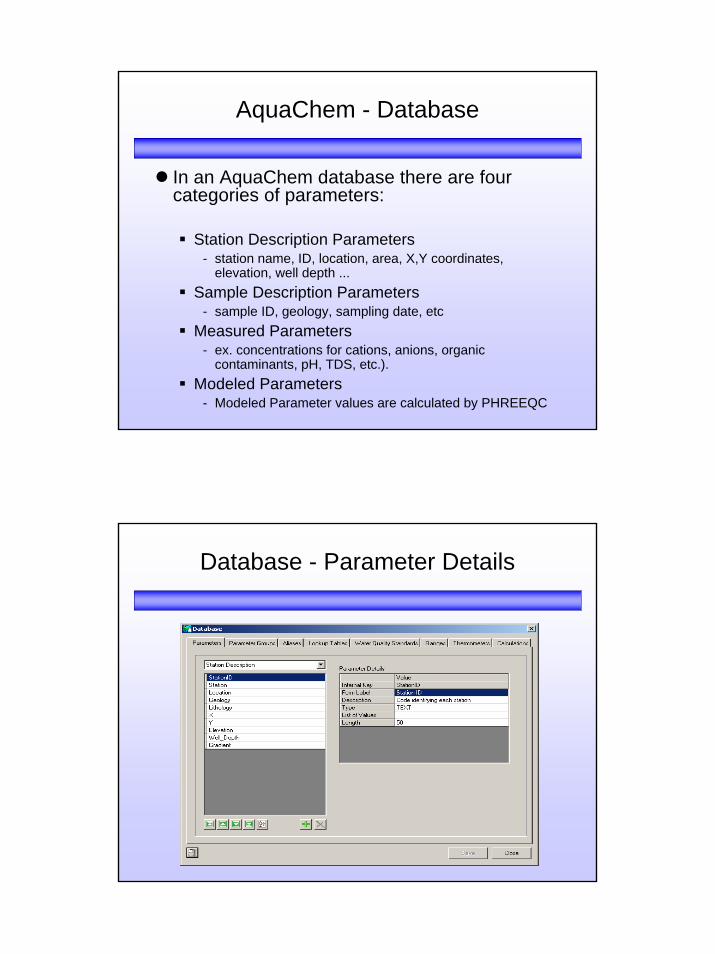
In an AquaChem database there are fourcategories of parameters:
Station Description Parameters- station name, ID, location, area, X,Y coordinates,
elevation, well depth ...Sample Description Parameters
- sample ID, geology, sampling date, etcMeasured Parameters
- ex. concentrations for cations, anions, organiccontaminants, pH, TDS, etc.).
Modeled Parameters- Modeled Parameter values are calculated by PHREEQC
Database - Parameter Details

12
How to look at a set of geochemical datawith AquaChem
Creating of a hydrochemical data baseCheck analytical dataVisual graphicsSimple calculationsThermodynamic calculationsGeochemical reaction path modeling
How to look at a set of geochemical datawith AquaChem
Creating of a hydrochemical data baseCheck analytical dataVisual graphicsSimple calculationsThermodynamic calculationsGeochemical reaction path modeling

13
Analytics
Have all major solutes? Do electrochemical balance. If bad figure out why.Can you make assumptions based on probable water-rock interaction.pH, water temperature--master variables.
If you don't have it, you can’t make geochemical modelling
Analysis control - Introduction
How good are the chemical data from theLab?
You didn't think YOU were going to do theanalyses, did you?
14
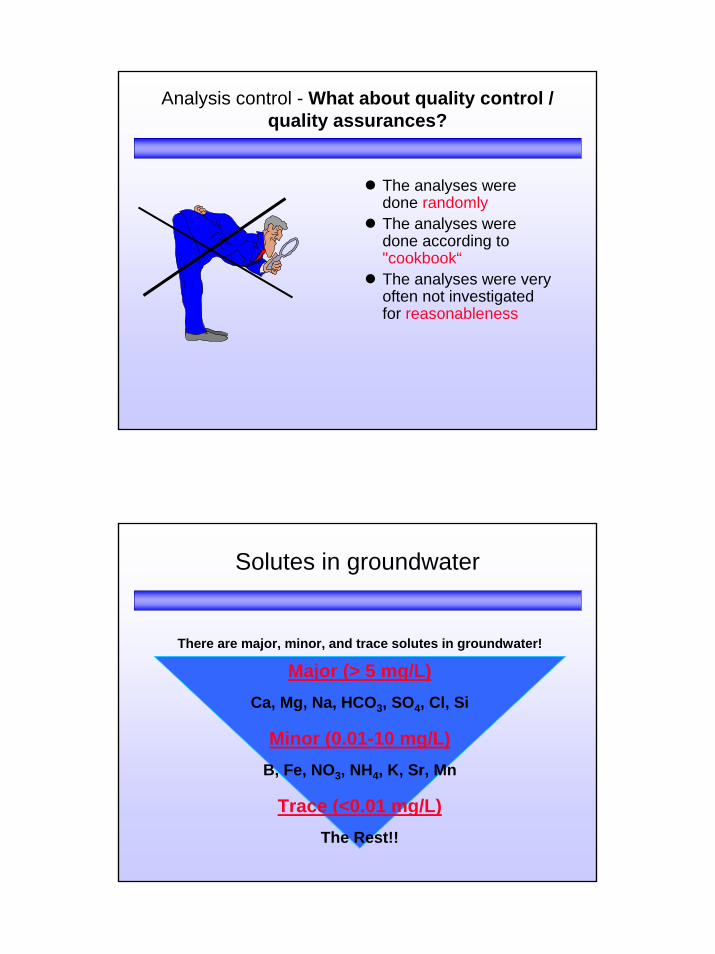
Analysis control - What about quality control / quality assurances?
The analyses weredone randomlyThe analyses weredone according to "cookbook“The analyses were veryoften not investigatedfor reasonableness
There are major, minor, and trace solutes in groundwater!
Major (> 5 mg/L)Ca, Mg, Na, HCO3, SO4, Cl, Si
Minor (0.01-10 mg/L)B, Fe, NO3, NH4, K, Sr, Mn
Trace (<0.01 mg/L)The Rest!!
Solutes in groundwater
15
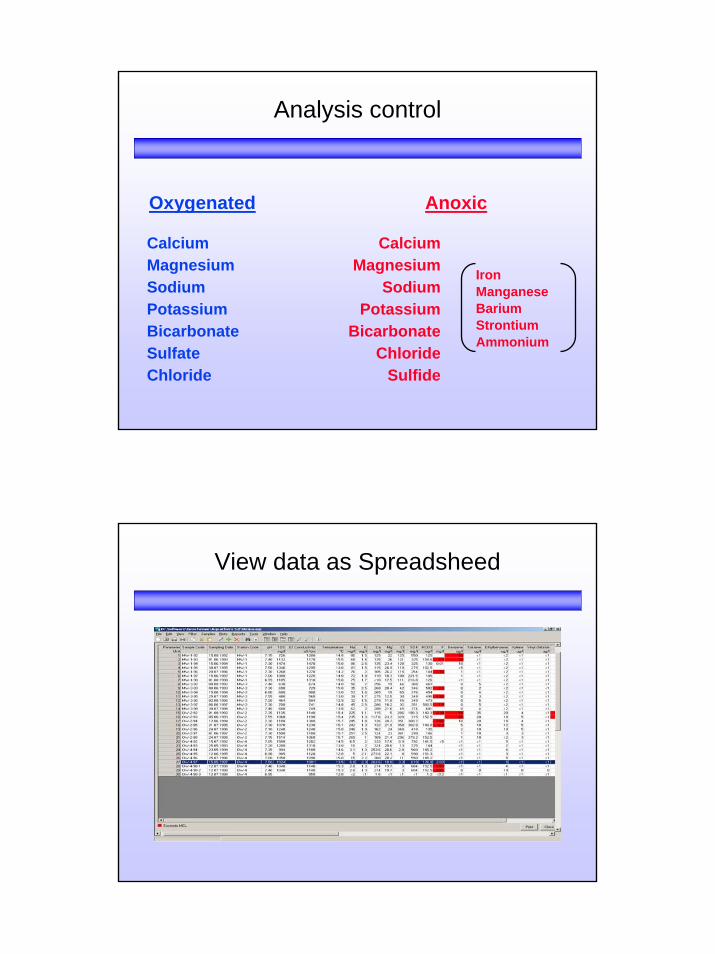
Analysis control
CalciumMagnesiumSodiumPotassiumBicarbonateSulfateChloride
Oxygenated Anoxic
CalciumMagnesium
SodiumPotassium
BicarbonateChloride
Sulfide
IronManganeseBariumStrontiumAmmonium
View data as Spreadsheed

16
Electrical Neutrality
The sum of the positive charges in solutionsmust equal the sum of the negative ones!
!!
Introduction- Charge-balance error I
Aqueous solutions must be electrically neutral. In other words, the sum of all negative charges must equal the sum of all positive charges.
One check on the quality of a water analysis is the charge-balance error, calculated as follows:
100C.B.E. ×+−
=∑ ∑∑ ∑
aacc
aacc
zmzmzmzm
17
Introduction- Charge-balance error II
There is always some error in the measurement of cation and anion concentrations.Thus, we cannot expect a charge-balance error of zero for any analysis.The C.B.E. may be positive or negative, depending on whether cations or anions are more abundant.A reasonable limit for accepting an analysis as valid is ±5%.
Analysis control - Calculating electrochemicalbalance
1. Convert mg/L to mmol/L
2. Convert mmol/L to meq/l mmol/L X charge (abs)
3. SUM Cations and SUM Anions
4. Apply formula
mg/Lgram formula
weight
= mmol/L
SumCat - SumAN
SumCat + SumANx 100 = % error(0.5 x)1
1 some EU-countries eg. Austria, Germany

18
Balance: 100% x = 0.2%1/2(Sum of Anions + Sum of Cations)
Sum of Anions - Sum of Cations
Analysis control - Electrochemicalbalance (example)
Major ion compositionIon mg/l mmol/l meq/l meq%
--------------------------------------------------------Na 5.75 0.25 0.25 0.425K 2.0 0.051 0.051 0.087Ca 530.0 13.224 26.447 44.951Mg 32.1 1.32 2.641 4.489Cl 10.6 0.299 0.299 0.508SO4 1139.4 11.862 23.724 40.322HCO3 323.4 5.3 5.3 9.008
Sum of Anions (meq/l) : 29.37Sum of Cations (meq/l) : 29.46
Electrochemical balance - Aquachem

19
Electrochemical balance - Aquachem
Analysis control - Problems in electrochemical balance calculations
Organic acids (RCOOH) add unanalyzednegative charge--high positive imbalances;
Ex: "Black" swamp waters
Often won't work if "total" analyses are used;
Are routinely (contract lab) difficult to get forground-water with TDS <100 and TDS >5000 (..but there's no excuse!!!).
20
REASONS FOR C.B.E. VALUES GREATER THAN ±5%
An important anion or cation was not included in the analysis.
Sometimes this can point out the presence of a high concentration of an unusual anion or cation.
A serious, systematic error has occurred in the analysis.One or more of the concentrations was recorded incorrectly.
Analysis control - Acceptable error in analysis ?!
Typical consulting lab <20%USGS/EPA < 7%Research Lab <3%
21
How to look at a set of geochemical datawith AquaChem
Creating of a hydrochemical data baseCheck analytical dataVisual graphicsSimple calculationsThermodynamic calculationsGeochemical reaction path modeling
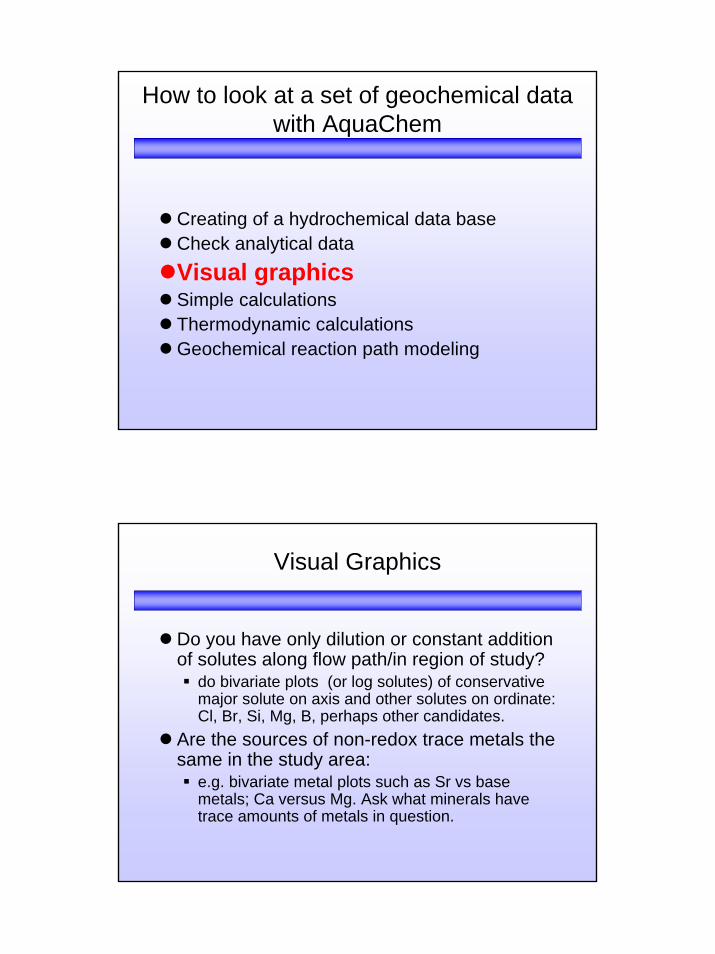
Visual Graphics
Do you have only dilution or constant addition of solutes along flow path/in region of study?
do bivariate plots (or log solutes) of conservative major solute on axis and other solutes on ordinate: Cl, Br, Si, Mg, B, perhaps other candidates.
Are the sources of non-redox trace metals the same in the study area:
e.g. bivariate metal plots such as Sr vs base metals; Ca versus Mg. Ask what minerals have trace amounts of metals in question.

22
Bivariate Plots?
They show water mixtures.
They identify dilution
They can be statistically characterized
They identify major chemical reactions
Fundamental Bivariate Mixing Equation
C1 (1-n) + C2 n = Cmix
Where:C1 : Concentration in water-1C2 : Concentration in water-2n : Percent (by volume) of water-2 per liter of water 1-n: Percent (by volume) of water-1 per liter of water
23
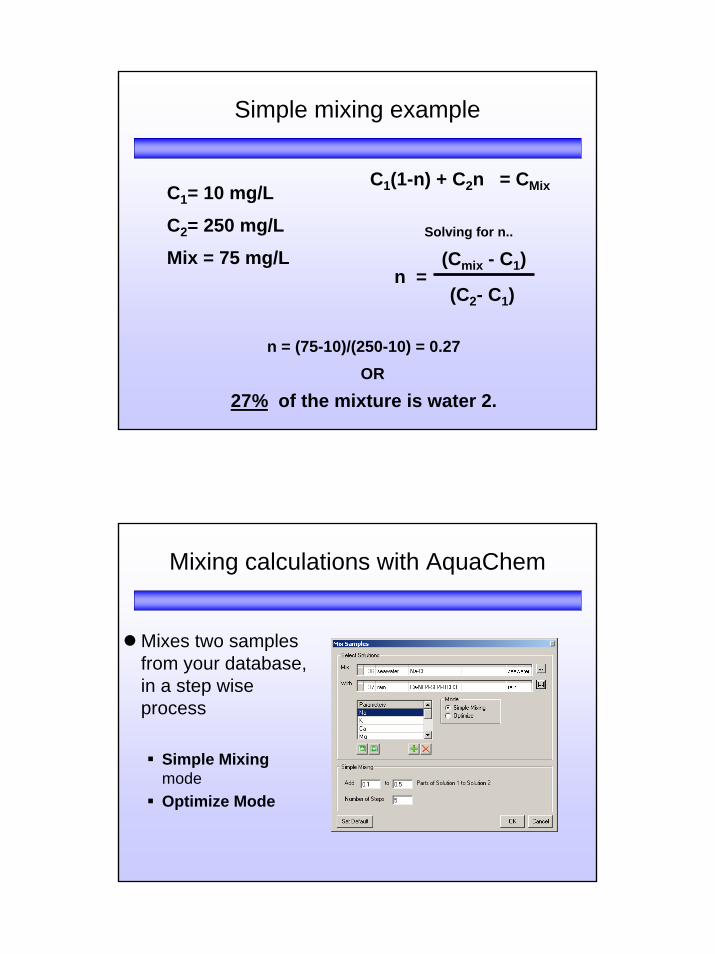
Simple mixing example
C1= 10 mg/L
C2= 250 mg/L
Mix = 75 mg/L
C1(1-n) + C2n = CMix
Solving for n..
(Cmix - C1)
(C2- C1)n =
n = (75-10)/(250-10) = 0.27OR
27% of the mixture is water 2.
Mixing calculations with AquaChem
Mixes two samplesfrom your database, in a step wiseprocess
Simple MixingmodeOptimize Mode

24
Result
0 100 200 300 400 500
Na (mmol/l)
0
120
240
360
480
600
Cl (
mm
ol/l)
Mixing example (mixing step 10%)
C
C
C
CC
D
D LegendLegend
C Mix 1D rainD seawater
Concentrations in Mixtures areProportional to Volumes
50:50
90:10

25
Mixing calculations with AquaChem
In addition to mixing two samples, AquaChem also allows you to analyze the composition of a specifiedsample by choosing the Optimize option. Specify thetwo initial samples, and specify the resulting sample. AquaChem will mix the two initial samples in 2% increments until the Euclidean distance between thecalculated mixture and specified resulting sample isminimized.
Result
26
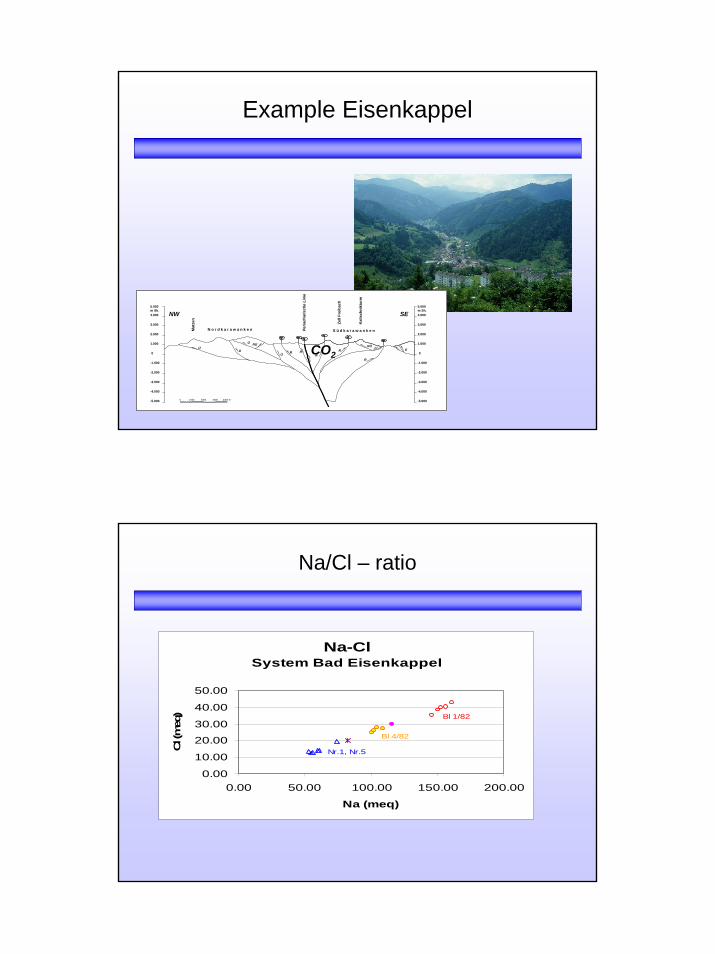
Example Eisenkappel
Peria
dria
tisch
e Li
nie
ÜÜ
Ü RÜ
Ü R RR
RRÜ
R
Ü
NW SE5.000m Sh.4.000
3.000
2.000
1.000
0
-1.000
-2.000
-3.000
-4.000
-5.000
1.000
2.000
3.000
4.000
5.000m Sh.
0
-1.000
-2.000
-3.000
-4.000
-5.000
Mat
zen
Zell
Frei
bach
Kal
isch
nikt
urm
S ü d k a r a w a n k e nN o r d k a r a w a n k e n
0 1000 2000 3000 4000 m
CO2
Na/Cl – ratio
Na-Cl System Bad Eisenkappel
0.00
10.00
20.00
30.00
40.00
50.00
0.00 50.00 100.00 150.00 200.00
Na (meq)
Cl (
meq
)
Nr.1, Nr.5
Bl 4/82
Bl 1/82
27
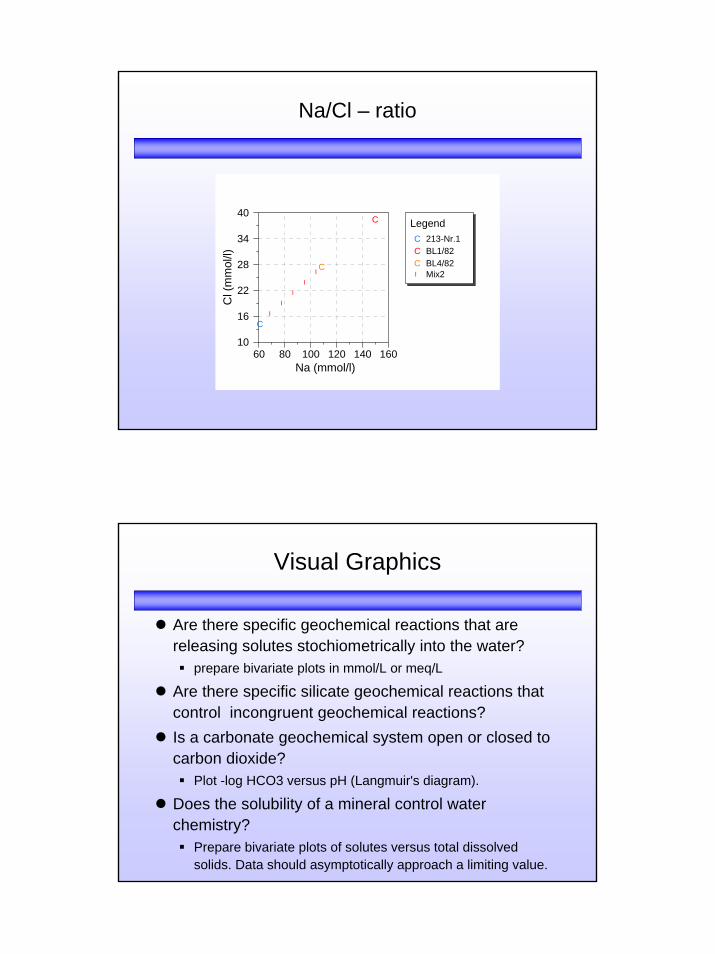
Na/Cl – ratio
60 80 100 120 140 160Na (mmol/l)
10
16
22
28
34
40C
l (m
mol
/l)
II
II
I
C
C
C
LegendLegendC 213-Nr.1C BL1/82C BL4/82I Mix2
Visual Graphics
Are there specific geochemical reactions that are releasing solutes stochiometrically into the water?
prepare bivariate plots in mmol/L or meq/L
Are there specific silicate geochemical reactions that control incongruent geochemical reactions? Is a carbonate geochemical system open or closed to carbon dioxide?
Plot -log HCO3 versus pH (Langmuir's diagram).
Does the solubility of a mineral control water chemistry?
Prepare bivariate plots of solutes versus total dissolved solids. Data should asymptotically approach a limiting value.
28
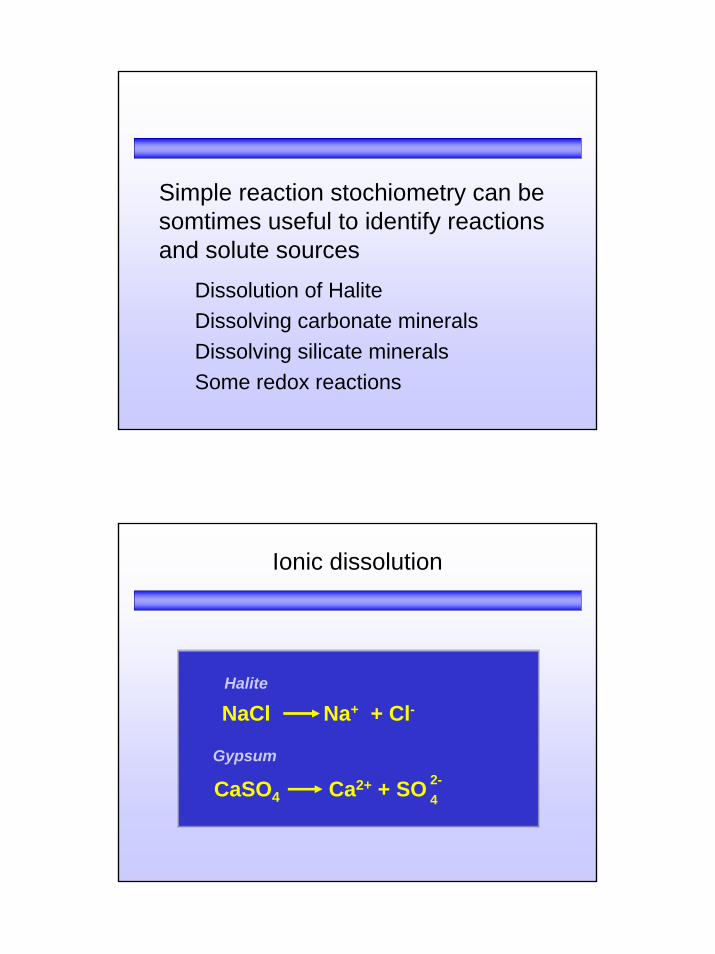
Simple reaction stochiometry can be somtimes useful to identify reactions and solute sources
Dissolution of HaliteDissolving carbonate mineralsDissolving silicate mineralsSome redox reactions
NaCl Na+ + Cl-
CaSO4 Ca2+ + SO
Halite
Gypsum2-4
Ionic dissolution

29
1mmol NaCl 23mg/L Na+ + 35 mg/L Cl-
1 mmol CaSO4 40 mg/L Ca++ + 96 mg/L SO4--
Halite
Gypsum
Ionic Dissolution II
Ca(Mg)CO3 + CO2 + H2O Ca2+ + Mg2+ + 2 HCO3
-
Silicates
Carbonates
Feldspar + nCO2 + nH2O base cations + nHCO3
- + clay+ nsilica
Hydrolysis

30
Scatter plots I
The X-Y scatter plots are the most simple initial approach to the interpretation of geochemical data.
Single plots of ion relationship and parameters that show significant data can be easily created and patterns are quickly identified and easily understood. Both normal scale and log scales are common for the x and y axesElement ratios and sums can also be included for either axes.
Scatter plots II
-0.4
-0.2
0
0.2
0.4
0.6
0.8
-3.5 -3.25 -3 -2.75 -2.5 -2.25 -2
log pCO2
SI C
alci
t
L 101 L 162 L 164 L 17 L 191 L 195 L 22 L 230 L 437 L 444 L 447 L 449 XQ 11

31
Open or closed carbonate geochemical system
10
100
1000
6.0 6.5 7.0 7.5 8.0 8.5
pH
HC
O3
[mg/
l]pCO2 = -1.4, geschl.pCO2 = -1.5, offenpCO2 = -1.5, geschl.pCO2 = -1.6, geschl.pCO2 = -1.7, geschl.pCO2 = -1.8, geschl.pCO2 = -1.9, geschl.pCO2 = -2.0, offenpCO2 = -2.0, geschl.pCO2 = -2.5, offenpCO2 = -2.5, geschlpCO2 = -3.0, offenpCO2 = -3.5, offenL101L 162L164L17L191L195L22L230L437L444L447L449LXQ11SI Calcit = 0SI Dolomit = 0
Visual Graphics
Are there two different waters mixing? Plot data on ternary or Piper diagrams.
What is the area distribution of water types?Plot stiff diagrams.
Can many waters easily be subdivided into facies?
Use semilog plots. What are the proportions of mixing of two waters?
Use Piper diagram or three-component diagram with matrix algebra or factor analysis (STATS).
32
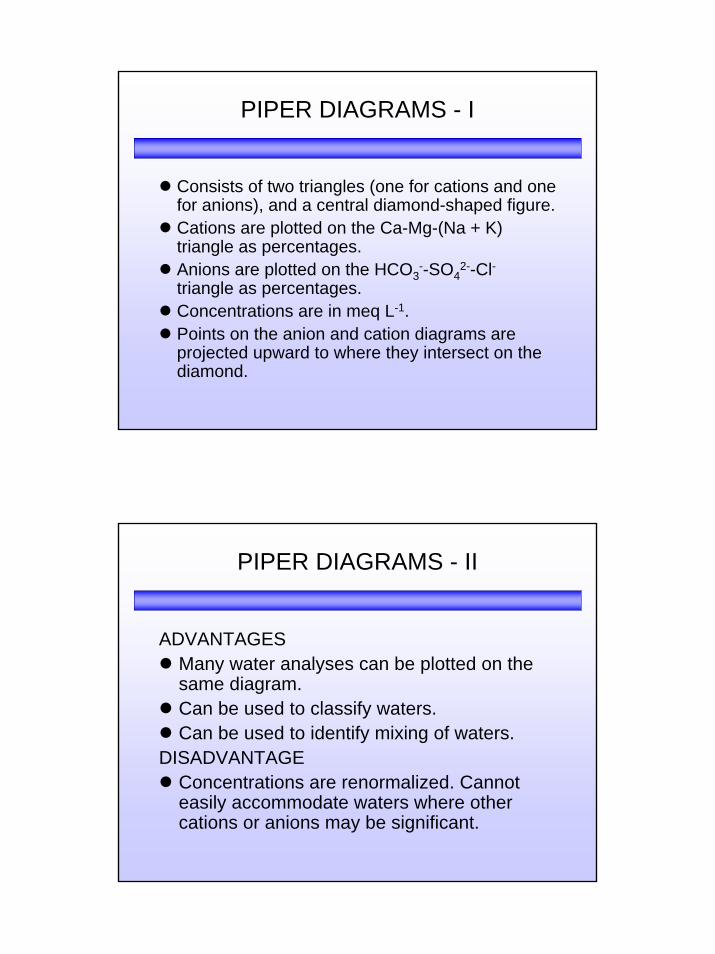
PIPER DIAGRAMS - I
Consists of two triangles (one for cations and one for anions), and a central diamond-shaped figure.Cations are plotted on the Ca-Mg-(Na + K) triangle as percentages.Anions are plotted on the HCO3
--SO42--Cl-
triangle as percentages.Concentrations are in meq L-1.Points on the anion and cation diagrams are projected upward to where they intersect on the diamond.
PIPER DIAGRAMS - II
ADVANTAGESMany water analyses can be plotted on the same diagram.Can be used to classify waters.Can be used to identify mixing of waters.
DISADVANTAGEConcentrations are renormalized. Cannot easily accommodate waters where other cations or anions may be significant.

33
Cations Anions
Cl+
SO4
Ca+Mg
Mg
Ca Na HCO3Cl
SO4
Ca-SO4
Na-ClCa-Mg-HCO3
Na-HCO3
The four major groundwater types


