APT/AWG/REP-57 - Asia-Pacific Telecommunity · Web viewMSS systems can provide ubiquitous...
85
APT REPORT on STUDIES WITHIN THE ARCHITECTURE AND PERFORMANCE OF INTEGRATED MSS SYSTEMS AND HYBRID SATELLITE/TERRESTRIAL SYSTEMS BELOW THE 3 GHZ BAND No. APT/AWG/REP-57 Edition: September 2014 Adopted by 17 th Meeting of APT Wireless Group
Transcript of APT/AWG/REP-57 - Asia-Pacific Telecommunity · Web viewMSS systems can provide ubiquitous...

APT REPORT
on
STUDIES WITHIN THE ARCHITECTURE AND PERFORMANCE OF INTEGRATED MSS SYSTEMS AND HYBRID SATELLITE/TERRESTRIAL
SYSTEMS BELOW THE 3 GHZ BAND
No. APT/AWG/REP-57 Edition: September 2014
Adopted by
17th Meeting of APT Wireless Group23 - 26, September 2014
Macao, China
(Source: AWG-17/OUT-17)

APT REPORT ON STUDIES WITHIN THE ARCHITECTURE AND PERFORMANCE OF INTEGRATED MSS SYSTEMS AND HYBRID SATELLITE/TERRESTRIAL SYSTEMS BELOW
THE 3 GHZ BAND
Table of Contents
1. Purpose.......................................................................................................................................................4
2. Scope...........................................................................................................................................................4
3. Definitions..................................................................................................................................................4
4. Abbreviations............................................................................................................................................5
5. Background................................................................................................................................................5
6. Integrated MSS system.............................................................................................................................7
6.1. Overview....................................................................................................................................................7
6.2. Applications and example systems............................................................................................................7
6.3. Possible system architecture and features.................................................................................................8
6.4. Potential constraints on system performance and proposed enhancements...........................................106.4.1. Frequency reuse..........................................................................................................................106.4.2. References..................................................................................................................................14
6.5. System performance evaluation..............................................................................................................156.5.1. Parameters for Satellite Component...........................................................................................156.5.2. Parameters for Complementary Ground Component.................................................................166.5.3. Exclusive Zone Concept.............................................................................................................166.5.4. Link Performance and Impact on SINR.....................................................................................176.5.5 Satellite Resource Availability in CGCs.....................................................................................196.5.6 System Level Simulation Results...............................................................................................211) Simulation parameters.......................................................................................................................212) Performance in open environments...................................................................................................22a) Uplink performance...........................................................................................................................22b) Downlink performance......................................................................................................................233) Summary............................................................................................................................................24
6.6 Current Studies........................................................................................................................................246.6.1 Satellite/Terrestrial Integrated Mobile Communication System (STICS) by the National Institute of Information and Communications Technology (NICT) of Japan.........................................................246.6.2 Concept of STICS.......................................................................................................................256.6.3 System requirement....................................................................................................................266.6.4 References..................................................................................................................................276.6.5 Feasibility studies.......................................................................................................................27a) Studies on frequency sharing between terrestrial and satellite components......................................27b) Test measurement of cellular phone transmit power using test van..................................................27i. Background........................................................................................................................................27ii. Measurement system.........................................................................................................................27iii. Measurement result........................................................................................................................28iv. Summary............................................................................................................................................29v. References..........................................................................................................................................296.6.6 Test measurement of interference power from cellular phones and base stations using airplane
29a) Background........................................................................................................................................29b) Interference evaluation experiment...................................................................................................29
APT/AWG/REP-57 Page 2 of 58

c) Platform and measurement system....................................................................................................30d) Measurement and results...................................................................................................................31e) Relationship between measured power and interference to satellite.................................................33f) Evaluation model...............................................................................................................................33g) Summary............................................................................................................................................34h) References..........................................................................................................................................346.6.7 Test measurement of interference power from cellular phone in indoor/outdoor situation using handcart...........................................................................................................................................35a) Background........................................................................................................................................35b) Outdoor/Indoor propagation experiment...........................................................................................35c) Measurement system.........................................................................................................................36d) Measurement result............................................................................................................................36e) Summary............................................................................................................................................38f) References..........................................................................................................................................386.6.8 System capacity evaluation........................................................................................................38a) Background........................................................................................................................................38b) Frequency sharing scheme and interference mechanism...................................................................38c) Evaluation methodology....................................................................................................................39d) Evaluation for normal period.............................................................................................................41i. Evaluation under interference between satellite and terrestrial terminals.........................................41ii. Evaluation under interference between satellite terminals and terrestrial base stations....................42iii. Evaluation for disaster period...........................................................................................................44e) Summary............................................................................................................................................45f) References..........................................................................................................................................456.6.9 Studies on cooperative control technology between satellite and terrestrial components.........45a) Background........................................................................................................................................45b) Network architecture..........................................................................................................................45c) Simulation result with hardware simulator........................................................................................46d) Summary............................................................................................................................................47e) References..........................................................................................................................................486.6.10 Studies on technologies onboard satellite for STICS.................................................................48a) Background........................................................................................................................................48b) Study on onboard technologies for multi beamforming and low sidelobe........................................49c) Study on onboard technology for reconstruction of resource allocation...........................................51d) Summary............................................................................................................................................52e) References..........................................................................................................................................52
7. Hybrid satellite/terrestrial system.........................................................................................................52
7.1. Overview............................................................................................................................................52
7.2. Requirements from users’ point of view.............................................................................................53
7.3. Applications.......................................................................................................................................53
7.4. Key technologies for hybrid systems..................................................................................................53
7.5. Possible system architecture and features.........................................................................................54
7.6. Technical issues.................................................................................................................................55
7.7. References..........................................................................................................................................55
8. Conclusion................................................................................................................................................56
APT/AWG/REP-57 Page 3 of 58

DRAFT NEW REPORT ON STUDIES WITHIN THE ARCHITECTURE AND PERFORMANCE OF INTEGRATED MSS SYSTEMS AND HYBRID SATELLITE/TERRESTRIAL SYSTEMS BELOW THE 3 GHZ BAND
1. Purpose
This purpose of this Report is to address technical issues associated with the integrated MSS systems and hybrid satellite/terrestrial systems in the Asia-Pacific Region where natural disasters such as earthquake and tsunami occur quite often, the effective communication infrastructure that is required for providing broadband services in wide areas, bridging the digital divide and introduction of other applications.
This Report also assesses the performance of integrated MSS system and hybrid satellite/terrestrial system based on scenarios considered.
2. Scope
The scope of this Report is limited to the technical study which is within the scope of the current Terms of Reference of TG-MSA (see Document AWG-14/TMP-14 (Rev.1)). This technical study should not be related to any sharing and/or regulatory issues.
3. Definitions
For the purposes of this Report, the following definitions apply:
Integrated mobile-satellite service (MSS) system: System employing a satellite component and a complementary ground component (CGC) which is complementary to the satellite component and operates as, and is, an integral part of the MSS system. In such systems, CGC is controlled by the satellite resource and network management system. Further, CGC uses the same portions of MSS frequency bands as the associated operational mobile-satellite system.
Hybrid satellite/terrestrial system: System employing satellite and terrestrial components where the satellite and terrestrial components are directly connected, but operate independently of each other. In such systems, the satellite and terrestrial components have separate network management systems and do not operate in the same frequency band.
Dual mode: Terminal operates in both satellite system and terrestrial system.
APT/AWG/REP-57 Page 4 of 58

4. Abbreviations
For the purposes of this Report, the following abbreviations apply:
BLER Block Error RateCGC Complementary Ground ComponentDBF Digital BeamformerGBBF Ground based beam forming HSS Home Subscriber ServerMCS Modulation and Coding SchemeMME Mobility Management EntityMSS Mobile-Satellite ServiceMSS-ATC MSS-Ancillary Terrestrial ComponentMSS-CGC MSS-Complementary Ground ComponentNICT National Institute of Information and Communications TechnologyP-GW Packet Data Network (PDN) GatewayPCRF Policy & Charging Rules FunctionPPDR Public Protection and Disaster ReliefQoS Qualify of ServiceS-GW Serving GatewaySAT Satellite ComponentsSGIPS Satellite/Ground Interworking Policy ServerSINR Signal to Interference plus Noise RatioSTICS Satellite/Terrestrial Integrated mobile Communication System
5. Background
Integrated mobile-satellite service (MSS) systems and hybrid satellite/terrestrial systems are innovative space/terrestrial infrastructures with a high degree of spectrum utilization efficiency and have the ability to provide a variety of benefits that serve the public interest, including multimedia broadband services to handheld or portable terminals and public protection and disaster relief (PPDR) solutions, as well as MSS operators from economic viability and economies of scale perspectives.
MSS systems can provide ubiquitous connectivity through their wide-area coverage characteristics and offer instant and reliable communication systems within their coverage area. Their strength and utility in providing blanket coverage to terrestrial communications networks in areas where population densities cannot support introduction of large-scale commercial land-based infrastructure has made MSS systems an indispensable part of communication networks.
Terrestrial-based networks on the other hand, have their strength and traditional role in providing high capacity communication networks in suburban and urban areas, including inside buildings, that no conventional MSS system has the ability to penetrate due to excessive blockage and shadowing of the satellite link in such areas.
Figure 1 shows the three cases of MSS systems.
APT/AWG/REP-57 Page 5 of 58

Figure 1 Three cases of MSS systems
The main difference between integrated and hybrid systems is whether both the satellite and ground components use a common network and spectrum. The ground component of an integrated system is a complementary part of the satellite system, and thus it uses the same frequency band allocated to the satellite system and also it is operated by the same network. Some examples of these systems are the MSS-ATC (MSS-Ancillary Terrestrial Component) in the United States and Canada, and MSS-CGC (MSS-Complementary Ground Component) in Europe and are implemented in the 1-3 GHz bands. On the other hand, a hybrid system may combine a satellite system with the terrestrial system with different frequency bands networks, and even air interfaces. User handsets of a hybrid system can use a terrestrial system in terrestrial coverage areas as well be capable of a satellite system in satellite coverage areas. In other words, satellite systems play a complementary role of terrestrial systems. For example, in a commercial hybrid systems, some operator provides a hybrid service composed of GSM as a terrestrial system and GMR-1 as a satellite system used by one unified terminal.
To summarize, the integrated relates to a very specific network scenario and service, while the hybrid systems encompass many other network scenarios combining satellite and terrestrial components.
Amongst the main drivers or added value associated to the resulting combined network compared to a standalone satellite component among are:
Extended service area. Able to provide service to maritime, rural and low density populated areas.
Wider range of service provisioning with lower costs for customers and operators. Provides broadcast/multicast capabilities for downloading high bandwidth traffic in an extended coverage area.
Rapid and independent infrastructure deployment. Backhaul solution for fixed or mobile services, military communications and disaster recovery benefits from this capability.
APT/AWG/REP-57 Page 6 of 58

Improved Qualify of Service (QoS) delivered to operators and correspondingly, to end-users. Satellite networks are able to further complement terrestrial based internet access technology to deliver higher speed broadband service, especially in low density populated area.
Increased service availability and flexibility. Providing service for critical communication links, enabling path diversity and allows various fade mitigation methods.
6. Integrated MSS system
6.1. Overview
An integrated MSS system represents the evolution of traditional MSS networks into an integrated, single network that uses both space and ground transmission paths to serve end user handsets. The ground component (CGC1) is complementary to the satellite component and operates as an integral part of the MSS system. With proper network planning and common network control of the satellite and ground components of the system, the operators of such systems can use their assigned MSS spectrum in an intensive and efficient manner, provide indoor and outdoor coverage in urban, suburban, rural and remote areas, and provide service directly to small handsets.
Figure 2 shows the concept of an integrated MSS system.
Figure 2 Concept of an integrated MSS system
6.2. Applications and example systems
Satellite component in the integrated MSS system will be able to provide the following services with similar quality and capacity to those of CGC:
Messaging (SMS, MSS, email, etc) Voice telephony (including VoIP) High quality video telephony Push-to-talk Video conference (including high quality) Internet browsing Interactive game File transfer/download Multimedia
Remote collaboration Mobile commerce Mobile broadcasting/multicasting Machine-to-Machine communication Remote sensor Remote bio-monitoring Personal environment service ITS-enabled services Emergency calling
1 As referred to in Europe. APT/AWG/REP-57 Page 7 of 58

E-education Consultation
Public alert Location based service
6.3. Possible system architecture and features
Figure 3 shows the general system architecture for the integrated MSS system. The system consists of satellite components (SAT) and complementary ground components, operating in the MSS bands in a way that CGC can reuse satellite frequencies which are used for adjacent satellite beams. Satellite management system should make efficient resource allocations (frequency, subcarrier, power, etc) for CGCs for optimized system deployment by maximizing overall system throughput under satisfying service requirements of both components. SAT/CGC gateway can decide which component is appropriate for packet transmission considering the situations of satellite and CGC network.
Figure 3 Overall system architecture
The functions of the gateways shown in Figure 3 are as follows: Satellite Gateway: It serves as an interface between the satellite and the ground networks
and also serves as transit points between satellites. Satellite serving gateway: It is the point of interconnection between the satellite radio-side
and the SAT/CGC gateway. This gateway serves the satellite UE by routing the incoming and outgoing IP packets.
CGC serving gateway: It is the point of interconnection between the CGC radio-side and the SAT/CGC gateway. This gateway serves the CGC UE by routing the incoming and outgoing IP packets.
SAT/CGC gateway: It is the point of interconnection between the serving gateways and the core network. This gateway serves the satellite and CGC serving gateways routing the incoming and outgoing IP packets.
For cost-effective deployment, LTE based network architecture needs to be adapted into the satellite component. That is, the satellite network consists of eNodeB for satellite radio interface, S-GW (Serving Gateway), MME (Mobility Management Entity), HSS (Home Subscriber Server), PCRF (Policy & Charging Rules Function) and P-GW (Packet Data Network (PDN) Gateway). Furthermore, SAT-OFDM and BMSat radio interface technologies, which are included in APT/AWG/REP-57 Page 8 of 58

Recommendation ITU-R M.2047 regarding the detailed specification for the satellite radio interface of IMT-Advanced, could be considered for this LTE based satellite network.
Figure 4 represents one example of overall network architecture based on 3GPP LTE protocol to implement the overall system architecture as in Figure 3.
Figure 4 Network architecture for LTE based integrated MSS system
The satellite eNodeB, which has similar functionality with eNodeB of CGCs, is identified in the satellite network in order to adopt terrestrial LTE radio interface to satellite specific environment while HSS and PCRF are shared for both satellite and CGC networks. Although most of entities for the integrated MSS system architecture come from those for the terrestrial 3GPP LTE network architecture, some entities should be additionally defined for common managements for the resources of the satellite and CGCs. For this, Satellite/Ground Interworking Policy Server (SGIPS) is defined for interworking between the satellite and CGC as well as controlling resources of the satellite and CGC components for optimized system performance. SGIPS makes cooperation as well as information exchange between the satellite and CGCs available. In addition, SGI, which is an interface between SGIPS and MME, is defined to provide information for resource managements of the satellite and CGCs.
Recommendation ITU-R M.1182-1 provides five levels of different architecture for the integration of mobile-satellite service (MSS) systems with terrestrial public switched telephone network (PSTN) or cellular network. Annex 1 of the Recommendation addresses the concepts of such an architecture, and Annex 2 describes an example of a closely integrated broadband terrestrial and satellite mobile communication system.
APT/AWG/REP-57 Page 9 of 58

6.4. Potential constraints on system performance and proposed enhancements
6.4.1. Frequency reuse
Complementary ground components are different from independent ground components used by MS operators as they are technically and operationally an integral part of the satellite system and are controlled by the common resource and network management mechanism of such system operating in the same frequencies as the associated satellite components and being delivered to an integrated user equipment. The frequency reuse between satellite and CGCs will inevitably imply co-channel interferences that might cause performance degradation of the MSS system. This matter is dealt with as an intra-system interference to be overcome.
Considering these, for the efficient deployment of integrated MSS system, it is believed that the following could be considered for performance analysis of the integrated MSS system and hybrid satellite/terrestrial systems.
(a) Large antenna and multi-beam technology Possible reuse of terrestrial terminal with small form factor Increased system capacity from a number of multi-beams Terrestar (18m antenna reflector), Lightsquared (22m antenna reflector)
Figure 5 Multi-beam technology with large antenna
(b) Radio interface technologies Maximum commonality between satellite and terrestrial radio interfaces for the
implementation of common cost-effective user terminal Implementation of low cost terminals with small form factor: possibly reuse of existing
terrestrial terminalsTable 1 Radio interfaces
Satellite radio interfaces Terrestrial radio interfacesGMR-1 GSMEGAL CDMA-2000SAT-CDMA WCDMASAT-OFDM LTE
APT/AWG/REP-57 Page 10 of 58

(c) Definition of service scenarios for an integrated MSS system for Coverage extension of mobile broadband services Deployment cost reduction for mobile broadband services
Figure 6 Possible service scenarios example for an integrated MSS system (from Inmarsat [1])
(d) Intelligent system architecture design for an integrated MSS system Efficient satellite frequency reuse in CGCs Tolerable interference between satellite and CGCs Interference coordinated deployment between satellite and CGCs
Figure 7 General system architecture for an integrated MSS system
APT/AWG/REP-57 Page 11 of 58

Figure 8 Frequency reuse concept example (from Inmarsat)
(e) Intelligent resource allocations and interference management techniques Controlled by the resource and network management mechanism Performance enhancement and Increased system capacity from reduced interference
between satellite and CGCs
Figure 9 Exclusive zone concept [2]
APT/AWG/REP-57 Page 12 of 58

Figure 10 Adaptive beam forming with multi-user detection and interference reduction [3]
(f) Ground based beam forming (GBBF) techniques To deliver unprecedented flexibility to provide broadband services through stable and
configurable beams Possible use of transparent satellite to be independent to satellite radio interface
technologies Possible huge signal processing for interference mitigation in ground
Figure 11 GBBF system conceptsAPT/AWG/REP-57 Page 13 of 58

(g) Possible interworking scenarios between satellite and terrestrial components Possible interworking via cell reselection (e.g. between 3G/WiFi) Terrestrial mode in normal situation and satellite mode in niche market of terrestrial Possible on/off operation considering battery life of terminal
Figure 12 Example of interworking between satellite and CGCs
(h) Possible implementation of cost-effective integrated terminal Terrestar blackberry type terminal: $799 (similar cost of existing terrestrial terminal) Possible addition of satellite RF module into existing terrestrial terminal with no
severe cost increase and no extra antenna Possible implementation of terrestrial and satellite single chipset With extra antenna, more broadband service could be supported (In case of terrestar,
additional cost of $300)
Figure 13 Single-chip based integrated user terminal
6.4.2. References
[1] Paul Febvre, “Personal Satellite Access Terminals: Observations with a 40-year Perspective,” PSATS2011 Keynote 1.[2] Vincent Deslandes, et al., “Analysis of Interference Issues in Integrated Satellite and Terrestrial Mobile Systems”, ASMS2010 conference.[3] Dunmin Zheng, et al. “Adaptive beam-forming with interference suppression and multi-user detection in satellite systems with terrestrial reuse of frequencies.
APT/AWG/REP-57 Page 14 of 58

6.5. System performance evaluation
6.5.1. Parameters for Satellite Component
For performance evaluation, configuration parameters of the satellite component are assumed as shown in Table 2 and SAT-OFDM radio interface, which is included in Recommendation ITU-R M.2047 regarding the detailed specifications for the satellite radio interface of IMT-Advanced, is considered for LTE based satellite network.
Table 2 System parameters for the satellite component
Beam Tier 3Number of beams 37Frequency, fc (GHz) 2.0Channel Model Rx Power=Tx Power + Antenna Gain –Path Loss –
ShadowingSatellite Antenna Pattern Recommendation ITU-R S. 672-4
(Max. Gain = 50 dBi)3dB Beam Width (degrees) 0.3Num. frequency Reuse 6Frequency bandwidth (MHz)
5
Num. UE/Beam 25 (1RB/1UE, 1RB=180kHz)*RB: Resource Block
UE Tx power (mW) 250UE Antenna gain (dBi) 0Sat. Tx power per Beam (W)
200
Path Loss (dB) 92.4 + 20logfc(GHz) + 20logR(km) (R: distance)Shadowing Open Environment for satellite link ,
Urban Environment for ground link
In order to implement the frequency reuse colors of 6, the satellite beam plan of Figure 14 is assumed, considering the minimization of inter-beam interference. For the notation of A(B) in the Figure, “A” and “B” represent the satellite beam number and the satellite carrier number (one of 6 satellite carriers), respectively.
Figure 14 Satellite beam plan
APT/AWG/REP-57 Page 15 of 58

6.5.2. Parameters for Complementary Ground Component
For performance evaluation, configuration parameters of the CGC are assumed as seen in Table 3 and LTE radio interface, which is included in Recommendation ITU-R M.2012 regarding the detailed specifications for the terrestrial radio interface of IMT-Advanced, is considered for LTE based CGC network.
Table 3 System parameters for the CGC
Cell radius (km) 1Frequency reuse 1 (3 sector)CGC Tx power (W) 20Antenna pattern 3GPP TR 36.942CGC antenna gain (dBi) 15Frequency (GHz) 2.0UE Tx power (dBm) -30 ~ 24UE Antenna gain (dBi) 0Path Loss (dB) Urban: 128.1+37.6logR (km)Outdoor wall penetration loss (dB) 10Uplink power control 3GPP TR 36.942 applies
The CGCs can reuse satellite frequencies which are not only used by adjacent satellite beams but also have no consideration for the satellite beam in the area where the CGCs are deployed.
6.5.3. Exclusive Zone Concept
To reduce intra-components interferences, the exclusive zone concept is also considered for performance evaluation as shown in Figure 15. It makes restriction on reusing resources of a satellite beam by CGCs associated with neighboring satellite beam. Therefore, CGCs associated with a satellite beam “A” should not reuse the uplink resources of a satellite beam “B” within the area where exclusive zone is established, as well as where the satellite beam “B” covers.
Figure 15 Exclusive zone concept
APT/AWG/REP-57 Page 16 of 58

6.5.4. Link Performance and Impact on SINR
Major Signal to Interference plus Noise Ratio (SINR) degradations occurs in the case of satellite uplink due to many CGC uplink signals. Therefore, the uplink performance of the satellite component in the integrated MSS system is addressed in this Report.
Figure 16 shows the uplink performance of SAT-OFDM radio interface according to various MCS (Modulation and Coding Scheme) modes.
-6.4 -5.6 -4.8 -4 -3.2 -2.4 -1.6 -0.8 0 0.8 1.6 2.4 3.2 4 4.81.00E-05
1.00E-04
1.00E-03
1.00E-02
1.00E-01
1.00E+00
Uplink (SC-FDMA)
MCS0MCS1MCS2MCS3MCS4MCS5MCS6MCS7MCS8
Es/N0 (dB)
BLER
Figure 16 Uplink performance of the satellite component
From Figure 16, the required SINRs for each MCS mode for BLER (Block Error Rate) of 10-2 are listed in Table 4.
Table 4 Required SINR for MCS in SAT-OFDM
MCS mode Data rate Required SINR for BLER of 10-2
0 16 kbps -4.3dB1 24 kbps -3.3dB2 32 kbps -2.5dB3 40 kbps -1.5dB4 56 kbps -0.8dB5 72 kbps 0.1dB6 88 kbps 1.0dB7 102 kbps 2.0dB8 120 kbps 2.8dB
Figures 17, 18, and 19 show the SINR degradation of satellite uplink according to the number of CGCs in cases of no application of exclusive zone and application of exclusive zone of -6 and -12 dB, respectively. NCGC represents the number of CGC.
APT/AWG/REP-57 Page 17 of 58

Figure 17 SINR degradation of the satellite component (no exclusive zone)
Figure 18 SINR degradation of the satellite component (exclusive zone of -6 dB)
APT/AWG/REP-57 Page 18 of 58

Figure 19 SINR degradation of the satellite component (exclusive zone of -12 dB)
As shown in the figures above, as the number of CGC increases, SINR degradation of satellite component gets worse. However, with application of exclusive zone for CGC, SINR degradation of satellite component can be improved.
6.5.5 Satellite Resource Availability in CGCs
The allowable number of CGCs and the averaged UE transmit power could be determined according to the supported MCS mode in the uplink of SAT-OFDM. For example, when the UE of the satellite component needs services with BLER of 10-2 corresponding to only MCS mode 0, the satellite uplink requires SINR of more than -4.3 dB, assuming the availability of 99%. Therefore, aggregated total transmit power per RB from CGCs, which is calculated by the number of CGCs and their UE transmit power per RB, should be limited to 42.9 dBm. It means that one thousand CGCs holding the UEs with average transmit power per RB, 12.9 dBm are allowable and, in the case, when one thousand CGCs are deployed in the integrated MSS system, satellite resource availability would be maximized with satisfying the service requirement of satellite component.
Tables 5 to 9 show LTE RB availability in CGCs of the integrated MSS systems, assuming that the UE of the satellite component needs services with BLER of 10-2 corresponding to only MCS mode 0. They represent the cases for no satellite frequency reuse in CGCs, the CGC UE transmit power per RB of 0 dBm and no exclusive zone, the CGC UE transmit power per RB of 6 dBm and no exclusive zone, the CGC UE transmit power per RB of 0 dBm and the exclusive zone of -9 dB, and the CGC UE transmit power per RB of 6 dBm and the exclusive zone of -9 dB, respectively.
APT/AWG/REP-57 Page 19 of 58

Table 5 LTE RB availability in CGCs (no satellite frequency reuse)
Satellite bandwidth per beam
CGC bandwidth per
cell
Satellite RB
CGC RB
Satellite RB availability
CGC RB availability
5MHz 0MHz 25 0 25 03MHz 12MHz 15 60 15 60
1.4MHz 21.4MHz 6 106 6 106
Table 6 LTE RB availability in CGCs (CGC Tx power/RB: 0dB, no exclusive zone)
Satellite bandwidth per beam
CGC bandwidth
per cell
Satellite RB
CGC RB
Satellite RB
availability
CGC RB availability
5MHz 25MHz 25 125 25 15.93MHz 26MHz 15 130 15 68.9
1.4MHz 28MHz 6 140 6 110.3
Table 7 LTE RB availability in CGCs (CGC Tx power/RB: 6dB, no exclusive zone)
Satellite bandwidth per
beam
CGC bandwidth
per cell
Satellite RB
CGC RB
Satellite RB
availability
CGC RB availability
5MHz 25MHz 25 125 25 4.03MHz 26MHz 15 130 15 62.2
1.4MHz 28MHz 6 140 6 107.1
Table 8 LTE RB availability in CGCs (CGC Tx power/RB: 0dB, exclusive zone: -9dB)
Satellite bandwidth per
beam
CGC bandwidth
per cell
Satellite RB
CGC RB
Satellite RB
availability
CGC RB availability
5MHz 25MHz 25 125 25 63.63MHz 26MHz 15 130 15 95.6
1.4MHz 28MHz 6 140 6 123.3
Table 9 LTE RB availability in CGCs (CGC Tx power/RB: 6dB, exclusive zone: -9dB)
Satellite bandwidth per
beam
CGC bandwidth
per cell
Satellite RB
CGC RB
Satellite RB
availability
CGC RB availability
5MHz 25MHz 25 125 25 16.03MHz 26MHz 15 130 15 69.0
1.4MHz 28MHz 6 140 6 110.3
From the above evaluation results, it is noted that the satellite frequency reuse in the CGCs of the
APT/AWG/REP-57 Page 20 of 58

integrated MSS system increases satellite spectrum utilization as well as the CGC deployment in indoor and urban environments have benefits to increase the number of allowable CGCs, compared to that of CGCs in rural and suburban environment. In addition, for system performance enhancement, intelligent resource management schemes such as the exclusive zone concept need to be applied together.
6.5.6 System Level Simulation Results
1) Simulation parameters
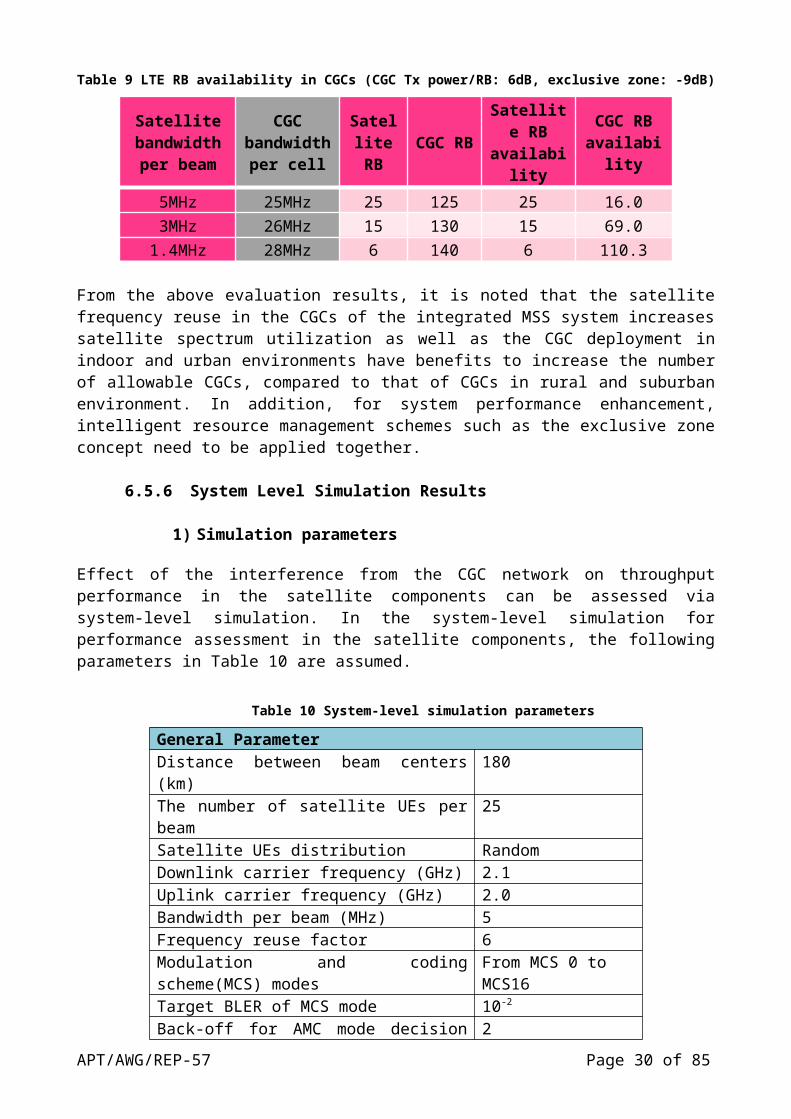
Effect of the interference from the CGC network on throughput performance in the satellite components can be assessed via system-level simulation. In the system-level simulation for performance assessment in the satellite components, the following parameters in Table 10 are assumed.
Table 10 System-level simulation parameters
General ParameterDistance between beam centers (km) 180The number of satellite UEs per beam 25Satellite UEs distribution RandomDownlink carrier frequency (GHz) 2.1Uplink carrier frequency (GHz) 2.0Bandwidth per beam (MHz) 5Frequency reuse factor 6Modulation and coding scheme(MCS) modes From MCS 0 to
MCS16Target BLER of MCS mode 10-2
Back-off for AMC mode decision (dB) 2The number of Stop and Wait HARQ processes 500Maximum number of HARQ retransmission 3ARQ transmission window size 1500 PDUsMaximum number of ARQ retransmission 2Channel environment OpenScheduling method Proportional FairnessPower control Full power allocationTraffic model Full bufferLink-to-system mapping Effective Exponential
SINR MappingSatellite ParameterAntenna height (km) 36,000Number of transmit antenna 1Number of receive antenna 1Antenna radiation pattern ITU-R S.672-4Antenna gain (dBi) 50Power for communication payload (kW) 3.8 (0.2 per beam)Loss of nonlinearity (dB) 3Other loss (dB) 1.5System noise temperature (K) 450User Equipment Parameter
APT/AWG/REP-57 Page 21 of 58

Antenna height (m) 1.5The number of transmit antenna 1The number of receive antenna 1Antenna radiation pattern OmnidirectionalAntenna gain (dBi) 0Satellite UE transmit power (W) 0.25, 2Other loss (dB) 3System noise temperature (K) 290
2) Performance in open environments
a) Uplink performance
Figure 20 shows average uplink spectral efficiency for the satellite UE with maximum transmit power of 250 mW in the satellite component according to the interference level from the CGC UE. As shown in the figure, because the satellite UE does not secures enough link margin, performance degradation is very sensitive to the interference from the CGC UEs. For example, when I/N value is assumed to -10 dB and 0 dB, performance degradation of 9.7 % and 54.4 % are shown in the satellite uplink, respectively.
Figure 20 Uplink performance for the satellite component (250mW UE) in open environments
On the other hands, Figure 21 shows average uplink spectral efficiency for the satellite UE with maximum transmit power of 2 W in the satellite component. As shown in the figure, because the satellite UE secures some link margin, performance degradation is less sensitive to the interference form the CGC UEs than that in case of 250 mW UE.
APT/AWG/REP-57 Page 22 of 58

Figure 21 Uplink performance for the satellite component (2W UE) in open environments
It is noted in the Figure 21 that when I/N value is assumed to -10 dB and 0 dB, performance degradation of 0.35 % and 8.59 % are shown in the satellite uplink, respectively.
b) Downlink performance
Figure 22 shows average downlink spectral efficiency in the satellite component according to the interference level from the CGCs. In the simulation, the transmit power per beam is assumed to 200W.
Because the satellite downlink secures some link margin compared to the satellite uplink case, performance degradation of the satellite downlink is less sensitive than that of the satellite uplink, in general. As shown in the figure, when I/N value is assumed to -10 dB and 0 dB, performance degradation of 1.15 % and 15.01 % are shown in the satellite downlink, respectively. It is also shown in that Figure that the performance degradation above is a little bit more severe than that of 2 W satellite UE in the uplink, because 16QAM modulation is applied in the downlink while QPSK modulation in the uplink.
APT/AWG/REP-57 Page 23 of 58

B
Figure 22 Downlink performance for the satellite component in open environments
3) Summary
From the above simulation results, it is noted that the satellite frequency reuse in the CGCs of the integrated MSS system induces a certain amount of system performance degradation in the satellite component, depending on up/down link design requirements such as supportable UE types, modulation and coding scheme, etc. For example, assuming that the performance degradation of less than 10 % would be permitted in system level simulation, the satellite UE with the power of 2W could endure interference from CGCs ten times as large as the satellite UE with the power of 250 mW. Therefore, for the operation of the satellite component under tolerable interference level, the CGC deployment should be carefully controlled within service scenarios and system architecture of the satellite component.
6.6 Current Studies
6.6.1 Satellite/Terrestrial Integrated Mobile Communication System (STICS) by the National Institute of Information and Communications Technology (NICT) of Japan
There is an increasing need for providing mobile phone services in the dead zones and telecommunications infrastructure to support relief missions in the event of a natural disaster. Using a satellite link enables quick deployment of a mobile network in rural areas or disaster zones where urgent communication recovery is required. The National Institute of Information and Communications Technology (NICT) has studied a new satellite mobile communication system, namely, Satellite/Terrestrial Integrated mobile Communication System (STICS) to overcome the above problems and provide modern satellite applications, under the Commissioned Business program of Japan’s Ministry of Internal Affairs and Communications. STICS is a kind of integrated Mobile Satellite Service (MSS) system, in which terrestrial mobile and satellite communication systems coexist and they are seamlessly integrated in the same frequency band. The following subsections introduce the concept of STICS and feasibility study to verify the system.
APT/AWG/REP-57 Page 24 of 58

6.6.2 Concept of STICS
In this section, concept of STICS [1] is introduced. Figure 23 illustrates a conceptual sketch of STICS. The system realizes “dual” communication of both terrestrial and satellite systems. A common terminal is used for both communications. The handheld terminal is equipped with micro/internal antenna for voice/low-data communication, and a portable terminal is equipped with small antenna for data communications.
Figure 23 Conceptual sketch of STICS
The feeder-link stations and the base station are equipped with a satellite gateway and base station controller, respectively. They are managed by using a common dynamic network controller. It is connected to the core network.
The system is assumed to utilize the S-band frequency. To share these bands between satellite and terrestrial system to realize high spectral efficiency, two frequency allocation methods, called “normal mode” and “reverse mode” are considered. Figure 24 illustrates two modes.
Figure 24 Frequency allocation scheme
APT/AWG/REP-57 Page 25 of 58
Satellite system
Terrestrial system
A B C D
Frequency
Satellite system
Terrestrial system
A B C D
Frequency
(a) Normal mode (b) Reverse mode

Frequency sharing between satellite and terrestrial system is realized by the mechanism described as follows.
Allocated band is divided into several sub-bands. Sub-bands are assigned to multiple satellite cells with multi-color scheme. Particular sub-band is assigned to terrestrial cells outside the satellite cell using the
sub-band.
In reality, co-channel interference between satellite component and terrestrial component of STICS exists since satellite antenna has sensitivity outside the satellite cell. There are four interference paths between satellite and terrestrial system as shown in Figure 25.
(a) Normal mode (b) Reverse mode
Figure 25 Interference path
To realize the system, high EIRP and G/T communication satellite using a multibeam antenna with the 30m-class-diameter reflector is required. The satellite antenna gain and G/T is more than 47 dBi and more than 21 dB/K, respectively. Spot beam size is around 200 km. As a result, around hundred satellite beams are required to realize Japanese islands and the Exclusive Economical Zone (EEZ) as satellite system service area.
6.6.3 System requirement
Several key factors are addressed to realize the system described in previous subsection.
(a) Frequency sharing between satellite component and terrestrial component of the integrated/hynrid system
Frequency sharing system needs to be designed considering the existence of co-channel interference. Especially, interference caused from terrestrial component to satellite component is important issue because aggregate interference from large number of terminals/base stations is received at the satellite. Allowable number of satellite and terrestrial links under co-channel interference is key factor in evaluation of system feasibility.
(b) Cooperative control of satellite and terrestrial system
Cooperative control of satellite and terrestrial system is required to establish satellite or terrestrial link to dual-mode terminal in seamless manner. To maintain communications link under temporally changing satellite and terrestrial traffic, the traffic state needs to be monitored and resource allocation needs to be dynamically changed.
APT/AWG/REP-57 Page 26 of 58

(c) Multibeam and low-sidelobe satellite antenna
To cover the required service area by using 30m class-diameter large satellite antenna, around hundred multibeam system is required. Sidelobe level of the satellite antenna needs to be maintained in low level to suppress beam-to-beam interference level in multibeam system, and to suppress interference level to/from other systems. To satisfy these requirements, analog beamforming is not practical. Onboard digital beamforming is advantageous in realizing these requirements because of its scalability and flexibility.
(d) Reconstruction of satellite resource allocation
Satellite and terrestrial traffic is asymmetrically distributed in wide area and changing temporally. Especially in emergency situation such as disaster, large traffic happens in disaster area. Therefore satellite resource (e.g. frequency, power) needs to be flexibly allocated to each satellite beam depending on the traffic state. Onboard digital channelizing is a candidate technology to satisfy this requirement because of its flexibility.
6.6.4 References
[1] T. Minowa, M. Tanaka, N. Hamamoto, Y. Fujino, N. Nishinaga, R. Miura and K. Suzuki, “Satellite/Terrestrial Integrated Mobile Communication System for Nation's Security and Safety,” Trans IEICE on Communication (Japanese edition), Vol.J91-B, No.12, pp.1629–1640. (Dec., 2008).
6.6.5 Feasibility studies
Frequency sharing system needs to be designed considering the existence of co-channel interference. Especially, interference caused from terrestrial component to satellite is important issue because aggregate interference from large number of terminals/base stations is received at the satellite. Measuring transmit power of existing W-CDMA system is useful in estimating the interference power from terrestrial component to satellite in STICS system. Therefore NICT carried out the measurement campaigns of W-CDMA cellular phone system transmit power by using test van, aircraft, and handcart. This section describes the overview and some results on these measurement campaigns.
a) Studies on frequency sharing between terrestrial and satellite components
b) Test measurement of cellular phone transmit power using test van
i. Background
Measurement of transmit power of the terrestrial cellular phone terminal is useful in estimation of the realistic value of the interference power from terrestrial terminal to satellite in STICS, if conventional IMT system is considered as the terrestrial system. In W-CDMA system, the transmit power of the cellular phone changes with the transmit power control (TPC). Therefore, the interference power from terrestrial terminal to satellite would change depending on location of the terrestrial terminal. NICT has conducted the measurement of W-CDMA cellular phone transmit power by using test van [1]. This section describes the overview and some results on the measurement.
ii. Measurement system
Figure 26 is a block diagram of the measurement system. Output power of cellar phone is measured by the power meter. Three carriers of 3G cell phone are available. Measurement frequency is
APT/AWG/REP-57 Page 27 of 58

mainly 2GHz band. Realistic condition for measurement (e.g. Phantom) is available. Position of the test van is recorded by using navigation software and GPS. Field image of experiment is recorded in D-VCR. Figure 27 shows the outlook of the test van. Using this system, the output power of the W-CDMA terminal was measured at several locations from dense urban to rural area around Kanto district in Japan including Tokyo. Table 11 lists the measurement locations.
Figure 26 Block diagram of measurement system
Figure 27 Test van
Table 11 Measurement Locations
Location CityA Dense urban ShibuyaB Urban KoganeiC Suburban YoshimiD Suburban OhtsukiE Rural YamanashiF Urban KawagoeG Urban Oume
iii. Measurement result
Figure 28 shows the average output power vs. population density. Low output power is observed in Dense urban and Urban area which is lower than -5 dBm. Maximum power is observed in rural area which is +7 dBm. These measured powers are quite lower than the maximum capability of W-
APT/AWG/REP-57 Page 28 of 58

CDMA cellular phone is +24 dBm. The average output power decreases as population density increases. This trend is observed in data for both carrier “X” and “Y”.
Figure 28 Output power vs. population density
iv. Summary
Measurement campaign of W-CDMA cellular phone transmit power has been carried out. Measurement using test van in several locations in Kanto district in Japan (from dense urban to rural areas) indicated that the average transmit power of cellular phone is quite lower than the maximum capability of W-CDMA cellular phone system and that the average transmit power is inversely proportional to the population density. These results are useful in estimation of the interference level from terrestrial terminal to satellite in STICS.
v. References
[1] Y. Fujino, A. Miura, N. Hamamoto, H. Tsuji, and R. Suzuki, “Research of Satellite/Terrestrial Integrated Mobile Communication System for Secured and Safe Society,” Proc. 2010 Asia-Pacifc Radio Science Conference (AP-RASC 2010), Toyama, Japan, Sep. 2010.
6.6.6 Test measurement of interference power from cellular phones and base stations using airplane
a) Background
The interference from terrestrial base stations or mobile terminals to the satellite component is one of the important parameters for realization of a new satellite mobile communication system, named Satellite-Terrestrial Integrated Mobile Communication Systems (STICS). Although there are some studies about the characteristics of transmitted power of mobile terminals and its statistical data are released, there are no studies that evaluate the amount of radiation of cellular base stations and mobile terminals toward the satellite. NICT has conducted several experiments to measure the radiation powers of the existing mobile base stations and mobile terminals toward satellites [1]. An experiment to measure the radiation power of the existing mobile terminals and base stations using an airplane was conducted as part of the interference evaluation toward satellites. This section gives the overview of the experiment using an airplane and some of the results.
b) Interference evaluation experiment
APT/AWG/REP-57 Page 29 of 58
The interference from the terrestrial mobile terminals could be a dominant interference in the normal system because the number of terrestrial mobile terminals is large and the accumulated transmitted power may cause interference to satellite component. As for the reverse system, the downlink of base stations could be a dominant interference to the satellite. An experiment was conducted to measure the radiation power of the existing mobile base stations and mobile terminals toward satellites using an airplane as shown in Figure 29.
500 ̴�900m
Horn Antenna
45º
300 ̴ �500m
400 �600m
Figure 29 Schematic of experiment using aircraft
c) Platform and measurement system
As shown in Figure 30, an airplane ‘Cessna208B’ was used as a platform for the measurement equipment in the experiment. The measurement system was loaded in the airplane’s cabin and a receiving horn antenna was also mounted in the cabin sticking out of the floor hatch of the cabin tilting at a 45 degrees angle from a horizontal direction as shown in Figure 30 in consideration for the satellite elevation angle in Japan. The receiver can receive the radio signals in the 1.9-2.2 GHz bands by selecting the receiver’s channel and measure the received power from the existing mobile base stations and mobile terminals.
Figure 30 Airplane (Cessna208B) and measuring horn antenna used for the measurement of the interference
Table 12 and Figure 31 show the reception frequencies of the measurement equipment in the experiment and the measurement system diagram, respectively. The antenna system also equipped a GPS system and a gyro-sensor to obtain the position and attitude of the receiving antenna to measure the position of the system.
APT/AWG/REP-57 Page 30 of 58

APT/AWG/REP-57 Page 31 of 58

Amp SpectrumAnalyzer
DIP
Horn Antenna
From Control PC
BPF for Uplink
BPF for Downlink
Table 12 Reception Frequencies
Reception frequencies [MHz]Up-Link 1942.5, 1947.5, 1952.5, 1957.5
1962.5, 1967.5, 1972.5, 1977.5Down Link 2132.5, 2137.5, 2142.5, 2147.5
2152.5, 2157.5, 2162.5, 2167.5
Figure 31 Measurement system diagram
d) Measurement and results
The experiment was conducted in several areas as shown in Figure 32 which includes rural and urban areas in consideration of the density of base stations and mobile terminals in Japan. There are more than ten IMT base stations in the urban area of 1 km2 and one or two base stations in the rural area of 1 km2. The places of the measurement are as follows:
Rural and urban areas around Tokyo and off the coast of Choshi. Long distance area over 500 km between the Kanto region and the Kii peninsula. Thinly-populated areas with population density of 100 or less per square kilometer.
Figure 32 An example of flight between the Kanto region and the Kii peninsula (0: Tokyo, c: Nagoya, e: Kumano-nada)
i. Wide area measurement
The measurement data for a wide area over 500 km were obtained in order to evaluate the radiation distribution of the interference from the entire Japanese islands. As shown in Figure 32, the measurement was started at Kanto region area (0: Tokyo area) and ended at the Kii peninsula (c-d-e-f: Nagoya area). The entire area of the measurement includes city, ocean, thinly-populated areas, and seacoasts. Therefore, the improvement of the accuracy of the analyzing the interference is expected by obtaining several types of measurement data.
APT/AWG/REP-57 Page 32 of 58

A measured example of received power between the Kanto region and Nagoya region is shown in Figure 33. It is observed that the downlink channel is larger than in the uplink channel to 25~30 dB and that several peaks during the urban area around “c”. It is considered that the peaks of the received power are due to passing through base stations.
Figure 33 A measured example of received power between the Kanto region and Nagoya region
ii. Thinly-populated area measurement
Another measurement of the radiation power along the coastline of the Kii peninsula was made. The area along the coastline of the Kii peninsula (c-d-e) includes thinly-populated areas with population density of 100 or less per square kilometer. The measurement was started at Nagoya (c) and ended at Kumano-nada (e) located at the south end of the Kii peninsula.
A measured example of received power along the coastline (c-d-e-f) is shown in Figure 34 where the area between “d” and “f” includes thinly-populated zones. It is observed that the received power of the down link in the area is 20 dB lower than the other areas.
Figure 34 A measured example of received power between Nagoya and Kumano-nada
APT/AWG/REP-57 Page 33 of 58

Satellite
About 200 km
Altitude: 5786km
Altitude: 500m ~ 1000m
e) Relationship between measured power and interference to satellite
The final goal of the experiment is to evaluate the interference level toward satellite using the observed results. The total interference level toward satellite has to be evaluated from the observed level obtained by airplane. Therefore, it is important to show the relationship between the received power and the size of effective footprint of the receiving antenna as depicted in Figure 35.
Figure 35 Relationship between measured power and interference to satellite
f) Evaluation model
As depicted in Figure 36, the one-dimensional simulation model is introduced to evaluate the relation between the size of the footprint and the received power of the horn antenna used in the experiment. In the simulation model, transmitters are placed at equal spaces in a line to simulate distributed mobile terminals or base stations. The total length of the distributed transmitters is defined by L. The value of L is generally large because a number of transmitters are assumed to exist on the ground. The value β is calculated by considering the length of L and the geometric position of the receiving antenna in Figure 36.
Then a parameter α in Figure 36is introduced to determine the range of the footprint of antenna and to give the number of transmitter within the footprint. The value of ‘l’ is also calculated in a similar way of the calculation of the parameter L. The total power of incoming signals from the ground, which means the received power of the antenna, can be calculated by taking into account of the conditions such as the number of the transmitters within L, the antenna beam pattern of the receiving antenna, and the radio propagation. Therefore, the power ratio r(α) of the received power caused by the transmitters within the range of ‘l’ to the total received power can be calculated as,
PR (α) = Total received power from the area ‘l’Total received power from the area ‘L’
Figure 36 One-dimensional simulation model E-plane (left) and H-plane (right) of antenna and transmitters on the ground
APT/AWG/REP-57 Page 34 of 58

Figure 37 shows the simulation result of the power ratios of H- and E-planes with respect to α where the transmitters on the ground are assumed to send signals with equal power and omni-directional antenna. The actual antenna gain patterns of the horn antenna used in the experiments was used to conduct the simulations. The simulation result shows that the power ratio from 0 to 0.8 of both E- and H-planes of the receiving antenna increases in almost direct proportion to α. This means the accurate estimated values of α are expected if the value of the power ratio up to 0.8 is chosen. The simulation result shows that 80 percent of the received power at the horn antenna results from the transmitters within the area defined by the angle of α = 16.6 degrees (H-plane) or α = 16.2 degrees (E-plane) when the center frequency is set at 2110 MHz.
Figure 37 Simulation result of the power ratios of H- and E-plane
g) Summary
Some results of evaluating the interference from IMT uplink and downlink channels using a horn antenna equipped with an airplane are discussed through the experiment and simulations. In the experiments, it is observed that the receiving powers vary depending on the areas and that the received power in the downlink channel is larger than in the uplink channel to 25~30 dB. This result shows that the introducing ‘the normal frequency-division duplexing system’ in STICS may reduce the interference to the satellite. It is also observed that the received power of the down link in thinly-populated areas with population density of 100 or less per square kilometer is 20 dB lower than the other areas in Japan. Finally, the relationship between the measured power and the footprint of the receiving antenna is given by introducing the system model of distributed transmitters on the ground.
h) References
[1] H. Tsuji, Y. Fujino, N. Hamamoto, and R. Suzuki, “Interference Measurement Experiment of Mobile Base Station Downlinks Using an Aircraft in Satellite-Terrestrial Integrated Mobile Communication systems,” Proc. 2009 International Symposium on Antennas and Propagation (ISAP 2009), Bangkok, Thailand, Oct. 2009.
APT/AWG/REP-57 Page 35 of 58

6.6.7 Test measurement of interference power from cellular phone in indoor/outdoor situation using handcart
a) Background
In STICS, the same frequency band is shared between satellite component and terrestrial component to realize high spectral efficiency. One possible interference path is terrestrial component uplink interfering to satellite uplink (interference sources are cellular phones using terrestrial link, and interfered station is satellite). The important point in estimating the interference level caused by cellular phone using terrestrial link is that the interference level varies depending on the usage condition of the cellular phones. One reason is that the propagation loss in ground-to-satellite interference path differs depending on the location of the cellular phone user (outdoor LOS/NLOS, indoor toward satellite). Another reason is that if conventional IMT-2000 system is considered as a terrestrial service, interference level also varies by the change of transmit signal power of cell phone caused by transmit power control (TPC). Past studies on ground-to-satellite propagation only focus on the propagation loss in ground-to-satellite channel.
To collect fundamental data for the estimation of the interference level to satellite caused by cellular phones using terrestrial link in STICS, NICT has carried out the fundamental outdoor/indoor experiment [1]. In the experiment, a mobile station (MS) equipped with a IMT-2000 cellular phone (as a cellular phone using terrestrial service in STICS) is located at the outdoor/indoor environments and a pseudo satellite (PS, as a STICS satellite) is located on top of a tower which mimics STICS interference situation. This section gives an overview of the experiment and some results.
b) Outdoor/Indoor propagation experiment
Figure 38 illustrates frequency reuse between satellite component and terrestrial component and interference path for satellite uplink in normal mode. The entire 30 MHz frequency bandwidth of 2 GHz MSS band is divided into several sub-bands.
The STICS satellite illuminates hundreds of spot beams to cover Japanese islands and Exclusive Economic Zone (EEZ) area (though one satellite beam is illustrated in the figure for simplicity). Sub-band frequencies are assigned to these beams in the manner of multicolor problem for frequency reuse. Frequency sharing between satellite and terrestrial link is realized by such the way that the cellular phone using terrestrial link is able to use sub-band f1 outside the satellite cell for which sub-band f1 is assigned.
Dual-mode
Interfering path
STICS satellite
Base station
Satellite cell(cell size:200km)
EOC
Terrestrial cell
Satellite linkSub-band f1
Sub-band f1
phonecellular
Dual-modecellular phone
Figure 38 Schematic diagram illustrating frequency reuse between satellite component and terrestrial component and interference path to satellite in normal mode.
APT/AWG/REP-57 Page 36 of 58

Spatial guard-band enhances the isolation level to reduce the received interference power at the satellite caused by cellular phone using terrestrial link. The subject in this work is that the interference to satellite caused by the cellular phone using terrestrial link is not uniform, and varies depending on the propagation state of the cellular phone (outdoor/indoor, LOS/NLOS toward base station/satellite). Therefore, fundamental data on the interference level to the satellite with various locations of cellular phone is required to estimate the amount of the interference level to satellite.
c) Measurement system
The experiment was carried out on December 2010 in the site of NICT headquarter in Koganei, Tokyo Japan. The site consists of concrete office buildings with average height of 12m (maximum 21m).
Figure 39 illustrates the schematic of the experimental system. The MS equipped with IMT-2000 cellular phone is located at outdoor/indoor measurement position. A transmit signal from the cellular phone is divided by a power divider into two signals, one of which is radiated from an external antenna and the other is measured at a power meter. The MS also equips a CW transmitter with maximum transmit power of 1 W at 2.3 GHz. The PS is located on top of the 50-m height tower with horizontal distance toward the MS of 50 m-150 m. 2.3 GHz CW transmitted from a CW transmitter antenna is received by a horn antenna with half-power beam width of 30, amplified by a low noise amplifier, and measured by a spectrum analyzer. The horn antenna is pointed at the direction of maximum received power for each several sections on the route of the MS (maximum length = 30m = ten sections). The transmit power of cellular phone at the MS and the received power of CW at the PS are measured simultaneously. Table 13 lists the measurement conditions.
Mobile station
Pseudo satellite
Power meter
Spectrum analyzer
Horn antenna
Amp.
50m
PC
PCCW
Base station
1.9GHz-bandModulated
wave
2.3GHz CW (max 1W)
trans-mitter
Cellularphone
Figure 39 Schematic of experimental system
d) Measurement result
Figure 40 shows the histogram of cellular phone EIRP. It is observed that the EIRP in indoor is higher than that in outdoor. The differences of average and median values are 11 dB and 7 dB, respectively. On the other hand, as shown in Figure 41 the received power of CW at the PS in indoor is lower than that in outdoor. The differences of average and median values are 17 dB and 20 dB, respectively. In comparing these results between outdoor and indoor measurements, it is important to note that the amount of increase in attenuation at MS-PS channel in indoor is larger than the amount of transmit power raise in indoor.
APT/AWG/REP-57 Page 37 of 58
Table 13 Measurement ConditionsCondition
Cellular phoneterminal
IMT-2000 cellular phone (1.9GHz-band)
TX antenna External antenna (omni-direct ional inhorizontal plane, gain=4dBi, V-pol)
TX antennaheight
1.5m
Transmit ter CW, 2.3GHz, maximum 1W
TX antenna External antenna (omni-direct ional inhorizontal plane, gain=2dBi, V-pol)
TX antennaheight
1.5m
RX antenna Horn antenna (half-power beam width=30°,gain=16.6dBi, V-pol)
RX antennaheight
50m
Item
MS-BS
MS-PS

- 40 - 30 - 20 - 10 0 10 200
10
20
30
40
50
60
Cellular phone EIRP [dBm/ 5MHz]Nu
mber
Outdoor EIRPIndoor EIRP
Number counted/ 2dB
Figure 40 Histogram of cellular phone EIRP
- 120 - 110 - 100 - 90 - 80 - 70 - 60 - 50 - 400
10
20
30
40
50
Received power of CW at pseudo satellite [dBm]
Outdoor receivedpower of CW at PSIndoor receivedpower of CW at PS
Number counted/ 2dB
Numb
er
Figure 41 Histogram of received power of CW at the PS. Transmit power of CW, which is changed
depending on position of the MS, is normalized at 1W. Received power at the PS is defined as power of
incident wave at the horn antenna.
From these measured quantities, one can estimate the received power of cellular phone transmit wave at the PS Pps_phone by using the following simple equation
Pps phone=Pms phone
+( Ppscw−Pmscw ) [dBm /5 MHz ] ,
where Pms_phone is the transmit power of the cellular phone at the MS, Pps_cw is the received power of CW at the PS, and Pms_cw is the transmit power of CW at the MS.
The histogram of the estimated received power of cellular phone transmit wave at the PS is plotted in Figure 42. It is observed that the estimated received power of indoor cellular phone transmit wave is lower than that of outdoor cellular phone transmit wave. The differences of average and median values are 8 dB and 10 dB, respectively. Table 14 summarizes the results.
APT/AWG/REP-57 Page 38 of 58

- 160 - 150 - 140 - 130 - 120 - 110 - 100 - 90 - 800
10
20
30
40
Estimated received power at pseudo satellite [dBm/ 5MHz]
Numb
erOutdoor estimatedreceived power at PSIndoor estimatedreceived power at PS
Number counted/ 2dB
Figure 42 Histogram of estimated received power of cellular phone transmit wave at the PS.
Table 14 Summarized Results
Item
UnitdBm/5MHz
dBm/5MHz dBm dBm
dBm/5MHz
dBm/5MHz
Location Outdoor Indoor Outdoor Indoor Outdoor Indoor
Average -16.3 -5.1 -53.6 -70.5 -102.9 -111.0
Median -18.3 -11.0 -61.6 -82.0 -116.2 -126.2
Maximum -8.1 12.8 -43.2 -57.2 -90.3 -93.5
Minimum -35.0 -32.9 -96.3 -108.4 -153.3 -156.6Number ofevaluatedsections
300 380 299* 360* 299* 360*
Cellular phoneEIRP
Received power ofCW at PS
Estimatedreceived power ofcellular phone tx
wave at PS
*Sections with unsuccessful measurements are not used in analysis.
APT/AWG/REP-57 Page 39 of 58

e) Summary
A propagation experiment has been carried out in outdoor/indoor environment in office building site to estimate the interference level to satellite caused by cellular phone using terrestrial link in STICS. Statistical analysis was performed by using measured data collected from over six-hundred positions in outdoor/indoor locations. It indicates that the amount of increase in the attenuation of indoor MS to PS propagation channel compared with that of outdoor MS to PS propagation channel is larger than the amount of raise in the transmit power of indoor cellular phone compared with that of outdoor cellular phone. This fact leads to the result that the estimated received power of transmit wave from indoor cellular phone at the PS is lower than that from outdoor cellular phone (the estimated received power is calculated by using measured cellular phone transmit powers and received powers of CW at the PS). These results are useful in the estimation of the interference level to satellite caused by cellular phone using terrestrial link in STICS.
f) References
[1] A. Miura, H. Watanabe, N. Hamamoto, H. Tsuji, Y. Fujino, and R. Suzuki, "Outdoor/indoor propagation experiment for estimation of interference to satellite caused by cellular phone in satellite/terrestrial dual-mode frequency-shared cellular phone system," Proc. 2011 IEEE International Symposium on Antennas and Propagation (APSURSI), pp.2793-2796, July 2011.
6.6.8 System capacity evaluation
a) Background
In STICS, mobile terminal has seamless connection to both terrestrial and satellite components. These terrestrial and satellite components shares same frequency band under the co-channel interference. In this study, system capacity of terrestrial and satellite components under co-channel interference is evaluated to verify frequency sharing between terrestrial and satellite components [1]. Capacity is evaluated when interference path between satellite and terrestrial components is between satellite and terrestrial base stations. Two scenarios are evaluated; normal period and disaster period. We have developed a tool to calculate the capacity of terrestrial and satellite links in STICS. Considering different interference mechanism, minimum separation distance between satellite terminal and base station existing near satellite cell edge is evaluated as a worst-case evaluation to evaluate interference path between satellite terminal and base station.
b) Frequency sharing scheme and interference mechanism
Frequency sharing between satellite and terrestrial links is realized by the allocation of different sub-band to satellite and terrestrial link. However, in reality, co-channel interference between satellite and terrestrial links exists since satellite antenna has sensitivity outside the satellite cell. Figure 43 illustrates the interference path in STICS.
There are four interference paths between satellite and terrestrial links. Combination of interfered and interfering links is shown in Table 15. Each interfered link has two interfering links (satellite and terrestrial links). It is important to note that the interference mechanism varies whether the interference path is satellite-terrestrial terminals (satellite propagation channel) or satellite terminals-base stations (terrestrial propagation channel). When propagation channel is satellite-terrestrial terminals, aggregate power from huge number of terrestrial terminals in the whole service area interferes to satellite since propagation distance from every terrestrial terminal to satellite is similar.
APT/AWG/REP-57 Page 40 of 58

On the other hand, when propagation channel is satellite terminals-base stations, interference level drastically changes depending on propagation distance. Since satellite cell is large (around 200km diameter), interference from satellite terminals located at the center of satellite cell can be ignored. The interference should be considered when satellite terminals location is near satellite cell edge.
Moreover, “spatial guard-band” is able to be applied as a measure of interference mitigation in STICS. The concept of spatial guard band is to define the area around particular satellite cell in which it is prohibited to utilize the sub-band assigned for the satellite cell. The advantage of this spatial guard-band is to mitigate the interference level between satellite and terrestrial link. However, increase of this guard-band decreases the communication area for terrestrial link. Therefore, it is expected to evaluate both the effect and the limit.
TMSSMS
Satellite
BTSSMS TMS
Satellite
BTS
Desired signalUndesired signalInterference
Figure 43 Interference path between satellite and terrestrial links
c) Evaluation methodology
System capacity of the STICS based on required C/N0 is calculated in the normal mode by the developed interference calculation simulator [2] and channel capacity calculation subroutine as shown in Figure 44. Detailed interference model is constructed and measured data on transmit power is used as input data for the model.
Interference calculation
Channel capacity calculation under
co-channel interference
Location of terminalsLocation of satellite beamsLink parametersFrequency assignment
Desired signal powerInterference signal power
Max. number of interfering link channels satisfying req. C/N0 for interfered link
Measured W-CDMA cellular phone transmit power
Figure 44 System capacity evaluation methodology
Link parameters for satellite and terrestrial links are listed in Tables 16 and 17, respectively. The frequency bands 1 980-2 010 MHz and 2 170-2 200 MHz are applied as the evaluation frequency band. In terrestrial link, service area is divided into many grids (grid size=around 10km) to put number of terminals and transmit power of each terminal for each grid. Number and transmit power of base station is put by using radio station license information in Japan in 2010. Number of terminals is calculated from daytime population for each grid and assumed call rate (1%). Transmit power of terminal for population class which is estimated based on statistical analysis of measured data of W-CDMA cellular phone transmit power obtained by measurement campaign in Japan [3] is
APT/AWG/REP-57 Page 41 of 58
Table 15 Combination of interfered and interfering links
Case Desired link Interferred(TX)
Interferred(RX)
Interfering(TX)
Interfering(RX)
Other SMSs SatelliteTMSs BSs
Other beams SMSsBSs TMS
SMSs SatelliteOther TMSs BS
Satellite SMSsOther BSs TMSs
a
b
c
d
Satellite Satellite SMS
Terrestrial BS TMS
Satellite SMS Satellite
Terrestrial TMS BS

applied as the transmit power of terminal. The average transmit power is below 1mW, which is quite lower than cellular phone maximum transmit power of around 200mW.
Table 17 Condition of satellite link.
I t ems Li nk par amet er sAccess scheme FDMAUpl i nk f r equency ( MHz) 1980- 2010Downl i nk f r equency ( MHz) 2170- 2200Number of sub- band 7Sub- band bandwi dt h ( MHz) 4. 3I nf or mat i on r at e ( kbps) 9. 6Occupi ed bandwi dt h/ channel( kHz) 19. 2
Sat el l i t e ant enna di amet er( m) 30
Mi ni mum gai n i n sat el l i t ecel l ( dBi ) 47
Sat el l i t e ant enna pat t er n Rec. I TU- R S. 672- 4Sat el l i t e ant enna si del obel evel ( dBi ) 30
Sat el l i t e t ot al t r asmi tpower ( kW) 2
Sat el l i t e t r ansmi tpower / channel ( mW) 200
Sat el l i t e r equi r ed C/ N0( dB-Hz) 43. 8
Sat el l i t e ant enna noi set emper at ur e ( K) 300
Sat el l i t e f eeder l oss ( dB) 1. 1Sat el l i t e noi se f i gur e ( dB) 1. 5Ter mi nal ant enna gai n ( dBi ) 0Ter mi nal t r ansmi t power( mW) 200
Ter mi nal r equi r ed C/ N0 ( dB-Hz) 43. 8
Ter mi nal ant enna noi set emper at ur e ( K) 80
Ter mi nal f eeder l oss ( dB) 1Ter mi nal noi se f i gur e ( dB) 1. 5
Satellite beam allocation is shown in Figure 45. Eighty-three satellite beams is assumed to cover Japanese island and Exclusive Economical Zone (EEZ). Sub-band of 4.3 MHz is assigned to each satellite beam (seven beam=one cluster=30MHz). Transmit power of each satellite link is 200mW. Maximum number of satellite link of 10,000 links is derived from assumed total transmit power of satellite of 2kW. In the normal period, terminals are assumed to be uniformly distributed. In the disaster period, maximum number of satellite channel, which is able to be assigned to one satellite beam, is assumed to be used. This is realized by changing frequency band allocation to each satellite beam by using channelizing function of satellite transponder which is assumed to be applied in STICS.
APT/AWG/REP-57 Page 42 of 58
Table 16 Condition of terrestrial link.
I t ems Li nk par amet er sAccess scheme CDMAUpl i nk f r equency ( MHz) 1980- 2010Downl i nk f r equency ( MHz) 2170- 2200Number of sub- band 6Sub- band bandwi dt h ( MHz) 5I nf or mat i on r at e ( kbps) 9. 6Occupi ed bandwi dt h/ channel( kHz) 5000
Ant enna gai n of BS atsat el l i t e di r ect i on ( dBi ) - 3
Ant enna gai n of BS att er r est r i al di r ect i on( dBi ) 17
Tr ansmi t power f or BS
30% of t r ansmi t power ofr adi o st at i on l i censei nf or mat i on f or cel l ul arphone base st at i on i nJapan
BS r equi r ed C/ N0 ( dB- Hz) 47. 6BS ant enna noi set emper at ur e ( K) 200
BS f eeder l oss ( dB) 0BS noi se f i gur e ( dB) 1. 5Ter mi nal ant enna gai n ( dBi ) 0
Ter mi nal t r ansmi t power
Est i mat ed by st at i st i calanal ysi s of measur ed dat aof W- CDMA cel l ul ar phonet r ansmi t power obt ai nedby measur ement campai gni n Japan ( bel ow 1mW)
Ter mi nal r equi r ed C/ N0 ( dB-Hz) 47. 6
Ter mi nal ant enna noi set emper at ur e ( K) 80
Ter mi nal f eeder l oss ( dB) 0Ter mi nal noi se f i gur e ( dB) 1. 5

Figure 45 Satellite beam allocation.
Capacity evaluation is performed for three cases; interfering link is only terrestrial link (interference from satellite link is ignored), only satellite link (interference from terrestrial link is ignored), both satellite and terrestrial links. Calculation procedure is described as follows. By using developed interference calculation simulator, received signal power and interference signal power are calculated for each interfered link. Then, obtained values are used to calculate the capacity by using the program by the following procedure.
(a) Average interference level for each link I is calculated based on the equation
I=∑m=1
M
I m⋅B
M (1),where M is number of interfering links in which frequency band is overlapped to interfered link, Im is the interference level for m-th interfering link, and B is ratio of frequency band overlap between m-th interfering link and interfered link.
(b) Link coefficient a, which is maximum number of interfering links under the condition that particular interfered link satisfies required C/N0, is calculated based on the equation
C(a⋅I +N0 )
=[C N 0]req (2)The effect of spatial guard-band is also evaluated by setting spatial guard-band at 0dB, 5dB, 10dB.
d) Evaluation for normal period
i. Evaluation under interference between satellite and terrestrial terminals
(a) Desired signal: satellite uplink
Satellite uplink suffers the interference from terrestrial terminal uplinks using same sub-band outside the satellite cell, and the interference from satellite terminal uplinks using same sub-band in other satellite cells. The result of capacity calculation is shown in Figure 46. The number of satellite link is 10,000, which means that the satellite link is established independent on the value of spatial guard-band. When spatial guard-band is 0 dB, the number of terrestrial terminal without interference from satellite link is 14 million, and that with interference from satellite link is 13 million, respectively. Maximum number of terminals is observed when spatial guard-band is 10 dB.
APT/AWG/REP-57 Page 43 of 58

On the other hand, communication area for terrestrial terminal is 100%, 88%, and 31% when spatial guard-band is 0 dB, 5 dB, and 10 dB, respectively. This indicates that the communication area for terrestrial terminal decreases when spatial guard-band increases.
0
2,000
4,000
6,000
8,000
10,000
12,000
0
5,000,000
10,000,000
15,000,000
20,000,000
25,000,000
30,000,000
35,000,000
0dB 5dB 10dB
Num
ber o
f sat
ellit
e te
rmin
als
Num
ber o
f ter
rest
rial t
erm
inal
s
Spatial guard-band
w/o interference from satellite link
Number of satellite terminals
w/ interference from satellite link
Number of terrestrial terminals
Figure 46 Capacity of interfering links when interfered link is satellite uplink.
(b) Desired signal: terrestrial downlink
Terrestrial downlink suffers the interference from satellite downlinks (interference between satellite and terrestrial links), and the interference from terrestrial downlinks in other terrestrial cells (interference between terrestrial links). In this study, fixed value (interference margin of 6 dB) is applied as the interference between terrestrial links. Then, Capacity of satellite downlink is evaluated. As shown in Figure 47, the number of satellite link is 10,000, which means that the satellite link is established independent on the value of spatial guard-band.
0
2,000
4,000
6,000
8,000
10,000
12,000
0dB 5dB 10dB
Num
ber o
f sat
ellit
e te
rmin
als
Spatial guard-band
Figure 47 Capacity of interfering links when interfered link is terrestrial downlink.
ii. Evaluation under interference between satellite terminals and terrestrial base stations
(a) Desired signal: Satellite downlink
Satellite downlink suffers the interference from terrestrial downlink using same sub-band outside the satellite cell. Base station is interfering station. Satellite terminal is interfered station. In this study, minimum separation distance is evaluated considering the worst-case interference situation in which satellite terminals are located at the cell edge of the satellite cell. Three cases are evaluated; single interfering base station, multiple interfering base stations, and multiple interfering base stations with interference from other satellite beams using same channel. In multiple base station case, nine base stations are located near satellite cell edge with separation distance between
APT/AWG/REP-57 Page 44 of 58

base stations of 5 km. Minimum separation distance between base station and satellite terminals under the condition that satellite link satisfies the required C/N0. Spatial guard-band corresponding to the separation distance is also calculated.
As shown in Table 18, the evaluation results for three cases are calculated; case (a) is single interfering base station, case (b) is multiple interfering base station, and case (c) is multiple interfering base station with other interfering satellite links (average co-channel interference level from eighty-three satellite beams is applied). To calculate spatial guard-band corresponding to the separation distance, satellite antenna pattern is projected to the ground surface. Then, difference between the satellite antenna gain at a particular separation distance from satellite cell edge and the gain at the satellite cell edge is defined as spatial guard-band. Results are calculated for terrestrial propagation models for Urban, Suburban, and Open area based on the extended Hata model. The result indicates that separation distance and corresponding spatial guard-band increases when interference increases (case (b) and (c)). Among these cases, maximum separation distance to share the same frequency band between satellite downlink and terrestrial downlink is 30.2 km (corresponding spatial guard-band is 1.3 dB).
Table 18 Separation distance between satellite terminal and base station and spatial guard-band when interfered link is satellite downlink.
Case Urban Suburban
Openarea
Separation distancebetween satellite
terminal at cell edgeand BS
km 3 6.6 23.3
Spatial guard-band dB 0.1 0.3 1
Separation distancebetween satellite
terminal at cell edgeand BS
km 3.2 8.3 29.7
Spatial guard-band dB 0.1 0.3 1.3
Separation distancebetween satellite
terminal at cell edgeand BS
km 3.3 8.6 30.2
Spatial guard-band dB 0.1 0.4 1.3
Propagation channel
(a) Singleinterfering BS
(w/o interferencefrom satellite links)
(b) Nine interferingBSs
(w/o interferencefrom satellite links)
(c) Nine interferingBSs
(w/ interferencefrom satellite link:
average for 83beams)
(b) Desired signal: Terrestrial uplink
Terrestrial uplink suffers the interference from satellite uplink in the satellite cell using same frequency. In this study, minimum separation distance is evaluated considering the worst-case interference situation in which satellite terminals are located at the cell edge of the satellite cell. Three cases are evaluated; single interfering satellite terminal, multiple interfering satellite terminals, and multiple interfering satellite terminals with interference from terrestrial links using same frequency. In multiple interfering satellite terminal case, all channels which are able to be assigned to one satellite beam are assigned to satellite terminals (223 channels=30 MHz). Fixed value is applied as the interference from terrestrial link (interference margin of 6 dB).
Table 5 lists the evaluation result. The result indicates that separation distance and corresponding spatial guard-band increases when interference increases (case (b) and (c)). Among these cases, maximum separation distance to share the same frequency band between terrestrial uplink and satellite uplink is 30.9 km (corresponding spatial guard-band is 1.4 dB).
APT/AWG/REP-57 Page 45 of 58

Table 19 Distance between satellite terminal and base station and spatial guard-bandwhen interfered link is terrestrial uplink
Case Urban Suburban
Openarea
Separation distancebetween satellite
terminal at cell edgeand BS
km 0.7 1.7 6.3
Spatial guard-band dB 0 0.1 0.3
Separation distancebetween satellite
terminal at cell edgeand BS
km 3.5 7.7 26
Spatial guard-band dB 0.1 0.3 1.1
Separation distancebetween satellite
terminal at cell edgeand BS
km 4.5 10.1 30.9
Spatial guard-band dB 0.2 0.4 1.4
Propagation channel
(a) Single interferingsatellite terminal(w/o interference
from terrestrial links)
(b) 223 interferingsatellite terminals(w/o interference
from terrestrial links)
(c) 223 interferingsatellite terminals
(w/ interference fromterrestrial links:
interference margin6 dB)
iii. Evaluation for disaster period
Considering disaster period, capacity is evaluated under the example scenario such that satellite resource (frequency band) is concentrated to the particular satellite beam. Satellite beam allocation in disaster scenario is illustrated in Figure 48. Beam No.55 covers the disaster area in this scenario. All the frequency bands for other six satellite beams in the same cluster are allocated to this satellite beam. Satellite link capacity is seven times higher than that in normal period.
As shown in Figure 49, evaluation results showed the trend similar to the results in the normal period. 10,000 satellite links are established under the co-channel interference. Terrestrial link capacity is more than ten million terminals. Maximum number of terrestrial terminals is observed when spatial guard-band is 10 dB. Similar trend is also observed for communication area for terrestrial terminal against spatial guard-band. It is 84%, 65%, and 31% when spatial guard-band is 0 dB, 5 dB, and 10 dB, respectively. This indicates that the communication area for terrestrial terminal decreases when spatial guard-band increases.
Figure 48 Satellite beam allocation in disaster scenario
APT/AWG/REP-57 Page 46 of 58
0
2,000
4,000
6,000
8,000
10,000
12,000
0
10,000,000
20,000,000
30,000,000
40,000,000
50,000,000
60,000,000
0dB 5dB 10dB
Num
beer
of s
atel
lite
term
inal
s
Num
ber o
f ter
rest
rial t
erm
inal
s
Spatial guard-band
w/o interference from satellite link
Number of satellite terminals
w/ interference from satellite link
Number of terrestrial terminals
Figure 49 Capacity of interfering links when interfered link is satellite uplink in disaster scenario

e) SummaryIn this study, capacity of terrestrial and satellite links in STICS under co-channel interference is evaluated to verify frequency sharing between terrestrial and satellite links. Obtained results are summarized as follows.
(a) Evaluation under the interference between satellite and terrestrial terminal Evaluation for the normal period: maximum satellite links (10,000 links in this study) and
more than ten million terrestrial links are able to be assigned. One example evaluation for the disaster period: capacity is similar to that for the normal
period. Increase of spatial guard-band improves capacity for terrestrial link and causes decrease of
communication area for terrestrial link.
(b) Evaluation under the interference between satellite terminal and terrestrial base station Interfered link is established by taking separation distance between satellite terminal and
terrestrial base station.
From these observations, it is concluded that frequency sharing between satellite and terrestrial links in STICS is feasible.
f) References
[1] A. Miura, H. Tsuji, K. Endo, Y. Fujino, and M. Toyoshima, “On capacity evaluation in satellite-terrestrial integrated mobile communication system,” Proceedings of 64th International Astronautical Congress, IAC-13-B2.6.6, Beijing, China, Sep. 2013.[2] A. Miura, H. Watanabe, N. Hamamoto, Y. Fujino, and R. Suzuki, “On interference level in satellite uplink for satellite terrestrial integrated mobile communication system,” 28th AIAA International Communications Satellite Systems Conference, AIAA-2010-8850, Anaheim, CA, USA, Aug./Sep. 2010.[3] Y. Fujino, A. Miura, N. Hamamoto, H. Tsuji, and R. Suzuki, “Research of Satellite/Terrestrial Integrated Mobile Communication System for Secured and Safe Society,” Proc. 2010 Asia-Pacifc Radio Science Conference (AP-RASC 2010), Toyama, Japan, Sep. 2010.
6.6.9 Studies on cooperative control technology between satellite and terrestrial components
a) Background
In STICS, cooperative control of satellite and terrestrial system is required to establish satellite or terrestrial component to dual-mode terminal in seamless manner. To maintain communications link under temporally changing satellite and terrestrial traffic, the traffic state needs to be monitored and resource allocation state needs to be dynamically changed.
To evaluate feasibility of the cooperative control of satellite and terrestrial component, network architecture and dynamic control algorithm has been studied to flexibly assign frequency band depending on temporal change of satellite and terrestrial traffic [1]. Moreover, hardware simulator is developed to verify this dynamic control algorithm [2].
b) Network architecture
Proposed network architecture is based on 3GPP (3rd Generation Partnership Project) architecture which is shown in Figure 50 [1]. Satellite and terrestrial systems are connected to each other via administrator server which has a capability of dynamic network control. Terrestrial system is controlled under 3GPP system and the satellite system is considered as Non-3GPP system. In APT/AWG/REP-57 Page 47 of 58

administrator server, usage ratio, variation ratio and abnormal detection of the terrestrial and satellite network is monitored and used for an integration control. Then, it generates three commands as follows:
Dynamic resource allocation. The role of this command is to modify or change bandwidth of satellite or terrestrial frequency.
Traffic regulation. This command is applied to make traffic regulation in heavy traffic concentration.
Handover (H/O) between satellite and terrestrial network. This is the command to make handover between satellite and terrestrial network.
SatelliteSystem
TerrestrialSystem
Variation ratio
Usage ratio
Abnormal detection
Information
Conecction
Update Trigger
ResourceUpdateRequest
Traffic reguration
HO
Dynamic Resource Admin.
HO Request
update
Integration control
Terrestrial Network
Admin. SV
Satellite
BS
Sat. GW
Satellite Area
Terrestrial Area
Terminal
Whole Architecture
Figure 50 Network architecture of STICS.
c) Simulation result with hardware simulator
A hardware simulator has been developed to verify this dynamic network control algorithm as shown in Figure 51. It consists of terminal, satellite, satellite gateway, terrestrial mobile base station/control station, and dynamic network controller to simulate communication process such as call connection, handover, etc. By using the hardware simulator, actual communication signal between terminals with dynamic switching of satellite/terrestrial link is verified based on satellite resource control, priority call control and call restriction depending on temporal change of traffic.
Satellite
Handover
Satellite gateway
Base station
Handover
Random walkBase station
controller
Base station controller
Dynamic network
controller
Terrestrial cell
Satellite cell
Mobile terminal
Satellite/satellite gateway simulator
Administrative monitoring and control simulator
Terminal simulator
Scope of simulation Figure 51 Schematic diagram of hardware simulator for network system
APT/AWG/REP-57 Page 48 of 58

The test by using the hardware simulator was carried out which is a large-scale simulation mimicking disaster scene by using actual traffic data in the Tohoku-Pacific Ocean Earthquake in Japan. High traffic and base station damage at disaster area are simulated with simulation area and terminal location as shown in Figure 52. Example simulation result shows that it is difficult to satisfy all traffic demand in large-scale disaster. However, it is also observed from the simulation result as shown in Figure 53 that priority calls in the disaster area are able to be connected when 25MHz of whole 30MHz bandwidth is assigned to the satellite beam in the disaster area.
- 20km2 x 28 areas- 2.5 million terminals- Simulation period: 12 hours
Figure 52 Simulation area and terminal location
Figure 53 Example of simulation result (Number of call loss in priority call at satellite station etc.)
d) Summary
From these observations, it is concluded that priority-based access control enables priority call connection to satellite link, and the cooperative control technology including dynamic control algorithm is effective for STICS.
APT/AWG/REP-57 Page 49 of 58

e) References
[1] Y. Fujino, H. Tsuji, K. Endo, K. Okada, and H. Wakana, “Modeling and simulation of dynamic traffic control between satellite and terrestrial in case of national disasters by using Satellite Terrestrial Integrated mobile Communication System,” Proceedings of 30th AIAA ICSSC, Ottawa, Canada, Sep. 2012.[2] A. Miura, Y. Fujino, T. Orikasa, H. Tsuji, K. Okada, M. Akioka, and M. Toyoshima, “R&D status of satellite/terrestrial integrated mobile communication system,” Proceedings of 31th AIAA ICSSC, Florence, Italy, Oct. 2013.
6.6.10 Studies on technologies onboard satellite for STICS
a) Background
In STICS, to cover the required service area by using 30m-class-diameter large satellite antenna, around hundred multi-beam system is required. Sidelobe level of the satellite antenna needs to be maintained in low level to suppress beam-to-beam interference level in multibeam system, and to suppress interference level to/from other systems. To satisfy these requirements, analog beamforming is not practical. Onboard digital beamforming is advantageous in realizing these requirements because of its scalability and flexibility. Satellite and terrestrial traffic is asymmetrically distributed in wide area and changing temporally. Especially in emergency situation such as disaster, large traffic happens in disaster area. Therefore satellite resource (e.g. frequency, power) needs to be flexibly allocated to each satellite beam depending on the traffic state. Onboard digital channelizing is a candidate technology to satisfy this requirement because of its flexibility.Regarding these requirements for satellite onboard communications system, studies on the satellite onboard technologies such as the multi beamforming, low sidelobe, and reconstruction of resource allocation have been conducted.
Figure 54 illustrates the schematic diagram of satellite onboard communications system. It consists of user-link section in S-band with 30-m-class large reflector antenna, digital section, and feeder-link section. Digital section has digital beamformer and digital channelizer (DBF/channelizer) for transmit and receive section to meet the aforementioned requirements. To verify feasibility of functions needed for onboard satellite, prototype user-link section (S-band radiating elements, diplexers, LNAs, SSPAs, D/Cs and U/Cs) and digital section (DBF/channelizer dedicated for sixteen elements and sixteen beams) has been developed and tested [3,4]. Figure 55 shows the outlook of the small-scale models.
Figure 54 Schematic diagram of satellite onboard communications system
APT/AWG/REP-57 Page 50 of 58

Figure 55 Outlook of small-scale models
b) Study on onboard technologies for multi beamforming and low sidelobe
A prototype DBF/channelizer with sixteen-elements and sixteen-beams has been developed as part of hundred-elements and hundred-beams DBF/channelizer. As shown in Figure 56, DBF, sixteen element feeding array, and 3.3m deployable mesh reflector was applied to multi beam measurement in anechoic chamber. Measurement of hundred beams is realized by multiple repetitive measurements of sixteen-beam DBF. Hundred beams with multi color frequency allocation (number of frequencies = seven) is allocated in service area. Part of measured radiation patterns are shown in Figure 57. The result indicates that hundred beams are formed to expected directions and that the measured radiation patterns agreed with the calculated patterns. From these observations, effectiveness of multi beamforming technology is confirmed.
Figure 56 Outlook of for multibeam measurement system
APT/AWG/REP-57 Page 51 of 58

Figure 57 Part of measured radiation patterns of hundred multibeams (seven beams)
To verify low sidelobe in STICS satellite antenna, the antenna sidelobe suppression test based on DBF weight control has been conducted. Sixteen element DBF and feeding array is dedicated to the measurement. Figure 58 illustrates the verification process. At first, radiation pattern of sixteen element feeding array with sixteen element DBF is measured by using near-field measurement system (as shown in Figure 59).
Figure 58 Verification process of low sidelobe technology
Figure 59 Near-field measurement of feeding array
Then, electromagnetic field on virtual large reflector (27m diameter) illuminated by the feeding array is calculated from measured near-field of the feeding array. Finally, Secondary radiation pattern is calculated by the electromagnetic field on the virtual large reflector. Four repetitive measurements of sixteen element DBF and feeding array is conducted to obtain secondary radiation pattern of the reflector with 64 element feeding array. Exciting coefficient of DBF for low sidelobe antenna is calculated and set to the DBF before the measurement. The evaluation result as shown in Figure 60 indicates that low sidelobe with 20 dB from peak gain of main beam was obtained.
APT/AWG/REP-57 Page 52 of 58

(a) Conventional pattern (b) Low-sidelobe pattern
Figure 60 Example results of low-sidelobe test
Furthermore, several tests were carried out to study the distortion of radiation pattern of large mesh reflector antenna caused by heat distortion of reflector and compensation of its radiation pattern. One of the tests was antenna sidelobe suppression test in anechoic chamber using DBF/channelizer, feeding array and 3.3m deployable reflector. In this test, reflector surface shape was intentionally distorted and was measured. Sidelobe level was successfully suppressed based on DBF weight control. Throughout this test, we confirmed that distorted radiation pattern is able to be compensated with DBF technology, and that in future deployment of this technology, onboard measurement methodology for reflector surface shape is required.
c) Study on onboard technology for reconstruction of resource allocation
Channelizer realizes efficient spectrum usage by re-arrangement of feeder link channel. It also has resource re-allocation function by which frequency band allocation for each satellite beam is dynamically changed.
Required feeder link bandwidth for channelizer in STICS is 120 MHz. However, we developed digital channelizer with feeder link bandwidth of 200 MHz to meet future requirement for future broadband satellite transponder. With this channelizer, the feeder-link bandwidth is reduced from 400 MHz to 200 MHz (400 MHz is feeder-link bandwidth without using channelizer).
Performance test for DBF/channelizer was carried out by the coupling test of transmitting and receiving DBF/channelizer. The test successfully verified basic functions and performances such as resource re-allocation, dynamic range, spectrum efficiency, and transmission performance. A measured example of resource allocation test is shown in Figure 61.
(a) Equal bandwidth allocation (b) Wide bandwidth allocated to
a satellite beam in disasterFigure 61 Measured example of resource allocation test
APT/AWG/REP-57 Page 53 of 58

d) Summary
Throughout the R&D, we proposed the satellite onboard communications system technology for STICS, and developed small-scale prototype of DBF/channelizer and feeding array. Onboard technologies for multi beamforming, low sidelobe, and reconstruction of resource allocation were verified by the feasibility tests.
e) References
[1] T. Minowa, M. Tanaka, N. Hamamoto, Y. Fujino, N. Nishinaga, R. Miura, and K. Suzuki, “Satellite/terrestrial integrated mobile communication system for nation's security and safety,” Trans IEICE on Communication (Japanese edition), Vol.J91-B, No.12, pp.1629–1640, Dec. 2008.[2] Y. Fujino, A. Miura, N. Hamamoto, H. Tsuji, and R. Suzuki, “Research of satellite/terrestrial integrated mobile communication system for secured and safe society,” Proceedings of 2010 Asia-Pacifc Radio Science Conference (AP-RASC 2010), Toyama, Japan, Sep. 2010.[3] A. Miura, M. Akioka, T. Orikasa, H. Tsuji, Y. Fujino, T. Matsuzaki, N. Kobayashi, T. Kumagai, and Y. Koishi, “A study of on-board processor for terrestrial and satellite integrated communication system,” 2013 Joint conference of 19th Ka and broadband commnucations, navigation and earth observation conference and 31st AIAA ICSSC, Florence, Italy, Oct. 2013.[4] T. Orikasa, H. Tsuji, Y. Fujino and A. Miura, “A study of large reflector antenna mounted on communication satellite for satellite/terrestrial mobile communication system,” 2013 Joint conference of 19th Ka and broadband commnucations, navigation and earth observation conference and 31st AIAA ICSSC, Florence, Italy, Oct. 2013.
7. Hybrid satellite/terrestrial system
7.1. Overview
Hybrid networks composed by satellite backhauling and terrestrial radio access network comes into place, specifically to provide broadband connectivity to low densely populated areas, i.e. suburban and rural areas. An advantage of combining these two technologies is that of efficiently extending network coverage and of avoiding deploying of expensive backbone infrastructures needed to enable connectivity in non-urban areas.
In addition, hybrid networks are also expected to offer a complementary communication means by satellite networks when terrestrial networks are not available due to, e.g. a disaster, while offering high quality services by terrestrial networks for ordinal conditions. For example, Japan had experienced a service outage for long period in a wide area because terrestrial networks were severely damaged at the Great East Japan Earthquake on March 11, 2011. Consequently, a large number of users were affected and imposed to wait for their recovery. Taking such use cases into account, satellite networks will play an important role to provide robust and efficient means of communication.
Figure 62 shows the concept of a hybrid satellite/terrestrial system.
APT/AWG/REP-57 Page 54 of 58

Figure 62 Concept of hybrid satellite/terrestrial system
7.2. Requirements from users’ point of view
It is not reasonable to assume that users always carry a separate terminal for satellite systems in addition to a terrestrial system handset preparing an unexpected disaster. Therefore, it is essential that the ordinal terrestrial handsets (e.g. Smartphone) can also be capable of satellite systems so that users can always keep them without increasing the terminal size. Namely, satellite communications needs to be available even for the low-end user terminals with the same transmission power, antenna gain etc. as the terrestrial systems.
7.3. Applications
Considering the support of hybrid systems by the ordinal handsets, all of the applications available in the current and/or future terrestrial systems should be supported. However, the link throughput of the satellite system is limited since it works particularly under the power limited circumstances for satellite communications. Given these technical constraints, the feasible applications will be the follows:
Message service (SMS, MMS etc) Voice call (including VoIP) Internet browsing (Limited use) Social Network Service (Limited use) Mobile broadcasting / multicasting Emergency calling
7.4. Key technologies for hybrid systems
(a) Large deployable antenna for satellites
It is necessary to obtain additional gain by large antenna equipped on the satellite in order to establish a satellite link because it is not so easy to obtain it by the implementation of user handsets as mentioned earlier in Section 8.2. Some operators in the United States are the example commercial satellites that have equipped large deployable antennas (18-22m antenna reflector).
APT/AWG/REP-57 Page 55 of 58

(b) Beam shape adjustment
It is observed that a surface of large deployable reflector would be deformed due to thermal changes in space. Thus, there is a risk of unexpected interference that a beam covering a certain service area shifts to another service area due to reflector surface distortion. In order to solve this issue, the establishment of beam adjustment associated with reflector surface distortion is one of the most important technologies at satellite installation using a large reflector.
(c) Multi-beam technology and flexible frequency reuse
When the terrestrial system has been unexpectedly halted by e.g. a disaster, it is anticipated that the amount of voice calls using satellite system would rapidly increase in the devastated region. To deal with such traffic, satellite systems are required to be capable of a precise control of coverage areas by multi-beam technology and flexible resource allocation of frequency based on the traffic demand in the areas. Furthermore, it is expected to improve the frequency reuse efficiency by multi-beam technology which allows dense beam assignment. Since the precise beam shape control is required, combination with beam correction technology described above is important.
(d) Air interface corresponding to narrow band
As another technology to compensate low output power of user handsets, it is considered to increase power density by the narrowband uplink transmission. GMR (GEO-Mobile Radio Interface *ETSI TS 101 376[GMR-1], TS 101 377[GMR-2]) and xHRPD (Extended Cell High Rate Packet Data *TIA-1185) can be considered as a standardized air interface.
7.5. Possible system architecture and features
Figure 63 shows possible system architecture of a hybrid system. The system consists of a terrestrial network (e.g. LTE in the figure) and a complementary satellite network (e.g. xHRPD in the figure). The satellite network is interconnected to terrestrial network after terminating the air interface at satellite base station subsystem (SBSS). Terminated satellite air interface is converted to standard interface for LTE core network at HRPD serving gateway (HSGW). In this configuration, satellite network does not have authentication systems (AAA) and gateway systems to connect to PDN. Those functions are provided by interconnected terrestrial core network.
APT/AWG/REP-57 Page 56 of 58

MME HSS
SGW PGW
PCRF
eNB PDN
SBSS HSGW
Satellite
UE
S101
A10/A11
S2aS103
S1-MME
S1-U
S11
S6a
S5
Gx
SGi
Uu
xHRPDAir Interface
Terrestrial Network
Satellite Network
AAASWx
STa
Figure 63 Network architecture for LTE and xHRPD based hybrid MSS system
Hybrid systems don't require mutual control between a terrestrial network and a satellite network because it works to switch these networks. Since an additional satellite system can be installed without an extensive modification in existing terrestrial systems and significantly service impact on existing terrestrial users, hybrid systems have an advantage in terms of system introducing at an early stage.
7.6. Technical issues
As described in 8.4, a technical challenge is how to obtain the necessary gain in the user terminal – satellite link, which cannot be obtained by the user terminal due to the limitation of the terminal size. In this document, one solution is provided as an example, i.e. compensates the gain by large antenna on the satellite. However, according to the experiment of ETS-VIII (Engineering Test Satellite VIII) in Japan equipped with a large reflector, a distortion of the reflector surface occurs by thermal variation, by solar eclipse etc. As a result, it was observed that the pointing direction of the beam shifted about 0.15 degrees to the east direction [1]. This observed phenomenon cannot be ignored in for the satellite systems using a large antenna. Considering the possible distortion on reflector surface, beams should allocate with large margin to avoid interference between beams. Consequently, it is concerned that this issue reduces frequency reuse efficiency because satellite system is not possible to allocate sufficient capacity. The solution of this issue is efficient not only for hybrid systems but also for other satellite systems.To cope with this issue, R&D regarding dynamic control technology to maintain the beam shape will be started since 2014 in Japan.
7.7. References
[1] Y.FUJINO, “Satellite/Terrestrial Integrated Mobile Communication System Applicable for Settlement beyond LEO” JUSTSAP 2010, Hawaii, USA, Nov. 2010.
APT/AWG/REP-57 Page 57 of 58

8. Conclusion
This Report provides the architecture and performance of integrated MSS systems and hybrid satellite/terrestrial systems below the 3 GHz band.
In the context of the drive to deliver broadband services throughout global coverage, the MSS system will promote the rapid deployment and delivery of such services to rural areas, geographically isolated areas and countries where wire-line networks are still in need of significant upgrading before wire-line broadband is achievable. In those rural areas where broadband is already or is soon to be available, the deployment of MSS broadband services will provide an alternative service, thereby promoting choice. In addition, the implementation of CGCs in a MSS system could allow for the development of a range of new market and broadband services. The CGCs could operate at the same frequencies as the associated satellites and be used to improve the availability of MSS, for example in areas where the communication with space stations cannot be guaranteed. The CGCs would provide more efficient spectrum usage and improved coverage according to the deployment of the CGCs would further attract larger consumer markets resulting in increased economies of scale.
In conclusion, integrated MSS systems and hybrid satellite/terrestrial systems with suitable latest technologies will be expected as effective rural area solutions and also reasonable PPDR solutions in the Asia-Pacific Region where natural disasters such as earthquake and tsunami sometimes occur.
____________
APT/AWG/REP-57 Page 58 of 58