
April, 2017eprints.covenantuniversity.edu.ng/9526/1/Binder1.pdfappreciation to Pastor E. A Adeboye...
245
ii EMPLOYEE RESOURCING STRATEGIES: IMPLICATIONS FOR JOB PERFORMANCE AND PERCEIVED CORPORATE IMAGE IN SELECTED NIGERIAN PRIVATE UNIVERSITIES FALOLA, HEZEKIAH OLUBUSAYO (Matric Number: 13PAH00563) B.Sc. Industrial & Labour Relations M.Sc. Industrial Relations & Human Resources Management A THESIS SUBMITTED TO THE DEPARTMENT OF BUSINESS MANAGEMENT, COLLEGE OF BUSINESS AND SOCIAL SCIENCES, COVENANT UNIVERSITY, OTA, OGUN STATE, NIGERIA IN PARTIAL FULFILLMENT OF THE REQUIREMENTS FOR THE AWARD OF THE DEGREE OF DOCTOR OF PHILOSOPHY (Ph.D) IN INDUSTRIAL RELATIONS AND HUMAN RESOURCE MANAGEMENT April, 2017
Transcript of April, 2017eprints.covenantuniversity.edu.ng/9526/1/Binder1.pdfappreciation to Pastor E. A Adeboye...
ii
EMPLOYEE RESOURCING STRATEGIES:
IMPLICATIONS FOR JOB PERFORMANCE AND PERCEIVED
CORPORATE IMAGE IN SELECTED NIGERIAN PRIVATE
UNIVERSITIES
FALOLA, HEZEKIAH OLUBUSAYO (Matric Number: 13PAH00563)
B.Sc. Industrial & Labour Relations
M.Sc. Industrial Relations & Human Resources Management
A THESIS SUBMITTED TO THE DEPARTMENT OF BUSINESS
MANAGEMENT, COLLEGE OF BUSINESS AND SOCIAL SCIENCES,
COVENANT UNIVERSITY, OTA, OGUN STATE, NIGERIA
IN PARTIAL FULFILLMENT OF THE REQUIREMENTS FOR THE AWARD
OF THE DEGREE OF DOCTOR OF PHILOSOPHY (Ph.D) IN INDUSTRIAL
RELATIONS AND HUMAN RESOURCE MANAGEMENT
April, 2017
iii
Acceptance
This is to attest that this thesis is accepted in partial fulfilment of the requirements for the
award of the degree of Doctor of Philosophy in Industrial Relations and Human Resources
Management in the Department of Business Management, College of Business and Social
Sciences, Covenant University, Ota.
Mr. Philips John Ainwokhai ………………………….
Secretary, School of Postgraduate Studies Signature & Date
Prof. Samuel Wara ………………………….
Dean, School of Postgraduate Studies Signature and Date

iv
Declaration I, FALOLA Hezekiah Olubusayo declare that this research work titled “Employee
Resourcing Strategies: Implications for Job Performance and Perceived Corporate Image in
Selected Nigerian Private Universities” was carried out by me under the supervision of
Professor J. O. Adeyeye and Dr. A. A. Adeniji. The ideas and views of this research are
products of original research undertaken by me, and the views of other researchers have
been duly expressed and acknowledged.
FALOLA Hezekiah Olubusayo ………………………
Signature & Date

v
Certification
It is certified that this thesis titled “Employee Resourcing Strategies: Implications for Job
Performance and Perceived Corporate Image in Selected Nigerian Private Universities” is based
on original research carried out by FALOLA Hezekiah Olubusayo under our supervision and that
it has not been submitted for the award of any degree in this or any other University.
The above certification is attested to by:
Prof. J. O. Adeyeye …………………………….....
Supervisor Signature & Date
Dr. A. A. Adeniji ………………………………..
Co-Supervisor Signature & Date
Dr. O. O. Iyiola ………………………………..
Head, Department of Business Management, Signature & Date
Prof. S. A. Adebola ………………………………..
External Examiner Signature & Date
Prof. S. T. Wara …………………………..........
Dean, School of Postgraduate Studies, Signature & Date

vi
Dedication
This thesis is dedicated to none other than the Almighty God who has given me the gift
of life, strength and inspiration to complete this study.
To Him alone be all the glory.
vii
Acknowledgements
I am grateful to God Almighty who gave me the grace, wisdom and the strength to write this thesis.
To Him alone be all the glory, honour and adoration forever. I want to express my heartfelt
appreciation to Pastor E. A Adeboye in whose ministry I have been tremendously blessed and
Bishop D. O. Oyedepo, for his foresight and for constantly giving out time both to challenge our
potentials in God and to provoke us in the school of exploits. I pray that God will continue to
strengthen and grant them more grace. AMEN!
My appreciation also goes to the Vice Chancellor of Covenant University, Prof. A. A. A, Atayero,
the Deputy Vice Chancellor, Prof. Shalom Chinedu, the Registrar, Mrs. M. O. Aboyade, the Dean
of the College of Business and Social Sciences, Prof. F. O. Iyoha, Dean of School of Postgraduate
Studies, Prof. S. T. Wara and Sub Dean, School of Postgraduate Studies, Dr. A. H. Adebayo for
their undisputable love and concern for the successful completion of the Doctor of Philosophy
programme. I want to say thank you.
I want to express my sincere gratitude to my mentor, teacher and supervisor, Prof. Olufemi
Adeyeye who has shown keen interest and given valuable advice in this study. To my ever-
dynamic co- supervisor, Dr. A. A. Adeniji, I want to say thank you for your care, support,
understanding and loving heart that has seen me through this programme. Equally, I wish to
appreciate my energetic and ever resourceful Head of Department, Dr. O. O. Iyiola for the constant
attention and needed direction he provided. I cannot forget my mentors who encouraged me when
I newly joined the institution to write articles, Dr. A. O. Osibanjo, Dr. R. E. K. Worlu and Dr. O.
O. Ogunnaike. I will forever be grateful.
There are many other faculty whose inputs and contributions made this work a success. Senior
colleagues and fathers they are really. These include distinguished Prof. David Akinnusi, Prof. A.
A. Alao, Prof. P. Edewor, Prof. I. O Akintayo, Prof. O. S. Ibidunni, Prof. O. O. Obembe, Dr. C. L.
Moses and Dr. D. Imhonopi. Thank you so much for the push and the great intellectual input made
to this work. I will not forget the contributions and criticisms of Dr. E. Agwu, Dr. O. A. Adegbuyi,
Dr. O. J. Kehinde, Dr. J. Abiodun, Dr. (Mrs) Matthew, Dr. O. A. Oludayo, Dr. O. Oke-Ajah, Dr.
S .I. Ojo, Dr. E. M. Ogbari, Dr. E. E. Igbinoba, Dr. O. A. Oyewunmi, Dr. M. O. Akinbode, Dr. O.

viii
Agboola, Dr. C. Oyafunke-Omoniyi (Olabisi Onabanjo University); Dr. Tunde Oseni (Lead City
University); Dr. E. Sokefun, Barrister O. J. Olujobi and many others that are not mentioned here.
I thank them all for creating time to nurture and help me read through this work.
I sincerely appreciate my college examiners: Prof. D. E Gberevbie and Dr. O. Omojola. Your
remarkable inputs made this report insightful. God will continue to enrich your knowledge. I would
not forget to appreciate the PG representative examiner, Dr. C. Ayedun for his contributions to
this work, God will continue to bless you sir.
Special mention must be made of friends and colleagues on whose wings of love I am flying. I am
eternally grateful to. Dr (Mrs.) Oyewunmi A. E, Dr. Salau O. P, Dr. (Mrs.) T. Borishade, Messrs
Ibidunni A. S, Olokundun A. M, Akinbode, O. J, Fred Peter, Mr. D. U. Abasilim, T. T., Mrs.
Dirisu, J. I, Mrs. Aka, D. O, Mrs. Atolagbe, T., Mrs. Adeniji, C. G. Miss. Amaihian A. B, Miss
Motilewa, D. B, Miss Ajiboye Esther, Mrs. Oluwaniyi, D. G, Mr. Oluwadare (RUN), Mr.
Zacchaeus (Redeemer’s University, Ede) and my research assistant Mr. C. T. Duke, I appreciate
your commitment.
To my siblings Mayowa, Tosin, Damilola, Elijah, I love you all. My deepest thanks also go to all
my friends both home and abroad- Michael Oluwaseun, Samson Abodunrin, Akinlotan Gbenga,
Seyi Olakunle, Timothy Obafemi, Olumefun Olufemi, Adetutu Bello, Adeaga Desola, Dr. Mrs.
Odunlami, Mrs. Titilayo Owolabi, you are wonderful. I must also remember members of RCCG
Freedom Court Parish, I say God bless you all.
I want to sincerely appreciate all the Academic Staff of the selected Universities for their support
and cooperation. My appreciation also goes to the members of staff of the establishment/registry
unit of the selected Universities for their cooperation during the interviews conducted. May God
bless every one of you.
I appreciate God for the spiritual coverage I enjoyed from my pastors – Pastor J. O Oyekunle,
Pastor Ade Osilalu, Pastor Noah Solola, Pastor Ndu, Engr. Seyi Ogunmuyiwa, Evangelist Gbenro
Lawson, Bro. Dele Adesina and the brotherly love of Deacon Olufemi Odunlami, Deacon Bakare,
ix
Bro Michael Adeleke and other co-labourers and Ministers in God’s Vineyard, may God count us
worthy on that glorious day (Amen). I will not forget the efforts of my family members, Mr. Tunde
Lawson, Mrs. Remi Olalupo, Mrs. Ibukun Olatuni, Mrs. Ronke Lydia and others, may God bless
you all. My heartfelt appreciation goes to my parents – Mr. & Mrs. A. O. Falola who gave birth to
me and offered me early tutelage. I will forever remember good deeds and values both of them
deposited in my life.
I thank my wife – Oluwakemisola Roseline Falola, for her support and words of encouragement.
I must not forget my handsome son, Daniel Omotayo Maxwell OLULOLA, may God Almighty
bless you beyond measures.
Finally, but not the least, to all those who prayed for me, played with me and even those that
scorned me, I love you all.
FALOLA Hezekiah Olubusayo
April, 2017

x
Table of Contents
Title Page …………………………………………………………………………………. ii
Acceptance………………………………………………………………………………… iii
Declaration ………………………………………………………………………………. iv
Certification……………………………………………………………………………… v
Dedication ………………………………………………………………………………. vi
Acknowledgements ………………………………………………………………………. vii
Table of Contents ………………………………………………………………………… x
List of Tables……………………………………………………………………………… viii
List of Figures ……………………………………………………………………………. xvi
Abstract …………………………………………………………………………………… xvii
CHAPTER ONE:
INTRODUCTION
1.1 Background to the Study …………………………………………………………. 1
1.2 Statement of the Research Problem ……………………………………………… 4
1.3 Objectives of the Study …………………………………………………………... 6
1.4 Research Questions ………………………………………………………………. 6
1.5 Research Hypotheses ……………………………………………………………. 7
1.6 Significance of the Study ………………………………………………………… 7
1.7 Scope of the Study ………………………………………………………………. 8
1.8 Operationalization of Variables …………………………………………………. 9
1.9 Structure of the work …………………………………………………………… 11
1.10 Definition of Basic Terms ……………………………………………………… 11
CHAPTER TWO
LITERATURE REVIEW ……………………………………………………………... 14
2.1 Introduction ……………………………………………………………………. 14
2.2 Conceptual Framework ………………………………………………………... 14
2.2.1 The Concept of Strategy ………………………………………………. 14
2.2.2 The Concept of Strategic Human Resource Management …………….. 16
2.2.3 The Emergence of Strategic Human Resource Management (SHRM) … 18
2.2.4 Strategic Human Resource Management Practices ……………………. 20
2.2.5 A Linear Strategic HRM Model ……………………………………….. 22
2.2.6 Employee Resourcing Strategies ………………………………………. 22
2.2.7 Human Resource Planning (HRP) ………………………………………. 24
2.2.8 Process of Human Resource Planning ………………………………...... 24
2.2.9 Human Resource Planning Strategies …………………………………... 26
2.2.10 Recruitment Strategies ………………………………………………….. 29

xi
2.2.11 The Aims of Recruitment Strategies …………………………………… 30
2.2.12 Recruitment Process …………………………………………………….. 30
2.2.13 Staff Recruitment Sources in Organisations ……………………………. 32
2.2.14 Selection Strategies ……………………………………………………….. 34
2.2.15 Four Approaches to Strategic Selection …………………………………. 39
2.2.16 Employee Retention Strategies ………………………………………….. 39
2.2.17 The Importance of Employee Retention ………………………………… 42
2.2.18 Corporate Image in Institution of Higher Learning …………………….. 43
2.2.19 Corporate Image in Universities ………………………………………… 44
2.2.20 University’s Brand Image ……………………………………………….. 46
2.2.21 University’s Corporate Reputation ……………………………………… 46
2.2.22 University’s Corporate Identity …………………………………………. 47
2.2.23 University’s Research Image ……………………………………………. 48
2.2.24 Job Performance ………………………………………………………… 50
2.2.25 Types of Performance ………………………………………………….. 50
2.2.26 Job Performance in University System …………………………………. 51
2.2.27 Historical Background of Private Universities in Nigeria ……………… 52
2.2.27.1 Private Universities in Nigeria ………………………………………. 52
2.2.27.2 History of Selected Universities ……………………………………… 54
2.3 Theoretical Framework ……………………………………………………………… 58
2.3.1 Universalistic Theory of Management …………………………………. 58
2.3.2 Configurational theory of Management……………………………… 59
2.3.3 Contingency Theory of Management ………………………………… 61
2.4 Empirical Framework ………………………………………………………….. 63
2.4.1 Human Resource Planning and University Brand Image ………………… 63
2.4.2 Employee Recruitment Strategies and Research Image ……………. 65
2.4.3 Employee Selection Strategies and Corporate Reputation ………………. 68
2.4.4 Employee Retention Strategies and Corporate Identity ………………… 69
2.4.5 Employee Resourcing Strategies and Job Performance …………………. 71
2.5 Gaps in Literature ……………………………………………………………… 73
CHAPTER THREE
METHODOLOGY …………………………………………………………………. 75
3.1 Introduction ………………………………………………………………….. 75
3.2 Research Design …………………………………………………………….. 75
3.3 Population of the Study ……………………………………………………… 75
3.4 Sample Size Determination …………………………………………………. 76
3.5 Sampling Techniques ……………………………………………………….. 78
3.6 Sample Frame ….…………………………………………………………….. 80
3.7 Sources of data ……………………………………………………………… 80
3.8 Research Instruments and Data Collection Methods ……………………… 81
xii
3.9 Reliability and Validity of Research Instruments ………………………….. 83
3.10 Data Presentation and Analysis …………………………………………….. 84
3.11 Ethical Consideration ………………………………………………………. 86
CHAPTER FOUR:
RESULTS ……………………………………………………………………………. 87
4.1 Introduction ………………………………………………………………… 87
4.2 Socio-Demographic Profile of Respondents …………………………………. 87
4.2.1 Gender Distribution of the respondents ………………………………. 87
4.2.2 Age Distribution of the Respondents …………………………………. 89
4.2.3 Marital Status of the Respondents ……………………………………. 92
4.2.4 Current Rank/Level of the Respondents in the Universities ……………. 94
4.2.5 Administrative Position of the Respondents in the Universities ………… 98
4.2.6 Work Experience of the Respondents in the Universities ……………….. 98
4.3 Descriptive Statistics ………………………………………………………...... 100
4.4 Hypotheses Testing ……………………………………………………………. 149
4.5 Modeling the Relationship between the Variables ……………………………. 163
4.6 Variation in Perception of Employee on Job Performance ……………………. 168
4.7 Responses to the Open-Ended Questions ……………………………………… 169
4.8 Interview Analyses …………………………………………………………….. 183
CHAPTER FIVE:
DICUSSIONS ……………………………………………………………………….. 190
5.1 Introduction …………………………………………………………………… 190
5.2 Quantitative Findings ………………………………………………………… 190
5.3 Qualitative Findings …………………………………………………………… 193
5.4 Theoretical Findings …………………………………………………………. 195
CHAPTER SIX:
CONCLUSIONS AND RECOMMENDATIONS …………………………………. 197
5.1 Introduction …………………………………………………………………… 197
5.2 Summary of Work ……………………………………………………………. 197
5.3 Conclusions ……………………………………………………………………. 200
5.4 Recommendations …………………………………………………………… 201
5.5 Contributions to Knowledge ………………………………………………… 202
6.6 Limitations of the Study ……………………………………………………… 204
5.6 Suggestions for Further Research ……………………………………………. 204
References ……………………………………………………………………. 206
Appendix ……………………………………………………………………… 221
xiii
List of Tables
Table 2.1: Strategic Human Resource Management Practices ………………………. 21
Table 2.2: The List of the Best Private Universities in Nigeria………………………. 54
Table 3.1: Population Distribution …………………………………………………… 76
Table 3.2: Statistical Information of the Sample Size ……………………………….. 77
Table 3.3: Sample Size and Questionnaire Administration ………………………….. 78
Table 3.4: Summary of Questionnaire Administration, Returned and Analyzed …… 79
Table 3.5: Summary Sample Frame ……………………………………………….. 80
Table 3.6: Result of the Reliability Analysis ………………………………………… 84
Table 4.1a: Gender Code of Universities Sampled …………………………………... 87
Table 4.1b: Gender: University Cross Tabulation …………………………………….. 88
Table 4.2a Recoded Age of Respondents: Cross tabulation …………………………. 89
Table 4.2b Recoded Age of Respondents: Cross tabulation …………………………. 90
Table 4.3a: Recoded Marital Status of the Respondents: Cross Tabulation ………….. 92
Table 4.3b: Recoded Marital Status of Respondents: Cross Tabulation ……………… 93
Table 4. 4a: Rank in the University ……………………………………………………. 94
Table 4.4b: Rank of the Respondents: Cross Tabulation …………………………….. 95
Table 4. 5: Administrative Position: University Crosstabulation ……………………. 98
Table 4. 6a: Work Experience: University Crosstabulation …………………………… 98
Table 4. 6b: Work Experience University Crosstabulation …………………………….. 99
Table 4.7: Descriptive Statistics for Human Resource Planning Strategy …………… 101
Table 4.8: Descriptive Statistics for University’s Brand Image …………………… 102
Table 4.9: Descriptive Statistics for Recruitment Strategy …………………………. 103
Table 4.10: Descriptive Statistics for University’s Research Image …………………. 104
Table 4.11: Employee Selection Strategy …………………………………………….. 105
Table 4.12: Corporate Reputation …………………………………………………….. 106
Table 4.13: Descriptive Statistics for Employee Retention Strategies ………………... 107
Table 4.14: Salary Package: University Crosstabulation ……………………............... 108
Table 4.15: Retirement Benefits: University Crosstabulation ……………………….. 109
Table 4.16: Allowances: University Crosstabulation ………………………………… 110
Table 4.17: Career Progression: University Crosstabulation ………………………… 111
Table 4.18: Training & Conference Support: University Crosstabulation …………… 112
Table 4.19: Research/ Publication Grants University Crosstabulation ……………… 113
Table 4.20: Regular Promotion: University Crosstabulation …………………………. 114
Table 4.21: Modern Teaching Facilities: University Crosstabulation ………………… 115
Table 4.22 Modern Research Aids: University Crosstabulation …………………….. 116
Table 4.23: Subsidized Staff Quarters: University Crosstabulation …………………... 117
Table 4.24 Job Security: University Crosstabulation …………………………………. 118
Table 4.25: University’s Image: University Crosstabulation …………………………. 119
Table 4.26: Conducive Environment: University Crosstabulation ……………………. 120
xiv
Table 4.27: Subsidized Medical Services: University Crosstabulation ……………….. 121
Table 4.28: Subsidized School Fees for Staff’s Children …………………………….. 122
Table 4.29: Loan Facilities: University Crosstabulation ……………………............... 123
Table 4.30: Work-life Balance: University Crosstabulation …………………………. 124
Table 4.31: Descriptive Statistics for University’s Corporate Identity ……………… 125
Table 4.32: The Average Number of Publications per Year ………………………… 126
Table 4.33: Number of Courses Taken Per Semester ……………………………….. 127
Table 4.34: Number of my Supervisee(s) Per Session ………………………………. 128
Table 4.35: Average Number of Committee(s) ……………………………………… 130
Table 4.36: Average Number of Papers Reviewed in a Session …………………….. 131
Table 4.37: Paired Samples Test of Perception of Afe Babalola University ………… 132
Table 4.38: Descriptive Paired Sample Statistics of Afe Babalola University ………. 133
Table 4.39: Paired Samples Test of Perception of Babcock University ……………… 134
Table 4.40: Descriptive Paired Sample Statistics of Babcock University ……………. 135
Table 4.41: Paired Samples Test of Perception of Bells University of Technology …. 136
Table 4.42: Descriptive Paired Sample Statistics of Bells University of Technology ... 137
Table 4.43: Paired Samples Test of Perception of Covenant University ……………… 139
Table 4.44: Descriptive Paired Sample Statistics of Covenant University …………… 140
Table 4.45: Paired Samples Test of Perception of Lead City University …………….. 141
Table 4.46: Descriptive Paired Sample Statistics of Lead City University …………… 142
Table 4.47: Paired Samples Test of Perception of Redeemer’s University …………… 143
Table 4.48: Descriptive Paired Sample Statistics of Redeemer’s University …………. 144
Table 4.49: Paired Samples from all Sampled Universities …………………………… 145
Table 4.50: Descriptive Paired Samples Statistics of All Universities Sampled ……… 146
Table 4.51: Mean Scores and Standard Deviations All Universities ………………….. 148
Table 4.52: The Relationships between Variables …………………………………….. 149
Table 4.53: Regression table of the Relationships between Variables ………………… 150
Table 4.54: Correlation table of the Relationships between Variables ………………… 151
Table 4:55 Hypothesis One ……………………………………………………………. 152
Table 4.56: Descriptive Statistics: Hypothesis One …………………………………… 153
Table 4:57 Hypothesis Two …………………………………………………………… 153
Table 4.58: Descriptive Statistics: Hypothesis Two ………………………………….. 154
Table 4.59: Hypothesis Three ………………………………………………………… 155
Table 4.60: Descriptive Statistics: Hypothesis Three ………………………………... 156
Table 4.61: Hypothesis Four ………………………………………………………… 156
Table 4.62: Descriptive Statistics, Hypothesis Four …………………………………. 157
Table 4.63: Hypothesis Five …………………………………………………………. 158
Table 4.64: Partial Correlation, Hypothesis Five ……………………………………. 159
Table 4.65: The Correlation Matrix of All Measures ………………………………… 160
Table 4.66: Summary of Hypotheses Results ………………………………………… 162
xv
Table 4.67: Fitness Index Measurement ……………………………………………… 164
Table 4.68: Regression Weights: …………………………………..…………………. 165
Table 4:69: Variation in Perception of Employee on Job Performance………………. 169
Table 4.70: Thematic Analysis-Recruitment and Selection Strategies Uni. 1 ………… 170
Table 4.71: Thematic Analysis of Retention Strategies, Uni.1………………….……. 171
Table 4.72: Thematic Analysis of Performance Improvement Uni.1 ………………….. 171
Table 4.73: Thematic Analysis-Recruitment and Selection Strategies Uni.2 ………….. 172
Table 4.74: Thematic Analysis of Retention Strategies Uni.2 …………………………. 172
Table 4.75: Thematic Analysis of Performance Improvement Uni.2………………….. 173
Table 4.76: Thematic Analysis-Recruitment and Selection Strategies Uni.3………….. 173
Table 4.77: Thematic Analysis of Retention Strategies Uni.3 …………………………. 174
Table 4.78: Thematic Analysis of Performance Improvement Uni.3………………….. 174
Table 4.79: Thematic Analysis-Recruitment and Selection Strategies Uni.4…………. 175
Table 4.80: Thematic Analysis of Retention Strategies Uni.4 ………………………… 176
Table 4.81: Thematic Analysis of Performance Improvement Uni.4………………….. 177
Table 4.82: Thematic Analysis-Recruitment and Selection StrategiesUni.5………….. 177
Table 4.83: Thematic Analysis of Retention Strategies Uni.5 ………………………… 178
Table 4.84: Thematic Analysis of Performance Improvement Uni.5…………………... 179
Table 4.85: Thematic Analysis-Recruitment and Selection Strategies Uni.6………….. 179
Table 4.86: Thematic Analysis of Retention Strategies Uni.6 …………………………. 180
Table 4.87: Thematic Analysis of Performance Improvement Uni.6………………… 181
Table 4.88: Summary of Findings from Hypotheses Formulated ……………………. 182
Table 4.89: Demographic Variables of the In-Depth Interview Participants…………. 183

xvi
List of Figures
Figure 1.1: Schematic Model of the Study …………………………………………… 10
Figure 2.1: A Linear Strategic HRM Model …………………………………………. 22
Figure 2.2: HR Planning Flow Chart ………………………………………………… 28
Figure 4.1: Salary Package of the Selected Universities ……………………………. 109
Figure 4.2: Retirement Benefits of the Selected Universities………………………… 110
Figure 4.3: Allowances of the Selected Universities ………………………………… 111
Figure 4.4: Career Progression of the Selected Universities………………………… 112
Figure 4.5: Training and Conference Support of the Selected Universities…………. 113
Figure 4.6: Research/Publication Grants of the Selected Universities………………. 114
Figure 4.7: Promotion of the Selected Universities…………………………………... 115
Figure 4.8: Teaching Facilities of the Selected Universities ………………………… 116
Figure 4.9: Research Aids of the Selected Universities………………………………. 117
Figure 4.10: Subsidized Staff Quarters of the Selected Universities ………………...... 118
Figure 4.11: Job Security of the Selected Universities………………………………… 119
Figure 4.12: Universities’ Image………………………………………………………. 120
Figure 4.13: Work Environment of the Selected Universities…………………………... 121
Figure 4.14: Subsidized Medical Services of the Selected Universities ….…………… 122
Figure 4.15: Subsidized School Fees …………………………………………………. 123
Figure 4.16: Loan Facilities of the Selected Universities ……………………………. 124
Figure 4.17: Work-life Balance of the Selected Universities ………………………… 125
Figure 4.18: Structural Equation Modeling Result ……….…………………………… 163
Figure 5.1: Proposed Model …………………………………………………………... 203

xvii
Abstract
Employee resourcing strategies are fundamental to the survival and sustainable development of
any organisation in the face of increasingly competitive business or academic environment. This
study examined the resultant effects and level of relationship that exist between constructs of
employee resourcing strategies, job performance and corporate image in some selected private
Universities in Southwest Nigeria. To accomplish the goals of the study, a total of 500 copies of
questionnaire were administered to the academic staff of the six (6) selected private Universities,
out of which four hundred and forty-three (443) were retrieved and analyzed. Stratified and simple
random sampling techniques were used to select the respondents for this study. Descriptive and
inferential statistics such as Pearson Product Moment Correlation Coefficient, Linear Regression,
Structural Equation Model (AMOS 22), Mean and Standard Deviation were used for the analyses.
The results show significant relationships between the employee resourcing strategies, job
performance and University' corporate image variables. The results also indicate that human
resource planning strategies have significant effects on brand image at F= 151.277, df= 442, sig.
at 0.000. Meanwhile, employee recruitment strategies have positive significant effects on research
image at F= 17.047, df= 442, sig. at 0.000. On the other hand, the relationship between employee
selection strategies and corporate reputation was positive at a correlation of 0.250, df= 442, sig. at
0.000 and sig. at 0.01 level (2-tailed). Similarly, the result shows that there is positive significant
relationship between employee retention strategies and corporate identity at a correlation of 0.325,
df= 442, sig. at 0.000 and significant at 0.01 level (2-tailed). It is therefore recommended that
University management should develop employee resourcing strategies that are linked with
Universities overall strategy to achieve their institutional goals.
Key words: Employee Resourcing, Retention, Corporate Image, Research Image, Strategy, Job
Performance.

1
CHAPTER ONE
INTRODUCTION
1.1 Background to the Study
The survival and sustainable growth of any organisation largely depends on the effective
and efficient management of her employees. The management of people at the workplace
is traceable to communal societies where duties were predominantly divided and assigned
among family groups. Tasks were allocated according to the individual skills, abilities, age,
gender and strength. Division of labour and specialisation were highly encouraged (Alan,
2007; Manafi & Subramaniam, 2015). As civilisation and technology evolved, personnel
management became concerned with the technological aspect of hiring, filing and firing;
this emerged in the 1920’s (Chukwunonso, 2013). However, personnel management failed
to give adequate attention to the significance of systematic relationships of employment
practices on overall organisational performance. Consequently, hum1an resource
management emerged and gained more prominence in 1981 with the introduction of a
Master of Business Administration (MBA) programme at Harvard Business School to train
personnel managers on the adoption of human resource management for effective
employment practices (Guest, 2011; Lamba & Choudhary, 2013). Therefore, in 21st century
organisations, human resource management centres on the employees in economic terms
as assets that must be productively managed for outstanding job performance.
Modern business is uniquely complex as a result of composite business environment,
globalisation, rapid technological advancement, among others. Sequel to the above,
strategic human resource management was introduced in reaction to the considerable
increase in competitive pressures (Ambrose & Philip, 2015; Clarke, 2013). Therefore,
competitive business environment requires that organisations engage employee resourcing
strategies such as manpower planning, attraction and selection of talents and skill retention
for organisational effectiveness and competitiveness. The integration of strategic human
resource management practices with the overall business strategy will promote
organisational performance and thereby enhance the corporate image of such organisation.
Meanwhile, strategic human resource management is concerned with the use of planning
for both human resource requirement and the process of capabilities development

2
(Armstrong & Taylor, 2014). Strategic human resource management includes resourcing
strategies, employee development strategies, reward strategies, employee relations, among
others. Employee resourcing strategies, an aspect of strategic human resource management
practices that ensures the availability of the right quantity and quality of staff required as
well as the selection and retention of employees who ‘fit’ the strategic requirements of the
organisation, are fundamental in the knowledge-based economy.
It is imperative to note that in the knowledge-based economy, skills and employee
development are the strength and backbone of sustainable economic development and
social well-being (OECD, 2012). However, University education plays a significant role in
human resource skills/knowledge development and the economic prosperity of any nation
(Dill & Van-Vught, 2010; Jain, 2015). Today, Universities are characterised by massive
expansion, wider participation and high rate of students’ enrolment because of public
demand for University education, thus, giving room for the emergence of new Universities.
Evidently, public Universities cannot meet the demand of people yearning for University
education. Hence, opportunities now exist for private providers to meet the growing
demand of University education and this has led to the rapid expansion and proliferation of
private Universities around the globe in general and Nigeria in particular (Adeyeye, 2009).
Universities in Nigeria are rising rapidly, but ironically, the number of academic staff is
not increasing proportionately (National Universities Commission (NUC), 2015).
Employee resourcing strategies however set out what the University intends to do about its
human resource planning, recruitment, selection, retention and how they should be
integrated with University strategies (Armstrong, 2010; 2014). Evidently, human resource
is a backbone and life-wire of any organisation that can be productively and strategically
engaged for excellent job performance that will culminate into positive corporate image.
Universities are expected to intensify efforts at strategic modality and corporate initiatives
to plan, recruit, select and retain valuable faculty and staff towards the actualisation of the
University’s overall strategic goal (Gberevbie, 2006; Kanyemba, Iwu & Allen-Ile, 2015;
Vander, Basson & Coetzee, 2009). Employee skills, knowledge and intellectualism are
competitive enablers and distinctive capabilities of a University. Attraction, selection and
retention of talented employees will culminate in sustainable job performance which will
invariably enhance corporate image of Universities (Minchington, 2010; Prinsloo, 2008).

3
The pivotal goal of any University, be it private or public, is to “develop the whole man
mentally, morally and physically, and thereby confer degrees on their products who are
found worthy in character and learning” (Idogho, 2011). In addition, they are expected to
provide leadership training, build strong economy and society, giving quality education
through comprehensive courses that will translate theory into practice (Adeyeye, 2009;
Aina, 2010; Gberevbie, 2006). However, this can only be achieved by attracting and
retaining formidable and competent faculty and staff. Nonetheless, for Universities to
achieve positive corporate image and competitive advantage, employee resourcing
strategies become imperative (Ahunaya & Osakwe, 2012; Kibui, Gachunga, &
Namusonge, 2014). It is essential to note that employee resourcing strategies are not
restricted to attracting ‘eggheads’, but continuous process of selection, placement,
induction and retention, among others (Venkateswaran, 2012). However, University
management must, therefore, have the capability to identify individuals with distinctive
competencies and experiences and as well as intensify efforts to retain them. This can be
achieved via competitive reward system, career development, job security, and other
motivating factors (Gberevbie, 2010).
Employee resourcing strategies are a significant and dynamic tool for Universities’ survival
and worthwhile achievements (Ngui, Elegwa, Gichuhi & Waititu, 2014). The sustainability
of any University largely depends on its ability to strategically employ and retain talented
employees that will formulate and implement strategies to foster excellent academic
performance thereby enhancing the organisational image (Armstrong, 2010; CIPD, 2012;
Dhar, 2015). According to Ogunyomi and Ojikutu (2014), employee resourcing strategies
become essential because University’s rapid growth and sustainable development often
times require different types of talent for success in a competitive academic environment.
Besides, as noted by Antonio and Luis (2015), “Universities are expected to respond to the
changes in their competitive environment by identifying the types of “talent” needed at
present and in the future to ensure consistent growth and sustainable development”. This
study becomes necessary because it concerns the integration of employee resourcing
strategies into the overall strategic goal which is non-negotiable for Universities’ growth
and sustainable corporate image.
4
1.2 Statement of the Research Problem
One of the most valuable assets of any University is its human resource. Attracting and
retaining skilled employees in a competitive academic environment is sine qua non for a
University’s survival and sustainable corporate image. Despite the importance placed on
employee resourcing strategies, research in this area in Nigeria requires more definite
attention. Studies such as Akhigbe (2013); Gberevbie (2008); Ogunyomi and Ojukutu
(2014); Satop (2014) among others have indicated the significance of employee resourcing
strategies and job performance, however, the relationship between employee resourcing
strategies and corporate image in Nigerian Universities should be accorded the necessary
attention.
The evolving competition in the Nigerian University system has called for the adoption of
strategic approach for effective and efficient teaching, research, innovation and community
impact, to compete favourably with their counterparts around the globe. Universities
ranking is one of the core factors responsible for Universities’ reputation and image. Sequel
to the various platforms of University ranking in the world, no Nigerian University has ever
ranked among the best 2000 Universities in the world in Times Higher Education-QS
Ranking; Webometrics Ranking, Academic Ranking of World Universities; Newsweek
Ranking among others (Tichaona, 2014). Obviously, several steps taken by government
and other stakeholders in the education sector through various interventions and
restructuring have not solved the problems. This apparently needs to be considered
holistically. Besides, the survival of the Universities in the competitive academic
environment requires availability of Senior Faculty with distinctive capabilities. Therefore,
strategic plan for immediate and future manpower requirements of the Universities is an
area that needs to be explored. The research problem addressed here therefore is the role
human resource planning strategies can play in enhancing job performance and promoting
University’s brand image.
The growing competition in the Nigerian University environment is evident in the
increasing number of new Universities approved by the National Universities Commission
(NUC). Thus, the need for systematic and rigorous recruitment strategies to attract and
retain skilled and experienced academic staff for quality teaching and research that will
proffer solutions to the socio-economic problems of the Nigerian society cannot be over
emphasised. As noted by NUC (2015), the number of Universities in Nigeria has increased,
yet these Universities are struggling and hunting for Senior Faculty. Nigeria has a total of

5
forty-six (46) Federal Universities, forty (40) State Universities and sixty-one (61) Private
Universities licensed to operate (NUC, 2015). However, Elegbe (2010) posits that Nigerian
Universities require about 60,000 academic staff to compete favourably with Universities
in the developed world. The shortage of qualified academic staff is greatly affecting tertiary
institutions in Nigeria to the extent that most of the newly established Universities are
struggling to get senior academic staff (Elegbe, 2010). Nevertheless, the few qualified staff
are overloaded with teaching, committee works, administrative works and other extra-
curricular activities in the University system. All these are likely to affect the research
output, teaching and project supervision, community service, among others. Attracting staff
with high level of talent, skills, competence and other distinctive capabilities have been a
major universal challenge to the University education system. In Nigeria, for example, both
public and private Universities are springing up frequently and both old and new
Universities are confronted with how to attract competent staff for outstanding teaching,
quality research output, innovation and entrepreneurial enhancement (Aina, 2010; Scullion
& Collings, 2010). Thus, the research problem to be addressed here is to find out the
resultant effects of recruitment and selection strategies on University’s research image.
The retention of Senior Academic Staff has been a global concern which affects both
developed and developing countries. In the United States, for instance, about 7.7%
Academic Staff left their institutions for another within a session (Yousaf, Imran, Sarwar
& Ranjha, 2010). In South Africa between 5-18% of their Academic Staff were likely to
leave for other Universities (Pienaar & Bester, 2008); it was predicted that there would be
serious crises in the 21st century in Australian Higher Educational Institutions with
estimated academic staff shortage of 20,000 if nothing is done to address it (Tettey, 2009).
As a result of the shortage of academic staff in the institutions of higher learning, coupled
with increasing number of Universities in Nigeria, and greater worldwide opportunities for
those with talents, there is serious competition in attracting and retaining talented Academic
Staff with doctoral degrees for better performance. Academic staff are moving from one
University to another. Startup, Gruneberg and Tapfield (1975) and Adeniji, Falola and
Salau (2014) opined that Senior Faculty hardly stay long in a University before moving to
another. Moreover, inability of any University to manage its human resource will expose
such Institutions to the competitive world, thereby losing best hands to competitors. Thus,
this study addressed retention strategies as it affects University’s efficiency in building
Universities’ image.

6
Sequel to the above, employee resourcing strategies and corporate image in institutions of
higher learning is an area that needs further exploration (Aryee, Walumbwa, Seidu &
Otaye, 2016; CIPD, 2012). Therefore, one of the reasons that informed this research
evaluate the influence of employee resourcing strategies on job performance and corporate
image in the institutions of higher learning in Nigeria.
1.3 Objectives of the Study
The main objective of this study examined the effect of employee resourcing strategies on
job performance and corporate image of Private Universities in Nigeria. However, the
specific objectives are to:
i. examine how human resource planning strategies can enhance job performance
and promote University’s brand image.
ii. determine whether employee recruitment strategies can promote or enhance
University’s research image.
iii. investigate how employee selection strategies can enhance or facilitate
University’s effectiveness in promoting its corporate reputations.
iv. identify the extent to which employee retention strategies can enhance
University’s efficiency in building Universities’ corporate identity.
v. evaluate the influence of job performance as a mediator of employee resourcing
strategies and corporate image.
1.4 Research Questions
This study offered solutions to the following research questions:
i. To what extent can human resource planning strategies affect job performance and
University’s brand image?
ii. In what ways would employee recruitment strategies affect University’s research
image via research output?
iii. To what extent can employee selection strategies enhance University’s
effectiveness and corporate reputation?
iv. In what ways can employee retention strategies affect University’s efficiency in
building Universities’ corporate identity?
v. How does job performance mediate the relationship between employee resourcing
strategies and corporate image?

7
1.5 Research Hypotheses
The following hypotheses were tested to provide answers to the research questions. The
hypotheses are therefore presented in a null form:
Hypothesis 1
HO1: Human resource planning strategies have no significant effect on performance in
promoting University’s brand image.
Hypothesis 2
HO2: Employee recruitment strategies have no significant effect on University’s research
image
Hypothesis 3
HO3: There is no significant relationship between employee selection strategies and
University’s effectiveness in promoting corporate reputation.
Hypothesis 4
HO4: There is no significant relationship between retention strategies and University’s
efficiency in building corporate identity
Hypothesis 5
Ho5: Job performance does not mediate the relationship between employee resourcing
strategies and corporate image
1.6 Significance of the Study
The emphasis of this research is on employee resourcing strategies and corporate image in
Nigerian institutions of higher learning with emphasis on private universities in Southwest,
Nigeria. It advances knowledge and understanding of how variables of employee
resourcing strategies will affect job performance and corporate image in Nigerian Private
Universities. The study also intends to assist institutions of higher learning, particularly in
Nigeria, in formulating strategies for manpower planning to attract, select and retain faculty
with distinctive capabilities. The key objective examined how employee resourcing
strategies affect job performance and corporate image in Nigerian Universities. This study
is significant in the sense that:
8
i. it will enable the management of Universities and other higher educational
institutions to improve on employee resourcing using a strategic approach that
will enhance job performance in building Universities’ corporate image.
ii. it will help the management of the private Universities to review, formulate and
implement employee resourcing policies that will enhance job performance and
image of Nigerian Universities.
iii. it will serve as a basis for human resource practitioners to have insight into the
roles employee resourcing strategies play in building corporate image.
iv. academics and researchers will be provided a platform upon which further
investigation can be carried out on the subject matter.
1.7 Scope of the Study
The study focuses on employee resourcing strategies and corporate image that might arise
as a result of improved job performance. The research was carried out in six (6) selected
private Universities in Southwest, Nigeria. The motive for the choice of private Universities
is because of the level of competition among them when it comes to attracting good local/
international faculty, staff and students and as well building corporate image. Meanwhile,
attracting good students becomes more competitive because very few persons can afford
private University education for their children and wards.
The choice of Southwest for the study is because twenty-eight (28) private Universities
representing 46% out of sixty-one private Universities in Nigeria are located within the
region, while the remaining 33 private Universities representing 54% spread across other
five (5) geo-political zones in Nigeria. Sequel to the number of private Universities in
Southwest Nigeria, the level of competition is extremely high as each University is
developing strategies that will give them competitive advantage over others. The study
concentrated on finding out the effects of employee resourcing strategies on academic job
performance and corporate image in Nigerian private Universities. It examined the best
approach to plan, attract, select and retain highly talented faculty and staff for competitive
advantage. Recommendations were made on how to improve employee resourcing
strategies in order to promote greater performance and enhance the corporate image of
Nigerian private Universities.
9
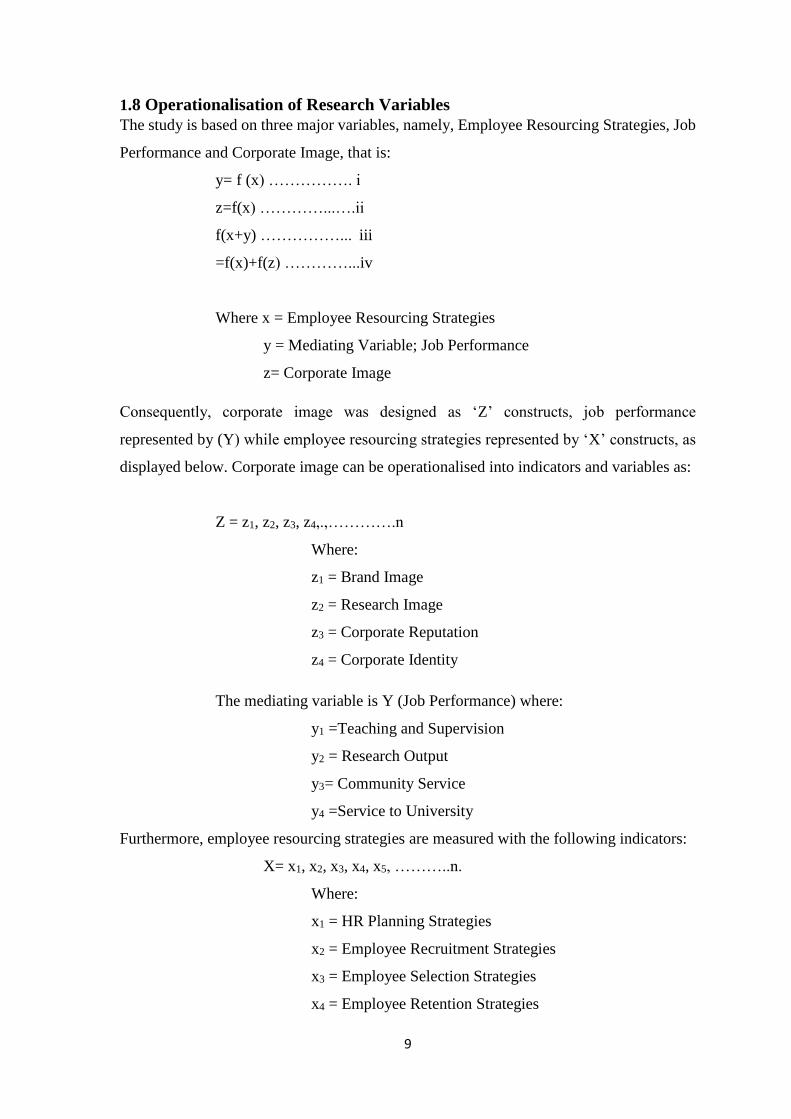
1.8 Operationalisation of Research Variables
The study is based on three major variables, namely, Employee Resourcing Strategies, Job
Performance and Corporate Image, that is:
y= f (x) ……………. i
z=f(x) …………...….ii
f(x+y) ……………... iii
=f(x)+f(z) …………...iv
Where x = Employee Resourcing Strategies
y = Mediating Variable; Job Performance
z= Corporate Image
Consequently, corporate image was designed as ‘Z’ constructs, job performance
represented by (Y) while employee resourcing strategies represented by ‘X’ constructs, as
displayed below. Corporate image can be operationalised into indicators and variables as:
Z = z1, z2, z3, z4,.,………….n
Where:
z1 = Brand Image
z2 = Research Image
z3 = Corporate Reputation
z4 = Corporate Identity
The mediating variable is Y (Job Performance) where:
y1 =Teaching and Supervision
y2 = Research Output
y3= Community Service
y4 =Service to University
Furthermore, employee resourcing strategies are measured with the following indicators:
X= x1, x2, x3, x4, x5, ………..n.
Where:
x1 = HR Planning Strategies
x2 = Employee Recruitment Strategies
x3 = Employee Selection Strategies
x4 = Employee Retention Strategies

10
The various indicators of employee resourcing strategies, job performance and corporate
image were adopted from the works of the following scholars: Armstrong and Taylor,
(2014); Ngui, et al (2014); Ogunyomi, et al (2014) and Katua, et al (2014).
Model Specifications
Model Element 1: Explained the relationship between strategic HR planning strategies (job
analysis, gap analysis, and manpower utilisation) and brand image (services and products).
Model Element 2: Explained how employee recruitment strategies impact on job
performance and research image. Model Element 3: analysed the effects of employee
selection strategies on job performance and corporate reputation. Model Element 4:
examined how retention strategies (reward system, promotion, recognition, awards,
retirement benefits, fairness, conducive working condition of the Universities) enhances
Universities’ and corporate identity while Model 5 explore the influence of job
performance (teaching and supervision, research output, community service and service to
the University) as a mediator of employee resourcing strategies and corporate image. All
these are depicted in figure 1.1 below:
Figure 1.1: Schematic Model of the Study
Source: Adapted from Armstrong and Taylor (2014); Ogunyomi et al. (2014)

11
The model presented in figure 1.1 integrates all the features of employee resourcing
strategies and corporate image outlined in the operationalisation of concept. The model
represents the five hypotheses to be tested in this study. Hypothesis five (H5) examines how
job performance mediates the relationship between employee resourcing strategies and
corporate image. Hypothesis four (H4) explains the relationship between retention
strategies and corporate identity of the selected private Universities. Hypothesis three (H3)
represents possible positive relationship between employee selection strategies and
corporate reputation in Nigerian Universities. Hypothesis two (H2) depicts the resultant
effect of employee recruitment strategies on optimal job performance that will promote
research image; while Hypothesis one (H1) represents the effect of HR planning strategies
on University’s brand image.
1.10 Structure of the Work
The thesis was divided into six (6) chapters. The first chapter focused on the background
of the study, statement of the research problem, objectives of the study, research questions
hypotheses, significant of the study, scope of the study, operationalisation of the research
topic and definition of basic terms among others. Chapter two addressed review of relevant
and recent literature with the theoretical framework of the constructs. The third chapter
focused on sequential steps for data gathering, research design, population, sample size,
sampling techniques, sampling frame, research instrument, and the techniques to adopt in
analysing the data. Besides, chapter four focused on data presentations and analyses,
chapter five was dedicated for the discussions of the findings while chapter six focused on
conclusions and recommendations of the research findings.
1.11 Definition of Terms
The following operational terms were used in the study.
Competitiveness: This is a situation in which organisations are trying to be successful and
gain sustainable advantage over others. Besides, it is the capability and performance of an
organisation, industry or nation to have an edge over one another.
Competent: This refers to the necessary capabilities to get things done successfully.
12
Competency: Well-defined behaviours that offer a structured guide enabling the
identification, evaluation and development of the individual employees’ conduct.
“Competency represents the language of performance. It can articulate both the expected
outcomes from an employee’s efforts and ways in which these activities are carried out”.
Corporate Image: It is a composite psychological impression that continually changes
with the firm's circumstances, media coverage, performance, pronouncements. It is the
perception and impression that the general public has about an institution. It is also an
internal collective state of mind that underlies corporate communications efforts to present
itself to others.
Corporate Reputation: Reputation is an asset that describes the quality of products and
services, ability to innovate, value as long-term investment, ability to attract, develop, retain
talent. It is the general perception of what the organisation stands for and what aspects and
expectations are associated by individuals when benefiting from the organisation’s
products and services.
Employee Development Strategy: “The process of changing an organisation, its
employees, its stakeholders, and groups of people within it, using planned and unplanned
learning, to achieve and maintain a competitive advantage for the organisation”
Human Resource: This is the “personnel of a business or organisation, regarded as a
significant asset in terms of skills and abilities. It also means a person who works for
another in return for financial or other compensation.
Human Resource Management: It is “a distinctive approach to employment management
which seeks to achieve competitive advantage through the strategic deployment of highly
committed and capable workforce, using an integrated array of culture, structural and
personnel techniques.
Human Resource Retention: It is a strategic tool through which highly skilled employees
are encouraged to stay in the organisation for a reasonable period.
Performance: This is an accomplishment of a given assignment measured against
predetermined known standards of accurateness, completeness, cost, and speed.
Performance is also defined as the effort or ability of an employee towards the attainment
of both quality and quantity output.
13
Recruitment: This is a process of finding and engaging skilled employees from within or
outside the organisation for a job opening, in a timely and cost effective manner. It is also
a process of generating a pool of applicants by reaching out to the right audience suitable
to fill vacancies identified. In addition, recruitment can be described as a set of activities
that seek to attract right applicants with needed competencies, skills and capabilities to
apply for jobs in order to fill shortages identified during human resource planning exercise.
Research: It is a “scientific investigation into and study of materials and sources in order
to establish facts and reach new conclusions”.
Retention: This is the process of ensuring that the organisation entices, develops, motivates
and preserves talented people it needs. Besides, retention of employees is a process through
which sufficient numbers of competent employees are encouraged to stay in an organisation
to ensure that organisational effectiveness is not jeopardised.
Selection: This is the process of interviewing and evaluating candidates for a specific job
and selecting an individual for employment based on certain criteria. It is a process of
gathering information about the candidates for a position identified and thereby using the
information to choose the most qualified candidates that are likely to make appreciable
contribution to the goals and objectives of the organisation. The essence of the selection
process is to choose applicants who are likely to make meaningful and productive
contributions to the organisation.
Strategy: It refers to a determination of the basic long-term goals of an organisation. This
includes the adoption of courses of action and the allocation of resources necessary for
carrying out the stated goals. In other words, strategy is a process or activity geared towards
leading, repositioning, deploying resource for securing competitive advantage and
achieving success in the prevailing competitive business environment.
University: It is an institution of higher learning providing facilities for teaching and
research and authorised to grant academic degrees.

14
CHAPTER TWO
REVIEW OF LITERATURE
2.1 Introduction
The complexity and increased competition in the 21st century organisations have led to the
need for strategic approach to the management of people in the world of work. Employee
resourcing strategies are fundamental to the survival and sustainable development of any
organisation in the face of increasingly competitive business and academic environments.
The institutions of higher learning are saddled with the responsibility of developing and
raising the new generation of leaders who are adequately equipped both mentally and
morally. This can only be achieved with the availability of competent and skilled academic
staff that are committed to teaching, research and innovation. The level of performance of
the institutions determines the impression that the general public hold about them.
However, this chapter reviews the subject of employee resourcing strategies as a critical
aspect of strategic human resource management and how it can influence job performance
and corporate image. The chapter begins by providing a conceptual framework in the areas
of employee resourcing strategies, job performance and corporate image. The chapter
discusses various components of employee resourcing strategies (i.e. human resource
planning, recruitment, selection and retention strategies); job performance in the University
environment (i.e. teaching and supervision, research output, community service and service
to the University) and corporate image (i.e. brand image, research image, corporate
reputation and corporate identity). The chapter ends with a discussion of theoretical
frameworks, empirical framework and gaps in the literature.
2.2 Conceptual Framework
2.2.1 The Concept of Strategy
The term strategy was coined from the Greek word “strategia” which refer to generalship
in the act of War, and it has its root in the military literature which includes the formulation
of goals and a set of action plans for accomplishment (Armstrong, 2010). Besides, strategy
is also the art or science of employing the means of production toward accomplishing long-
term goals that have a significant impact on organisation’s effectiveness. Over the years,
scholars have developed many different concepts of strategy. According to Waiganjo,
Mukulu and Kahiri (2012), strategy is a process or activity geared towards leading,
repositioning, deploying resource for the purpose of securing competitive advantage and

15
achieving success in the prevailing competitive business environment. As noted by
Armstrong (2010), strategy is about deciding where to go and the means of getting there.
Similarly, strategy is a declaration of intention and is more concerned with the long-term
goal and how the goals should be accomplished (Armstrong & Taylor, 2014). Strategy is
also a systematic guides and purposeful action that creates value and delivers the intended
result (Chan & Mak, 2007).
Strategy emphasises on the predetermined basic long term objectives of an organisation
and the adoption of the courses of action coupled with the allocation of necessary resources
that will help in the implementation of the stated objectives (Abdullah, 2014). Similarly,
strategy is a fundamental plan, scope and direction of an organisation over a long period of
time, matching resources to its changing environment to meet stakeholders expected result
(Johnson, Whittington, Scholes, Angwin & Regne, 2015). It is therefore a systematic
approach for improving organisational effectiveness and a dynamic integration of
organisational work patterns with the work environment for the purpose of achieving
optimum performance.
Meanwhile, according to Armstrong (2010), strategy is based on competitive advantage,
distinctive capability and strategic fit. The concept of competitive advantage was coined
by Porter (1985) with the aim of organisations creating value for its customers. In this sense,
organisations are seen to strategically select an area in which they have strength with the
possibility of making a distinctive landmark achievement toward improving the chosen
area for building an excellent corporate image. Organisations must, therefore, consider
innovation, quality and cost leadership as a strategic means to gain competitive advantage
and promote organisational image. However, distinctive capability is a core competence
and uniqueness of an organisation that cannot be easily replicated or imitated by
competitors. Human resource, technology, innovation, financial resource, brand, corporate
image, quality and others; serve as key capability that place an organisation above others
in a competitive environment. On the other hand, strategic fit stresses the need for
distinctive capability and organisation resources to match with the opportunities available
in the business or academic environment for effective job performance, and building a
sustainable corporate image.

16
It is pertinent to note that the formulation of strategy is an inevitable process to develop a
sense of direction; as a logical step-by-step affair that provides an absolute guide to the
organisation’s long-term strategic goals. Moreover, strategic formulation provides logical
framework for strategic decision making process, monitoring and implementation of
strategies that will position the organisation for a competitive advantage (Armstrong, 2009;
Johnson, Whittington, Scholes, Angwin & Regner, 2015). Therefore, the systematic
approach to formulating strategy consists of the following steps:
i. A clear definition of the mission.
ii. Setting up strategic objectives.
iii. Evaluating internal and external environments to ascertain strengths,
weaknesses, opportunities and threats.
iv. Analysing current strategies to establish their importance in the light of
internal and external appraisal.
v. Defining the distinctive capabilities of the organisation to concentrate on
that are likely to promote competitive advantage.
vi. Examining the vital strategic problems evolving from the previous analysis.
vii. Evaluating functional strategies that will help in achieving organisational
goals and sustainable development.
viii. Formulating unified strategic plans for executing strategies.
ix. Implementing the strategies.
x. Proper monitoring and implementation of present strategies and
development of new strategies if need be.
2.2.2 The Concept of Strategic Human Resource Management
The indispensable asset of an excellent job performance and corporate image of any
organisation is its human resource. Organisations, therefore, seek to understand how human
resource can be effectively and productively managed for enhanced performance that
would promote sustainable corporate image and competitive advantage (Andersson,
Asplund, Bystrom, & Ekman, 2014; Batt & Banerjee, 2012). Meanwhile, human resource
at the early roots was involved in the administrative aspects of hiring, filling, firing, and
payroll administration (Chen, Lawler & Bae, 2005). Besides, emphasis was on the
development of union relationships, employee satisfaction, and policy compliance. The era
of strategic human resource management, on the other hand, is a distinct approach

17
employed by management for enhanced job performance and achieving good corporate
image (Jackson & Seo, 2010; Guest, 2011).
Ugheoke, Isa and Mohdnoor (2015) described strategic human resource management to
include the organisation’s work systems and its models of employment. “strategic human
resource management is based on strategy-focused, decision-focused, content-focused and
implementation-focused approach that ensures human resources are employed in a manner
conducive to the attainment of organisational goals” (Armstrong & Taylor, 2014:73).
Meanwhile, Chuang, and Liao (2010) in their own views described strategic human
resource management as a pattern of prearranged human resource actions and
responsibilities intended towards the actualisation of organisational goals.
Strategic human resource management stresses the integration and alignment of human
resource management practices with the organisational strategic goals. It also emphasis the
involvement of human resource functions which includes, strategic approach to employee
recruitment, selection, retention, compensation, performance appraisal as well as the value
that is added to organisational effectiveness (Batt & Banerjee, 2012; Harvey, Williams &
Probert, 2013). In other words, “it is the integration of various functions with the business
plan. It is important not only to identify human resource competencies in alignment with
the business needs and develop selection and development practices to secure those
competencies, but also to evolve and implement a performance evaluation plan that links
the performance of employees to the strategic goals of the organisation” (Keupp, Palmie &
Gassmann, 2012).
Strategic human resource management gives attention to the pattern of planned employees’
placements and other activities that will enhance employees’ performance towards the
actualisation of organisational strategic goals and objectives (Chuang & Liao, 2010). It is
also an integration of all human resource functions in alliance with organisational all-
encompassing goals and responsiveness to the competitive global business environment
(Brewster, Brookes, Croucher & Wood, 2014). Similarly, strategic human resource
management practices are concerned with the long-term goals to ensure a strategic fit
between overall organisational strategic goals and human resource practice strategies
(Maina & Kwasira, 2015). It is important at this juncture to mention that strategic human
resource management cannot be overemphasised because it encompasses all activities that
18
are implemented by an organisation in alignment with the strategic needs of business
(Ermolina, Chechina & Sultanov, 2016). However, strategic human resource management
focuses on an elucidation of the strategic roles that human resource can play in enhancing
organisational effectiveness.
The integration of human resource strategy into business strategy and strategic
maximisation of human resource provides the basis for enabling the human resource
function to support the implementation and strategic plans of the organisation to achieve a
competitive advantage (Abel, 2008; Jackson & Seo, 2010). Similarly, strategic human
resource management involves the use of all-embracing methods that integrate human
resource strategies with the business strategies vertically and horizontally with one another
(Armstrong, 2010). Therefore, human resource strategies delineate intents and plans of the
overall organisational concerns which include but are not limited to, talent management,
resourcing, learning and development, reward and employee relations. Besides, strategic
human resource management focuses on the use of planning; a coherent design and
management of personnel; workforce strategy; and matching human resource management
policies to some explicit business strategies in achieving excellent job performance
(Armstrong, 2010).
Similarly, strategic human resource management practices are fundamental for the
enrichment of knowledge, skills, ability and motivation of employees which will invariably
impact on job performance. (Karikari, Boateng & Ocansey, 2015; Neal, West & Paterson,
2005). The emphasis of strategic human resource management is on the implementation of
strategic change through strategic human resource management practices to ensure that the
organisation is positioned to compete effectively in the future. It facilitates the attraction
and retention of competent staff that meets the requirements of the organisational
competitive strategy.
2.2.3 The Emergence of Strategic Human Resource Management (SHRM)
Many scholars and practitioners of human resource management over the years have
explicitly advocated for a strategic concept of human resource management. As a result of
this, the field of strategic human resources management (SHRM) has witnessed a
remarkable dominance over the decades by academic researchers and human resource
practitioners. The parallel growth in both the research literature and interest among human

19
resource practitioners is a remarkable departure from the more common experience, where
human resource managers are not interested in scholarly ideas and development. It is
worthy to note that strategic human resource management intellectual seed was planted at
the beginning of the twentieth century by some progressive scholars in the field of labour
economics, and industrial relations and human resource management (Kauffman, 2012).
Meanwhile, Kase and Batistic, (2012) posited that strategic human resource management
emerged several decades and the earliest widely cited contributions to the field were
published in the 1980s. Notable amongst them was Walker (1980) who offered a logical
explanation of how human resource planning could serve as a tool for ensuring that human
resource management policies and practices could be aligned with an organisation’s overall
strategy. Meanwhile, Devanna, Fombrun, and Tichy (1981); Beer, Spector, Lawrence,
Mills, and Walton (1984) among other scholars offered remarkable contributions to the
emergence of strategic human resource management. The goal of strategic human resource
management in the 80s was to integrate human resource management practices into the
strategic management of the organisation. Therefore, to ensure proper integration of human
resource management practices in alignment with the organisation overall strategic plans,
Harvard Business School designed a curriculum for new human resource management
course for MBA the purpose of which was to integrate insights from their wide-range
managerial skills and competencies.
The integration of human resource management practices such as manpower planning,
talent management, recruitment, selection, rewards management, training, retention,
performance appraisal and others into the overall organisation strategic goals will boost a
favourable employee behavioural outcome which is referred to as internal or horizontal fit
(Becker, Huselid & Beatty, 2009; Fajana, 2009). Meanwhile, the strategic prerequisite is to
give human resource management its suitable place in overall enterprise management, so
that other management decisions take account of human resource implications. It is
expected that human resource should be effectively managed in such a way that matches
outcomes to the objectives that drive corporate and business strategy (Fajana, Owoyemi,
Elegbede & Gbajumo-Sheriff 2011; Schuler, Jackson & Tarique, 2011).
It must also be noted that human resource management practices are a subset of broader
organisation strategic goals, therefore, specific human resource plans precede the corporate
20
and business level plans (Schuler, et al. 2001). The main tasks of human resource are to
manage employee assignments and opportunities; manage employee competencies;
manage employee behaviour and employee motivation. Human resource management
depends largely on the direction of corporate strategy and is a ‘downstream’ activity labels
‘strategic alignment’ (Li, Zhang, Yang & Li, 2015). Therefore, the potential influence
between corporate strategy and human resource management strategy cannot be
overemphasised because organisations must as a matter of necessity develop strategies that
will appropriately calibrate human resource policies, structure, leadership behaviours,
culture, values and management processes to achieve a competitive advantage fit.
2.2.4 Strategic Human Resource Management Practices
Strategic human resource practice referred to as a pattern of planned human resource
deployments and activities intended to empower organisations to achieve their strategic
objectives (Wright, Gardner, Moynihan & Allen, 2005). However, the critical goal of
strategic human resource practice is to see to the effective performance that will culminate
into outstanding actualisation of the organisational goals and objectives that will enhance
corporate image. Armstrong (2010) opines that strategic human resource practice
emphasises the formulation of human resource plans and strategies in alignment with the
overall organisational strategies and objectives thereby responding to the ever changing
and competitive business or academic environment.
The strategic human resource management practices include but are not limited to human
resource planning, talent management, human resource development, employee retention,
performance appraisal, compensation management, employee relations (Garavan &
Carbery, 2012). However, the specific human resource strategies set out the intention of
the organisation in specific human resource management practices as depicted in Table 2.I
below:

21
Table 2.1: Strategic Human Resource Management Practices
S/N Specific HR Strategies Explanation
1 Employee Resourcing Strategic efforts are being harnessed towards attracting
and retaining high-quality people.
2 Continuous Improvement Providing a platform for focused, dedicated and
continuous incremental innovation that will be sustained
over a period.
3 Knowledge Management Knowledge is power, therefore the ability to create and,
acquire knowledge as well as capturing, sharing and
using knowledge to enhance learning and performance
remains inevitable tool that the organisations can
strategically utilise for the enhancement of employees’
skills and competencies
4 Talent Management This has to do with the intention of the organisation on
how to attract, develop, deploy and retain talents i.e.
winning the war for talent in a competitive environment
and knowledge economy.
5 Learning and Developing Enhancing employee intellectual capacity cannot be
overemphasised. Therefore, “providing an environment
in which employees are encouraged to learn and develop
is not debatable”
6 Reward Management This has to do with describing what the “organisation
intend to do in the future to develop and implement
competitive reward system and processes that will
enhance business goals and meeting the needs of
stakeholders”. Meanwhile, a competitive reward system
is a driven force behind employees’ level of commitment,
loyalty, and motivation toward achieving the
organisational strategic goals
7 Employee Relations Employee relations are strategic tool for an enhanced job
performance. They define how the organisation manages
its relationships with the relevant stakeholders in the
organisation. They point to what needs to be done and
what needs to be changed as regards the relationships
between employees and their trade unions.
Source: Armstrong (2010)

22
2.2.5 A Linear Strategic HRM Model
A linear strategic human resource management depicts an attitude of mind that expresses
direct way of doing things. Figure 2.1 shows the form of linear strategic human resource
strategies model as prescribed by Armstrong (2010).
Figure 2.1: Linear Strategic HRM Model
Source: Armstrong (2010)
2.2.6 Employee Resourcing Strategies
Employee resourcing is fundamental to the survival and sustainable development of any
organisation in the face of increasingly competitive business or academic environment
(Katua et al, 2014; Ogunyomi & Ojikutu, 2014). Employee resourcing strategy takes into
consideration the organisation’s decision concerning where to find, select and retain
employees with distinctive capabilities and a coherent approach to the management of
people in the world of work (Ngui, Elegwa & Gichunga, 2014). Employee resourcing
strategies play a significant role in providing people and skills required to meet the needs
that will support the business strategy of any organisation (Armstrong & Taylor, 2014).
They involve a series of techniques and approaches used by employers of labour in re-
sourcing organisations in a way that the strategic goals of the organisation will be actualised
(Karikari, Boateng & Ocansey, 2015). Resourcing strategies require that organisations use
several approaches of choosing the right talent that reflects the philosophy and core values
of their organisations (Armstrong, 2014) and as well produce an appropriate number of
suitable candidates within reasonable cost constraints (Ngui et al., 2014).

23
Employee resourcing strategies take into consideration the flexibility of working practices
which requires multi-skilled workers and sophisticated assessment as well as strategic
development programme. The purpose of this is to reallocate employees or task to give
room for existing staff to take more work or attract new employees for the external context.
The need for employee resourcing strategies toward ensuring organisational survival and
sustainability in this global competitive economic environment cannot be overemphasised.
Hughes and Rog, (2011) and Morton (2005) posited that employee resourcing strategies
are essential not only to attract and retain needed talented employees but also to
economically engage them for optimal performance. However, investment on long-term
strategies to attract, select and retain management skills coupled with a well-planned
strategy can assist organisations to overcome challenges and enhance business success
(Chuai, Preece & Iles, 2013). It becomes inevitable for human resource practitioners or
those entrusted with the responsibility for resourcing to recognise employees’ distinctive
capabilities as source of competitive advantage and thereby recruit and retain people with
tacit skills, knowledge and experience. It is equally important to engage employees with
special skills and experiences who seem to be the best fit in the organisation and are willing
to identify with their organisation through their assiduous dedication and commitment to
the goal of the organisation.
Employee resourcing, is a human resource management term used to explain in details the
general activities regarding recruitment, retention and productive engagement of
employees in an organisation. Strategic resourcing, on the other hand, ensures that the
organisation attracts, obtains and retains competent employees needed and productively
engage them toward the actualisation of the strategic goals of the organisation (Armstrong,
et al., 2014). It is imperative to note here that employee resourcing strategies play a key
role in the strategic human resource management process, which is very crucial for the
integration of human resources to the overall strategic goals of the organisation that helps
in ensuring the optimal utilisation of employees (Karikari, Boateng, & Ocansey, 2015).
Expectedly, the pivotal goal of employee resourcing strategies is to ensure that
organisations gain competitive advantage by productively engaging employees with
distinctive capabilities. What gives an organisation an edge over others is a wider and
deeper range of skills of an organisation’s workforce. Employee resourcing strategies
emphasise more on attracting people with good attitudes, behaviours and right disposition
to work and are most likely to conform to management believes.

24
The idea behind the strategic human resource management approach to resourcing is
because people are one of the most indispensable assets who are employed to manipulate
other resources and implement the strategic agenda of the organisation (Armstrong, et al.,
2014). Employee resourcing strategies therefore are not just about recruitment and
selection, it concerns with acquiring and retaining employees with distinctive skills require
by the organisation to have a competitive advantage over their rivals. As noted by
Armstrong, et al. (2014) and Karikari, Boateng, and Ocansey (2015), employee resourcing
therefore involves.
• human resource planning,
• recruitment,
• selection,
• placement and
• retention strategies
2.2.7: Human Resource Planning (HRP)
Human resource planning is a process through which organisations anticipate future
manpower requirements, thereby evaluating the employee requisite, for future need and
attempts to provide sufficient employee required to perform toward the realisation of
organisational goals and objectives (Satope, 2014; Song, Zhao, Arend & Im, 2015).
However, strategic human resource planning starts with a business review and optimal
utilisation of organisation’s existing human resource and their potential to meet an
organisation’s current and future needs. As noted by Maina and Kwasira (2015) human
resource planning involves organisation’s determination to have the right persons with
prerequisite skills and capabilities to carry out any tasks that may be assigned in helping
the organisation achieve its objectives in record time. In a related development, Gilbart,
DeWinne and Sels (2015) affirm that human resource planning is a process which
anticipated future manpower requirement and ensures sufficient pool of candidates with
right skills and experience needed are made available.
2.2.8: Process of Human Resource Planning
The various steps involve in carrying out Human Resource Planning is as follows:
i. Analysis of Organisational Plans and Objectives
ii. Demand Forecast

25
iii. Supply Forecast
iv. Estimating Manpower Gaps
v. Matching Demand and Supply
i. Analysis of Organisational Plans and Objectives
The objective of any organisation is fundamental to its growth and survival. However,
Human Resource planning is subsumed under the overall plan of any organisation. This
planning revolves around human resource, technology advancement, service,
marketing, finance, anticipated development and diversification. At this stage, the
anticipated organisation’s structure and job design should be made clear.
ii. Forecasting Demand for Human Resources
Human Resource planning ordinarily starts with the estimation of the quality and
quantity of employees required per time at different levels of the organisation.
However, main steps involved in this process include:
a. Identify present and potential employee needs of the organisation.
b. Attract and recruit the required quantity and quality of persons.
c. Select suitable candidate form the available people.
d. Properly place selected candidates into various positions for which they are
qualified.
e. Provide orientation to the selected candidate about the organisation and what
they expect from the candidates.
f. Promote or transfer current staff to next position based on the need of the
organisation.
g. Retrench some employees if their services are no longer required.
iii. Forecasting Supply of Human Resources
Another critical aspect of human resources planning is the deployment of people into
different units/departments, taken into cognisance, the work-load and requirements of
the units/departments needs in the future. The deployment of human resource to
different departments requires carefulness when considering appointments, promotions
and transfers. However, available manpower should be productively engaged through
a coordinated plans and synergy.
26
iv. Estimating Manpower Gaps
Comparing demand and supply forecasts of human resource will go a long way in
identifying requirements gaps. A proper comparison will reveal either an organisation
is over-staffed or under-staffed. When it is estimated that the organisation is
understaffed, it suggests the number of candidates to be recruited while if it is over-
staffed, it implies that redundant employees are to be redeployed or get their
appointment terminated. Evidently, gaps may occur in terms of experience, knowledge
and skills. The organisation can train employees with qualification deficiency while
those with higher skills may be given more challenging jobs.
v. Matching Demand and Supply
Matching demand and supply is another crucial aspect of human resource planning.
This involves assessment of demand for and supply of employees and as well matching
the estimated shortages and surpluses in terms of quality and quantity. The moment
human resource gaps are identified; adequate plans are prepared to proffer solution to
the identified gaps. Oftentimes, strategies for meeting surplus manpower are
redeployment, retrenchment, voluntary retirement among others. The strategy for
deficit usually are in the informs of recruitment and selection, transfer, promotion
among others.
2.2.9: Human Resource Planning Strategies
Therefore, human resource planning strategies focus on forecasting future labour market
needs. They involve an understanding of the current human resource, an enquiry into future
needs, and the analysis of the type and number of talent require to meet the organisational
goals and objectives (Yadav & Dabhade, 2014). Meanwhile, strategic human resource
planning ensures that the right numbers of employees are working at the right place at the
right time and this requires forecasting of human resource requirements using appropriate
analytical tools and techniques (Harlay, 2015). Ishrat and Habib (2012) posited that this
will help organisations to:
i. Recognise and manage possible problems, risks as well as to minimise crisis.
ii. Reduce the employee turnover rate, absenteeism and structural changes
iii. Develop employees’ skills.
iv. Optimise the use all available resources.

27
Strategic human resource planning is expected to align with the organisation’s strategic
plan and business needs and as well put into consideration the widest range of potential of
all talented employees irrespective of their position within the organisation. It is imperative
for organisations to develop suitable plans to attract the best pool of candidates. Efforts
must be taken to nurture and retain current competent employees (Prinsloo, 2008). It is
imperative to state that organisations must determine their corporate requirements for
growth and sustainability. To achieve this, management must intensify effort to find out
challenges that the organisation is facing now, determine performance lag, find out the
hindrances to attaining positive outcome through talent audits and this will help
management to pinpoint where new skills are needed to improve performance (Ogunyomi
& Bruning, 2015).
As observed by Armstrong, et al (2014) proper implementation of strategic human resource
comprises of four strategic steps. These are as follows:
i. Thorough review of individual and team talent in the organisation with the sole
aim of identifying high performers.
ii. Inventory of the internal talent pool against the organisation’s valued
competencies.
iii. Mapping of skills, and capabilities against the strategic goals and success factors
of high performing employees in the organisation. Besides, effort must be
intensified to identify and investigate the gap between high performers and the
larger team.
iv. Formulation of a strategy to close the "talent" gap either through skill attraction
and engagement, training and development or retention strategies.
Meanwhile, Armstrong et al, (2014) also stated that implementing a strategic human
resource planning process prepares management and stakeholders to:
i. be proactive and reactive to the demand for crucial employees needed by the
organisation for enhance performance that will culminate in corporate image.
ii. identify employees’ exceptional skills and qualities that can be developed
iii. provide better stability between cross-functional teams with recognised explicit
skills, ability and competencies.
iv. improve strategic resourcing process by assessing candidates against valued
competencies distinct to the company.
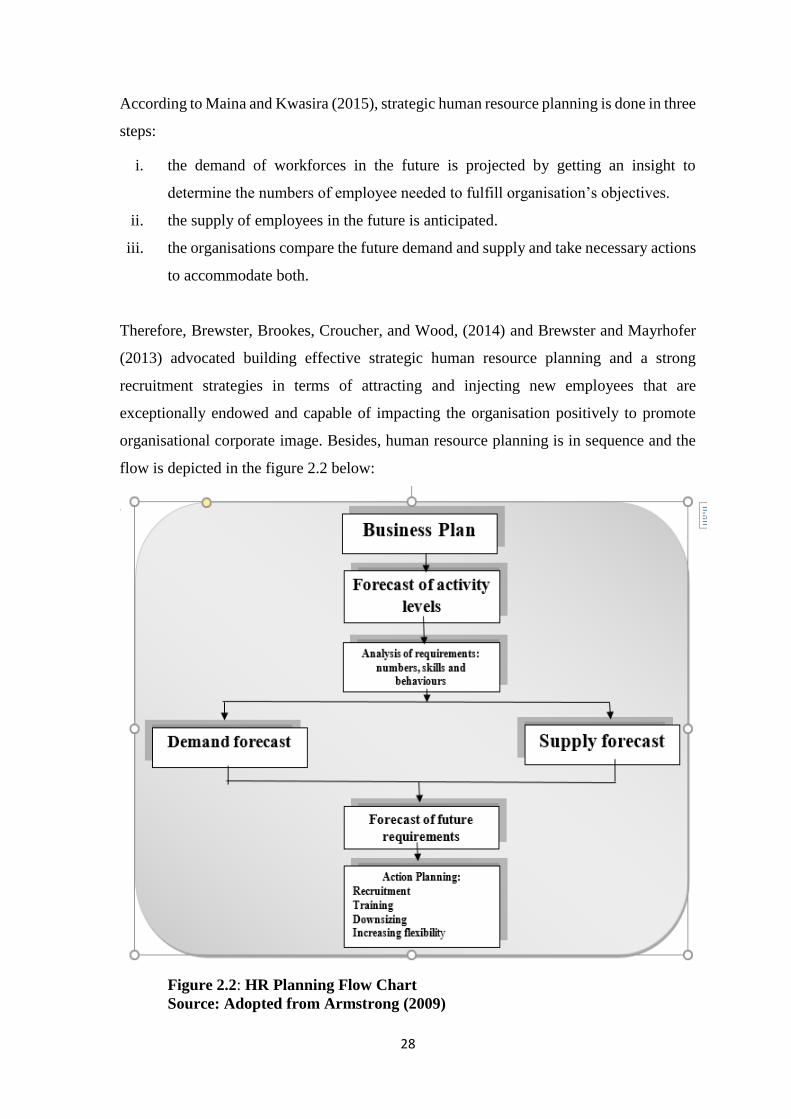
28
According to Maina and Kwasira (2015), strategic human resource planning is done in three
steps:
i. the demand of workforces in the future is projected by getting an insight to
determine the numbers of employee needed to fulfill organisation’s objectives.
ii. the supply of employees in the future is anticipated.
iii. the organisations compare the future demand and supply and take necessary actions
to accommodate both.
Therefore, Brewster, Brookes, Croucher, and Wood, (2014) and Brewster and Mayrhofer
(2013) advocated building effective strategic human resource planning and a strong
recruitment strategies in terms of attracting and injecting new employees that are
exceptionally endowed and capable of impacting the organisation positively to promote
organisational corporate image. Besides, human resource planning is in sequence and the
flow is depicted in the figure 2.2 below:
Figure 2.2: HR Planning Flow Chart
Source: Adopted from Armstrong (2009)

29
2.2.10 Recruitment Strategies
Recruitment is one of the most visible roles that the human resource department undertakes
the purpose of which is to generate a pool of talented candidates to fill identified positions
(Adeniji & Osibanjo, 2012; Gberevbie, 2010; Karemu, Gikera & Josee, 2014). Attraction
and recruitment of competent candidates with distinctive capabilities is fundamental to the
organisational survival and sustainability in the competitive business or academic
environment (Tong, 2015). However, the various recruitment strategies developed is to
ensure that organisations attract candidates with distinctive competences to fill vacant
positions either with the use of internal or external sources. Besides, recruitment strategies
provide a platform upon which human resource managers go about filling identified
vacancies, whether from within the organisation or from the outside. Furthermore,
recruitment strategy is a process by which an organisation locates and attracts individuals
with special and exceptional skills to fill job vacancies identified during human resource
planning. It is expected that talent for present and future need of the organisations is
estimated and suitable arrangements are made to strategically select and appoint capacities
and competencies that will drive the organisation’s goals and objectives. As noted by
Johnson and Scholes (2009), “recruitment strategies are understood as the process of
searching for and obtaining applicants for the jobs, from among whom the right people can
be selected”.
Similarly, recruitment strategy is the process of attracting highly skilled and talented
individuals for employment. This begins with sorting of new recruits and ends when the
applications are processed and submitted (Abdul, 2015). At this level, the available
employees needed for immediate and future needs of the organisations are given wide
publicity, and suitable candidates submit applications to generate a pool of eligible
candidates for possible selections. In recruitment, the information of prospective candidates
is collected and collated via different sources which includes but not limited to newspaper
advertisements, employment exchanges, internal promotion among others (Akinusi, 2008;
Ekwoaba, Ikeije & Ndubisi, 2015).
However, there are different ways through which right candidates can be attracted and
recruited. These include attraction of brilliant University graduates, engagement of
employment agents, conference attendance where linkages, collaborations and
relationships can be established for possible attraction of colleagues from other places
(Faborode, 2016; Okebukola, 2010). It is equally helpful to keep an eye on web

30
employment seekers as well as professional websites and journals. In a formal system,
recruitment efforts involve the use of mass media either print or electronic media and other
employment agencies to find suitable candidates that can be employed to fill identified
vacancies. It also involves recruitment taps on social networks and recommendations from
former or current employees. Therefore, curriculum vitae and various forms of tests which
include but not limited to psychometric tests and telephone interviews and structured
interviews, unstructured interview, impromptu interview, stress interview are usually used
to select appropriate candidates (Kepha, Mukulu & Waititu, 2014). Meanwhile, candidates
are likely to consider the organisation’s remuneration packages such as salaries, bonuses,
fringe benefits and other non-monetary benefits before taking decision to work in any
organisation. Compensation packages have been described as the strategic ways of
attracting and drawing skilled and experienced employees into organisations (Vikram &
Sayeeduzzafar, 2014).
2.2.11 The Aims of Recruitment Strategies
As observed by Adeniji and Osibanjo (2012), the purpose of recruitment is to ensure the
availability of the quality and quantity of the employees required to satisfy the personnel
needs of organisations. Therefore, the specific purposes of recruitment exercise are to:
i. analyse the existing and future requirements of the organisation vis-à-vis the
human resource planning and job analysis activities.
ii. obtain and increase the pool of suitable job applicants with minimum cost.
iii. reduce the number of unqualified candidates.
iv. prevent or reduce applicants that are likely to leave the organisation shortly after
they might have been recruited.
v. ensure that organisations meet the legal obligations as regards the structure and
composition of the workforce.
vi. identify and prepare potential job applicants who will be suitable candidates.
vii. enhance organisational efficiency always.
viii. determine the efficacy recruitment techniques.
2.2.12 Recruitment Process
Recruitment is a process through which candidates with distinctive capabilities who are
likely to be successful after a rigorous screening process are identified and attracted for

31
possible engagement by the organisation (Adeniji & Osibanjo, 2012). Meanwhile this
process contains five interconnected stages which are as follows:
i. Recruitment Planning
ii. Strategic Development
iii. Searching
iv. Screening
v. Evaluation and Control
• Recruitment Planning: This encompasses the conversion of projected or possible
job vacancies and fact regarding the nature of the jobs into set of specific objectives,
that stipulate the numbers and categories of candidates to be contacted (Adeniji &
Osibanjo, 2012). It is inevitable for organisations to come up with strategic plans
on how to attract more competent applicants that would be hired after a rigorous
selection processes. It is inevitable to note that each time a recruitment exercise is
contemplated, the estimation of the number of qualified applicants required to fill
identified vacancies should be determined. Meanwhile the recruitment planning
requires detailed documentation of the qualifications and experiences expected
which most of the time are available through individual job description and job
specification.
• Strategic Development: Organisations must as a matter of necessity decide
whether to search and hire employees with distinctive capabilities or to invest in
training and education programmes to upgrade already existing employees.
• Searching: As soon as recruitment plans are finalised, the search process begins.
It must be noted that actual recruitment will only take place after the line managers
have confirmed and verified that vacancies exit or will exist.
• Screening: Screening of applicants can be regarded as a process whereby all the
applications received are subjected to rigorous scrutiny for proper short-listing. All
applications received in response to any job advertisements both internally or
externally should be screened and scrutinised to give room for only eligible
applicants to be contacted for interview. The aim of screening is to get rid of all
under-and over-qualified candidates at the early stage. This screening should be
done with care so that potentially competent and talented employees are not rejected
without justification (Becker, Huselid & Beatty, 2009).

32
• Evaluation and control: This becomes inevitable because of the considerable costs
that are likely to be incurred during recruitment exercise. The costs to be incurred
include but are not limited to the following:
✓ Salaries/allowances for those who will conduct the recruitment exercise
✓ Time that will be spent on preparing job analysis, job description, job
specifications, advertisements and others.
✓ The cost of advertisements in the national newspapers and other platforms.
2.2.13 Staff Recruitment Sources in Organisations
1. Internal Recruitment
Internal recruitment resources allow the organisation to fill an estimated vacancy from the
pool of existing applicants, most often, identified vacant positions are posted on the
organisation’s website, newsletters, notice board for any interested employee. It is
imperative to state here that interested employees would also go through similar process in
the manner of external candidates. All the documents required for the position are expected
to be submitted and thereafter qualified candidates would be shortlisted and interview
would be scheduled with the relevant department (Abdul, 2015). It is important to note that
internal sources of recruitment vary from one organisation to the other as observed or
acknowledged by Adeniji and Osibanjo (2012). Notable among them are:
• Promotions and Transfers: This involves movement of employees either from
one level to the other or to another department. This is usually done based on gap
analysis. Human resource information system and other employees’ records help to
discover those who are qualified for promotion or transfer. When one is promoted,
it builds employees’ morale, encourages competent employees who are ambitious
and when vacancies occur, it would be relatively cheaper than going into the labour
market. Those chosen internally are acquainted with the organisation consequently
save the time of induction and orientation. Similarly, transfers might become
necessary when there is need to provide employees with a broad-based and versatile
view of the organisation.

33
• Employee Referrals: This involves a process through which current employees
recommend family members and friends who are suitable for identified vacancies
in their organisation and as well encourage them to apply. This process affords
many qualified persons to be reached within a short period to fill identified
vacancies at a very low cost. This method will help organisations to attract good,
experienced and competent staff based on the confidence and character of the
referrals.
• Former Employees: This is another technique that organisations can explore to
inject experienced candidates into their workforce. It is a process through which
former employees who are retired are willing to work as contract staff and those
who resigned are ready to come back to the organisation. In doing this,
organisations ensure that only those who have good performance records and are
still economically active, are the ones considered for any identified position either
on contract or permanent basis. It is also important to note that this method helps
organisations to save time and resources for recruitment, induction and orientation
programmes.
• Retirements: Occasionally, management may experience some difficulty in
finding suitable candidates for replacement of someone who had retired after
meritorious service in the organisation. Under these circumstances, management
may decide to engage such a person on a contract provided the person is still active
and productive.
• Internal advertisement: This involves an internal notification of identified
vacancies with job specifications clearly stated out for the benefit of the existing
employees or their acquaintances.
2. External Recruitment
It is important to note that if there is nobody to fill identified vacancies internally, it
becomes necessary for the organisation to seek qualified candidates from the labour market.
An organisation can decide to use any of the listed channels to fill vacant positions:
34
i. Professional or Trade Associations
ii. Advertisements
iii. Employment Exchanges
iv. Campus Recruitments
v. Walk-ins, Write-ins and Talk-ins
vi. Consultants
vii. Head Hunters
viii. Radio, Television and Internet
2.2.14 Selection Strategies
The selection process precedes recruitment process. It is a process by which an organisation
identifies the most qualified candidate from the pool of applicants who best meet
predetermined selection criteria to fill a position (Abome, 2013; Adeniji et al, 2012).
Meanwhile, to know the most qualified candidates, it is imperative to know the task that
will be given to the candidates employed and know their distinctive capabilities. It helps
the employer to measure and know the characteristics of the prospects in the selection of
those that are most suitable to fit into the system. Ryan and Ployhart (2014) posits that
selection is a platform of separating candidates in order to distinguish those that are likely
to succeed in the selection process. It is also a process that intensely evaluates candidates
in order to foresee their future performance on the job. The selection process involves
sequential steps which must be strictly followed to avoid selection error. The steps are as
follows:
a. Preliminary interview
b. Selection test
c. Interview
d. Reference check
e. Selection Decision
f. Physical or medical examination
g. Job offer
h. Contract of employment
i. Concluding selection process
j. Evaluation of selection programme
35
Preliminary interview has to do with a situation whereby the applications submitted by job
seekers are subjected to thorough scrutiny to eliminate unwanted and unqualified
candidates. This process enables the human resource specialists or practitioners to remove
or discard unqualified applicants based on the information provided on their curriculum
vitae and application forms submitted for the selection test (Ryan et al, 2014).
Selection test is to ensure that job applicants who are successful in the screening and the
preliminary interview stage will be called upon for the written tests to determine their
competencies (Gberevbie, 2006). It is important to note that different types of tests are
administered, depending on the job to determine the candidate’s ability, aptitude and
personality.
Generally, the following types of tests are usually taken:
i. Ability tests: - These help in determining how well a candidate can function and
perform in any given responsibility related to the job. Organisations also ensure that
applicants are tested on what they claim to know through achievement test to
determine to what extent they know it.
ii. Aptitude test: - This measure individuals’ capacity to learn on a job if adequate
trainings are provided. Meanwhile, it also helps in determining applicants’ potential
to learn. Aptitude test is appropriate when a candidate has had little or no
prerequisite skills advised job opening. A typical example of this kind of test is the
general management aptitude tests (GMAT) which oftentimes use to test the
applicants’ ability or fitness to do a few specialised activities. Meanwhile, the
applicants’ intellectual capabilities can be discovered in the process. Forms of
aptitude test include but are not limited to mental or intelligence tests, mechanical
aptitude tests, psychomotor or skills tests, intelligence test, interest test, personality
test, projective test, general knowledge test, perception test and medical test.
The reliability, validity, objectivity and standardisation of the test are essential. For
example, a candidate who have a particular score after taken a test should be able to have
same or close scores any day same test is being repeated, this is because a person’s
intelligence is generally a stable characteristic. Therefore, if intelligence test is
administered, a candidate who scores a total in a month, when such test is repeated at any
other time such candidate should score the same or something very close to the initial total.
36
However, any test which produces wide variations in results is not appropriate and reliable
for selection process. In a related development, validity helps in predicting whether a
candidate will be successful if eventually employed. A validated test can be useful in
distinguishing between prospective employees that are likely to perform well and those
who will not. It must be noted that the validated test only increases the possibility of
success, it does not guarantee 100% accurate in predicting job success. The validation of a
test can be done taken different approaches which include but not limited to concurrent
validity, predictive validity and synthetic validity.
Objectivity ensures adequate interpretation. It is objective if more than one person can
interpret the outcome of the same test and arrive at the same conclusion(s). If otherwise,
the test assessors’ subjective opinion may render the test unreliable. A test can be said to
be standardised when conducted under a standard condition to a large group of people who
are representatives of persons for whom it intended. Having done this, the interview should
follow to select candidates among the shortlisted applicants.
Interview is formal, in-depth conversation and excellent selection device conducted to
appraise an applicant’s suitability. Oftentimes, it involves face-to-face interaction between
the candidates and interviewers. It refers to as oral examination to determine the strengths
of the applicants. Interview is used to obtain additional information from the applicants,
afford the applicants the opportunity to know more about the organisation’s policies job,
products; helps in building the firm’s image among the applicants.
According to Abome (2013), “interviews are of different types. They include the following
among others: informal interview, formal interview, non-directive interview, depth
interview, stress interview, group interview, panel interview, sequential interview,
structures interview, unstructured interview, mixed interview, impromptu interviews,
telephone interview”.
As part of selection procedure, employers often request the prospective candidates to
provide names, addresses, and telephone numbers of referees for the purpose of verifying
additional and confidential information about the candidate. It must be noted that
confidential and background information about the applicants is inevitable to be sure of
their personality, attitudes and disposition. Evidently, references are not checked until an
37
applicant is most likely to be considered for the job. Employers most of the time prefer
previous employers, public figures, clergy men, professors and others to act as references.
It is believed that the referees are already aware of the applicant’s performance and
dispositions. The notable challenge with this reference is the likelihood of the referees who
are likely to be the former employers, clergy, friends, colleagues to over-rate the applicant’s
performance for sending the person out of their organisation most especially when such a
person is no more contributing to the organisation or is in dear need of a job. It is generally
believed that the information gotten from the referees are less reliable, thus, hardly
influence selection decisions, because of the following reasons identified by Adeniji et al
(2012):
i. The candidate will only approach those who will give good report about them.
ii. Former employers may write favourable report about the candidate to get rid of
the person simply because he/she is no longer adding value to the organisation
iii. Oftentimes, people are not ready to divulge the truth about a candidate. All these
will help in making good selection decision
Making selection decision is more often than none requires caution as it remains the most
critical aspect of selection process. This process involves making final decision from the
pool of individuals who passed the tests, interviews, and reference checks. Meanwhile,
management views are usually considered in the final selection before the physical or
medical text
Physical/Mental Examination or fitness of candidates is done before the job offer is made.
A job offer largely depends on the confirmation of the candidates’ physical and mental
fitness. The outcomes of the fitness test are properly recorded and kept in the individual
file. The objective behind physical tests includes but is not limited to the following:
i. finding out if the candidate carries any infectious disease.
ii. determining the applicant physically fit to do the work.
iii. preventing candidates who are challenged with their health from job that
could be unfavorable to their health issues.
iv. helping to prevent avoidable compensation claims.
The next stage in the selection process is job offer to the candidates who are successful in
the fitness test. This is usually done via an appointment letter containing effective date of
appointment, the remuneration packages, and other terms and condition of service.

38
Meanwhile, it is unprofessional to reject applicants without informing them of their non-
selection.
At this stage, once the job offer and acceptance is made, necessary documents must be
performed by the employer and the applicants. The documents include attestation form
which must be duly signed by the candidates. Meanwhile, contract of employment is also
very important at this stage. The following information are required in a contract of
employment, this varies from one organisation to another and one level of job to another.
The following are the checklist that are common in the headings:
i. Job title
ii. Job description
iii. Date of employment.
iv. Remuneration and other allowances
v. Hours of work
vi. Leave arrangements
vii. Length of notice due to and from employee.
viii. Grievances/conflict management procedure
ix. Disciplinary measures
x. Work rules
xi. Procedure for termination of employment.
xii. Provision for union membership etc.
Contrary to popular view, the selection process should not end without informing the
unsuccessful candidates the reason(s) they were not selected. Most of the time, the reason
could be because of candidate’s profile and organisation’s requirement mismatch. The
whole essence of the selection process is to employ candidates with special skills and
distinctive capabilities. It is very critical to organisational effectiveness because the caliber
of employees hired will determine the overall performance of the organisation. Therefore,
if selection process is properly done, it would help the organisation to achieve its stated
goals and objectives. Meanwhile, the evaluation of the effectiveness of a selection
programme is periodic audit by the human resource department.
39
2.2.15 Four Approaches to Strategic Selection
Adeniji et al. (2012) and Alan (2007) observed that employee selection strategies can be
grouped into the following:
i. Ethnocentric Selection: This is an approach where every decision as regard
staff selection are usually made at the headquarters. However, the strategic
business units or subsidiaries have limited autonomy while employees from the
headquarters occupy key jobs. It is also important to note that residents from the
parent country dominate the organisations.
ii. Polycentric Selection: In this approach, subsidiaries are treated as a separate
national entity with considerable local autonomy to control investment
decisions and financial targets. Meanwhile, local citizens manage subsidiaries
while employees from the headquarters or parent country still hold key jobs.
iii. Regiocentric Selection: This approach emphasises that employees are
managed on a regional basis. Regional managers are given autonomy to use
their discretion in making rightful decisions in the interest of their organisations.
Movement of staff however, is restricted to specific geographical regions.
iv. Geocentric Staffing: Here, business strategy is incorporated carefully on a
global basis. Employee training, development, compensation and promotion are
based on capability regardless of the nationality. Though, the composition of
broad and top management team is thoroughly international.
2.2.16 Employee Retention Strategies
In contemporary dynamic, uncertain and highly competitive global business and academic
environments, organisations are facing serious challenges on how to retain good and
talented employees (Schuler et al., 2011; Tarique & Schuler, 2010). Therefore,
organisations need to put into consideration the competitive strategy to retain highly
competitive employees. It has been discovered that one of the best strategies to retain highly
skilled employees is to ensure that they are productively engaged, appropriately recognised
and rewarded accordingly (Bechet, 2008). Retention of the employees with distinctive
competencies should be given priorities in all organisations to attain outstanding success
(Hauff, Alewell & Hansen, 2014).
40
Employee intellectual capacity building and talent are ever more critical to organisational
strategic success (Gilbart, DeWinne & Sels, 2015). Besides, for many organisations, the
ability to retain highly competent employees is therefore essential for the future survival,
rapid growth and sustainable development. Consequently, employees’ retention strategies
are now viewed “as a tool to strengthen organisational capability through individual
development, performance enhancement, career development and succession planning”
(Iles et al, 2007). Therefore, employee retention strategies aim at ensuring that highly
skilled employees are encourage and compel to remain the organisation for a good number
of years. The reason is because employee turnover is harmful to an organisation's
productivity while the costs of recruitment are extremely high. To this end, Naris and
Ukpere (2010) contend that the best way to have retention is by building a responsive
working environment and friendly policies where the employees enjoy each other’s
company and identify with the organisation. It must be noted that an organisation where
there is harmonious relationship between the actors, employees tend to enjoy their work
and stay longer. (Pedro & Robert, 2012).
Meanwhile, Vaiman, Scullion and Collings (2012) believed that extrinsic and intrinsic
incentives are major underlining factors that will facilitate employee retention. Extrinsic
incentives are form of financial rewards given to employees to take care of physiological
needs. On the other hand, intrinsic incentives are non-financial rewards given to employees
to satisfy or fulfill their psychological needs. Furthermore, Mendez and Stander (2011:12)
further emphasise that “an organisation needs to invest in employee retention for enhanced
job performance and sustainable corporate image”. They noted that a good and competitive
compensation package is important in retaining employees with distinctive capabilities
through attractive and competitive benefits packages that will motivate them to stay in the
organisation (Lockwood, 2006).
There are several factors that contribute to talent retention which include but are not limited
to compensation, work environment, career development and intrinsic rewards (Whelan,
Collings & Donnellan, 2010). Organisations’ strategies in the pursuit of talent retention
differ depending on the peculiarity of such organisation (Zhou & Volkwin, 2004; Hughes
& Rog, 2011). Some organisations have their own specific strategy some of which are
highlighted below:
41
i. Stimulation of employees’ passion;
ii. Building of employees’ trust and respect;
iii. Conduct performance assessments;
iv. Retention of employees by performance targets; and
v. Building of employees’ satisfaction and motivation,
vi. Building of competitive compensation packages and retirement benefits.
Gberevbie (2010) posits that employee retention is fundamental for the actualisation of
organisational goals. This means that the strategy put in place by the management of any
organisation to retain proficient employees in its workforce determines the degree to which
the overall strategic goals of the organisation will be attained. Gberevbie (2010) and
Karemu, Gikera and Josee (2014) noted the following as the general strategies for employee
retention in organisation:
i. Incentives and reward systems
ii. Job security
iii. Regular training
iv. Career progression
v. Regular monthly salary
vi. Regular promotion
vii. Overtime pay
viii. Study leave with pay
ix. Car and housing loans
x. Special duty allowance
xi. Provision of free health care services
xii. Staff award and commendation
xiii. End of year bonus
xiv. Observation of public holidays
xv. Gratuity and pension
xvi. Scholarship scheme for children of employees
xvii. Safety and welfare services
xviii. Conducive working environment

42
Meanwhile, in the University environment or other institution of higher learning, the
retention strategies adopted by management varies from one school to the other depending
on the peculiarity of each institution. As noted by Tichaona (2014), these retention
strategies are:
i. Competitive salary and allowances
ii. Conference support
iii. Research grants
iv. Career progression
v. Regular promotion
vi. Modern teaching facilities
vii. Research aids
viii. Publication support
ix. Staff welfare
x. Job security
xi. Recognition of outstanding performance and so on.
2.2.17 The Importance of Employee Retention
An organisation is expected to develop a culture or approach that will always put the
employees’ first in other to ensure retention of highly skilled employees. Besides, employee
retention strategies is fundamental to increase customer satisfaction, increase sales and
promote good employment relationships among workers. It is also imperative to note that
engaging employees with distinctive capabilities helps in the achievement of the
organisation’s vision and aspiration. Therefore, retention of these professionals with special
skills and technical know-how can enhance organisational performance (Tichaona, 2014).
Kavoo-Linge and Kiruri (2013) opined that employee retention is indispensable to
sustainable organisational development and business success. Employees are behind the
successful drive of an organisation’s success. Therefore, employees’ dedication to work
will determine the level of the organisation’s success and how they will represent the
company’s interest outside the world of work. Therefore, managers should be very
considerate and put in place strategic plans to make the working conditions conducive
enough for their employees. It is expected that managers should focus on how to keep
employees in the organisation and also make them feel secured. Besides, it is a known fact
43
that one of the most common challenges that organisations face today is the attraction and
retention of the right employees with special capability and skills. Cheese (2010) suggested
four ways to overcome retention challenges. His points have been enumerated as follows:
i. Making plans and analysing the talent gaps in the organisation.
ii. Taking a considerable step to get right set of people that can fill the vacant post.
iii. Taking appropriate steps to develop talent depends on the goals and objectives
of the organisation.
iv. Making appropriate plans to integrate organisational culture and effective
management, this can be done based on three competing strategies:
a. Analysing current and future leaders needed to be retained for high
commitment and performance.
b. Identifying effective and high performance needed to be engaged and
developed.
c. Evaluating marginal and poor performance needed to be managed (Smith
2008).
2.2.18 Corporate Image in Institution of Higher Learning
The image of any organisation including educational sector influences customer’s
perceptions or reactions to specific corporate actions, products or services. Corporate image
is considered to be a crucial effect in the overall evaluation of any organisation which
creates responsibilities and as well proves difficult to imitate or replicate (Kandampully &
Hu, 2007; Sarstedt, Wilczynski & Melewar, 2012). It is the perception and impressions that
the general public has about an institution (Fill, 2006). In his own view, Bromley (2003)
described corporate image “as internal collective state of mind that underlies its corporate
communications efforts to present itself to others”. It reflects an organisation’s unique
identity and its corporate brand (Argenti & Druckenmiller, 2004). Meanwhile, Weiwei
(2007) posited that corporate image is the views, notions, beliefs and impressions that the
public has toward an institution of higher learning. This has to do with the institution’s
name, physical working environment, institution’s variety of products or services offer,
institutional practice, philosophy, and the impression of quality communicated by persons
interacting with the institution’s clients’ (Sarstedt, et al, 2012). Meanwhile, the
management of various institutions of higher learning have responsibilities to manage
employees, customers and ethical standards, and at the same time protect the interest of

44
their investors. The sustainability of the institutions corporate image therefore, depends
largely on the strong and supportive relationships with their clients (students, parents),
investors/partners, community, government, among others (Chun, 2005). Besides,
corporate image can be earned based on the interaction of product reputation, customer
relations, employees’ role, ethical reputation, among others (Chun, 2005). According to
Adeniji, Osibanjo and Abiodun (2012), organisations strive to develop and manage their
image for many reasons which are as follows:
i. development of the corporate competitive advantage that will culminate into
higher profitability.
ii. development of favourable and harmonious relationship with the host
community.
iii. the ability to influence investors, financial institutions and other
stakeholders.
iv. promotion of corporate goodwill for the organisation.
v. influencing client loyalty.
Therefore, it is important for institutions of higher learning to recognise the perception,
expectations and desires of all the various interest groups in order to project good image
for the world to see. This will invariably not only encourage shareholders to invest in an
institution, it will also help in attracting competent staff and retention of customers among
others (Robert, Dowling & Graham, 2007).
2.2.19 Corporate Image in Universities
In this contemporary society, competition in the institution of higher learning is growing
terrifically. Consequently, competition for good home-based and international students,
teaching and research faculty, and new sources of funding have become very fundamental
for the institutions’ survival and rapid development (Bloemer & Ruyter, 2008). Expectedly,
Universities and other institutions of higher learning should be independent institutions
saddled with the responsibility of creating and disseminating autonomous knowledge
(Jarvis, 2001). However, in the midst of competitiveness in the education sector,
Universities and other higher education institutions have moved toward a business-like,
competitive model of operation and embraced as service that could be marketed beyond
national borders (Bunzel, 2007). In this context, Universities with strong distinctive image
45
are likely to survive the increasing competition in the education sector. Therefore, building
corporate image in the higher education sector becomes imperative (Bloemer et al. 2008).
Meanwhile, scholars have explained corporate image as the net result of the interface of all
capabilities, impressions, philosophies and feelings that the public have about an
organisation (Worcester, 1997).
Universities are competing with one another for enrolment of best students to their
institution as well as recruiting and retaining highly competent faculty members (Smaiziene
& Jucevicius, 2013). While some Universities are old, new Universities are being licensed
to operate to meet the yearning of many youth seeking University education. Meanwhile
some Universities have a well-developed infrastructures and faculty members with
distinctive competences, while others are putting on strategies to develop their
infrastructure and intensifying effort to attract and retain the desired faculty members that
can be productively engaged for teaching, research and innovations which invariably
promote the image of the Universities (Moogan 2010). Obviously, the rivalry is very
intense among the Universities simply because they all go to the same source to attract
good students from national and international platforms for enrollment (Weiwei, 2007). It
is imperative to note that corporate image in Universities is to make it easier for students,
parents and guardians to identify and remember quality of service of a particular University.
Therefore, building corporate image has become more pertinent in promoting an
institution’s reputation, students’ patronage (home-based and international students) as
well as generating additional revenue for the institution. Besides, many Universities have
come up with strategic plans in various ways to attract prospective faculty through vigorous
marketing initiatives and public relations strategies in promoting their institutions and the
various programmes offer by the institution.
Meanwhile, Universities consider principles of corporate image to assure their position vis-
à-vis their competitors (Herr, 2001). Moore (2012) admits that the ability of the patrons to
differentiate an institution depends on recognition of the core attributes and the category in
which they operate in addition to what makes them different from others. However, for
Universities and other institutions of higher learning, the quality of teaching, research,
reputation, collaborations, linkages, innovation and community impact among other factors
represent their corporate image (Rosenthal, 2003). The way the University image is
projected will provide an opportunity for the prospective clients to identify and distinguish

46
between schools. Building an excellent corporate image in Universities has become a
strategic tool for attracting students’ patronage because it provides students with a sense of
pride and belonging to an institution with history of excellence (Gathungu & Karoki, 2010;
Moore, 2012). As far as higher institutions are concerned, the decision of students and
faculty members on which institution to apply depends on the reputation and image of such
University. However, the University brand, academic properties, serene academic
environment, ranking position, academic programmes, public and social relations, sports
facilities, well equipped library, conducive learning environment and other infrastructural
facilities are determinant factors in creating good impressions which will invariably
influence the decision-making process of the public (Paden & Stell, 2006).
2.2.20 University’s Brand Image
Universities in their quest to attract good students and faculty members spend so much in
trying to burnish their corporate image and enhance their position in various academic
rankings such as Times Higher Education-QS Ranking, Academic Ranking of World
Universities, Webometrics Ranking, Professional Ranking of World Universities,
Newsweek Ranking among others. Besides, services offered by a University determines
the impression, whether positive or negative that the public will have about the institution’s
corporate image (Anderson, 2004; Bernstein, 2004). Meanwhile Brown and Perry (2004)
argued that services offered by Universities have a positive direct effect on student/parent
loyalty, recommendation and satisfaction. The ability of a University to create good
impression in the minds of prospective candidates, parents, faculty and other potential
clients, and managing the good impression could increase the level of patronage and
willingness of faculty members to join the University.
2.2.21 University’s Corporate Reputation
In today's sensitive academic milieu, a University's ultimate chance of survival is to develop
a positive image and a favourable reputation. According to Moogen (2010:7) “Reputation
refers to value judgments among the public about an organisation’s qualities, formed over
a period of time, regarding its consistency, trustworthiness and reliability”. Marken (2002)
defined reputation as an “asset that describes quality of products and services, ability to
innovate, value as long-term investment, ability to attract, develop, retain talent; use of
corporate assets, and quality of management”. In a related development, MacMillan,
47
Money, Downing, and Hillenbrand (2005) opined that corporate reputation is the general
perception of what the organisation stands for and what aspects and expectations are
associated by individuals when benefiting from the University’s products and services.
Obviously, the internal factors that positively affect a University’s reputation good
communicate channels, unique culture, innovation, good research outputs, community
service, treatment of faculty and staff with dignity, and the ability to handle social and
environmental issues (Bromly, 2003; Cetu & Brodie, 2007; Birkman, 2007). Moreover,
external forces that influence organisational corporate reputation are parents, government
or its regulation agency (NUC), media, among others (Lines, 2004).
It is important to note that University reputation can be built and managed on some day-to-
day actions such as phone calls, e-mail, decisions and others. (Marken, 2002). However,
with the growing competition in the educational sector, the positive image, reputation of
the Universities and accumulated judgments over time of different stakeholders who
interact with the Universities is inevitable for University’s success (Schuler, 2004; Xu,
Gorg & Liu, 2008). Therefore, a University can have multiple reputations: one for each
attribute, such as faculty’s professionalism, good facilities, quality teaching and rigorous
research, strategic locations, and innovative products/services.
2.2.22 University’s Corporate Identity
Universities depend on various nods in their quest to project good and positive image to its
different stakeholders. According to Fill (2006), corporate identity is the external projection
of what the University is to its various stakeholders. It portrays the way a University
presents itself to its public through the style of communication, culture values, behaviour,
symbols via logos, signage, websites, product quality, staff behaviour and, media comment,
among others (Hsieh & Kaili, 2008). Besides, stakeholders’ perception and impression of
all the features and qualities associated with a University and what they offer as products
such as disciplined undergraduates and employable graduates is referred to as its image.
This image is influenced by varieties of programmes, service component; attractions of
national and international students; the University’s physical facilities and infrastructures,
strategic location of the University, and others but just mention a few.
Obviously, building a successful University identity or image and values that create a sense
of individuality that differentiate a University from others is critical for organisational
48
philosophy. (Harris, 2001; Melewar & Akel, 2005). Expectedly, University identity should
be built on the components of its vision and core values that spur the product brands.
Therefore, for the purpose of building sustainable reputation, Universities must harmonise
their visions and culture for consistency as bases for personality and reputation building
and positioning.
2.2.23 University’s Research Image
In the knowledge-based contemporary society, research is fundamental for new
discoveries, innovations, creation and proper dissemination and application of knowledge
in a range of disciplines (Altbach & Balan, 2007). Universities are expected to be research
powerhouses and assets that the stakeholders in the society can invest in to ensure the future
of a nation in the increasingly susceptible and unpredictable environment (Creswell, 2008;
Hanan & John, 2013). Besides, the distinctive discovery and innovation of a University
serves as a good corporate image for institutions of higher learning to attract more grants,
research support among others. from local, national and international levels. Research,
which is primarily the raison d’etre for the creation of Universities, leading to the
generation of new knowledge, engendering innovation, enhancing the quality of teaching
and increasing an institution’s reputation and economic value, has unfortunately suffered
major decline in Nigeria beginning from the late 1980s (Faborode, 2016). Before then, the
National Universities Commission (NUC) noted that the quantity and quality of research
outputs in Nigerian tertiary institutions was the best in sub-Saharan Africa (Okebukola,
2010; Imhonopi and Urim, 2013). At the outset of the “holocaust” years, 1980 to 2000, the
pertinent factors for outstanding research, such as experienced academics, training,
motivation, availability of equipment, funding and facilities, had more or less faded away
(Faborode, 2016). What took over was a “vicious national dilemma of a badly managed
and plundered non-commodity economy and a self-afflicted and degraded education
system that ultimately lost its once vivacity and global reputation” (Faborode, 2016:12).
By the mid-90s, the quantity and quality of research had declined to an alarming low
(Okebukola, 2008). This is not unexpected as Nigeria was spending an average of 5%
instead of 26% recommended by the UNESCO on education.
Okebukola (2008) and Imhonopi and Urim, (2013) enumerated other factors contributing
to the decline in quantity and quality of research including, lack of modern research skills,
unavailability of modern facilities to conduct state of the art research, teaching overload,

49
administration responsibilities, poor research mentorship and motivation, incessant
industrial actions and difficulty in accessing research funds. Indeed, for the quantity and
quality of research outputs to make the desired impacts on national development,
Universities in Nigeria must achieve research focus, research motivation, integration of
information technology in teaching and research, as well as the commercialisation of
research results (Faborode, 2016). Hence, there is need for this research focusing on
research outputs and determinants of research productivity in present day Nigeria.
Universities with good research image and appropriate research laboratories and other
modern research facilities that permit research at the highest possible level attracts
scientists, scholars and students from around the globe to carry out cutting-edge research
(Creswell, 2008). The ability of a University to bring together a team of outstanding
researchers to think deeply and write thoughtfully in proffering solutions to industry and
societal challenges will give the institution an edge over others when it comes to student
patronage, talent retention and attraction of good faculty members but at the national and
international levels (Polat, 2011; Okiki, 2013). In his own view, Altbach et al. (2007)
opined that Universities with good research image can easily connect and collaborate with
their counterparts around the globe with an opportunity for research grants and participation
in global science and scholarship.
Research is one of the criteria for Universities’ ranking and because of its importance, some
Universities most especially in the developed economy have invested so much on building
their research image and they are christened as research-oriented Universities. Most of
these Universities specialise in educating a new generation of employees needed for
evolving competition, technological advancement, intellectual leadership and development
of new capacity necessary for modern science, scholarship and organisational
competitiveness. Besides, Kazeem and Ige (2010) posited that Nigerian private Universities
unlike their counterparts in China, Taiwan, South Korea, India among others, who have
been particularly active in building and transforming a number of their major Universities
into research-oriented Universities should aim to build their research capacity to improve
on University ranking which will invariably position them to attract more patronage from
within and outside Nigeria.
50
2.2.24 Job Performance
Job performance as noted by Abdul and Aamer (2011) is the “ability of an employee to
achieve a certain level of productivity in the aspects of quantity or quality”. Performance
also means organisational level of productivity and output as a result of employee
development and clarity of roles via effective communication. It is important to note that,
there are several dimensions of work performance. Pedro and Robert (2012) posited that
dimensions of work performance include “knowledge about work, attitude, decision
making, delegation, personal efficiency, planning, and leadership capability”.
It is pertinent to note that a few theories and thoughtfulness need to be applied to give
explanation to the discussion on work performance. The theory of motivation usually plays
a very crucial role directly or indirectly within work performance. This role includes to
motivate and maintain drive to achieve the objectives of the organisation. Meanwhile, the
features of performance can also be described as follows:
i. what people actually do which can be observed.
ii. measurable outputs and achievements that are dependent on the skill and effort
of individuals on the job.
iii. Individuals’ proficiency that contribute to the organisation’s success and
sustainable development.
iv. Performance is not stable over time as a result of learning among others.
2.2.25 Types of Performance
They are listed below:
1. Task performance
i. job-specific task expertise;
ii. non-job-specific task proficiency;
iii. communication skill
iv. supervision, in case of leadership position
v. Management/administration competencies
2. Contextual performance
It consists of behaviour that supports organisations social and psychological environment
but have no direct contributions to organisational performance. These include:

51
i. volunteering for activities beyond a person's formal job requirements;
ii. persistence of enthusiasm in completing important task
iii. assistance to others;
iv. Conforming absolutely to the organisational rules and prescribed
procedures even when it is not convenient; and
v. defending organisation objectives openly.
2.2.26 Job Performance in University System
The pivotal objective of any University is to develop and raise a new generation of leaders
who are adequately equipped both mentally, morally and physically. In addition, the
universities are expected to coordinate the development and adequate utilisation of
manpower, provide quality leadership training, build strong economy and society, giving
quality education through comprehensive courses. Primarily, Universities are saddled with
the responsibility of:
i. Teaching and project supervision of students
ii. Research and publication
iii. Community impact
iv. Innovation
v. Product development etc.
The performance of academic staff saddled with the responsibilities of the above listed
institutional service was measured through:
i. The number of research output per time
ii. The student pass rate
iii. The number of courses taken per semester
iv. The number of supervisees
v. The number of committees serving
vi. The involvement in community service and others.
It is also important to note here that performance measures in the University system include
the ability of an academic to impact knowledge through good teaching pedagogies and
learning aids and ability to carry out independent research. Evidently, the level of
performance of academic staff in Nigerian Universities is declining. These can be attributed
to some factors like, industrial actions, dilapidated facilities, aging teaching and research

52
aids, shortage of competent senior academic staff, inadequate funding among others (Ajayi,
Awosusi, Arogundade & Ekundayo, 2011; Okebukola, 2010).
In a related development, Manafi and Subramaniam (2015) posited that no matter the
programmes of a particular University, if the working environment is not conducive enough
for teaching, research and innovation, academic staff would find it so difficult to
productively and efficiently carry out their responsibilities. OECD (2012) also pointed out
that conducive work atmosphere is crucial for academic staff performance. An academic
with distinctive capabilities, good disposition to teaching research and innovation,
dedicated and interested in the teaching profession are likely to be frustrated if there is no
conducive work environment to operate within. However, for the purpose of this study,
teaching and supervision, research output and publications, community service as well as
service to the University will be adopted to measure job performance.
2.2.27 Historical Background of the Sampled Universities
2.2.27.1 Private Universities in Nigeria
Today, Universities are characterised by massive expansion and high rate of students'
enrolment on account of open interest for University education. Obviously, public funded
Universities cannot meet up with the demand of individuals longing for University
education, thus, it becomes necessary for private providers to take care of the growing
demand of University education by establishing private Universities (Adeyeye, 2009). This
led to the emergence of private Universities in Nigeria. The thought behind the private
interest in University education in Nigeria can be portrayed as a procedure of breaking the
monopoly of government in education administration and the deregulation of education
where the Universities could be self-regulated and controlled.
The provision of 1979 constitution empowered private individuals, religious bodies among
others to establish private Universities (Amponsah & Onuoha, 2013). Sequel to the
provision of the constitution, some private Universities were established. Meanwhile, it
also important to note that some of the first-generation private Universities were founded
without proper and adequate planning, thus, approval for the establishment of private
Universities was abolished with Decrees 19 of 1984 and 16 of 1985 respectively. In a bid
to resuscitate the establishment of private Universities, National Universities Commission
(NUC) was charged with the responsibilities of assessing the adequacy of the applications
53
for the establishment of new Universities before licence could be given to operate in the
country.
The hope of private sector participation in University education resurrected in 1991. A
commission was inaugurated to review private University education. Further to the
recommendations of the Commission, the decree prohibiting establishment of private
Universities was repealed, thus, empowering private individuals and organizations to run
private Universities (Okojie, 2008). NUC established the Standing Committee on the
Establishment of Private Universities (SCOPU) in May, 1993 to ensure academic qualities
and standards. In 1999, private Universities in Nigeria received a geometrical improvement
with the approval of, Igbinedion University, Okada, Babcock University, Ilisan Remo and
Madonna University, Okija (Omuta, 2010; Owoeye, 2012). From 1999 to 2016, sixty-one
private Universities have been approved and licensed to operate in Nigeria {(NUC, 2015)
(See Appendix 3)}. Private Universities in Nigeria are known for uninterrupted academic
calendar; production of quality graduates; production disciplined graduates; good research
output; improved management for efficiency; increase in access for qualified people into
Universities; employment opportunities among others (Amponsah & Onuoha, 2013). It is
also imperative to note that the private Universities in Nigeria are yearly ranked based on
their performances in academic quality and standards. In the year 2015 ranking of
Universities the following private Universities were the best 6 private Universities in
Southwest Nigeria:
a) Covenant University
b) Redeemer’s University
c) Afe Babalola University
d) Lead City University
e) Babcock University
f) Bells University of Technology
2.2.27.2 Brief History of Selected Private Universities
The history of selected private Universities becomes necessary to know their structure, core
values, visions among others that drive their outstanding performance amongst private
Universities in Southwest Nigeria. The following are the sampled Universities in this study:

54
(a.) Covenant University, Ota, Ogun State
Covenant University is a faith based University owned by the Living Faith Church and was
licensed by the Federal Government to operate as a private University in Nigeria in
February 12, 2002. The vision of the University is to “be a leading World-Class Christian
Mission University, committed to raising a new generation of leaders in all fields of Human
endeavor” while the mission is to “create knowledge and restore the dignity of the black
man via a human development and total man concept driven curriculum employing
innovative, leading edge, teaching and learning methods, research and professional services
that promote integrated, life-applicable, life-transforming education relevant to the context
of science, technology and human capacity building”
The University has core-values that defines her commitment to academic excellence which
are “spirituality, possibility mentality, capacity building, integrity, responsibility, diligence
and sacrifice”. As noted by the Oyedepo (2003), “Covenant University is on the rescue
mission to reform the educational scenery of Africa through the integration of the
fundamental requirements stipulated by academic and professional quality assurance
bodies, a global-outlook and impact driven learning emphasis, provides a powerful synergy
for empowerment in enabling the inculcation of intellectual and creative abilities via a
platform of a solid commitment to self-discovery”.
The University has four colleges i.e. College of Business and Social Sciences (CBSS);
College of Leadership Development Studies (CLDS); College of Science and Technology
(CST) and College of Engineering (COE). Presently, the University has twenty-three (23)
departments and thirty-three programmes across all the colleges. The University has won
several awards which include but not limited to the best private University in Nigeria in
July 2011, January 2012, January 2013 and February, 2014 World Universities Webometric
Rankings.
(b.) Redeemer’s University, Ede, Osun State
Redeemer’s University was established by the Redeemed Christian Church of God to make
inputs into the education system in Nigeria. The drive for the establishment of the
University was born out of the passion for the esteemed numbers of youth who are yarning
for the University education in Nigeria because of the high percentage of eligible candidates
who cannot secure admission due to limited public Universities in Nigeria. The University
is currently situated at its permanent site in Ede, Osun State. The Federal Government of

55
Nigeria granted an operating license to the Redeemer's University on Friday, 7th January,
2005. The Vision of the University is “to be the foremost institution for producing graduates
who combine academic excellence in the practice of their profession with God-fearing
attributes”. Redeemer's University operates the collegiate system. Presently, they have four
(4) colleges namely: College of Humanity, College of Management Sciences, College of
Natural Sciences and Postgraduate College. (i) College of humanity offers the following
programmes: English; History and International Relations; and Theatre Arts. College of
Management Sciences offers fourteen degree programmes from seven different
departments. Department of Behavioural Studies runs degree programme in Psychology,
Sociology and Social Work. Department of Economic and Business Studies offers
Economic, Business Administration and Marketing while Department of Financial Studies
offers Bachelor of Science in Accounting, Actuarial Sciences, Banking and Finance and
Insurance. Others are Department of Mass communication which offers Bachelor of
Science in Mass communication; Department of Political Science offers Bachelor of
Science in Political Science and Department of Transport and Tourism Studies offers B.Sc.
Tourism and Transport and Logistics. The college also offers postgraduate degrees: M.Sc.
and PhD in the Department of Behavioural Studies. College of Natural Sciences houses
four departments, namely: Biological, Chemical, Mathematical and Physical Sciences
which altogether offer nine (9) programmes leading to the award of Bachelor of Science
degrees in Microbiology, Applied Biology and Genetics, Biochemistry, Industrial
Chemistry, Pure Chemistry, Industrial Mathematics, Computer Science, Statistics and
Physics with Electronics.
(c.) Afe Babalola University, Ekiti State
Afe Babalola University was founded by Aare Afe Babalola and located on its permanent
site of 130 hectares of land in Ado-Ekiti. It is a Non-profit private University licensed by
the Federal Government in 2009. The University was established with the sole aim of
reforming education in Nigeria by providing and leading others in quality education,
service delivery, industry partnership and discipline. As noted by Babalola, the
“University is committed in producing graduates who appreciate the value of the dignity
of labour and who are problem solvers, self-reliant, employers of labour, expert thinkers,
innovative managers and resourceful technocrats in all fields of learning as well as highly
productive and globally relevant graduates in every sphere of human endeavour”. Afe
56
Babalola University operates collegiate system and presently has five colleges. They are:
College of Law with one programme LL. B Law. Meanwhile it is also important to note
that they are still proposing the following programmes in the college LL.M Law,
Criminology, Police Science. College of Sciences with the following programmes:
Microbiology/ Biotechnology, Human Biology, Zoology, Plant Science/Botany,
Agriculture science, Biochemistry, Chemistry, Industrial Chemistry, B.Sc. Physics with
Electronics, Geophysics, Mathematics, Statistics, Biometrics, Computer Science,
Information and Communication Technology, Computer Science and Information
Technology, Sports Science, College of Medicine and Health Sciences houses the
following programmes: Nursing, Medical Laboratory Science, Medicine and Surgery
(MBBS), Anatomy and Physiology. College of Engineering houses the following
programmes: Electrical and Electronic Engineering, Computer Engineering, Mechanical
Engineering, Mechatronics Engineering; Civil Engineering, Petroleum Engineering,
Chemical Engineering while College of Social and Management Sciences housed
Economics, Accounting, Banking and Finance, Business Administration, Tourism and
Events Management, Political Science, Social Justice, Media and Communication
Studies, Psychology and Guidance & Counseling, Sociology & Social Work.
(d.) Lead City University, Ibadan, Oyo State
Lead City University formerly known as City University was founded by the Eduserve
Consult and located in the city of Ibadan. In order to avoid and avert corporate identity
problem, the Board of Trustees and Council of the University met on Monday, March 7,
2015 and modified the name of the University to Lead City University, Ibadan. The
University was licensed to take off by National Universities Commission in December
2003 as a prelude to the ratification by the Federal Executive Council, which was effected
on Wednesday, February 16, 2005. The vision of the University is to “be a centre of
excellence, a unique, urban-based University, specialising in Social Sciences, Law,
Applied Sciences, Information and Communication Technology” while the mission of the
University is to “contribute to the development of tertiary education in Nigeria by providing
qualitative access to knowledge and training, with innovative and challenging teaching
techniques that guarantee a balanced education”.
The University has five (5) faculties with different programmes: (i) Faculty of Sciences
which houses different programmes including Chemistry, Physics, Biology, Environmental

57
Management & Toxicology, Microbiology, Biochemistry, Computer & Information
Science, Computer with Electronics, Computer with Economics. (ii) Faculty of Social and
Management Sciences which also houses different departments: Mass Communication and
Media Technology, Accounting, Business Administration, Politics and International
Relations, Economics, B.Sc. Public Administration, Psychology, Entrepreneurship,
Sociology, Banking and Finance, Industrial Relations & Personnel Management,
Marketing and Office Information Management. (iii) Faculty of Education which houses
the following programmes: Biology Education, Chemistry Education, Physics Education,
Mathematics Education, Computer Science Education, Guidance and Counseling,
Educational Management, Physical & Health Education, Business Education, English
Education, Library and Information Science, Economics Education and Social Studies
Education. (iv) Faculty of Arts houses English and Literary Studies as well as Performing
Arts. Faculty of Law has only one programme i.e. Bachelor of Laws.
(e.) Bells University of Technology, Ota, Ogun State
Bells University of Technology is the first private University of technology established in
Nigeria in 2004 and enrolled her first set of students in 2005/2006 academic session. The
University was established by the Bells Educational Foundation and currently located in
Ota, Ogun State, Nigeria. The University offers courses that support relevant and
sustainable technology that is transferable and applicable especially in the area of
biotechnology. In addition, the University focuses on ICT-driven and at the cutting edge of
Science and Technology. The University has three colleges that houses difference
departments and programmes: College of Natural and Applied Sciences houses:
Microbiology, Industrial Chemistry, Biochemistry, Electronics, Applied Mathematics with
Statistics, Computer Science. Information Technology, Food Technology, Food
Technology (Food Science with Business), Biotechnology, Nutrition & Dietetics, Culinary
Science and Hospitality Management. College of Management Sciences houses: Business
Administration, Finance and Banking, Economics, Accounting, Management Technology
while College of Environmental Sciences Houses Architecture, Building Technology,
Quantity Surveying, Surveying and Geoinformatics, Urban and Regional Planning and
Estate Management.

58
(f.) Babcock University, Ilisan-Remo, Ogun State
Babcock University is a faith based University founded by the Seventh Day Adventist
church in Nigeria. An American missionary, David Babcock pioneered the Seventh-Day
Church's work in Nigeria in 1914. In order to immortalize his name for his commitment
and service to the church, the University was named after him. Babcock University is
located in Ilisan-Remo Area of Ogun State, Nigeria. The University consolidated the
Adventist College of West Africa (ACWA) set up in 1959 yet whose name changed in 1975
to Adventist Seminary of West Africa (ASWA). The University was one of the first set of
private Universities authorized by the Federal Government to operate in Nigeria and its was
formally chartered on April 20, 1999.
The University offers the following courses: Administration: Information Resource
Management; Agriculture: Agriculture, Nutrition and Dietetics; Arts And Humanities:
Christian Religious Knowledge/Studies, English And Literary Studies, English Language,
English Studies, French, French And International Relations, History and International
Studies, Music and Religious Studies; Education: Business Education, Education and
Economics, Education And English Language, Educational Administration and Planning,
Guidance and Counseling; Law/Legal Studies: Law; Med/Pharm/Health Sciences:
Anatomy, Medical Laboratory Science, Medicine and Surgery, Nursing/Nursing Sciences,
Physiology, Public Health and Technology; Sciences: Biochemistry, Biology, Chemistry,
Computer Science, Computer Science and Information Technology, Mathematics,
Microbiology, Physics Electronics; Social Sciences: Accounting, Banking And Finance,
Business Administration, Economics, Marketing, Mass Communication, Political Science,
Political Science/International Law And Diplomacy, Public Administration, Social Work.
2.3 Theoretical Framework
In an attempt to explain the relationship between strategic human resource management
practices, job performance and corporate image, the study focused on three competing
theories: universalistic, configurational and contingency theory of management.
2.3.1 Universalistic Theory of Management
The Universalistic Theory also referred to as Best Practice Model posits that adopting best
human resource management practices is capable of enhancing organisational performance
which will invariably lead to good corporate image (Luthans & Summer, 2005). The idea

59
of human resource management best practice was recognised originally in the early US
models of human resource management. Meanwhile, the theory proposes that “the adoption
of certain ‘best’ human resource management practices would enhance job performance,
improve employee attitudes and behaviours, reduce the levels of absenteeism and turnover,
promote higher levels of skills, enhanced quality and efficiency and of course promote
corporate image” (Marchington & Wilkinson, 2008). Similarly, the theory also opines that
organisations stand to benefit immensely if they can identify a set of best human resource
management practices that would strategically drive employees’ commitment for enhanced
job performance and corporate image. It also identified that organisations will increase
performance by recognizing and applying best practices regardless organisation’s location
(Pfeffer, 2001). However, every organisation regardless of their location and business type
must have a very idiosyncratic management practice and distinctive human resources
practices that would shape the core competences of employees to compete favourably with
their counterparts.
The theory also posits that what works well in a particular organisation may not necessarily
be applicable or fit into the strategic plans and working practices of other organisations.
Meanwhile, Pedro (2012) observes that organisational optimal performance and work
systems are highly distinctive and must be tailored thoughtfully to individual organisation’s
peculiar situations. Besides, high performance work practices can be achieved if strategic
human resource management practices are integrated and supported by the key business
priorities. Nevertheless, the good practices that are effective in a successful business
environment should not be totally disregarded. It can be used as a benchmark for classifying
areas of innovation and development as practised by some leading organisations. Therefore,
organisations have the responsibility to decide what they think is relevant to them and adopt
same to fit their strategic goals and operational requirements.
2.3.2 Configurational Theory of Management
Following the current trend in the field of strategic human resource management (SHRM)
and the quest of organisations to integrate structural relationship among HRM practices for
enhanced job performance, the configurational theory which emphasises a link between the
process of organisational performance and competitive advantage via the internal and
external fit needs to be discussed. Brewster and Mayrhofer (2013) suggested that “the
concept of strategic human resource management (SHRM) needs to be expanded to offer a

60
more complex explanation of how the internal functions and workings of an organisation
can achieve its business goals”. The theory also emphasises how the functions of human
resource management could be integrated into the organisation’s overall strategic goals. An
organisation with distinctive human resource management practices usually record
outstanding performance. The integration of organisational distinctive strategic human
resource management practices with competitive strategy usually complements and
reinforces desired results. Employee optimal performance is a function capability and
motivation in a form of incentives and benefits. However, human resource management
best practices and individual practices should be properly integrated into the overall
organisational strategic goals to drive effectiveness (Storey, 2007).
It has been argued that in addition to internal organisational characteristics, environmental
features also play an important role on organisational performance (Brewster & Mayrhofer,
2013). The external environmental features signify customer demands and competitive
market environment which is central to organisational performance. The configurational
theory emerged as a new platform for assessing various sources of organisational growth
and sustainable development that will promote competitive advantage (Waiganjo, Mukulu
& Kahiri, 2012). MacDuffie (2005:13) posits that “a ‘bundle’ creates the multiple
reinforcing conditions that support employee motivation, given that employees have the
prerequisite knowledge and skills to perform their work commendably”. The objective of
bundling is to accomplish consistency which exists when a jointly reinforcing set of human
resource management practices have been developed in such a way that would jointly
contribute to the organisational achievement by matching resources to organisational
needs, thus, improving organisational performance and enhancing competitive advantage.
Furthermore, MacDuffie (2005) argues that the notion of a link between business strategy
and the performance of every individual in the organisation is central to ‘fit’ or vertical
integration. Internal fit advocates bundle of practice rather than only a single practice.
In a nutshell, strategic human resource management, according to configuration theorists,
posits that there is no linear relationship between the components of human resource and
organisational performance. However, human resource function can be studied as a
composite and interactive system. Meanwhile, the theory opines that the elements of human
resource system must be critically considered to understand the dimensions of its fitness
into the business strategy at various times. The model also reconsiders three basic aspects
61
of strategic human resource management practices: the nature of human resource; analytics
level as well as the actors oblique in the organisational function.
2.3.3 Contingency Theory of Management and its Implications on the Study
It must be noted that the contingency theory of management will be considered as the
investigative framework for this study. Contingency theory also known as best fit human
resource management theory is another model that can be adopted to explain the employee
resourcing strategies in organisations. This model postulates that relationship exists
between variables in the world of work and the approaches adopted depend on the current
situation of the organisation. Meanwhile, the assumption underlying contingency theory is
that no single type of organisational structure is equally application to all organisations,
thus, the level of organisational effectiveness largely depends on the fits or match between
size of the organisation, environmental volatility, the information system, type of
technology among others. Contingency scholars opine that human resource strategy would
be more efficient if properly integrated with organisation specific strategies within the
context of its environment (Wright & Snell, 2005). This theory also emphasises the
importance of ensuring that human resource strategies are appropriate to the peculiarity of
the organisation, including the culture, core values, operational processes, and external
environment. It is expedient that human resource strategies should take into consideration
the needs of both the organisation and its human resource. Meanwhile, best fit human -
resource management theory must as a matter of necessity explore the link between
strategic management and human resource management by considering the vertical
integration between business strategy and its human resource management policies and
practices (Dyer, 2005). Besides, Wright et al (2005) have indicated that contingency
relationships can be grouped into three basic categories: strategic variables; organisational
variables; and external environmental factors.
Boxall and Purcell (2008), noted that vertical integration between business strategies,
employees’ attitudes and organisational performance is at the forefront of core models of
strategic human resource management. Besides, organisations are more efficient and
effective when there is integration between the overall organisation business strategies and
human resource management practices (Legge, 2005; Wright, Gardner & Allen, 2005).
However, Dyer (2005) noted that “vertical integration or ‘fit’ where ‘leverage’ is gained
62
through procedures, policies and processes is widely acknowledged to be a crucial part of
any strategic approach to the management of people”.
The contingency approach also affirms that strategic human resource management is one
of the major factors that contributes to the enrichment of job performance; its integration
with organisation’s overall strategic goal and other factors guarantees higher job
performance that will eventually promote the organisations’ corporate image. Meanwhile,
the organisation approach to competition largely depends on the availability of employees
with distinctive talents. Attention was also given to a model by Wright et al (2005) which
recommend that strategic human resource management practices should concurrently
promote strategic fit and flexibility to cope with the future. In his view, Legge (2005) noted
that “responding to the external demands may undermine the possibility of achieving
strategic internal fit”. Meanwhile, businesses may not strive in means of competitive
business environments if attention is not given to the pressures from social rules, policies
as well as employment relationships. Moreover, contingency model is based on two
theoretical frameworks as described by Miles and Snow (1978). The first one looked at the
behavioural theory that enhance a fit between business strategy and human resource
management practices. The second framework focuses on the tangible resources and
distinctive capabilities of the organisations thereby looking for a strategic fit between
employees and strategic goals of the organisation (Boxall, et al. 2008).
The importance of the theory adopted for this study is premised on its integration of diverse
process, quantitative and behavioural approaches to management in organisations be it
private or public within a peculiar situation. The contingency approach to management
emphasised that there is no single best approach to the management of people in the world
of work, thus, it is based on the immediate contingent situations. The principles of
management such as planning, coordinating, organising, leading, and controlling must be
tailored toward the effective actualisation of organisational and individual goals.
The theory also posits that management of job requirements as well as task and people
involved in complete management situation must be clearly identified and properly
integrated to all facets of the organisation into a resolution that is considered to be the most
appropriate for an explicit situation. However, the adoption of employee resourcing
strategies such as human resources planning, recruitment, selection and retention depend

63
largely on peculiar situation of the different organisations and availability of employees
with distinctive capabilities. The theories noted that excellent performance is guaranteed
when individuals with distinctive capabilities are attracted, engaged and retained. The
theories assume that the whole aim of the organisation in the highly competitive academic
environment revolves around a strategic approach to the management of people and other
resources. The implication is that, the survival and failure of any organisation in this
contemporary competitive academic environment most especially among private
Universities in Southwest Nigeria depend largely on the employee resourcing strategies
adopted.
Therefore, the contingency theory as presented in this study was adopted to proffer solution
to some fundamental issues on the subject matter. This includes, the extent to which the
level of integration of employee resourcing strategies affects the overall strategic goals of
the institutions of higher learning; the level of fitness of the employee resourcing strategies,
job performance and perceived corporate image in the face of unique circumstances or
situations of different Universities, since strategies that are effective in some universities
may not be successful in other Universities; the scrutiny of multidimensional contingencies
and their bearing on institutions strategic plans. Therefore, the varied range of external and
internal factors should be taken into consideration and at the same time emphasise on the
actions that best fit the given situation or circumstances.
2.4 Empirical Framework
2.4.1 Human Resource Planning and University Brand Image
Human resource planning anticipates for organisations’ future business and environmental
forces, thereby, evaluating the employees’ requisite for future needs. The process also
attempts to provide sufficient employees required to perform optimally toward the
realisation of organisational goals and objectives.
Empirically, the views of scholars on human resource planning are similar depending on
the context is been used. For instance, Akhigbe (2013) studied “human resource planning
as a key factor in ensuring the effectiveness and efficiency of organisations”. The study
examines the significant relationship between human resource planning and organisational
effectiveness and efficiency in manufacturing firms. The study adopted both quantitative
and qualitative methods. Semi structured questionnaire was administered to the
64
management staff and interviews were conducted with senior management of 48
manufacturing firms located in the Port Harcourt Area of Rivers State, Nigeria. The
findings showed that human resource planning is fundamental to the effectiveness and
efficiency of the manufacturing firms. It was recommended that human resource planning
should be given priority in every organisation, since it has a very positive significant impact
on organisational effectiveness.
Satope (2014) in his study on human resource planning in Nigerian Universities discovered
that human resource planning before accreditation was different from what existed during
accreditation period. He found out that despite the fact that the National Universities
Commission’s enforcement of every University to have planning unit, most Universities
had been denied of full accreditation due to inadequate staffing and inability to meet NUC
staff-mixed and staff-student ratio requirements. The problem was attributed to several
planning factors which include gap analysis, skill audit, job analysis, talent management,
among others.
DeWinne and Sels (2015) noted that gap analysis, job analysis and effective utilisation of
employees’ skills would help organisations in planning for future manpower requirements
and ensuring sufficient pool of candidates with the right skills and experience needed. This
was further corroborated by Maina and Kwasira (2015) who noted that proper analysis of
gap and job would help organisations to determine the number of persons and kinds of
skills that would be required by the organisation presently and in the future. It was also
discovered that strategic human resource planning involves three basic steps: (i) the
demand of workforces in the future is projected by getting an insight to determine the
numbers of employee needed to fulfill organisation’s objectives; (ii) the supply of
employees in the future is anticipated; (iii) the organisation should compare demand and
supply in the future and as well take necessary actions to accommodate both.
Therefore, Brewster, Brookes, Croucher, and Wood, (2014) and Brewster and Mayrhofer
(2013) advocated building effective strategic human resource planning via a thorough gap
analysis, job analysis, good forecast, skills audits and by so doing, the organisations would
have the quality and quantity of required staff that would be economically engaged which
would invariably impact on such organisations’ performance, thereby promoting
organisational corporate image. Universities in their quest to attract good students and

65
faculty members spend so much in trying to burnish their corporate image and enhance
their position in various academic rankings such as Times Higher Education-QS Ranking,
Academic Ranking of World Universities, Webometrics Ranking, Professional Ranking of
World Universities, Newsweek Ranking among others. Besides, services offered by a
University determines the impression, whether positive or negative that the public will have
about the institutions’ image. Bernstein (2004) in his study titled “Company Image and
Reality” discovered that corporate image was fundamental to the level of loyalty and
patronage of a product or service.
Meanwhile, Brown and Perry (2004) argued that services offered by Universities had a
positive direct effect on student-parent loyalty, recommendation and satisfaction. The
ability of a University to create a good impression in the minds of prospective applicants,
parents, faculty and students and the management of the good impression would increase
the level of patronage and willingness of faculty members to join the University. Sondoh,
Omar, Wahid, Ismail, and Harun (2007) in their study on “the effect of brand image on
overall satisfaction and loyalty intention” found out that “appearance and functional brand
image benefits had significant impacts on loyalty intention while symbolic, experiential
and social brand image benefits have negative effects on loyalty intention”.
In a related study, Rudhumbu, Chikari, Svotwa and Lukusa, (2014) reported that “the use
of employer branding as a tool for attracting and retaining talent: evidence from private
higher education institutions in Botswana”. The study examines how employer branding is
used to attract and retain talent in private institutions of higher learning. The researchers
reported sincerity, honesty, employee values and rewards as well as employee-friendly
recruitment processes as some of the employers’ brand strategies used by the sampled
higher institutions to attract potential candidates and retain most of the employees. In a
nutshell, their findings showed that institutions of higher learning deployed a number of
employer branding strategies to attract and retain talent.
2.4.2. Employee Recruitment Strategies and Research Image
Most researchers conclude that recruitment strategies primarily are designed to generate a
pool of talented candidates to fill identified positions which is fundamental to the
organisational survival and sustainability in the competitive business or academic

66
environment (Adeniji et al, 2012; Gberevbie, 2010; Karemu, Gikera & Josee, 2014; Tong,
2015).
Gberevbie (2008) in his study titled “staff recruitment, retention strategies and performance
of selected public and private organisations in Nigeria” reported the comparative analysis
of employee recruitment and retention strategies and how it enhances performance of the
selected public and private organisation. The organisations covered in his study are Federal,
Delta and Lagos State Civil Services are in public sector categories while Nestle Nigeria
Plc, Nigerian Breweries Nig. Plc and Zenith Bank Nig. Plc represented the private sector.
In his findings, he reported that private organisations had good recruitment strategies
compared to their public counterparts. Some of the recruitment strategies adopted by the
sampled private organisations include: advertisement of the identified vacancies on
national newspapers and company’s websites; unsolicited applications, outsourcing among
others. The research findings also revealed some of the recruitment strategies adopted by
the public organisations which include political influence; quota system; tribal sentiment;
‘who you know’ syndrome, federal character and newspaper advertisement. The findings
of the study showed a significant relationship between employee recruitment, staff
retention strategies and organisational performance. He argued that private organisations
had better recruitment strategies than their public counterparts and therefore suggested that
organisations should endeavour to adopt appropriate staff recruitment and retention
strategies, as this would help in generating the needed workforce that would be engaged
productively toward the actualisation of organisational goals.
Kanyemba, Iwu, and Allen-Ile (2015) in their study titled “impact of recruitment and
selection on organisational productivity: An empirical evidence of a University in South
Africa” reported that good recruitment strategies in institutions of higher learning
guarantees the attraction and engagement of right calibre of personnel. In his findings,
Abdul (2015) noted that business owners or managers used more of internal sources of
recruitment such as promotion, transfer, referral and internal advertisement. He posited that
external sources of recruitment would help owners/managers of business firms to recruit
persons with the required competencies. It was recommended that external sources of
recruitment be used more to help in attracting appropriate employees that are likely to
perform beyond expectation. Similarly, Ekwoaba et al, (2015) found out that recruitment
strategy was fundamental for organisational efficiency and quality service delivery. He

67
reported the inevitability of recruitment strategies for business owners and managers as a
productive means of attracting competent persons. Gamage (2014) reported that
recruitment strategies adopted by an organisation determine who is hired.
Amadasu (2003) in his study observed that the poor performance of public organisations
can be attributed to poor recruitment strategies. The study reported that good recruitment
strategies must avoid skill mismatch, favouritism and “godfather” syndrome. The
implication of study findings is that, the individual and organisational performance will be
affected when the proper recruitment strategies are not adopted to attract individuals with
required educational qualification, skills and experiences. According to Armstrong (2010),
for any organisation to achieve its goals, employee-resourcing strategies play a very
fundamental role in attracting or bringing individuals with distinctive capabilities into an
organisation for optimal performance. In the University environment, for example, the
calibre of faculty staff recruited will determine the level of their performance in terms of
quality teaching, research innovation and community impact. Attracting good and
competent academic staff will help in promoting the research image of the University.
Institutions of higher learning, particularly Universities, are expected to be research
powerhouses that would proffer solutions to various issues in the increasingly susceptible
and unpredictable society. Creswell (2008) reported that the distinctive discovery and
innovation of a University serves as a good corporate image for institutions to attract more
grants, research support and others. from local, national and international levels.
Scholars such as Hanan and John (2013) and Creswell (2008) noted that Universities with
good research image with appropriate research laboratories, well equipped libraries as well
as other infrastructures that allow and support research at the highest possible level attract
scientists, scholars and students from around the globe to carry out cutting-edge research.
Altbach et al. (2007) opined that Universities with good research image can easily connect
and collaborate with their counterparts around the globe with an opportunity for research
grants and participation in global science and scholarship. Some Universities most
especially in developed economies have invested so much in building their research image
and they are christened as research-oriented Universities (Kazeem & Ige, 2010). Most of
these Universities specialise in educating a new generation of employees needed for
evolving competition, technological advancement, intellectual leadership and development
68
of new capacity necessary for modern science, scholarship and organisational
competitiveness. Consequently, Kazeem and Ige (2010) in their study suggested that
Nigerian Universities unlike their counterparts in China, Taiwan, South Korea, India
among others who have been particularly active in building and transforming a number of
their major Universities into research-based Universities should aim to build their research
capacity.
2.4.3 Employee Selection Strategies and Corporate Reputation
Employee selection is one of the employee resourcing strategies that deals with identifying
the most qualified candidates from a pool of applicants shortlisted that are considered to
meet the predetermined selection criteria. Selection strategies vary from one organisation
to the other. What is more important is that the use of proper selection strategies would
help the organisations to engage the right skills and talents which will invariably increase
the level of organisational performance.
Many studies have established the fact that there are similarities between selection
strategies across organisations (Ekwoaba et al. 2015; Kepha et al. 2014). As noted by
Gberevbie (2006), some of the selection strategies adopted by organisations include:
written tests, performance simulation, interviews, reference check, mental and physical
fitness among others. Ombui et al (2014), posit that selection strategies play a fundamental
role in bringing together competent candidates that are ready to bring out their best toward
the realisation of organisational goals. He added that such strategies include good interview
guide and process, selection tests, interviews and background checks.
Ryan and Ployhart (2014) reported that selection tests includes ability tests; aptitude tests
(mental and intelligence tests, psychomotor tests, interest tests, personality tests). Antonio
et al. (2015) also mentioned that interviews are some of the selection strategies which could
take different forms, namely formal and informal interviews, non-direct interviews, in-
depth interviews, stress interviews, telephone interviews, group interviews, among others.
Other empirical studies revealed other selection strategies adopted by different
organisations. Chidi (2014) reported that federal character, quota system was more
pronounced in government establishments as selection strategies been adopted. Md (2010)
emphasised that interview was the most potent selection strategies and it involves three
69
stages: development stage which has to do with purpose of the interview, careful analysis
of candidates’ resumes, development of job profiles, proper sensitisation and training of
the interviewers, development of job-related questions for each identified vacancy,
designing of candidate evaluation and record sheets and proper sitting arrangement for the
interview. The second stage of interview according to him, is discussion stage which
involves the establishment of rapport, precise discussion of the organisational culture and
philosophy, clear presentation of questions to the candidates, polite responses to the
candidates’ questions if any, taking adequate note of the interview proceedings and as well
control the flow of the interview. The last stage is the decision stage which include
evaluation of the suitability of the candidates, conduct the background check, avoidance of
bias judgment and making of decisions on the candidates to employ.
On the other hand, the University’s survival and sustainable development depends largely
on its reputation. Moogen (2010) reported that “reputation is the value judgments about an
organisation’s qualities regarding its consistency, trustworthiness and reliability over a
period of time”. Marken (2002) reported that reputation is an “asset that describes quality
of products and services, ability to innovate, value as long-term investment, ability to
attract, develop, retain talent; use of corporate assets, and quality of management”. As
noted by Birkman (2007); Bromly, (2003); Cetu and Brodie (2007); MacMillan, Money,
Downing, and Hillenbrand (2005), some of the some of the factors that positively affect the
reputation of an organisation are: good communicate channels, transparency, treatment of
faculty and staff with dignity, ability to innovate and impact the host community positively,
management’s reputation and adaptation to possible changes as a result of social and
environmental issues. Sequel to the above, it is important to note here that the ability of
organisations to select candidates with distinctive capabilities, good dispositions and to
productively engage them will enhance the corporate reputation of such organisations.
2.4.4 Employee Retention Strategies and Corporate Identity
Organisations with effective human resource planning, recruitment and selection strategies
without efficient and effective retention strategies are not likely to survive in the complex
and competitive business environment. Employee retention strategies have become an
indispensable strategy that every organisation must give adequate attention to, for their
survival and sustainable development. Many studies have indicated that if there are no clear
70
strategies to retain employees with skills, knowledge and capabilities for proficient and
effective service delivery, organisations will find it difficult to achieve their goals (Karemu
et al 2014; Presbitero et al, 2015). Evidently, retention of competent and talented
employees in the 21st century organisations cannot be overemphasised. Some organisations
have devised some strategies that can serve as drivers or compelling forces to retain their
best staff. Nirmala and Sumangala (2015) reported some of the strategies adopted by some
organisations to retain their best hands in the midst of global hunt for talented and skilled
employees. The strategies include: flexibility, conducive work environment, attractive and
competitive rewards and benefits, health and safety, retirement savings plan, regular
promotion, recognition of outstanding performance, good career prospects among others.
Gberevbie (2008) in his study on recruitment, retention strategies and job performance
reported that two major elements that could be considered as possible strategies that can be
adopted by organisations either public or private to retain employees with distinctive
capabilities. The strategies include motivation and reward systems. Organisations are likely
to earn employees’ loyalty and commitment if they are motivated. The strategies adopted
by some organisations to motivate their employees are job enlargement, employee
participation in decision making, job rotation, positive organisational image, incentive
packages, employees prospect in the workplace, career path, leadership style, training and
development programmes, open communication with effective feedback, sense of
belonging to the goals of the organisation, favourable organisational culture and policies
and harmonious relationships, among others. On the other hand, the intention of employees
to stay in an organisation largely dependent on the level of existing reward systems.
Organisations that want to really retain their best employees must ensure that reward must
be meaningful, fair and just, competitive; and employers too must respect collective
agreement as regards the reward benefits.
Oyetunde and Ayeni (2014) in their study on “factors influencing recruitment and retention
of nurses in Lagos State” noted some of the strategies adopted by health institutions in
Lagos State, Nigeria include, purposive training and staff development, study leave,
conference support, provision of safety gadgets, effective communication, open door
policies, loan facilities to meet employees’ needs, regular promotion, good remuneration
packages, among others. The findings corroborated the position of Armstrong et al. (2014)

71
who also acknowledged some of the strategies that could be adopted to retain valuable and
indispensable employees. These include existence of learning opportunities and career
progression, recognition and rewards for employees with outstanding performance, flexible
working hours, safety and insurance and sponsorships as drivers that influence employees’
decisions to stay in an organisation for a reasonable number of years, among other factors.
In a related study, Maliku (2014) and Nzuve (2009), opine that employees’ level of
motivation determined the level of their satisfaction. These motivating factors were
namely: recognition of outstanding performance, commitment, engagement and
involvement. Maliku (2014) mentioned that some of the achievements such as, promotion
opportunities and career prospects, work life balance, attractive and competitive reward
system, institutional image among others, enhance organisational performance and build
the corporate identity of organisations.
On the other hand, corporate identity portrays the way organisations project themselves to
the general public. This is usually done through communication, behaviour, symbols, logos,
signage, websites, product quality, staff behaviour and, media comment, among others
(Hsieh & Kaili, 2008). This was supported by Olins (2014) that corporate identity
encourages stakeholders and general public to perceive organisations in a very positive
way. The corporate identity which is the external projection of an organisation should not
be taken with levity. Melewar and Akel (2005) reported that organisational corporate
identity should be built on the components of organisational vision and core values that
spur organisational image. Therefore, organisations that aspire to make landmark
achievement take the issue of identity seriously by creating unique identity that defines
their core values (Bidin, Muhaimi & Bolong, 2014).
2.4.5 Employee Resourcing Strategies and Job Performance
The survival and sustainable growth of any organisation largely depends on the
effectiveness of employee resourcing strategies. The reason is not far-fetched from its
systematic approach in ensuring the availability of right quantity and quality of persons fit
to work in an organisation.
Researchers such as KavooLinge and Kiruri (2013), Ogonyomi and Ojikutu (2014)
reported that employee resourcing strategies should ensure proper manpower planning that

72
would assist organisations to attract and retain the right employees to improve the level of
organisational performance. Kemboi1 and Onyango (2015) in their study on “the effects of
employee resourcing and development practices on organisational performance” reported
that clear recruitment procedure, selection process, flexible work arrangement, induction
and orientation, staff training and development, performance appraisal, career progression
and clear work design were paramount for every organisation in search of optimal
performance.
Similarly, Ngui, Elegwa, and Gachunga (2014) in their study titled “the effects of employee
resourcing strategies on the performance of commercial banks” reported that “a good
alignment between human resources management, firm strategy and organisational
performance”. The study in an attempt to examine the resultant effects between the
independent and dependent variables adopted a mixed method approach. A structured
questionnaire was administered to 349 respondents in 46 commercial banks in Kenya while
chief executive officers, human resource managers and operations managers were
interviewed. The findings of the study showed that banks gave priority to high academic
qualifications and professional certifications. In addition, the study also revealed that bank
performance is influenced by resourcing practices. This suggests that there is a positive
relationship between employee resourcing strategies and employee performance. The study
recommended that commercial banks should, as a matter of necessity, formulate policy that
would embrace the use of employee resourcing strategies to drive the actualisation of
overall organisational organisational goals. The major constructs used for the measurement
of employee resourcing strategies were recruitment, selection, orientation/induction,
placement and retention strategies.
In another study, Riccio (2010) in his findings on “Talent management in higher education;
identifying and developing emerging leaders within the administration at private colleges
and Universities” reported that leadership commitment, talent management, program
characteristics, and programme evaluation were very important in ensuring effective
performance of the workforce. Researcher used a case study method as research design for
this study. He found out that a comprehensive procedural model must be introduced to
serve as support to human resource departments and higher education professionals. He
added that time and resources invested in talent management would translate into
organisational success.

73
In this study performance, which is the meditating variable between employee resourcing
strategies and corporate image defines what the organisation employs one to do. Katou
(2011) reported that “organisational performance is the ability of employees to meet set
deadlines/objectives, teamwork, low turnover rate, increased profitability, employee
satisfaction, improved employee wellbeing, productivity, complete integration and synergy
between individual career goals and alignment to the firms’ objectives, growth, sense of
identity, social responsibility and flexibility”. Other scholars Waiganjo et. al (2012),
Hussain and Rehman, (2013) had posited that performance is measured through profit,
market share, organisational culture and the quality of values or services rendered among
others.
In the academic environment, most especially in University system, performance measures
differ. Ishak, Suhaida, Yuzainee (2009) and Abudulkereem and Oyeniran (2011) noted that
performance of academic staff can be measured through teaching and supervision that is,
“teaching load, teaching evaluation, supervision, consultation, quality of teaching”;
research and innovation (i.e. research output, involvement in research clusters,
collaboration, number of undergraduate and postgraduate supervisees); writing and
publications (i.e. text books, newsletters, other writings); consultancy (advisory role,
participation, monetary value, industrial attachment), service (commitment involvement,
membership of professional bodies, external examiners to other Universities, community
and voluntary service). This was also corroborated by the findings of Wang (2010) in his
study on performance measurement in Universities: managerial perspective. He reported
that academic staff performance can be categorised into three: input, output and outcome.
2.5 Gaps in Literature
The literature reviewed provides in-depth knowledge on employee resourcing strategies
and job performance. While empirical research has indicated the significance of employee
resourcing strategies and job performance, the extent to which this subject has been studied
in institutions of higher learning, especially in Nigerian private Universities is not clearly
established in the literature, compared to other sector such as manufacturing, banking,
construction companies, insurance sectors and some higher institutions in the western
world.

74
Moreover, after conducting a longitudinal study on staff recruitment and retention
strategies, employer branding and employee attraction at the Federal, Delta and Lagos State
Civil Service and Nestle Nig. Plc, Nigerian Breweries Nig. Plc, Zenith Bank Nig. Plc
among others, Gberevbie (2008); Rudhumbu, Chikari, Svotwa and Lukusa, (2014) and
Ngui, Elegwa, and Gachunga (2014) recommended further similar studies in other
organisations to validate the relationships between resourcing strategies and
employee/organisational performance. This is in line with studies conducted by:
Omoankhanlen (2013) and Riccio (2010) who also made earlier call to researchers to
examine the relationships and resultant effects of recruitment and selection strategies and
employee performance with possibilities of incorporating a moderating or mediating
variable(s). It is, however, important to emphasise that the study on the relationships or
effects of employee resourcing strategies on University image, a mediating role of job
performance in the institutions of higher learning in Nigeria, is not clearly established in
the empirical studies reviewed.
It is also inevitable to note that many theories of management have been used by many
researchers to explain some fundamental issues within the context of their studies. Out of
these theories only three of them were reviewed and used in this study: universalistic theory
of management, configurational theory of management and contingency theory of
management. Though, the emphasis was laid on contingency theory. None of these theories
have shown any evidence on how employee resourcing strategies influence job
performance, and how it culminates into building and promoting Universities’ corporate
image particularly in Nigeria. Besides, studies have shown that researchers are yet to model
the relationship between employee resourcing strategies, job performance and corporate
image particularly in Nigerian institutions of higher learning.
Similarly, most empirical studies related to the subject under investigation used regression,
correlation, mean and standard deviation for data analysis. This study adopted structural
equation modelling (Amos 22) to complement the regression and correlation analysis, this
was done to determine the level of fitness between the variables.
It was based on the aforementioned lacuna that this study examined the resultant effects
and relationship between employee resourcing strategies and corporate image, with
particular reference to the mediating role of job performance in Nigerian private
Universities.

75
CHAPTER THREE
METHODOLOGY
3.1 Introduction
The main aim of this chapter is to discuss the research methods employed in this study.
The chapter discusses the procedures or various sequential steps for data gathering, research
design, population, sample size, sampling techniques, sampling frame, research
instruments, and the techniques adopted in analysing the data. The study combines both
qualitative and quantitative techniques. The qualitative data give suitable understanding to
the logic underlying relationships shown in the quantitative data. A survey method,
complemented with structured in-depth interviews provided opportunity for triangulation
and cross-validation of the findings.
3.2 Research Design
Collis and Hussey (2009) opined that research design is the scientific planning procedures
for conducting research to get the most valid findings. In this study, a descriptive design
was adopted for this study. What informed the choice of descriptive design was on the basis
that the researcher adopted one time observation, including proximate and conclusive
variables essential and needed to address the research problem of the study (Creswell,
2003). However, descriptive design focuses on the phenomenon of interest, which
according to this study is to provide precise answers to questions concerning the
measurement of variables.
This study also adopted the mixed methods approach to enhance greater validity of the
study. Precisely, the survey and structured interview methods were employed. The choice
of survey method was based on its time effectiveness as well as its general picture of
respondents’ opinions which enhanced hypotheses testing. Structured interviews were used
to get additional and clarified information regarding management’s views on employee
resourcing strategies and corporate image. All these helped the researcher to investigate
whether employee resourcing strategies have any effect on job performance of academic
staff and corporate image of the study Universities.
3.3 Population of the Study
The population is made up of all the considered elements or observations relating to a
phenomenon of interest to the researcher (Asikia, 2000). The population may be observed
or physically counted. However, all the private Universities in Southwest, Nigeria
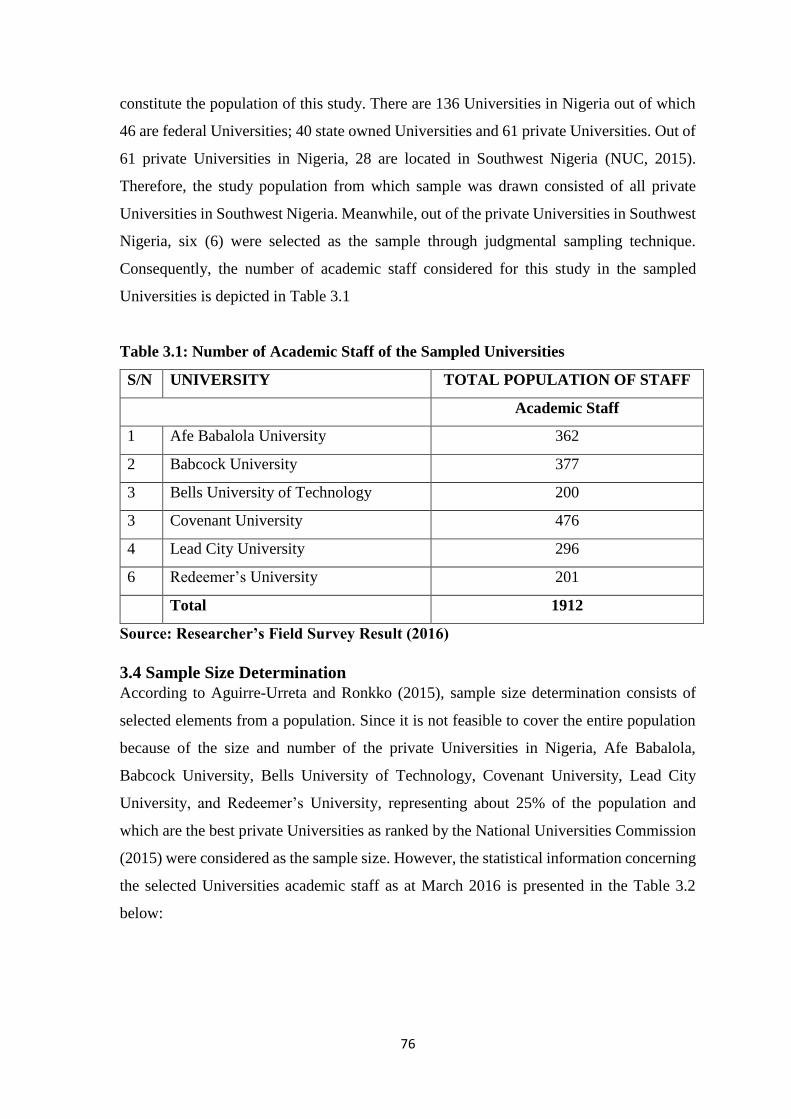
76
constitute the population of this study. There are 136 Universities in Nigeria out of which
46 are federal Universities; 40 state owned Universities and 61 private Universities. Out of
61 private Universities in Nigeria, 28 are located in Southwest Nigeria (NUC, 2015).
Therefore, the study population from which sample was drawn consisted of all private
Universities in Southwest Nigeria. Meanwhile, out of the private Universities in Southwest
Nigeria, six (6) were selected as the sample through judgmental sampling technique.
Consequently, the number of academic staff considered for this study in the sampled
Universities is depicted in Table 3.1
Table 3.1: Number of Academic Staff of the Sampled Universities
S/N UNIVERSITY TOTAL POPULATION OF STAFF
Academic Staff
1 Afe Babalola University 362
2 Babcock University 377
3 Bells University of Technology 200
3 Covenant University 476
4 Lead City University 296
6 Redeemer’s University 201
Total 1912
Source: Researcher’s Field Survey Result (2016)
3.4 Sample Size Determination
According to Aguirre-Urreta and Ronkko (2015), sample size determination consists of
selected elements from a population. Since it is not feasible to cover the entire population
because of the size and number of the private Universities in Nigeria, Afe Babalola,
Babcock University, Bells University of Technology, Covenant University, Lead City
University, and Redeemer’s University, representing about 25% of the population and
which are the best private Universities as ranked by the National Universities Commission
(2015) were considered as the sample size. However, the statistical information concerning
the selected Universities academic staff as at March 2016 is presented in the Table 3.2
below:
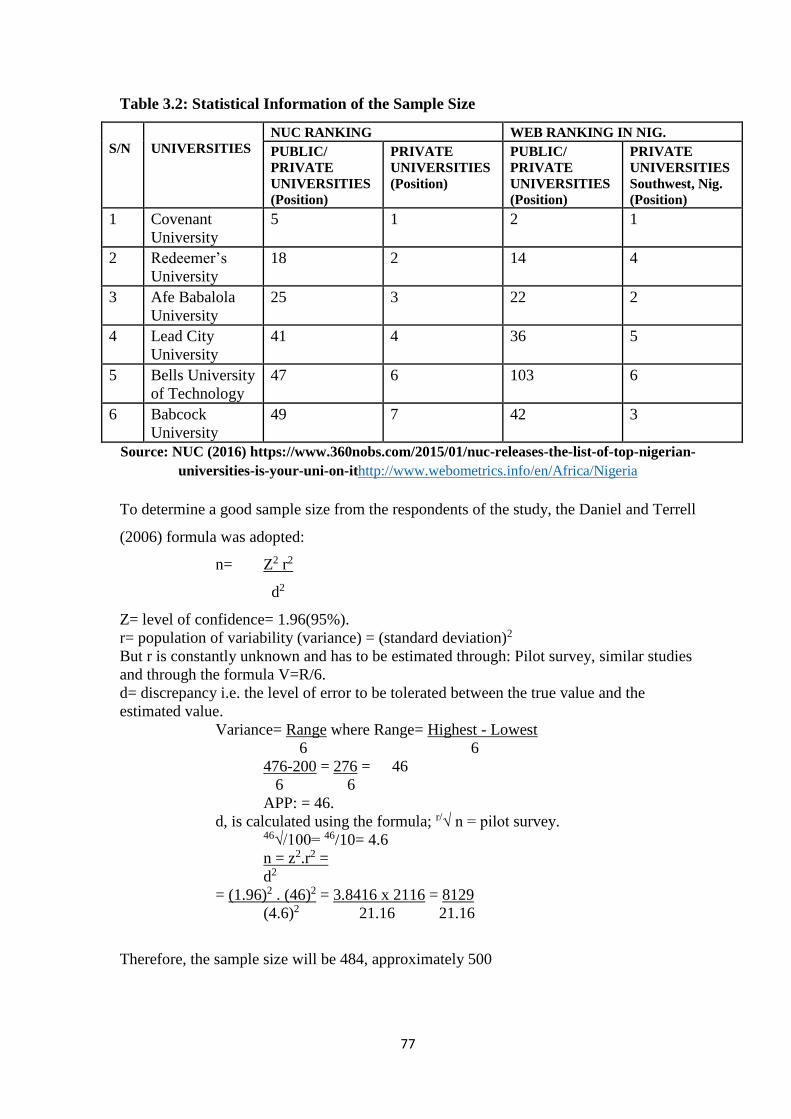
77
Table 3.2: Statistical Information of the Sample Size
S/N
UNIVERSITIES
NUC RANKING WEB RANKING IN NIG.
PUBLIC/
PRIVATE
UNIVERSITIES
(Position)
PRIVATE
UNIVERSITIES
(Position)
PUBLIC/
PRIVATE
UNIVERSITIES
(Position)
PRIVATE
UNIVERSITIES
Southwest, Nig.
(Position)
1 Covenant
University
5 1 2 1
2 Redeemer’s
University
18 2 14 4
3 Afe Babalola
University
25 3 22 2
4 Lead City
University
41 4 36 5
5 Bells University
of Technology
47 6 103 6
6 Babcock
University
49 7 42 3
Source: NUC (2016) https://www.360nobs.com/2015/01/nuc-releases-the-list-of-top-nigerian-
universities-is-your-uni-on-ithttp://www.webometrics.info/en/Africa/Nigeria
To determine a good sample size from the respondents of the study, the Daniel and Terrell
(2006) formula was adopted:
n= Z2 r2
d2
Z= level of confidence= 1.96(95%).
r= population of variability (variance) = (standard deviation)2
But r is constantly unknown and has to be estimated through: Pilot survey, similar studies
and through the formula V=R/6.
d= discrepancy i.e. the level of error to be tolerated between the true value and the
estimated value.
Variance= Range where Range= Highest - Lowest
6 6
476-200 = 276 = 46
6 6
APP: = 46.
d, is calculated using the formula; r/√ n = pilot survey. 46√/100= 46/10= 4.6
n = z2.r2 =
d2
= (1.96)2 . (46)2 = 3.8416 x 2116 = 8129
(4.6)2 21.16 21.16
Therefore, the sample size will be 484, approximately 500
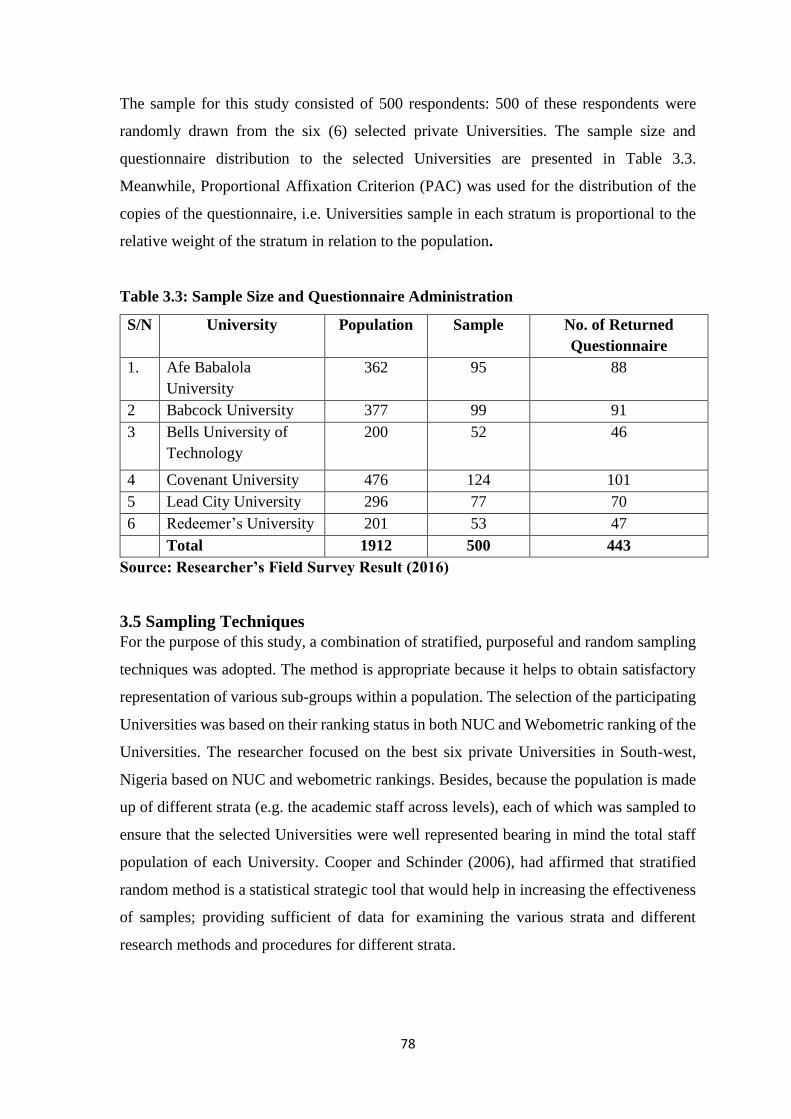
78
The sample for this study consisted of 500 respondents: 500 of these respondents were
randomly drawn from the six (6) selected private Universities. The sample size and
questionnaire distribution to the selected Universities are presented in Table 3.3.
Meanwhile, Proportional Affixation Criterion (PAC) was used for the distribution of the
copies of the questionnaire, i.e. Universities sample in each stratum is proportional to the
relative weight of the stratum in relation to the population.
Table 3.3: Sample Size and Questionnaire Administration
S/N University Population Sample No. of Returned
Questionnaire
1. Afe Babalola
University
362 95 88
2 Babcock University 377 99 91
3 Bells University of
Technology
200 52 46
4 Covenant University 476 124 101
5 Lead City University 296 77 70
6 Redeemer’s University 201 53 47
Total 1912 500 443
Source: Researcher’s Field Survey Result (2016)
3.5 Sampling Techniques
For the purpose of this study, a combination of stratified, purposeful and random sampling
techniques was adopted. The method is appropriate because it helps to obtain satisfactory
representation of various sub-groups within a population. The selection of the participating
Universities was based on their ranking status in both NUC and Webometric ranking of the
Universities. The researcher focused on the best six private Universities in South-west,
Nigeria based on NUC and webometric rankings. Besides, because the population is made
up of different strata (e.g. the academic staff across levels), each of which was sampled to
ensure that the selected Universities were well represented bearing in mind the total staff
population of each University. Cooper and Schinder (2006), had affirmed that stratified
random method is a statistical strategic tool that would help in increasing the effectiveness
of samples; providing sufficient of data for examining the various strata and different
research methods and procedures for different strata.
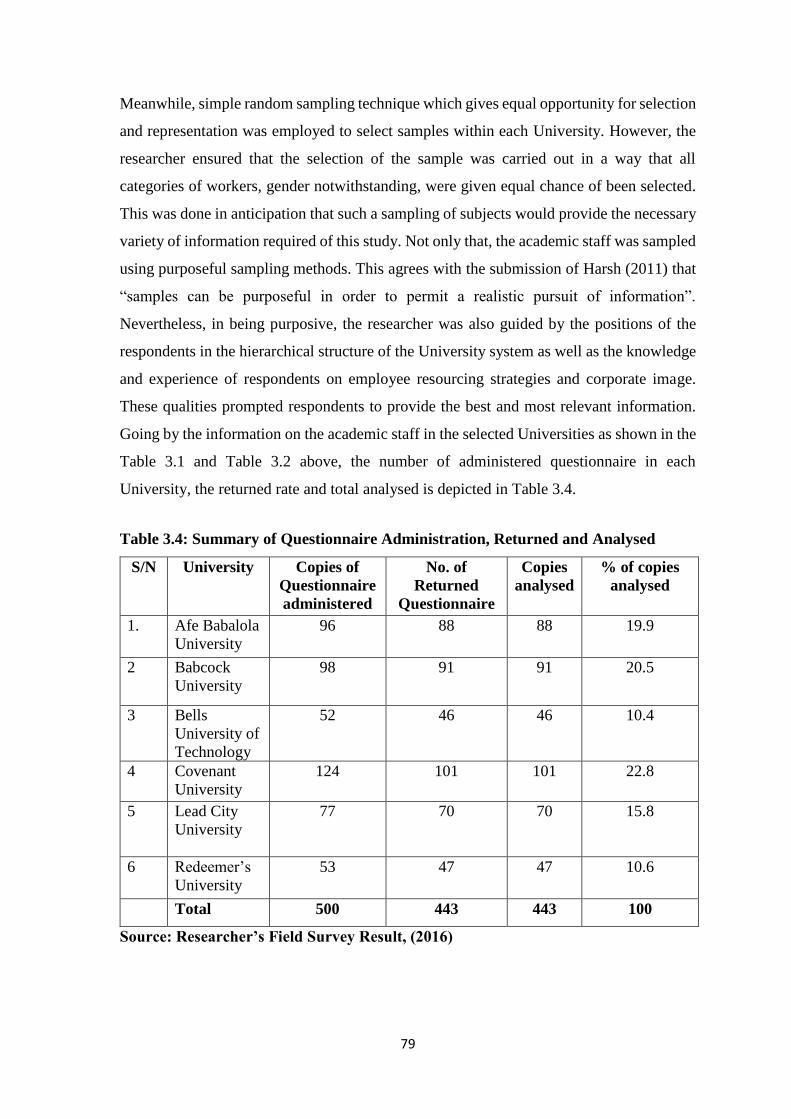
79
Meanwhile, simple random sampling technique which gives equal opportunity for selection
and representation was employed to select samples within each University. However, the
researcher ensured that the selection of the sample was carried out in a way that all
categories of workers, gender notwithstanding, were given equal chance of been selected.
This was done in anticipation that such a sampling of subjects would provide the necessary
variety of information required of this study. Not only that, the academic staff was sampled
using purposeful sampling methods. This agrees with the submission of Harsh (2011) that
“samples can be purposeful in order to permit a realistic pursuit of information”.
Nevertheless, in being purposive, the researcher was also guided by the positions of the
respondents in the hierarchical structure of the University system as well as the knowledge
and experience of respondents on employee resourcing strategies and corporate image.
These qualities prompted respondents to provide the best and most relevant information.
Going by the information on the academic staff in the selected Universities as shown in the
Table 3.1 and Table 3.2 above, the number of administered questionnaire in each
University, the returned rate and total analysed is depicted in Table 3.4.
Table 3.4: Summary of Questionnaire Administration, Returned and Analysed
S/N University Copies of
Questionnaire
administered
No. of
Returned
Questionnaire
Copies
analysed
% of copies
analysed
1. Afe Babalola
University
96 88 88 19.9
2 Babcock
University
98 91 91 20.5
3 Bells
University of
Technology
52 46 46 10.4
4 Covenant
University
124 101 101 22.8
5 Lead City
University
77 70 70 15.8
6 Redeemer’s
University
53 47 47 10.6
Total 500 443 443 100
Source: Researcher’s Field Survey Result, (2016)

80
From Table 3.4 above, out of 500 copies of questionnaire administered, 96 copies were
administered to Afe Babalola University out of which 88 were returned and same used for
analysis which represent 19.9% of the sample. 98 copies of questionnaire were
administered to Babcock University and 91(20.5%) were returned and used for the analysis.
For Bells University of Technology, a total of 52 copies of questionnaire administered out
of which 46 were returned and used for the analysis. In the remaining three Universities i.e.
Covenant University, Lead City University and Redeemer’s University, 124, 77 and 53
copies of questionnaire were administered respectively and 101, 70 and 47 copies were
retrieved and used for the analysis in that order.
3.6 Sample Frame
The sampling frame for this study consists of the list of all academic staff in the six (6)
selected private Universities in Southwest Nigeria. In addition, sample was drawn from all
categories of academic staff for their opinion about employee resourcing strategies in their
Universities and to determine the extent to which it has enhanced their performance in
building corporate image. The summary of the sampling frame is depicted in Table 3.5.
Table 3.5: Sample Frame
S/
N
University Population No. of Returned
Questionnaire
1 Covenant University 476 101
2 Redeemer’s University 201 47
3 Afe Babalola University 362 88
4 Lead City University 296 70
5 Babcock University 377 91
6 Bells University of Technology 200 46
Total 1912 443
Source: Researcher’s Field Survey Result, (2016)
3.7 : Source of Data
The study used both primary and secondary sources. Primary data for the study were
obtained through a well-structured questionnaire. This questionnaire was designed to elicit
information from the respondents. The instruments were administered to all categories of
teaching staff of the selected Universities who were knowledgeable and most likely to be
aware of employee resourcing strategies in their respective Universities. Meanwhile, the
81
secondary data were extracted from relevant journals, textbooks, seminar papers, e-library,
unpublished M.Sc. /Ph.D. Thesis, among others.
3.8 Research Instrument and Data Collection Methods
The mixed method (quantitative and qualitative) was adopted for this study
3.8.1: Quantitative Data
The researcher made use of questionnaire for this study. The questionnaire was specifically
designed to accomplish the objectives of the study. Meanwhile, the effectiveness of
employee resourcing strategies was measured using an appropriate item instrument which
was divided into two segments i.e. A and B. Section A comprised items used to gather
demographic and socio-economic characteristics of respondents such as their age, sex,
marital status, educational background, position, working experience; Section B was
divided into subsections which consists of items regarding the constructs of the subject
matter under consideration. Besides, five-point Likert scale (5-Strongly Agreed, 4- Agree,
3-Undecided, 2-Strongly Disagree, 1-Disagree) that best describes the extent to which the
respondents agreed with each item in the questionnaire was used.
Pilot study was carried out among twenty (20) senior colleagues and statisticians to
establish the adequacy and reliability of the instrument. A pilot study became necessary to
determine the content and construct validity of the instrument. The instrument was fine-
tuned based on the feedback from the pilot and 500 copies of the questionnaire were printed
and distributed accordingly. It is also important to note here that two research assistants
were engaged in the administration of the research instruments. The instruments were
adapted from previous studies (Gberevbie, 2008; Gberevbie, 2010; Akhigbe, 2013;
Oyetunde and Ayeni, 2014; Ogunyomi & Ojikutu, 2014; Satope.2014; Brewster, Brookes,
Croucher & Wood, 2014; Karemu, Gikera & Josee, 2014; Kepha et al. 2014; Ryan &
Ployhart, 2014; Karemu et al 2014; Presbitero et al, 2015; Ekwoaba et al. 2015; Tong,
2015; Gilbart, DeWinne & Sels. 2015; Abdul, 2015). Meanwhile, thematic analysis, which
enables researchers to develop a deeper appreciation for the group or situation they are
researching, was used for open-ended questions.
Data gathering is an indispensable characteristic of research study. Data collection is a
process of identifying the nature and topic and gathering data from these subjects (Collis
and Hussey, 2009). It must be noted that incorrect data collection is capable of affecting

82
the outcome of a study and ultimately will render the results invalid. However, data was
collected through a well-structured questionnaire that gave the respondents a reasonable
number of alternative choices from which they were privilege to choose most appropriate
decisions that gives expression to their view about the subject matter. Asika (2000) posited
that “a questionnaire consists of questions specifically designed to gather information or
data for analysis, the result of which will be used to answer the research questions and the
test of relevant hypotheses formulated”. Survey research method was used for this study
via the administration of copies of questionnaire to gather relevant information from
respondents. The respondents were encouraged to complete the questionnaire and these
were personally collected by the researcher and research assistants. The purpose of this was
to ensure a high return rate and encourage freedom of expression from the respondents.
3.8.2 Qualitative Data
Qualitative data were collected through In-depth Interview (IDI), the purpose of which is
to explore the individual meanings attached to employee resourcing strategies and its
effects on Universities’ corporate image. Eighteen (18) in-depth interviews were
conducted. Thus, the heads of establishment unit, registry and one principal senior
academic staff were purposively selected from each of the sampled private Universities.
The in-depth interviews were tape-recorded and conducted in English language. Besides, a
research assistant was engaged and adequately trained on the study instruments and data
collection procedures to get the work done in record time. It is also important to note that
the study adopted thematic analysis. The rationale behind this approach is because of its
theoretical freedom which could be inductive or theory-driven. Meanwhile, the focus was
on participants’ own experiences and level of information regarding the interview
questions. Moreover, semantic approach which allows themes to be identified from the
explicit or surface meanings of the data was adopted for the analysis (Clarke & Braun,
2013). This contrasts with analyses at the underlying level, where the researcher moves
beyond what the respondents said to ascertain fundamental thoughts that guides what
people say. To get full understanding and overview, the researcher read through all the
interviews and went back to each interview transcript and read them carefully. However, a
line-by-line coding was done ascribing each sentence in the interviews a code that described
the main essence of it. All data are coded into more abstract codes (Clarke & Braun, 2013).
83
3.9 Reliability and Validity of the Research Instrument
To ensure the reliability and validity of this research instrument, data collected from the
pilot survey was appraised to ascertain that instrument measured the precise variables it
intended to measure.
3.9.1 Validity
Asika (2000) noted that validity is the ability of a research instrument designed to measure
specific variables it sets out to measure. However, if it is not correctly designed, the purpose
of the research will be defeated. Efforts were made to put into perspective the internal or
external validity of the research. “Internal validity is the extent to which the effects noticed
in the study were a true reflection of reality other than being the result of the effects of
superfluous variables while external validity had to do with the extent to which the findings
of the study could be generalized” Asika (2000). Meanwhile, researchers have identified
four types of validity for measuring instruments, these are: content validity, construct
validity, criterion validity and face validity. These were given necessary considerations to
ensure that all questions that were asked in the questionnaire were fully exhausted. Besides,
efforts were made to ensure that instruments contained the important items to be measured
and as well determine the extent to which each item concurrently measures the issue under
investigation. It is important to state that the research instruments and sample size were
given strategic attention to ensure the generalisation of results within the Southwestern
zone. All these were carefully looked into in this study to ensure authenticity of the result.
3.9.2 Reliability
The essence of reliability is to ensure stability, dependability, accuracy, precision and
predictability of the measuring instrument and ensure the degree to which measurement of
the test are repeated to ensure consistency. Efforts were intensified to ensure that
instruments give similar, very close or the same results if the instruments are replicated. As
noted by Asika, (2000), a researcher can test for reliability through: “Test-re-test reliability,
multiple (alternate) form, split half technique and Cronbach’s alpha test”. However, the
higher the relationship between the two measurements, the higher will be the reliability of
the measuring instrument.
It is important to state that multiple or alternate forms of reliability attempt to test for
reliability by adopting the use of same measuring instruments administered on different

84
dimensions of the same variables. Once there is high association among the forms, the
reliability of the instrument is guaranteed. In split-half method, the researcher can randomly
assign measurement items into two equal parts and each part will be treated as an alternative
form of the same measurement. The Cronbach’s alpha test continues by connecting each
measurement item with every other measuring item and obtaining the average inter-
correlation for all the paired associations.
However, this study adopted a test-re-test method while Cronbach alpha reliability co-
efficient was measured to determine the level of reliability.
Table 3.6: Result of the Reliability Analysis
Variables Number of
Items
Cronbach’s Alpha
(Decision Rule)
Cronbach’s Alpha
(Results)
HR Planning Strategies
Brand Image
6 > 0.7 0.75
Recruitment Strategies
Research Image
7 > 0.7 0.76
Selection Strategies
Corporate Reputation
5 > 0.7 0.85
Retention Strategies
Corporate Identity
19 > 0.7 0.87
Job Performance 6 > 0.7 0.74
The reliability analysis result in Table 3.6 shows that all the variables are consistent and
reliable at Cronbach’s alpha values >0.70. Thus, the internal consistency of the measure
used in this study is considered acceptable.
3.10 Procedures for Data Presentation and Analysis
3.10.1 Quantitative Analysis
According to Daymon and Holloway (2002), data analysis is the “process of bringing order,
structure and meaning to the mass of unstructured data”. Data was collected, collated and
analysed with the use of manual and electronic methods using a data preparation grid and
85
SPSS software 21 and Structural Equation Modelling (AMOS 22), which enabled the
researcher to synthesise and summarise the quantitative data in a well-structured manner.
Descriptive and inferential methods of analysis were employed for this work. The
descriptive method was based on means and percentage analysis of the study while
inferential method was used to measure the formulated hypotheses. For hypotheses 3 and
4 Pearson Product Moment Correlation Coefficients (PPMCC), which most of the time is
used to measures the extent of relationships between variables, was used to measure the
relationship while Partial Correlation was used for 5. Besides, for Hypotheses 1and 2, the
researcher used Regression which most of the time is used to measure the prediction of
relationships and contributions of variables to a system of equation. Meanwhile, structural
equation modelling was also adopted to consolidate the regression and correlation
coefficients for the analysis.
3.10.2: Qualitative Analysis (IDI)
Every interview started with an introduction of the objective of the research and thereafter
the consents of the respondents were solicited. The interview guide (See appendix 2)
consisted of five questions. The first question was to identify the name of the University
the respondents represented, and the second question was to find out the recruitment and
selection strategies that the management of each University had put in place to attract
academic staff with distinctive capabilities. The third question was to find out the various
kinds of retention challenges faced by each school as well as strategies put in place to retain
competent employees. Similarly, the fourth question attempted to find out measures put in
place by each University to ensure optimal performance while the last question was to find
out the status of the University’s image. At the end of the interview, participants were asked
if they had something else to discuss in order to ascertain if some important aspects were
not left out unattended to. All the interviews were tape-recorded and individual respondents
body language was also noted. The reason is because body language sometimes is crucial
for understanding the meaning of an utterance. It is also important to report that the
researcher took time to summarise what each respondent said and asked the participants if
the researcher’s interpretation was correct in order to avoid misunderstanding. The
interviews were conducted in individual respondents’ offices within their University
premises.
86
The material analysed consisted of the transcriptions from the interviews and notes taken
during the interview. It must be noted that the interviews were transcribed verbatim within
the first two days after the interview took place. This was to ensure that what the
respondents said and their body languages were remembered. This was done to avoid
controversy that could affect the transcriptions. It has been argued that transformation of
oral responses to written text represents a re-construction of statement made and not direct
copy. In order to prevent this, verbatim transcription was done few days after the
interviews. It is worthy of note that all personal information about respondents were made
anonymous in the transcripts and the presentation.
3.11 Ethical Consideration
As noted by Arbnor and Bjerke (1997), all workers in an organisation or individuals within
a society have a right to be protected from public scrutiny of their private life. Therefore,
the researcher ensured that participating respondents were well informed about the
background and purpose of this study and how their participating activity would be enacted.
However, every participant was offered the possibility to stay anonymous and their
responses treated with utmost confidentiality. Meanwhile, the participants’ right, dignity,
safety, wellbeing were assured and individuals were given the privilege to discontinue at
whatever stage if they feel otherwise.
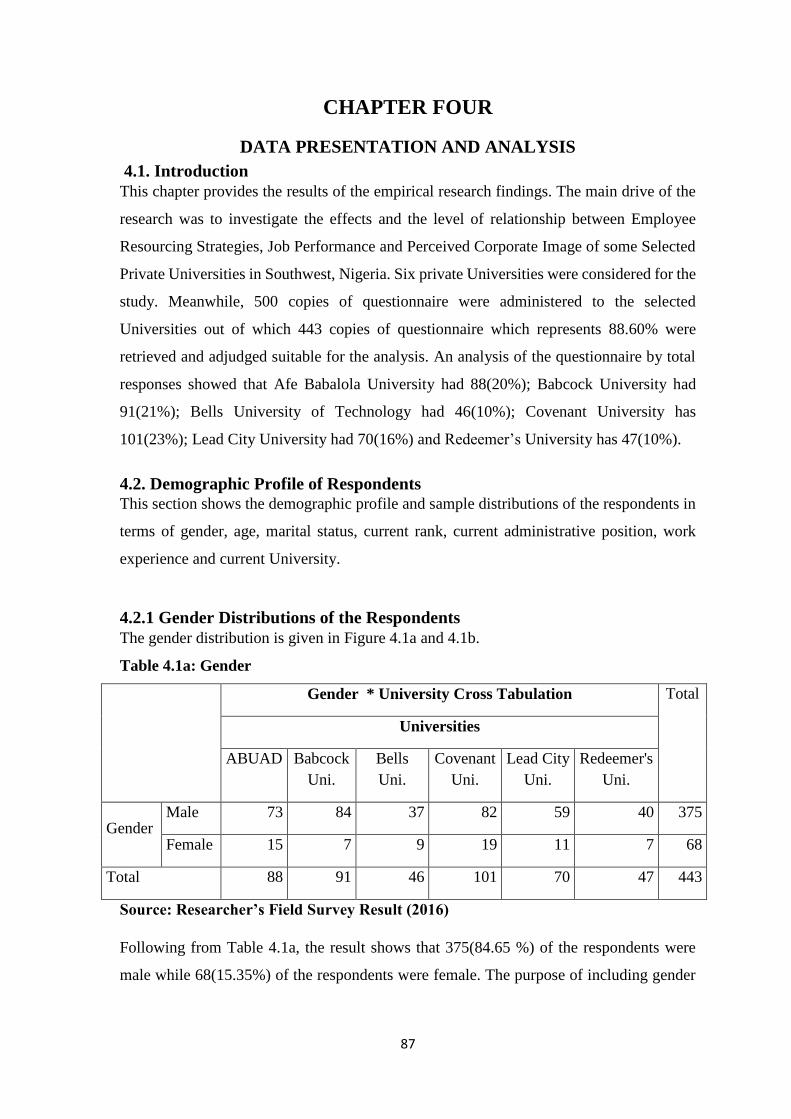
87
CHAPTER FOUR
DATA PRESENTATION AND ANALYSIS
4.1. Introduction
This chapter provides the results of the empirical research findings. The main drive of the
research was to investigate the effects and the level of relationship between Employee
Resourcing Strategies, Job Performance and Perceived Corporate Image of some Selected
Private Universities in Southwest, Nigeria. Six private Universities were considered for the
study. Meanwhile, 500 copies of questionnaire were administered to the selected
Universities out of which 443 copies of questionnaire which represents 88.60% were
retrieved and adjudged suitable for the analysis. An analysis of the questionnaire by total
responses showed that Afe Babalola University had 88(20%); Babcock University had
91(21%); Bells University of Technology had 46(10%); Covenant University has
101(23%); Lead City University had 70(16%) and Redeemer’s University has 47(10%).
4.2. Demographic Profile of Respondents
This section shows the demographic profile and sample distributions of the respondents in
terms of gender, age, marital status, current rank, current administrative position, work
experience and current University.
4.2.1 Gender Distributions of the Respondents
The gender distribution is given in Figure 4.1a and 4.1b.
Table 4.1a: Gender
Gender * University Cross Tabulation Total
Universities
ABUAD Babcock
Uni.
Bells
Uni.
Covenant
Uni.
Lead City
Uni.
Redeemer's
Uni.
Gender Male 73 84 37 82 59 40 375
Female 15 7 9 19 11 7 68
Total 88 91 46 101 70 47 443
Source: Researcher’s Field Survey Result (2016)
Following from Table 4.1a, the result shows that 375(84.65 %) of the respondents were
male while 68(15.35%) of the respondents were female. The purpose of including gender
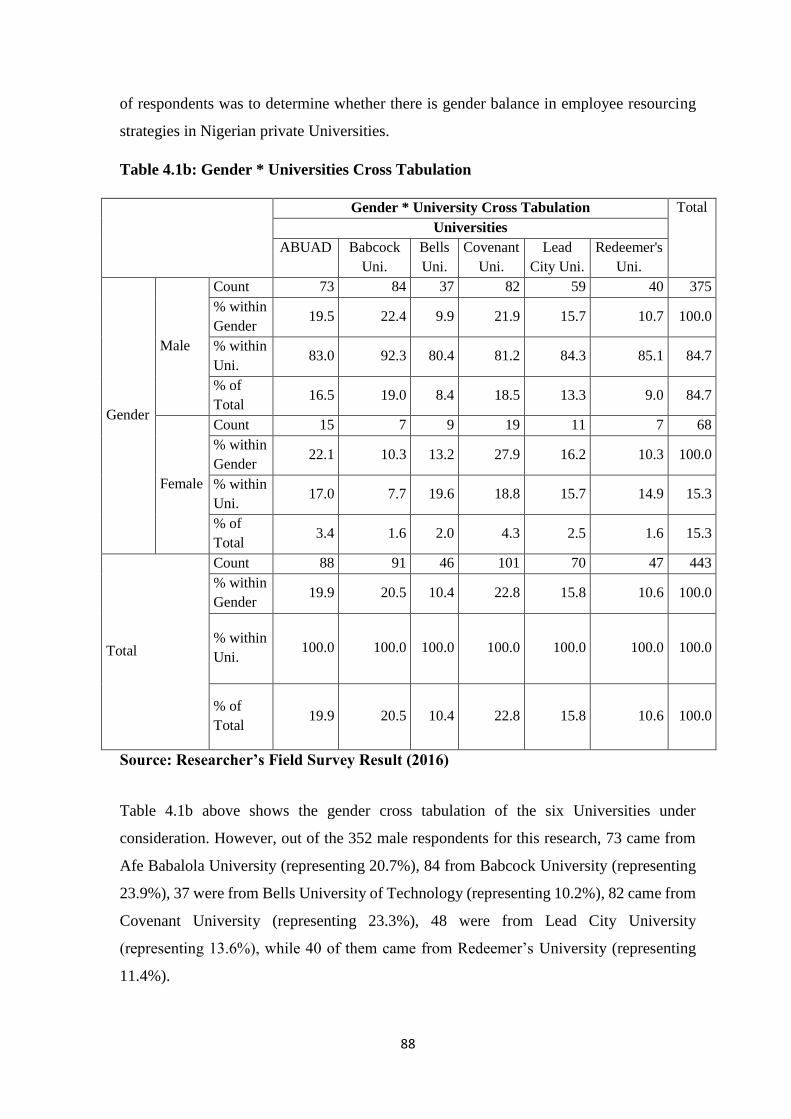
88
of respondents was to determine whether there is gender balance in employee resourcing
strategies in Nigerian private Universities.
Table 4.1b: Gender * Universities Cross Tabulation
Gender * University Cross Tabulation Total
Universities
ABUAD Babcock
Uni.
Bells
Uni.
Covenant
Uni.
Lead
City Uni.
Redeemer's
Uni.
Gender
Male
Count 73 84 37 82 59 40 375
% within
Gender 19.5 22.4 9.9 21.9 15.7 10.7 100.0
% within
Uni. 83.0 92.3 80.4 81.2 84.3 85.1 84.7
% of
Total 16.5 19.0 8.4 18.5 13.3 9.0 84.7
Female
Count 15 7 9 19 11 7 68
% within
Gender 22.1 10.3 13.2 27.9 16.2 10.3 100.0
% within
Uni. 17.0 7.7 19.6 18.8 15.7 14.9 15.3
% of
Total 3.4 1.6 2.0 4.3 2.5 1.6 15.3
Total
Count 88 91 46 101 70 47 443
% within
Gender 19.9 20.5 10.4 22.8 15.8 10.6 100.0
% within
Uni. 100.0 100.0 100.0 100.0 100.0 100.0 100.0
% of
Total 19.9 20.5 10.4 22.8 15.8 10.6 100.0
Source: Researcher’s Field Survey Result (2016)
Table 4.1b above shows the gender cross tabulation of the six Universities under
consideration. However, out of the 352 male respondents for this research, 73 came from
Afe Babalola University (representing 20.7%), 84 from Babcock University (representing
23.9%), 37 were from Bells University of Technology (representing 10.2%), 82 came from
Covenant University (representing 23.3%), 48 were from Lead City University
(representing 13.6%), while 40 of them came from Redeemer’s University (representing
11.4%).
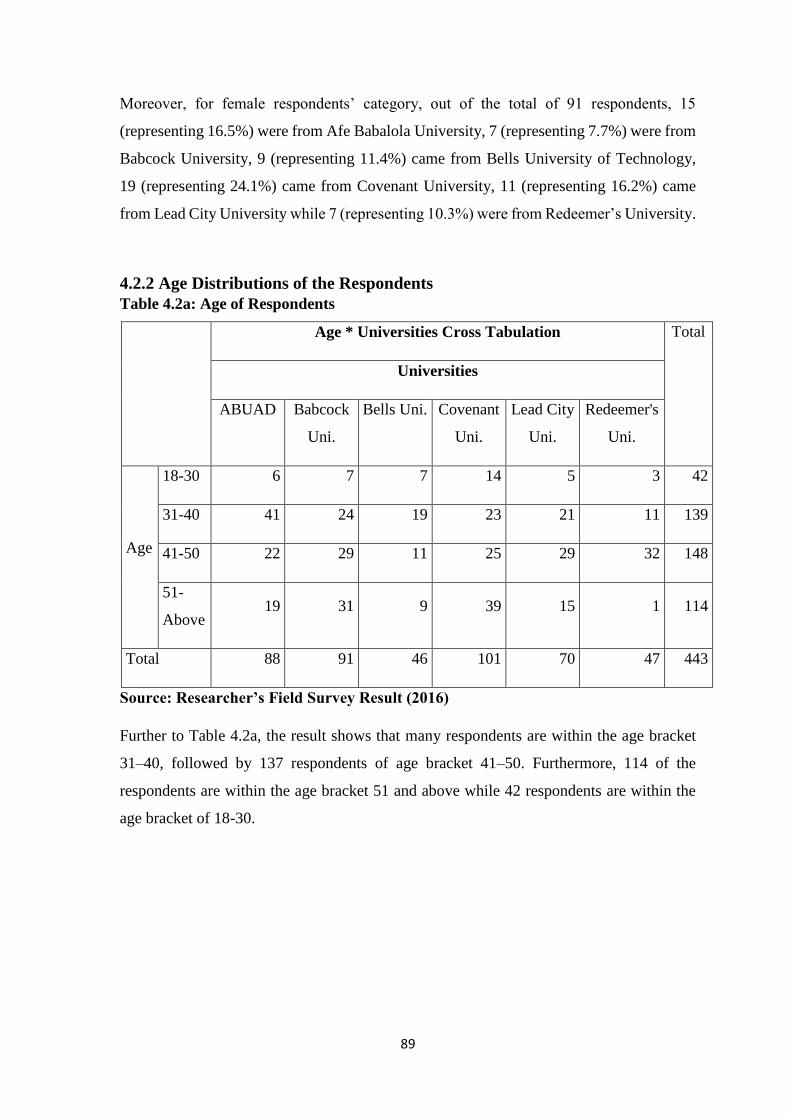
89
Moreover, for female respondents’ category, out of the total of 91 respondents, 15
(representing 16.5%) were from Afe Babalola University, 7 (representing 7.7%) were from
Babcock University, 9 (representing 11.4%) came from Bells University of Technology,
19 (representing 24.1%) came from Covenant University, 11 (representing 16.2%) came
from Lead City University while 7 (representing 10.3%) were from Redeemer’s University.
4.2.2 Age Distributions of the Respondents
Table 4.2a: Age of Respondents
Age * Universities Cross Tabulation Total
Universities
ABUAD Babcock
Uni.
Bells Uni. Covenant
Uni.
Lead City
Uni.
Redeemer's
Uni.
Age
18-30 6 7 7 14 5 3 42
31-40 41 24 19 23 21 11 139
41-50 22 29 11 25 29 32 148
51-
Above 19 31 9 39 15 1 114
Total 88 91 46 101 70 47 443
Source: Researcher’s Field Survey Result (2016)
Further to Table 4.2a, the result shows that many respondents are within the age bracket
31–40, followed by 137 respondents of age bracket 41–50. Furthermore, 114 of the
respondents are within the age bracket 51 and above while 42 respondents are within the
age bracket of 18-30.

90
Table 4.2b: Age of Respondents * Universities Sampled Cross Tabulation
Age * Universities Cross Tabulation
Universities Total
ABUAD Babcock
University
Bells
Uni.
Covenant
Uni.
Lead City
Uni.
Redeemer's
Uni.
Age
18-30
Count 6 7 7 14 5 3 42
%
within
Age
14.3 16.7 16.7 33.3 11.9 7.1 100.0
%
within
Uni.
6.8 7.7 15.2 13.9 7.1 6.4 9.5
% of
Total 1.4 1.6 1.6 3.2 1.1 0.7 9.5
31-40
Count 41 24 19 23 21 11 139
%
within
Age
29.5 17.3 13.7 16.5 15.1 7.9 100.0
%
within
Uni.
46.6 26.4 41.3 22.8 30.0 23.4 31.4
% of
Total 9.3 5.4 4.3 5.2 4.7 2.5 31.4
41-50
Count 22 29 11 25 29 32 148
%
within
Age
14.9 19.6 7.4 16.9 19.6 21.6 100.0
%
within
Uni.
25.0 31.9 23.9 24.8 41.4 68.1 33.4
% of
Total 5.0 6.5 2.5 5.6 6.5 7.2 33.4
51-
Above
Count 19 31 9 39 15 1 114
%
within
Age
16.7 27.2 7.9 34.2 13.2 0.9 100.0

91
Source: Researcher’s Field Survey Result (2016)
Further to Table 4.2b, the result shows that that out of the 42 respondents between age
bracket 18-30, 6 came from Afe Babalola University (representing 14.3.7%), 7 from
Babcock University (representing 16.7.9%), 7 were from Bells University of Technology
(representing 16.7%), 14 came from Covenant University (representing 33.3%), 48 were
from Lead City University (representing 11.9%), while 3 of them came from Redeemer’s
University (representing 7.1%). However, out of 139 respondents that are within the age
bracket 31-40, 41 came from Afe Babalola University (representing 29.5%), 24 from
Babcock University (representing 17.3%), 19 were from Bells University of Technology
(representing 13.7%), 23 came from Covenant University (representing 16.5%), 21 were
from Lead City University (representing 15.1%), while 11 of them came from Redeemer’s
University (representing 7.9%).
The table also reveals that, out of 148 respondents that are within the age bracket 41-50, 22
came from Afe Babalola University (representing 14.9%), 29 from Babcock University
(representing 19.6%), 11 were from Bells University of Technology (representing 7.4%),
25 came from Covenant University (representing 16.9%), 29 were from Lead City
University (representing 19.6%), while 32 of them came from Redeemer’s University
(representing 21.6%). Besides, it was also discovered that out of 114 respondents that are
within the age bracket of 51 years and above, 19 came from Afe Babalola University
%
within
Uni.
21.6 34.1 19.6 38.6 21.4 2.1 25.7
% of
Total 4.3 7.0 2.0 8.8 3.4 0.2 25.7
Total
Count 88 91 46 101 70 47 443
%
within
Age
19.9 20.5 10.4 22.8 15.8 10.6 100.0
%
within
Uni.
100.0 100.0 100.0 100.0 100.0 100.0 100.0
% of
Total 19.9 20.5 10.4 22.8 15.8 10.6 100.0
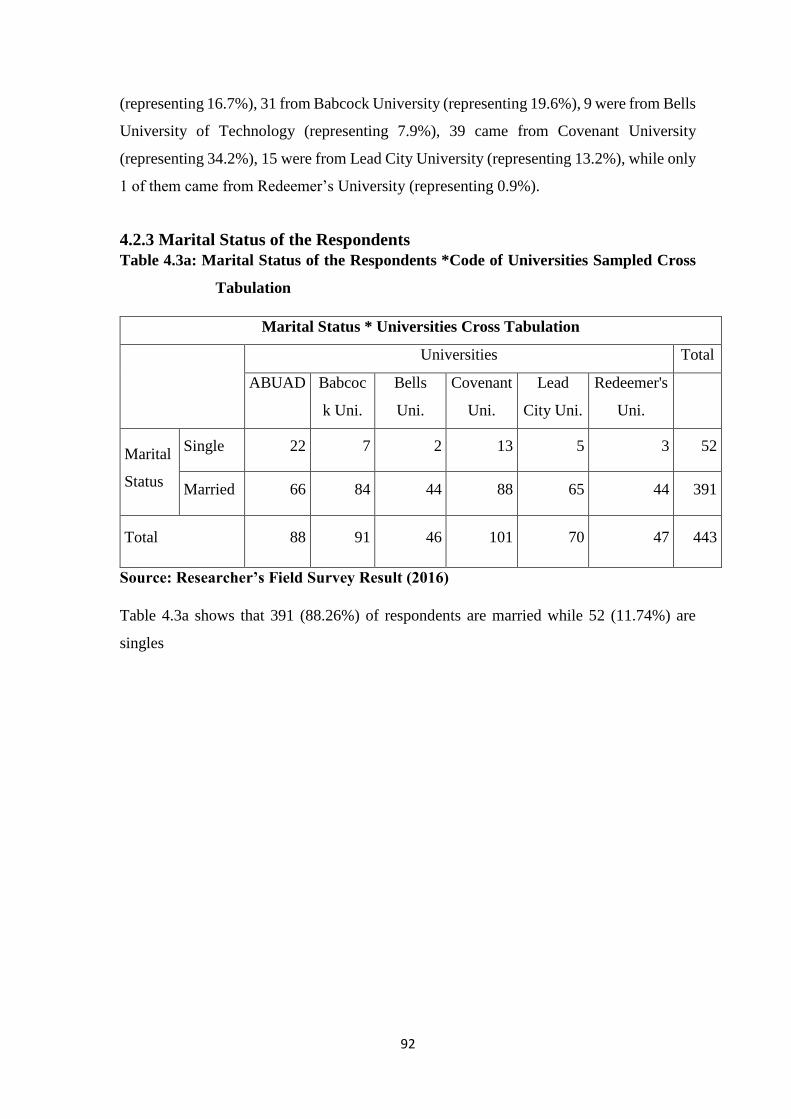
92
(representing 16.7%), 31 from Babcock University (representing 19.6%), 9 were from Bells
University of Technology (representing 7.9%), 39 came from Covenant University
(representing 34.2%), 15 were from Lead City University (representing 13.2%), while only
1 of them came from Redeemer’s University (representing 0.9%).
4.2.3 Marital Status of the Respondents
Table 4.3a: Marital Status of the Respondents *Code of Universities Sampled Cross
Tabulation
Marital Status * Universities Cross Tabulation
Universities Total
ABUAD Babcoc
k Uni.
Bells
Uni.
Covenant
Uni.
Lead
City Uni.
Redeemer's
Uni.
Marital
Status
Single 22 7 2 13 5 3 52
Married 66 84 44 88 65 44 391
Total 88 91 46 101 70 47 443
Source: Researcher’s Field Survey Result (2016)
Table 4.3a shows that 391 (88.26%) of respondents are married while 52 (11.74%) are
singles
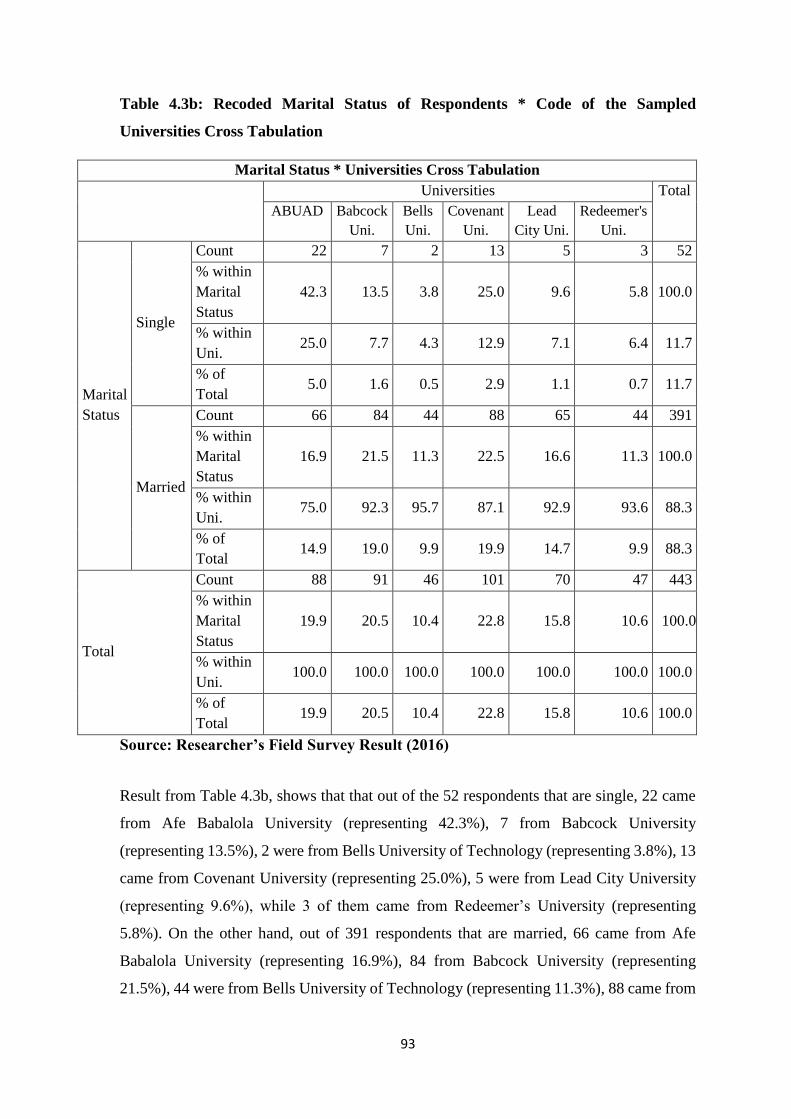
93
Table 4.3b: Recoded Marital Status of Respondents * Code of the Sampled
Universities Cross Tabulation
Marital Status * Universities Cross Tabulation
Universities Total
ABUAD Babcock
Uni.
Bells
Uni.
Covenant
Uni.
Lead
City Uni.
Redeemer's
Uni.
Marital
Status
Single
Count 22 7 2 13 5 3 52
% within
Marital
Status
42.3 13.5 3.8 25.0 9.6 5.8 100.0
% within
Uni. 25.0 7.7 4.3 12.9 7.1 6.4 11.7
% of
Total 5.0 1.6 0.5 2.9 1.1 0.7 11.7
Married
Count 66 84 44 88 65 44 391
% within
Marital
Status
16.9 21.5 11.3 22.5 16.6 11.3 100.0
% within
Uni. 75.0 92.3 95.7 87.1 92.9 93.6 88.3
% of
Total 14.9 19.0 9.9 19.9 14.7 9.9 88.3
Total
Count 88 91 46 101 70 47 443
% within
Marital
Status
19.9 20.5 10.4 22.8 15.8 10.6 100.0
% within
Uni. 100.0 100.0 100.0 100.0 100.0 100.0 100.0
% of
Total 19.9 20.5 10.4 22.8 15.8 10.6 100.0
Source: Researcher’s Field Survey Result (2016)
Result from Table 4.3b, shows that that out of the 52 respondents that are single, 22 came
from Afe Babalola University (representing 42.3%), 7 from Babcock University
(representing 13.5%), 2 were from Bells University of Technology (representing 3.8%), 13
came from Covenant University (representing 25.0%), 5 were from Lead City University
(representing 9.6%), while 3 of them came from Redeemer’s University (representing
5.8%). On the other hand, out of 391 respondents that are married, 66 came from Afe
Babalola University (representing 16.9%), 84 from Babcock University (representing
21.5%), 44 were from Bells University of Technology (representing 11.3%), 88 came from

94
Covenant University (representing 22.5%), 65 were from Lead City University
(representing 16.6%), while 44 of them came from Redeemer’s University (representing
11.3%).
4.2.4 Current Rank/Level of the Respondents in the Universities
The respondents for this study fall into six categories which are: Professor, Associate
Professor/Reader, Senior Lecturer, Lecturer 1, Lecturer II and Assistant Lecturer. All of
them were considered with regards to their perceptions concerning employee resourcing
strategies and corporate image of their Universities.
Table 4. 4a: Rank in the University
Current Rank * Universities Cross Tabulation
Count
Universities Total
ABUAD Babcock
Uni.
Bells
Uni.
Covenant
Uni.
Lead
City Uni.
Redeemer's
Uni.
Current
Rank
Prof. 9 9 6 11 5 6 46
Associate
Prof. 4 9 8 10 4 6 41
Snr.
Lecturer 21 28 6 30 20 14 119
Lecturer I 31 21 18 20 29 13 132
Lecturer2 16 17 6 14 7 5 65
Assistant
Lecturer 7 7 2 16 5 3 40
Total 88 91 46 101 70 47 443
Source: Researcher’s Field Survey Result (2016)
Table 4.4a shows that 89 or 19.64% of the respondents were on Professorial cadre, 119 or
26.87% are on Senior Lecturer cadre, 132 or 29.80% of the respondents were on Lecturer
I cadre, 65 (14.68%) and 40 (9.03%) were on Lecturer II and Assistant Lecturer cadre
respectively.
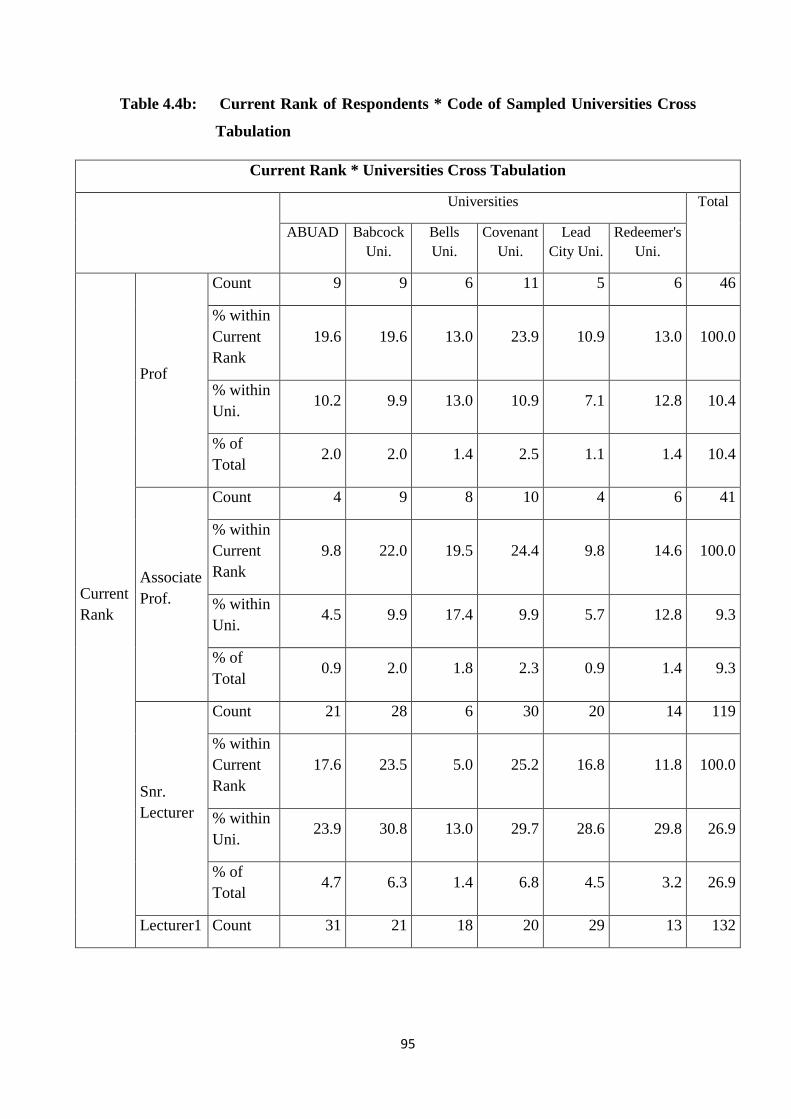
95
Table 4.4b: Current Rank of Respondents * Code of Sampled Universities Cross
Tabulation
Current Rank * Universities Cross Tabulation
Universities Total
ABUAD Babcock
Uni.
Bells
Uni.
Covenant
Uni.
Lead
City Uni.
Redeemer's
Uni.
Current
Rank
Prof
Count 9 9 6 11 5 6 46
% within
Current
Rank
19.6 19.6 13.0 23.9 10.9 13.0 100.0
% within
Uni. 10.2 9.9 13.0 10.9 7.1 12.8 10.4
% of
Total 2.0 2.0 1.4 2.5 1.1 1.4 10.4
Associate
Prof.
Count 4 9 8 10 4 6 41
% within
Current
Rank
9.8 22.0 19.5 24.4 9.8 14.6 100.0
% within
Uni. 4.5 9.9 17.4 9.9 5.7 12.8 9.3
% of
Total 0.9 2.0 1.8 2.3 0.9 1.4 9.3
Snr.
Lecturer
Count 21 28 6 30 20 14 119
% within
Current
Rank
17.6 23.5 5.0 25.2 16.8 11.8 100.0
% within
Uni. 23.9 30.8 13.0 29.7 28.6 29.8 26.9
% of
Total 4.7 6.3 1.4 6.8 4.5 3.2 26.9
Lecturer1 Count 31 21 18 20 29 13 132

96
% within
Current
Rank
23.5 15.9 13.6 15.2 22.0 9.8 100.0
% within
Uni. 35.2 23.1 39.1 19.8 41.4 27.7 29.8
% of
Total 7.0 4.7 4.1 4.5 6.5 2.9 29.8
Lecturer
II
Count 16 17 6 14 7 5 65
% within
Current
Rank
24.6 26.2 9.2 21.5 10.8 7.7 100.0
% within
Uni. 18.2 18.7 13.0 13.9 10.0 10.6 14.7
% of
Total 3.6 3.8 1.4 3.2 1.6 1.1 14.7
Assistant.
Lecturer
Count 7 7 2 16 5 3 40
% within
Current
Rank
17.5 17.5 5.0 40.0 12.5 7.5 100.0
% within
Uni. 8.0 7.7 4.3 15.8 7.1 6.4 9.0
% of
Total 1.6 1.6 0.5 3.6 1.1 0.7 9.0
Total
Count 88 91 46 101 70 47 443
% within
Current
Rank
19.9 20.5 10.4 22.8 15.8 10.6 100.0
% within
Uni. 100.0 100.0 100.0 100.0 100.0 100.0 100.0
% of
Total 19.9 20.5 10.4 22.8 15.8 10.6 100.0
Source: Researcher’s Field Survey Result (2016)
97
Table 4.4b shows that out of the 46 respondents who are professors, 9 came from Afe
Babalola University (representing 19.6%), 9 from Babcock University (representing
19.6%), 6 were from Bells University of Technology (representing 13.0%), 11 came from
Covenant University (representing 23.9%), 5 were from Lead City University (representing
10.9%), while 6 of them came from Redeemer’s University (representing 13.0%).
Similarly, 41 of the respondents are Associate Professors/Readers out of which 4 came
from Afe Babalola University (representing 9.8%), 9 of the came from Babcock University
(representing 22.0%), 8 were from Bells University of Technology (representing 19.5%),
10 came from Covenant University (representing 24.4%), 4 were from Lead City
University (representing 9.8%), while 6 of them came from Redeemer’s University
(representing 17.6%). The table also shows that out of 119 Senior Lecturers, 21 of them
came from Afe Babalola University (representing 17.6%), 28 came from Babcock
University (representing 23.5%), 6 were from Bells University of Technology (representing
5.0%), 30 came from Covenant University (representing 25.2%), 20 were from Lead City
University (representing 16.8%), while 14 of them came from Redeemer’s University
(representing 11.8%).
In a related development, out of 132 respondents who are in Lecture I cadre, 31 were from
Afe Babalola University (representing 23.5%), 21 from Babcock University (representing
15.9%), 18 were from Bells University of Technology (representing 13.6%), 20 came from
Covenant University (representing 15.2%), 29 were from Lead City University
(representing 22.0%), while 13 of them came from Redeemer’s University (representing
9.8%). It was also discovered that out of 65 respondents who are on Lecturer II cadre, 16
were from Afe Babalola University (representing 24.6%), 17 came from Babcock
University (representing 26.2%), 6 were from Bells University of Technology (representing
9.2%), 14 came from Covenant University (representing 21.5%), 7 were from Lead City
University (representing 10.8%) and 5 of them came from Redeemer’s University
(representing 7.7%). The table also indicates thatof 40 Assistant Lecturers, 7 of them came
from Afe Babalola University (representing 17.5%), 7 came from Babcock University
(representing 17.5%), 2 were from Bells University of Technology (representing 5.0%), 16
came from Covenant University (representing 40.0%), 5 were from Lead City University
(representing 12.5%), while 3 of them came from Redeemer’s University (representing
7.5%).
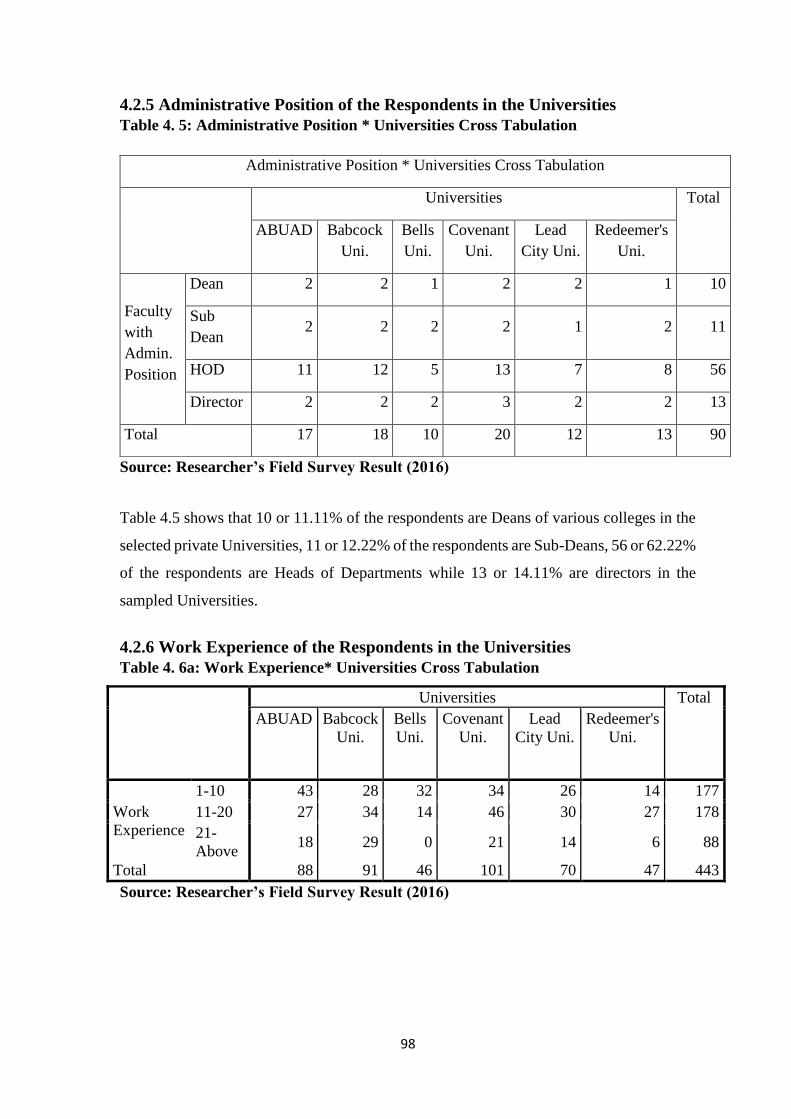
98
4.2.5 Administrative Position of the Respondents in the Universities
Table 4. 5: Administrative Position * Universities Cross Tabulation
Source: Researcher’s Field Survey Result (2016)
Table 4.5 shows that 10 or 11.11% of the respondents are Deans of various colleges in the
selected private Universities, 11 or 12.22% of the respondents are Sub-Deans, 56 or 62.22%
of the respondents are Heads of Departments while 13 or 14.11% are directors in the
sampled Universities.
4.2.6 Work Experience of the Respondents in the Universities
Table 4. 6a: Work Experience* Universities Cross Tabulation
Universities Total
ABUAD Babcock
Uni.
Bells
Uni.
Covenant
Uni.
Lead
City Uni.
Redeemer's
Uni.
Work
Experience
1-10 43 28 32 34 26 14 177
11-20 27 34 14 46 30 27 178
21-
Above 18 29 0 21 14 6 88
Total 88 91 46 101 70 47 443
Source: Researcher’s Field Survey Result (2016)
Administrative Position * Universities Cross Tabulation
Universities Total
ABUAD Babcock
Uni.
Bells
Uni.
Covenant
Uni.
Lead
City Uni.
Redeemer's
Uni.
Faculty
with
Admin.
Position
Dean 2 2 1 2 2 1 10
Sub
Dean 2 2 2 2 1 2 11
HOD 11 12 5 13 7 8 56
Director 2 2 2 3 2 2 13
Total 17 18 10 20 12 13 90
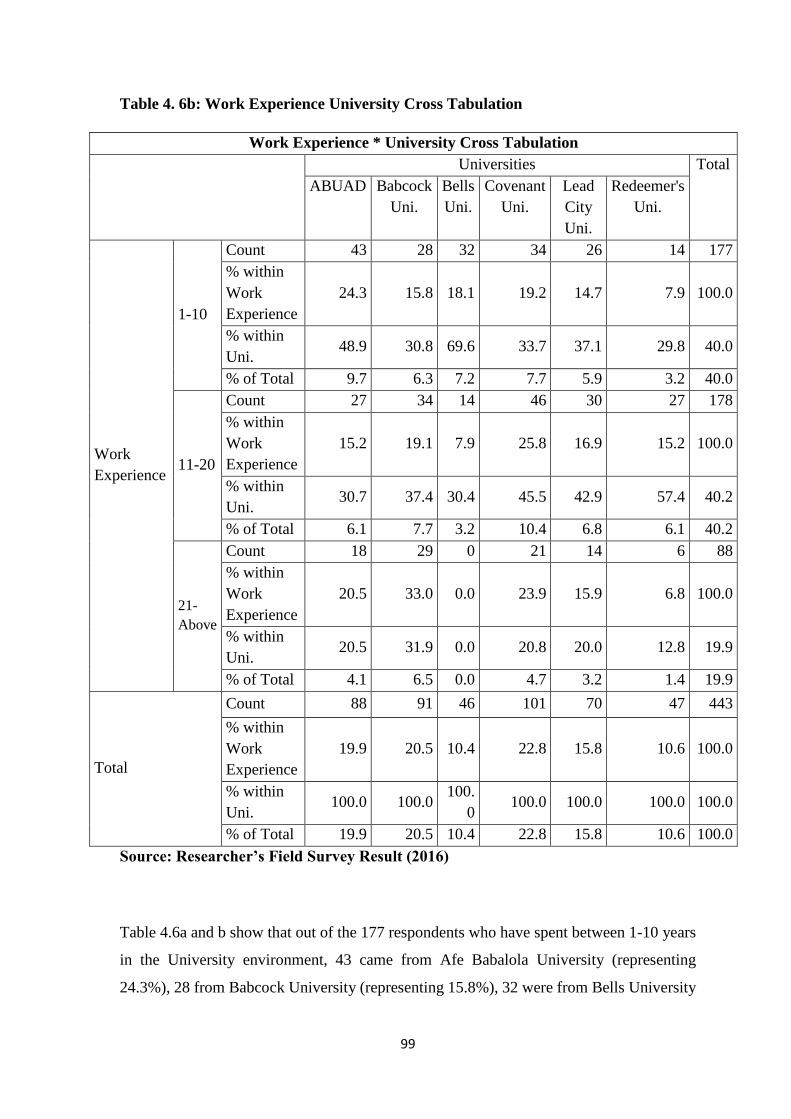
99
Table 4. 6b: Work Experience University Cross Tabulation
Work Experience * University Cross Tabulation
Universities Total
ABUAD Babcock
Uni.
Bells
Uni.
Covenant
Uni.
Lead
City
Uni.
Redeemer's
Uni.
Work
Experience
1-10
Count 43 28 32 34 26 14 177
% within
Work
Experience
24.3 15.8 18.1 19.2 14.7 7.9 100.0
% within
Uni. 48.9 30.8 69.6 33.7 37.1 29.8 40.0
% of Total 9.7 6.3 7.2 7.7 5.9 3.2 40.0
11-20
Count 27 34 14 46 30 27 178
% within
Work
Experience
15.2 19.1 7.9 25.8 16.9 15.2 100.0
% within
Uni. 30.7 37.4 30.4 45.5 42.9 57.4 40.2
% of Total 6.1 7.7 3.2 10.4 6.8 6.1 40.2
21-
Above
Count 18 29 0 21 14 6 88
% within
Work
Experience
20.5 33.0 0.0 23.9 15.9 6.8 100.0
% within
Uni. 20.5 31.9 0.0 20.8 20.0 12.8 19.9
% of Total 4.1 6.5 0.0 4.7 3.2 1.4 19.9
Total
Count 88 91 46 101 70 47 443
% within
Work
Experience
19.9 20.5 10.4 22.8 15.8 10.6 100.0
% within
Uni. 100.0 100.0
100.
0 100.0 100.0 100.0 100.0
% of Total 19.9 20.5 10.4 22.8 15.8 10.6 100.0
Source: Researcher’s Field Survey Result (2016)
Table 4.6a and b show that out of the 177 respondents who have spent between 1-10 years
in the University environment, 43 came from Afe Babalola University (representing
24.3%), 28 from Babcock University (representing 15.8%), 32 were from Bells University

100
of Technology (representing 18.1%), 34 came from Covenant University (representing
19.2%), 26 were from Lead City University (representing 14.7%), while 14 of them came
from Redeemer’s University (representing 7.9%). Meanwhile, out of 178 respondents who
have between 11-20 years working experience, 27 of them came from Afe Babalola
University (representing 15.2%), 34 of the came from Babcock University (representing
19.1%), 14 were from Bells University of Technology (representing 7.9%), 46 came from
Covenant University (representing 25.8%), 30 were from Lead City University
(representing 16.9%), while 27 of them came from Redeemer’s University (representing
15.2%).
The table also shows that out of 88 respondents who have spent over 21 years in the
University environment, 18 of them came from Afe Babalola University (representing
20.5%), 29 came from Babcock University (representing 33.0%), none from Bells
University of Technology, 21 came from Covenant University (representing 23.9%), 14
were from Lead City University (representing 15.9%), while 6 of them came from
Redeemer’s University (representing 6.8%).
4.3 Descriptive Statistics
Table 4.7 depicts the descriptive statistics of the constructs revealing the mean, standard
deviation, skewness and Kurtosis scores of the constructs. 5-point Likert scale ranging from
strongly agree represented by 5 to strongly disagree represented by 1 for all the variables
are computed to show the age of the respondents that either strongly agreed or tended to
disagree with the items of the variables. The mean scores are obtained by compiling the
mean scores of all the items in each variable.
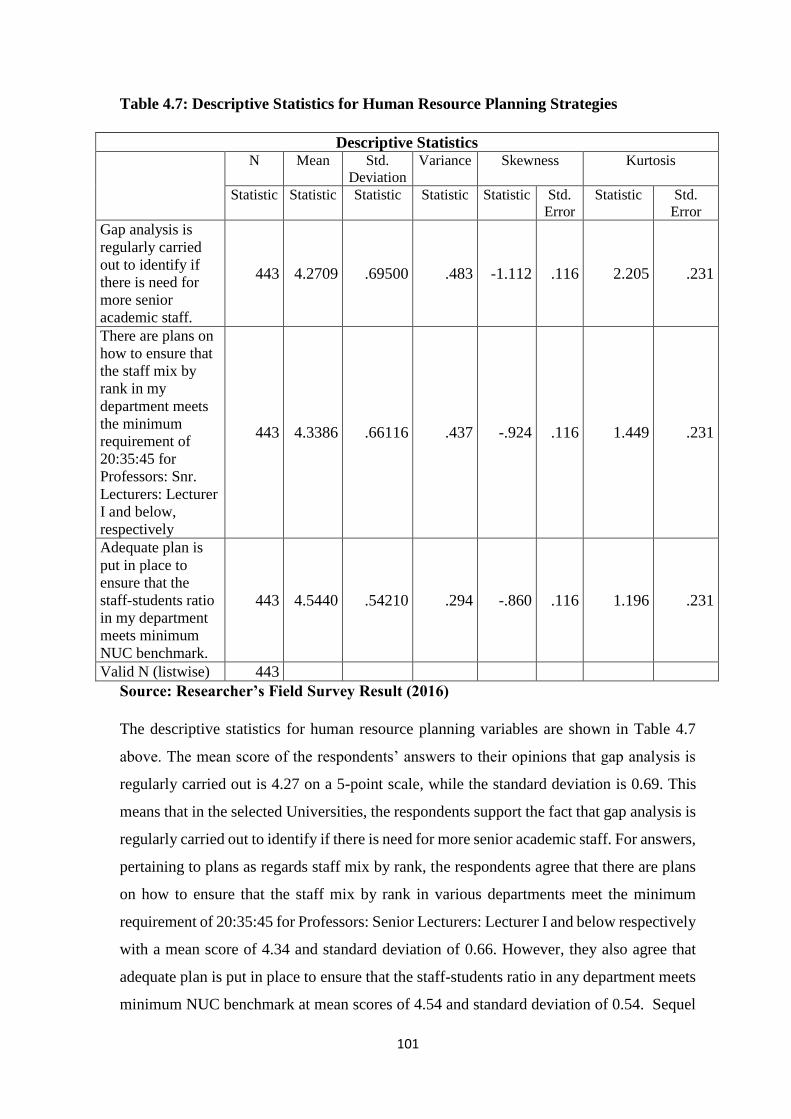
101
Table 4.7: Descriptive Statistics for Human Resource Planning Strategies
Descriptive Statistics
N Mean Std.
Deviation
Variance Skewness Kurtosis
Statistic Statistic Statistic Statistic Statistic Std.
Error
Statistic Std.
Error
Gap analysis is
regularly carried
out to identify if
there is need for
more senior
academic staff.
443 4.2709 .69500 .483 -1.112 .116 2.205 .231
There are plans on
how to ensure that
the staff mix by
rank in my
department meets
the minimum
requirement of
20:35:45 for
Professors: Snr.
Lecturers: Lecturer
I and below,
respectively
443 4.3386 .66116 .437 -.924 .116 1.449 .231
Adequate plan is
put in place to
ensure that the
staff-students ratio
in my department
meets minimum
NUC benchmark.
443 4.5440 .54210 .294 -.860 .116 1.196 .231
Valid N (listwise) 443
Source: Researcher’s Field Survey Result (2016)
The descriptive statistics for human resource planning variables are shown in Table 4.7
above. The mean score of the respondents’ answers to their opinions that gap analysis is
regularly carried out is 4.27 on a 5-point scale, while the standard deviation is 0.69. This
means that in the selected Universities, the respondents support the fact that gap analysis is
regularly carried out to identify if there is need for more senior academic staff. For answers,
pertaining to plans as regards staff mix by rank, the respondents agree that there are plans
on how to ensure that the staff mix by rank in various departments meet the minimum
requirement of 20:35:45 for Professors: Senior Lecturers: Lecturer I and below respectively
with a mean score of 4.34 and standard deviation of 0.66. However, they also agree that
adequate plan is put in place to ensure that the staff-students ratio in any department meets
minimum NUC benchmark at mean scores of 4.54 and standard deviation of 0.54. Sequel

102
to the above table, it was discovered that no variable has a mean score of less than 2.5 on a
5-point scale. This shows that respondents agree or strongly agree with all the constructs
regarding human resource planning strategies.
Table 4.8: Descriptive Statistics for University’s Brand Image
Descriptive Statistics
N Mean Std.
Deviation
Variance Skewness Kurtosis
Statistic Statistic Statistic Statistic Statistic Std.
Error
Statistic Std.
Error
The teaching
facilities in my
University have
enhanced the
teaching quality.
443 4.4989 .62154 .386 -1.188 .116 1.914 .231
The University’s
environment is
conducive for
learning.
443 4.5982 .56776 .322 -1.509 .116 3.626 .231
My University
provides good
services that are
widely perceived
as unique
443 4.5000 .62594 .392 -1.372 .116 2.974 .232
Valid N (listwise) 443
Source: Researcher’s Field Survey Result (2016)
In Table 4.8 above, the respondents support the constructs outlined there. They agree with
the fact that teaching facilities in their Universities have enhanced the teaching quality (at
mean score of 4.49) coupled with the fact that the Universities’ environment is conducive
for learning (at mean score of 4.59) which has helped the Universities to provide good
services that are widely perceived (at 4.5 mean value). Therefore, it can be rightly said that
Universities’ brand image is very encouraging.
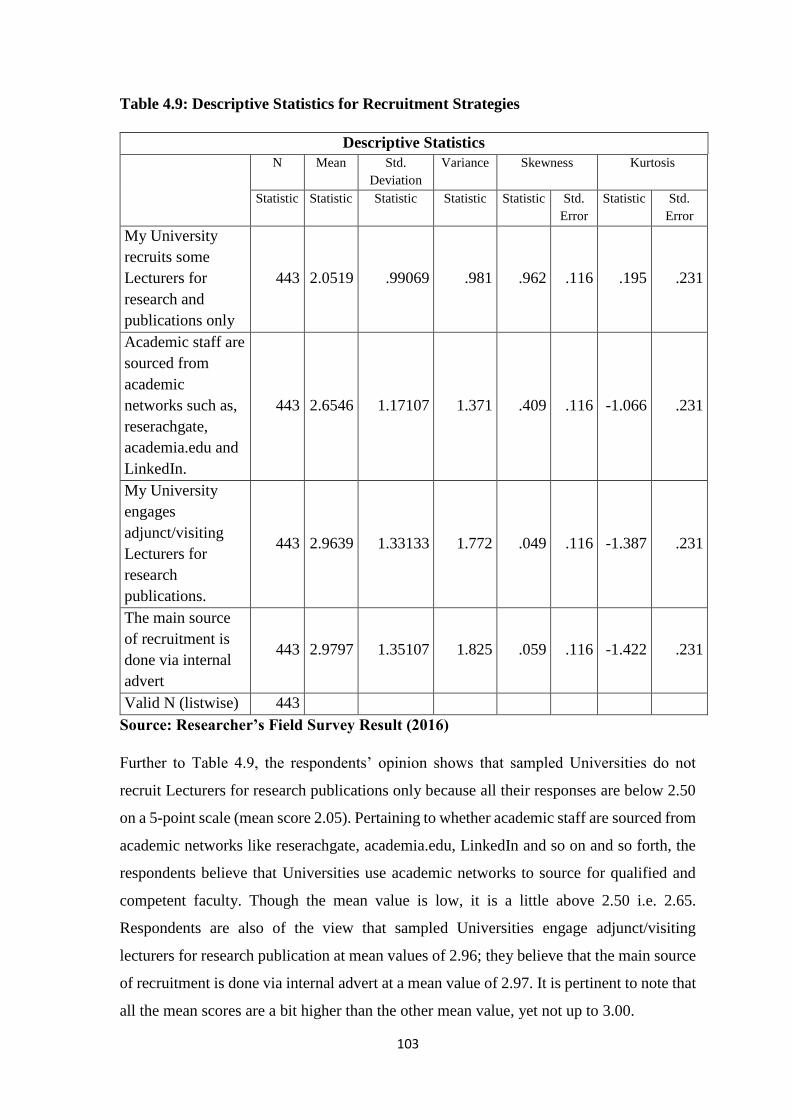
103
Table 4.9: Descriptive Statistics for Recruitment Strategies
Descriptive Statistics
N Mean Std.
Deviation
Variance Skewness Kurtosis
Statistic Statistic Statistic Statistic Statistic Std.
Error
Statistic Std.
Error
My University
recruits some
Lecturers for
research and
publications only
443 2.0519 .99069 .981 .962 .116 .195 .231
Academic staff are
sourced from
academic
networks such as,
reserachgate,
academia.edu and
LinkedIn.
443 2.6546 1.17107 1.371 .409 .116 -1.066 .231
My University
engages
adjunct/visiting
Lecturers for
research
publications.
443 2.9639 1.33133 1.772 .049 .116 -1.387 .231
The main source
of recruitment is
done via internal
advert
443 2.9797 1.35107 1.825 .059 .116 -1.422 .231
Valid N (listwise) 443
Source: Researcher’s Field Survey Result (2016)
Further to Table 4.9, the respondents’ opinion shows that sampled Universities do not
recruit Lecturers for research publications only because all their responses are below 2.50
on a 5-point scale (mean score 2.05). Pertaining to whether academic staff are sourced from
academic networks like reserachgate, academia.edu, LinkedIn and so on and so forth, the
respondents believe that Universities use academic networks to source for qualified and
competent faculty. Though the mean value is low, it is a little above 2.50 i.e. 2.65.
Respondents are also of the view that sampled Universities engage adjunct/visiting
lecturers for research publication at mean values of 2.96; they believe that the main source
of recruitment is done via internal advert at a mean value of 2.97. It is pertinent to note that
all the mean scores are a bit higher than the other mean value, yet not up to 3.00.

104
Table 4.10: Descriptive Statistics for University’s Research Image
Descriptive Statistics
N Mean Std.
Deviation
Variance Skewness Kurtosis
Statistic Statistic Statistic Statistic Statistic Std.
Error
Statistic Std.
Error
My University is
known for
scholarly research
outputs.
443 4.2325 .87583 .767 -1.506 .116 2.614 .231
Most of the
Lecturers have
published articles
in top ranked
journal outlets.
443 4.3160 .80406 .647 -1.552 .116 3.119 .231
My University has
won several
international
awards and
research grants
443 4.3386 2.03988 4.161 16.648 .116 324.83
7 .231
Valid N (listwise) 443
Source: Researcher’s Field Survey Result (2016)
Table 4.10 reveals the opinion of the respondents that sampled Universities are known for
scholarly research outputs with a mean value of 4.23 and that most of the Lecturers have
published articles in top ranked journal outlets at a mean value of 4.32. They posit that the
sampled Universities have won several international awards and research grants at mean
score of 4.33. The above table shows that all sampled Universities have good research
image.

105
Table 4.11: Employee Selection Strategies
Descriptive Statistics
N Mean Std.
Deviation
Variance Skewness Kurtosis
Statistic Statistic Statistic Statistic Statistic Std.
Error
Statistic Std.
Error
When vacancies
occur, existing
employees are
usually
considered via
appointment
route.
443 4.4312 3.36022 11.291 11.106 .116 129.29
4 .231
My University
gives priority to
article
publications
indexed in ISI,
Scopus and
School-Based
journal outlets
for selection.
443 4.2573 .75006 .563 -1.139 .116 2.015 .231
Google Scholar
citations are
considered as
one of the
criteria for
selection.
443 3.9797 1.05806 1.119 -1.203 .116 .908 .231
Valid N
(listwise) 443
Source: Researcher’s Field Survey Result (2016)
Table 4.11 above shows the respondents’ views on whether existing employees are usually
considered via appointment route when vacancies occur. The respondents are of the opinion
that when vacancies occur, existing employees are usually considered via appointment
route (at a mean value of 3.36); that during selection process priority is given to candidates
who have published in ISI, Scopus and School-Based Journal outlets. They are also of the

106
opinion that goggle scholar citations are also considered for selection process (both at mean
values of 4.25 and 3.98 respectively).
Table 4.12: Corporate Reputation
Descriptive Statistics
N Mean Std.
Deviation
Variance Skewness Kurtosis
Statistic Statistic Statistic Statistic Statistic Std.
Error
Statistic Std.
Error
My University is
fully accredited
by the National
Universities
Commission.
443 4.6975 .52852 .279 -1.997 .116 5.667 .231
My University
engages
academic staff
from outside the
country
443 4.3837 .77688 .604 -1.804 .116 4.371 .231
Valid N
(listwise) 443
Source: Researcher’s Field Survey Result (2016)
Table 4.12 reveals that all the sampled Universities are fully accredited by the National
Universities Commission. Respondents’ responses also show that the Universities attract
and engage academic staff from outside at the mean value of 4.70 and 4.38 respectively.

107
Table 4.13: Descriptive Statistics for Employee Retention Strategies
Descriptive Statistics
N Mean Std.
Deviation
Variance Skewness Kurtosis
Statistic Statistic Statistic Statistic Statistic Std.
Error
Statistic Std.
Error
Salary Package 443 3.8668 .66445 .441 -.775 .116 1.884 .231
Allowances 443 3.3093 .94729 .897 -1.086 .116 .539 .231
Career Progression 443 4.3995 4.30676 18.548 8.818 .116 78.956 .231
Training &
Conference Support 443 3.7743 .88659 .786 -.658 .116 .441 .231
Research/
Publication Grants 443 3.4334 1.07500 1.156 -.513 .116 -.368 .231
Regular Promotion 443 3.9323 .87959 .774 -.769 .116 .551 .231
Retirement Benefits 443 3.6885 1.99491 3.980 6.874 .116 62.345 .231
Modern Teaching
Facilities 443 4.2799 .73886 .546 -1.411 .116 3.968 .231
Modern Research
Aids 443 3.9661 .83543 .698 -.825 .116 1.001 .231
Subsidised Staff
Quarters 443 4.1084 5.97635 35.717 7.913 .116 63.822 .231
Job Security 443 3.6050 1.40769 1.982 6.508 .116 99.067 .231
University’s Image 443 4.1603 .69194 .479 -.759 .116 1.391 .231
Conducive
Environment 443 4.2212 .76152 .580 -1.106 .116 2.025 .231
Subsidised Medical
Services 443 3.3995 1.17889 1.390 -.482 .116 -.578 .231
Subsidised School
Fees for Staff’s
Children
443 3.2144 1.38563 1.920 -.384 .116 -1.154 .231
Loan Facilities 443 3.1828 1.10959 1.231 -.037 .116 -.737 .231
Work-life Balance 443 3.1738 1.07166 1.148 -.373 .116 -.278 .231
Valid N (listwise) 443
Source: Researcher’s Field Survey Result (2016)

108
The descriptive statistics on retention strategies of the sampled Universities is shown in
Table 4.13 above. The table reveals that respondents agree and support all statements made
going by the mean values for all the measuring variables. On 5-point scale, the mean values
for reward system (salary package, retirement benefits and allowance) as retention
strategies are 3.86, 3.30 and 3.69 respectively. The respondents also believe that staff
development such as career progression, training and conference support, research and
publication grants and regular promotion are part of the retention strategies of the sampled
Universities at mean value of 4.40, 3.77, 3.42 and 3.93 respectively. The mean values of
4.28, 3.97, 4.11, 3.60, 4.16 and 4.22 show that modern teaching facilities, modern research
aids, subsidised staff quarters, job security, Universities image and conducive environment
in that order, are considered to be part of retention strategies of the sampled Universities.
Similarly, the respondents’ views also show that staff welfare such as subsidised medical
services, subsidised school fees for staff’s children, loan facilities and work-life balance
are also retention strategies at mean score of 3.40, 3.21, 3.18 and 3.17 in that order.
Table 4.14: Cross Tabulation of Employee Retention Strategies
Table 4.14: Salary Package * Universities Cross Tabulation
Universities Total
ABUAD
Babcock
Uni.
Bells
Uni.
Covenant
Uni.
Lead City
Uni.
Redeemer's
Uni.
Salary
Package
Poor 0 2 0 0 0 0 2
Below Ave. 0 10 0 2 0 0 12
Average 10 20 5 37 9 1 82
Good 70 57 24 55 51 21 278
Excellent 8 2 17 7 10 25 69
Total 88 91 46 101 70 47 443
Source: Researcher’s Field Survey Result (2016)
Table 4:14 shows the respondents’ level of agreement with the salary packages as it relates
to their perception on retention in the various sampled Universities. The result is depicted
in the bar chart below. The result shows that the salary package of all the sampled
Universities is relatively good as depicted in figure 4.1.
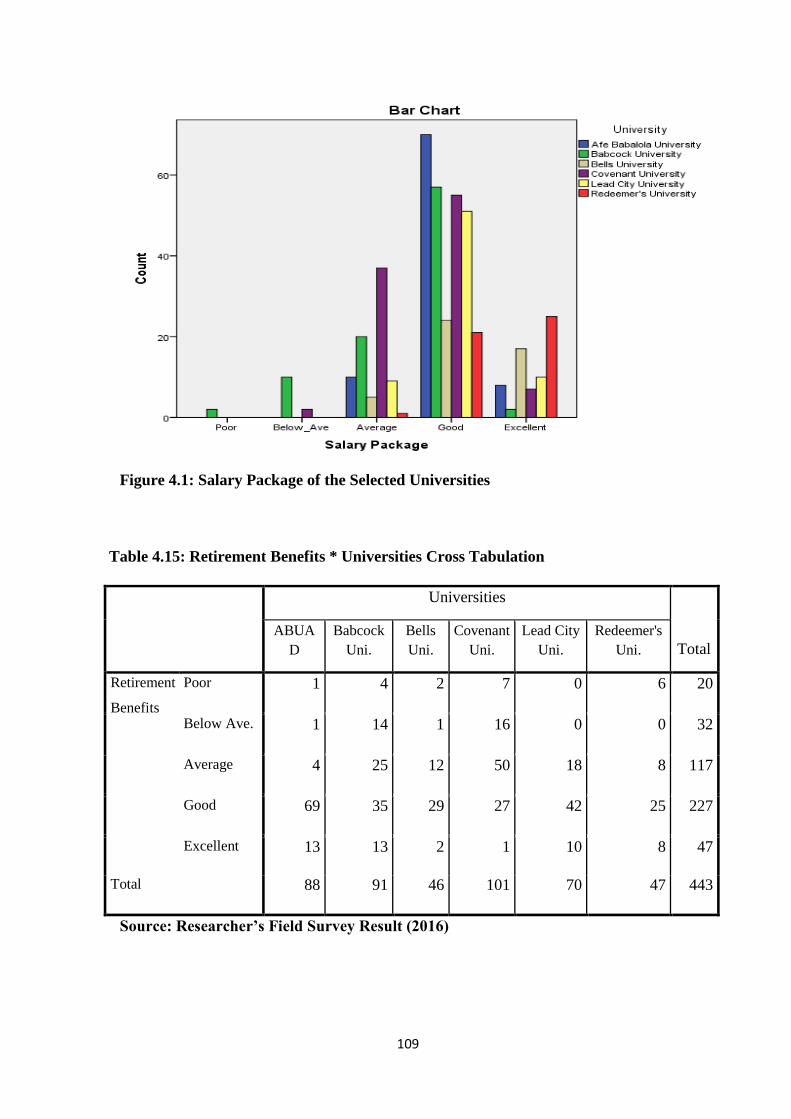
109
Figure 4.1: Salary Package of the Selected Universities
Table 4.15: Retirement Benefits * Universities Cross Tabulation
Universities
Total
ABUA
D
Babcock
Uni.
Bells
Uni.
Covenant
Uni.
Lead City
Uni.
Redeemer's
Uni.
Retirement
Benefits
Poor 1 4 2 7 0 6 20
Below Ave. 1 14 1 16 0 0 32
Average 4 25 12 50 18 8 117
Good 69 35 29 27 42 25 227
Excellent 13 13 2 1 10 8 47
Total 88 91 46 101 70 47 443
Source: Researcher’s Field Survey Result (2016)

110
Table 4.15 above shows the degree at which respondents agree with the construct of
retirement benefits as part of retention strategies in the selected private Universities. Figure
4.2 of the bar chart below shows the graphical representation of each school.
Figure 4.2: Retirement Benefits of the Selected Universities
Table 4.16: Allowances * Universities Cross Tabulation
Universities
Total ABUAD
Babcock
Uni.
Bells
Uni.
Covenant
Uni.
Lead City
Uni.
Redeemer's
Uni.
Allowances Poor 2 5 7 14 5 2 35
Below
Ave 2 5 4 18 0 3 32
Average 18 32 19 41 22 14 146
Good 64 46 16 26 43 26 221
Excellent 2 3 0 2 0 2 9
Total 88 91 46 101 70 47 443
Source: Researcher’s Field Survey Result (2016)

111
Allowances as a component of employee retention strategies and the opinion of respondent
of each University is depicted in Table 4.16 above, and graphically displayed in the bar
chart below in figure 4.3
Figure 4.3: Allowances of the Selected Universities
Table 4.17: Career Progression * Universities Cross Tabulation
Universities
Total ABUAD
Babcock
Uni.
Bells
Uni.
Covenant
Uni.
Lead City
Uni.
Redeemer's
Uni.
Career
Progression
Poor 0 3 6 0 0 0 9
Below
Ave 1 2 5 10 0 3 21
Average 3 16 11 20 13 12 75
Good 58 42 22 48 52 26 248
Excellent 26 28 2 23 5 6 90
Total 88 91 46 101 70 47 443
Source: Researcher’s Field Survey Result (2016)
The above table shows the respondents’ views about the career progression variables of
each University which is also presented in the bar chart below. The result reveals that all
the Universities are mindful of career path for their staff as displayed in figure 4.4.
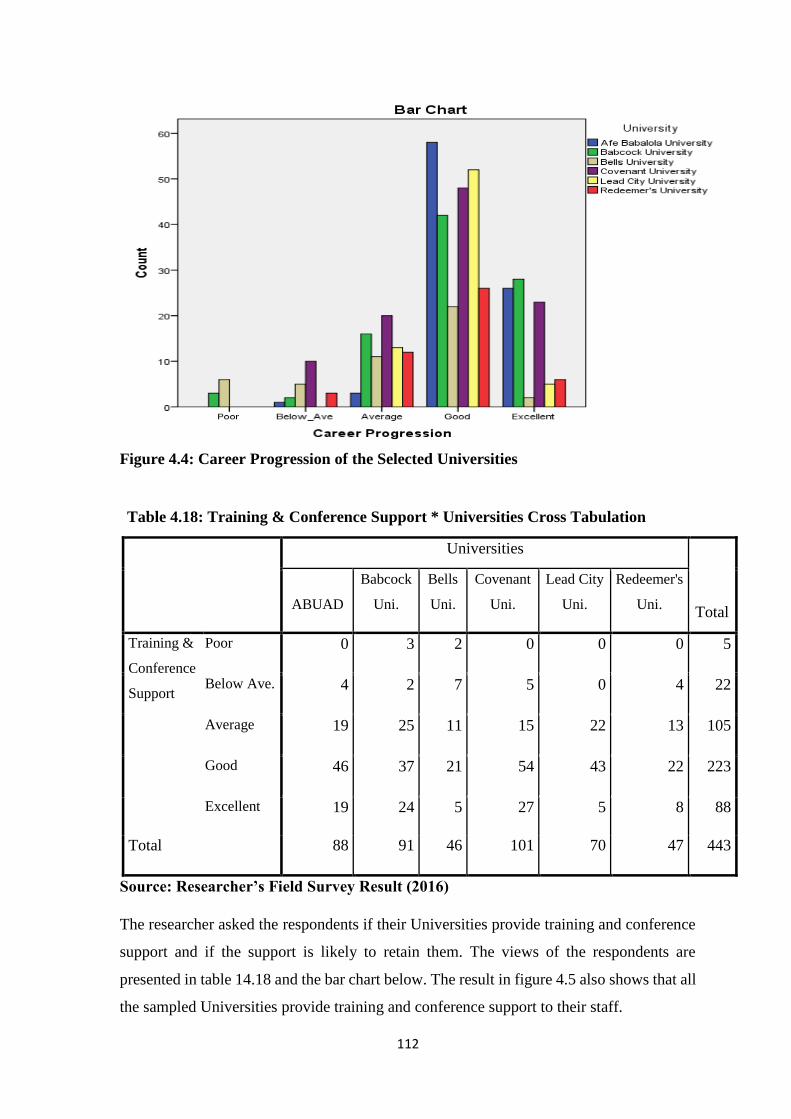
112
Figure 4.4: Career Progression of the Selected Universities
Table 4.18: Training & Conference Support * Universities Cross Tabulation
Universities
Total ABUAD
Babcock
Uni.
Bells
Uni.
Covenant
Uni.
Lead City
Uni.
Redeemer's
Uni.
Training &
Conference
Support
Poor 0 3 2 0 0 0 5
Below Ave. 4 2 7 5 0 4 22
Average 19 25 11 15 22 13 105
Good 46 37 21 54 43 22 223
Excellent 19 24 5 27 5 8 88
Total 88 91 46 101 70 47 443
Source: Researcher’s Field Survey Result (2016)
The researcher asked the respondents if their Universities provide training and conference
support and if the support is likely to retain them. The views of the respondents are
presented in table 14.18 and the bar chart below. The result in figure 4.5 also shows that all
the sampled Universities provide training and conference support to their staff.

113
Figure 4.5: Training and Conference Support of the Selected Universities
Table 4.19: Research/ Publication Grants *Universities Cross Tabulation
Universities
Total ABUAD
Babcock
Uni.
Bells
Uni.
Covenant
Uni.
Lead City
Uni.
Redeemer's
Uni.
Research/
Publication
Grants
Poor 4 11 6 2 0 2 25
Below
Ave 8 14 13 1 24 4 64
Average 8 20 18 19 36 12 113
Good 54 29 7 57 10 19 176
Excellent 14 17 2 22 0 10 65
Total 88 91 46 101 70 47 443
Source: Researcher’s Field Survey Result (2016)
The level at which research and publication grants retain employee in the sampled
Universities are presented in Table 4.19 and figure 4.6. The finding shows that Afe
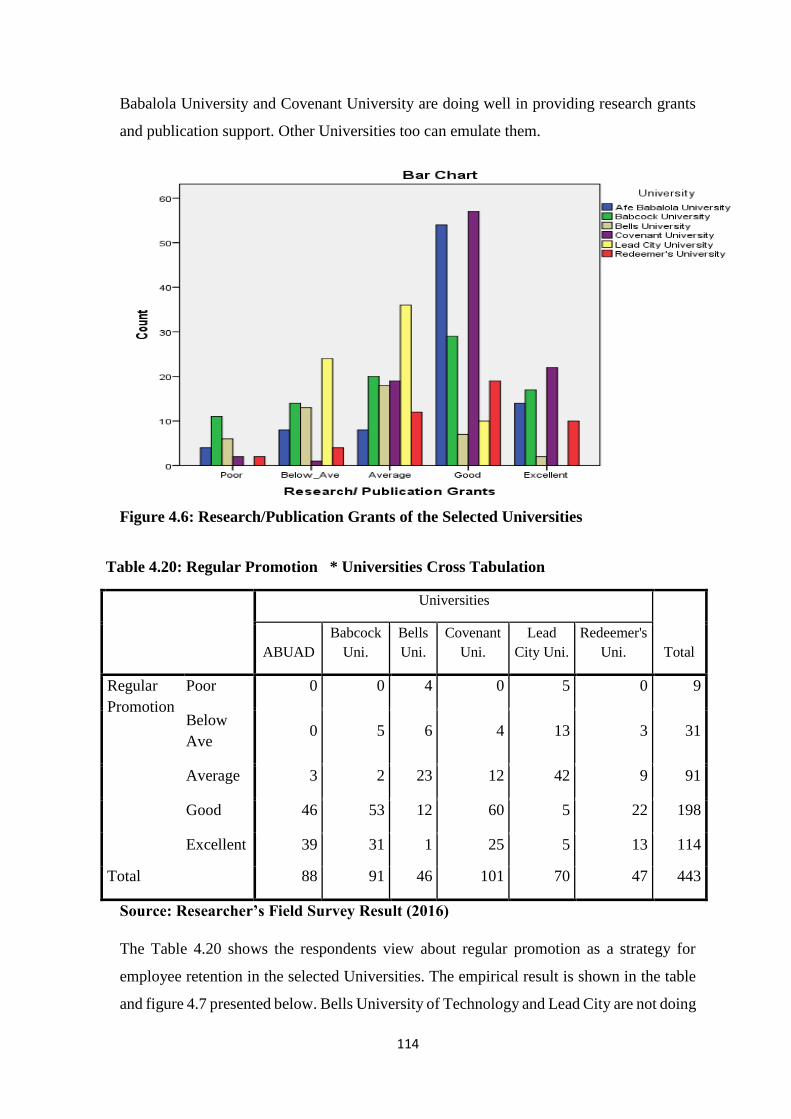
114
Babalola University and Covenant University are doing well in providing research grants
and publication support. Other Universities too can emulate them.
Figure 4.6: Research/Publication Grants of the Selected Universities
Table 4.20: Regular Promotion * Universities Cross Tabulation
Universities
Total ABUAD
Babcock
Uni.
Bells
Uni.
Covenant
Uni.
Lead
City Uni.
Redeemer's
Uni.
Regular
Promotion
Poor 0 0 4 0 5 0 9
Below
Ave 0 5 6 4 13 3 31
Average 3 2 23 12 42 9 91
Good 46 53 12 60 5 22 198
Excellent 39 31 1 25 5 13 114
Total 88 91 46 101 70 47 443
Source: Researcher’s Field Survey Result (2016)
The Table 4.20 shows the respondents view about regular promotion as a strategy for
employee retention in the selected Universities. The empirical result is shown in the table
and figure 4.7 presented below. Bells University of Technology and Lead City are not doing
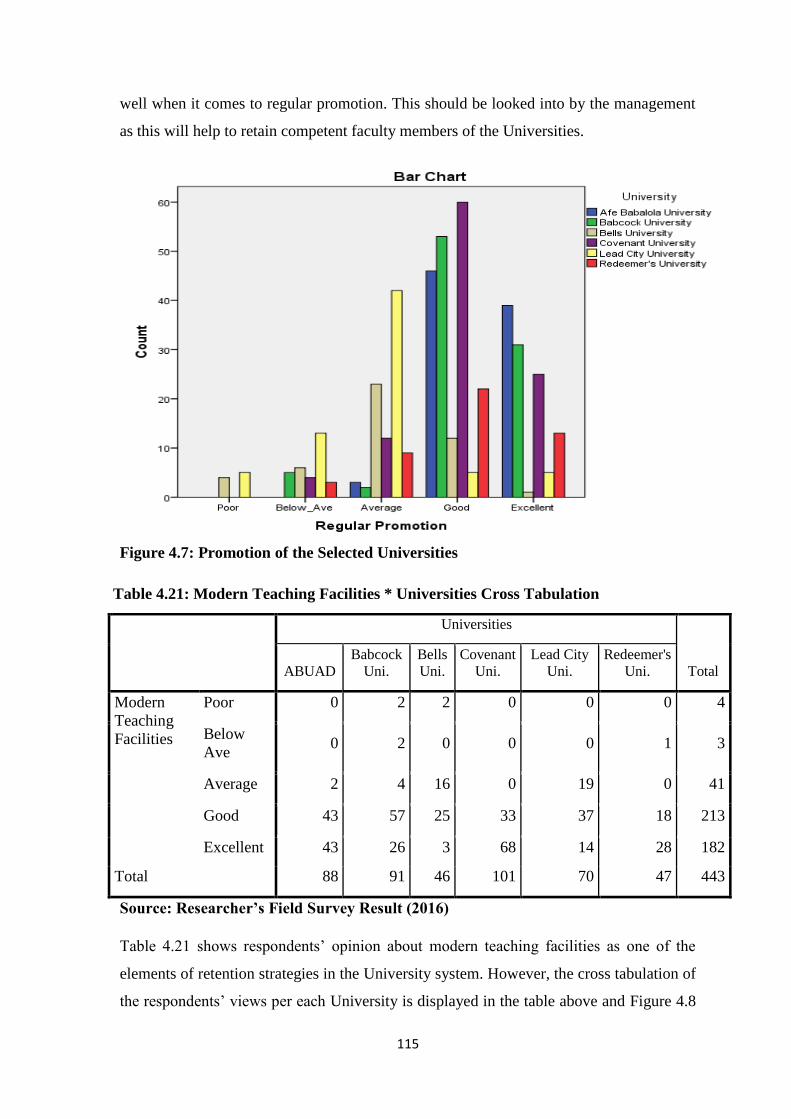
115
well when it comes to regular promotion. This should be looked into by the management
as this will help to retain competent faculty members of the Universities.
Figure 4.7: Promotion of the Selected Universities
Table 4.21: Modern Teaching Facilities * Universities Cross Tabulation
Universities
Total ABUAD
Babcock
Uni.
Bells
Uni.
Covenant
Uni.
Lead City
Uni.
Redeemer's
Uni.
Modern
Teaching
Facilities
Poor 0 2 2 0 0 0 4
Below
Ave 0 2 0 0 0 1 3
Average 2 4 16 0 19 0 41
Good 43 57 25 33 37 18 213
Excellent 43 26 3 68 14 28 182
Total 88 91 46 101 70 47 443
Source: Researcher’s Field Survey Result (2016)
Table 4.21 shows respondents’ opinion about modern teaching facilities as one of the
elements of retention strategies in the University system. However, the cross tabulation of
the respondents’ views per each University is displayed in the table above and Figure 4.8
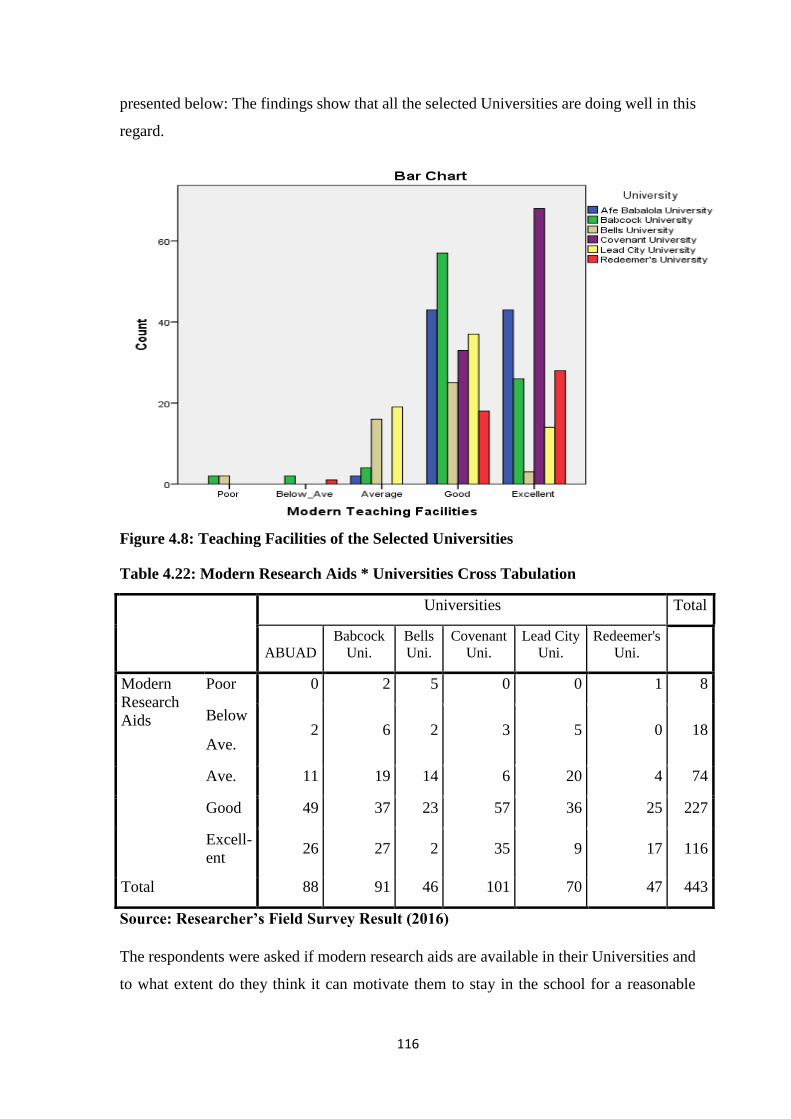
116
presented below: The findings show that all the selected Universities are doing well in this
regard.
Figure 4.8: Teaching Facilities of the Selected Universities
Table 4.22: Modern Research Aids * Universities Cross Tabulation
Universities Total
ABUAD
Babcock
Uni.
Bells
Uni.
Covenant
Uni.
Lead City
Uni.
Redeemer's
Uni.
Modern
Research
Aids
Poor 0 2 5 0 0 1 8
Below
Ave. 2 6 2 3 5 0 18
Ave. 11 19 14 6 20 4 74
Good 49 37 23 57 36 25 227
Excell-
ent 26 27 2 35 9 17 116
Total 88 91 46 101 70 47 443
Source: Researcher’s Field Survey Result (2016)
The respondents were asked if modern research aids are available in their Universities and
to what extent do they think it can motivate them to stay in the school for a reasonable

117
number of years. The respondents’ views are displayed in Table 4.22 and Figure 4.9 below.
The result shows that all the sampled Universities are doing well in this regard.
Figure 4.9: Research Aids of the Selected Universities
Table 4.23: Subsidised Staff Quarters * Universities Cross Tabulation
Universities
Total ABUAD
Babcock
Uni.
Bells
Uni.
Covenant
Uni.
Lead City
Uni.
Redeemer's
Uni.
Subsidised
Staff
Quarters
Poor 0 0 8 16 0 10 34
Below
Ave 0 7 10 29 0 3 49
Average 1 21 18 30 26 13 109
Good 45 44 10 14 39 14 166
Excellent 42 19 0 12 5 7 85
Total 88 91 46 101 70 47 443
Source: Researcher’s Field Survey Result (2016)
Table 4.23 shows the Cross Tabulation of the selected Universities about Subsidised Staff
Quarters as one of the variables of retention strategies in the University environment. The
respondents’ views are displayed on the table above and Figure 4.10 below. The result
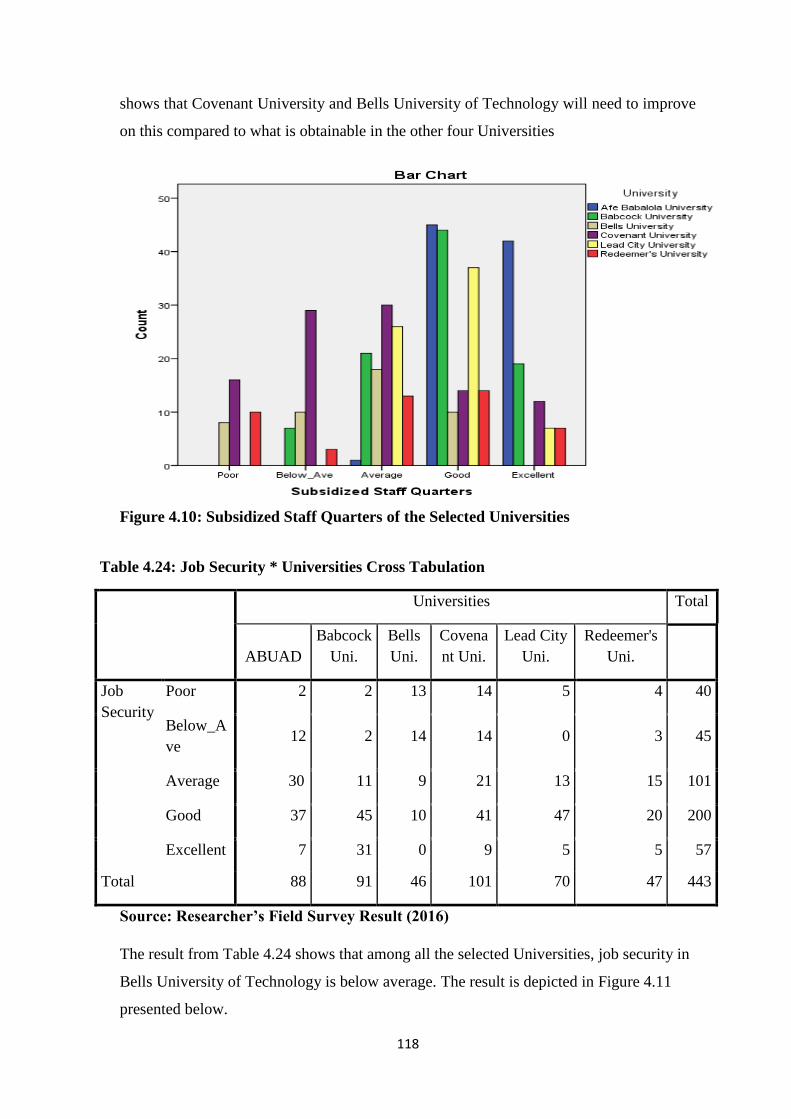
118
shows that Covenant University and Bells University of Technology will need to improve
on this compared to what is obtainable in the other four Universities
Figure 4.10: Subsidized Staff Quarters of the Selected Universities
Table 4.24: Job Security * Universities Cross Tabulation
Universities Total
ABUAD
Babcock
Uni.
Bells
Uni.
Covena
nt Uni.
Lead City
Uni.
Redeemer's
Uni.
Job
Security
Poor 2 2 13 14 5 4 40
Below_A
ve 12 2 14 14 0 3 45
Average 30 11 9 21 13 15 101
Good 37 45 10 41 47 20 200
Excellent 7 31 0 9 5 5 57
Total 88 91 46 101 70 47 443
Source: Researcher’s Field Survey Result (2016)
The result from Table 4.24 shows that among all the selected Universities, job security in
Bells University of Technology is below average. The result is depicted in Figure 4.11
presented below.
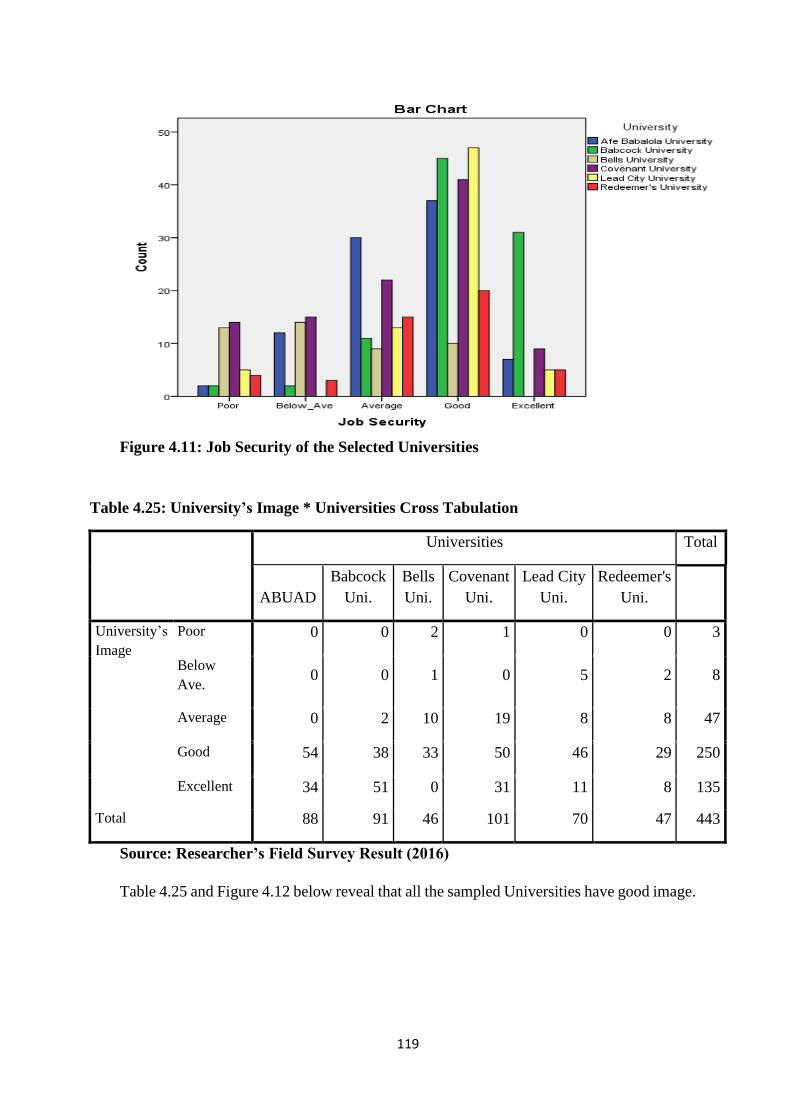
119
Figure 4.11: Job Security of the Selected Universities
Table 4.25: University’s Image * Universities Cross Tabulation
Universities Total
ABUAD
Babcock
Uni.
Bells
Uni.
Covenant
Uni.
Lead City
Uni.
Redeemer's
Uni.
University’s
Image
Poor 0 0 2 1 0 0 3
Below
Ave. 0 0 1 0 5 2 8
Average 0 2 10 19 8 8 47
Good 54 38 33 50 46 29 250
Excellent 34 51 0 31 11 8 135
Total 88 91 46 101 70 47 443
Source: Researcher’s Field Survey Result (2016)
Table 4.25 and Figure 4.12 below reveal that all the sampled Universities have good image.
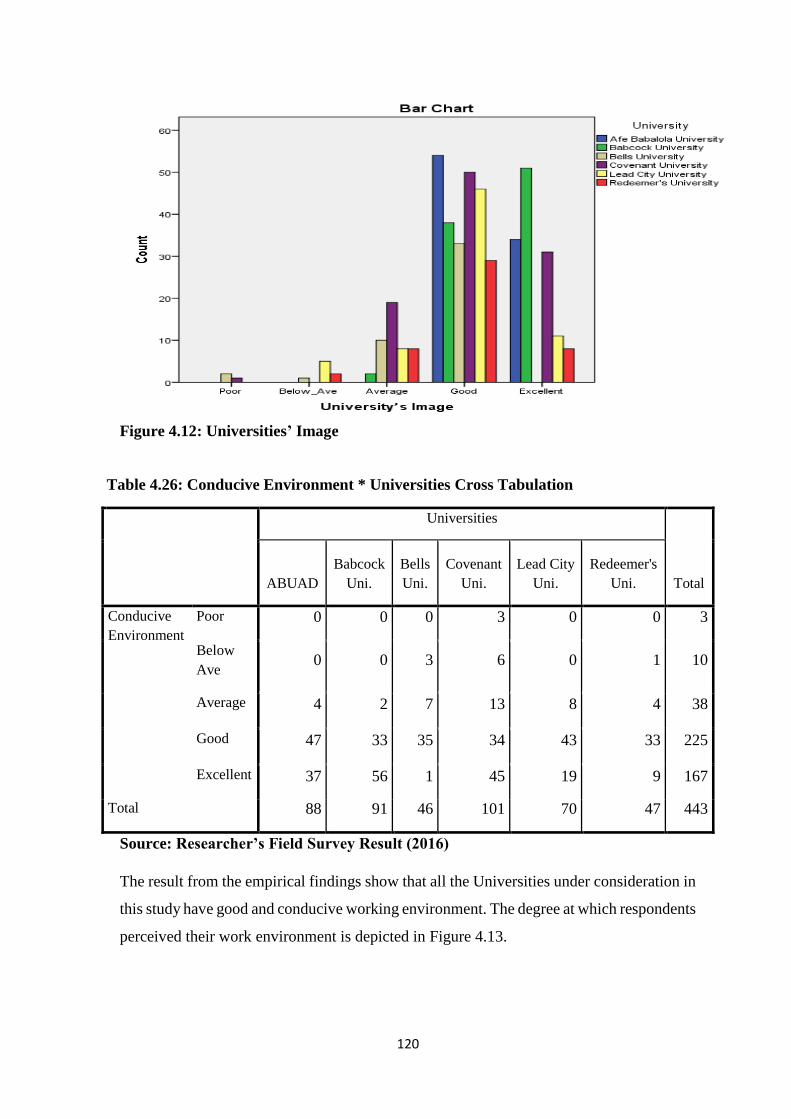
120
Figure 4.12: Universities’ Image
Table 4.26: Conducive Environment * Universities Cross Tabulation
Universities
Total ABUAD
Babcock
Uni.
Bells
Uni.
Covenant
Uni.
Lead City
Uni.
Redeemer's
Uni.
Conducive
Environment
Poor 0 0 0 3 0 0 3
Below
Ave 0 0 3 6 0 1 10
Average 4 2 7 13 8 4 38
Good 47 33 35 34 43 33 225
Excellent 37 56 1 45 19 9 167
Total 88 91 46 101 70 47 443
Source: Researcher’s Field Survey Result (2016)
The result from the empirical findings show that all the Universities under consideration in
this study have good and conducive working environment. The degree at which respondents
perceived their work environment is depicted in Figure 4.13.
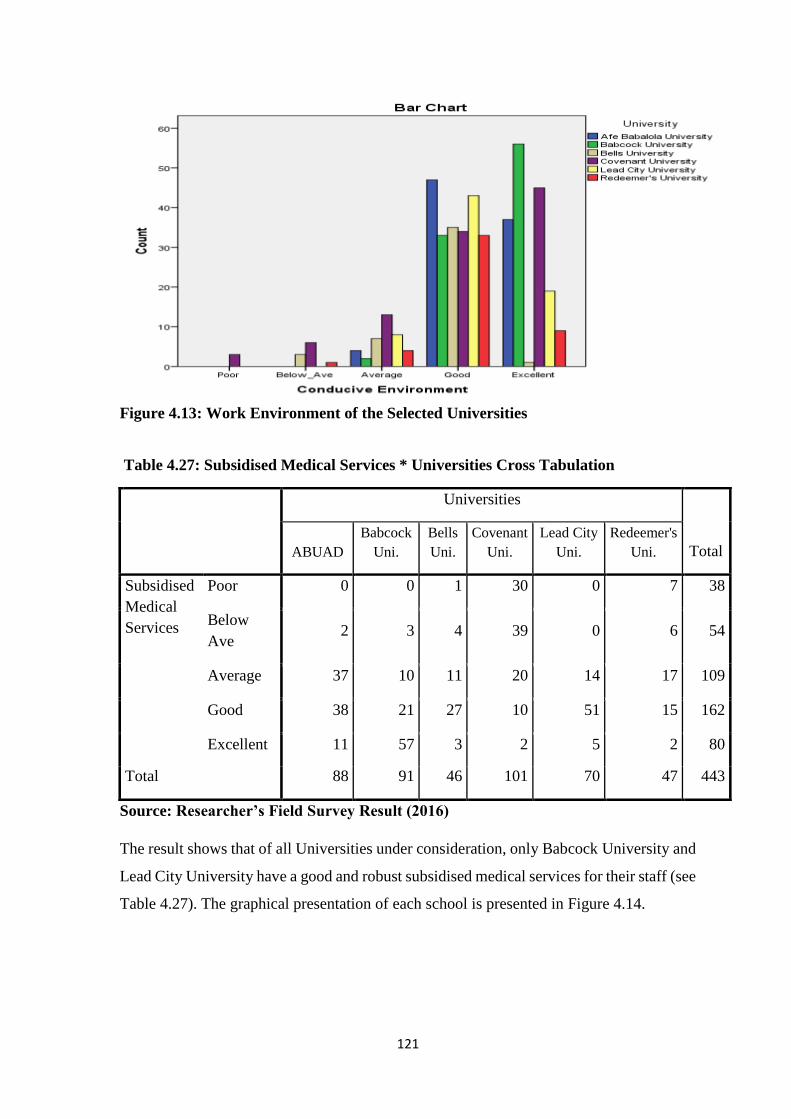
121
Figure 4.13: Work Environment of the Selected Universities
Table 4.27: Subsidised Medical Services * Universities Cross Tabulation
Universities
Total ABUAD
Babcock
Uni.
Bells
Uni.
Covenant
Uni.
Lead City
Uni.
Redeemer's
Uni.
Subsidised
Medical
Services
Poor 0 0 1 30 0 7 38
Below
Ave 2 3 4 39 0 6 54
Average 37 10 11 20 14 17 109
Good 38 21 27 10 51 15 162
Excellent 11 57 3 2 5 2 80
Total 88 91 46 101 70 47 443
Source: Researcher’s Field Survey Result (2016)
The result shows that of all Universities under consideration, only Babcock University and
Lead City University have a good and robust subsidised medical services for their staff (see
Table 4.27). The graphical presentation of each school is presented in Figure 4.14.
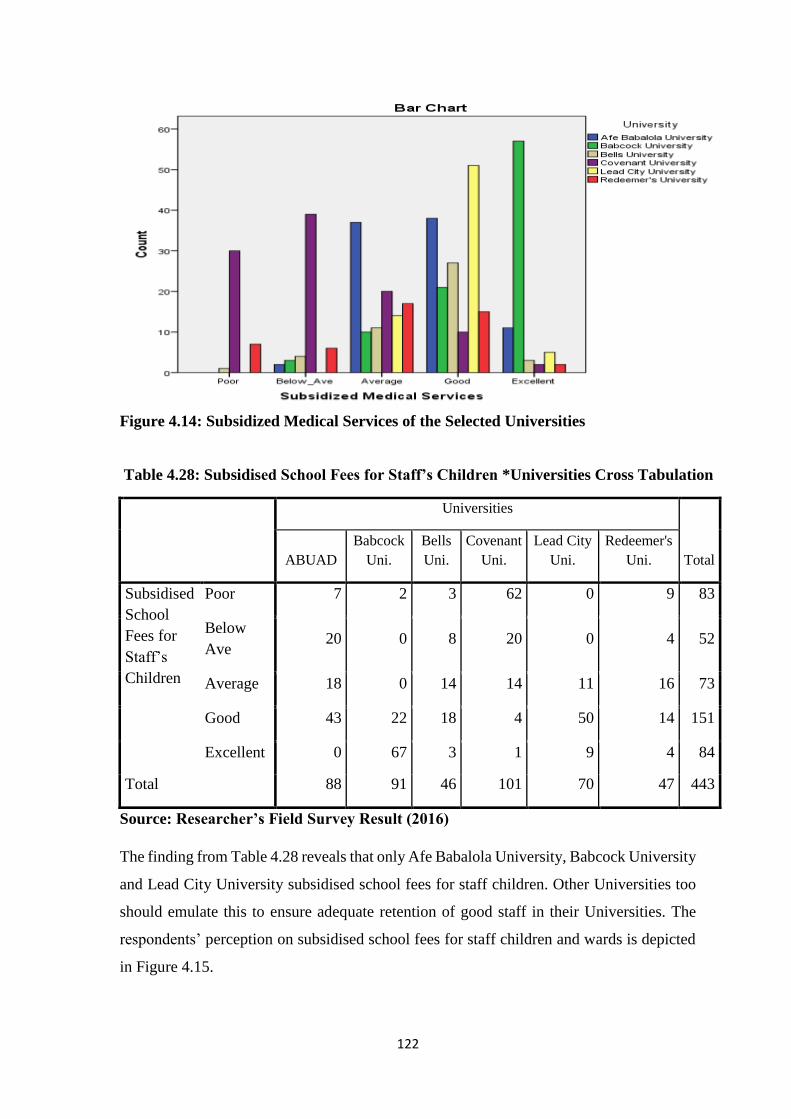
122
Figure 4.14: Subsidized Medical Services of the Selected Universities
Table 4.28: Subsidised School Fees for Staff’s Children *Universities Cross Tabulation
Universities
Total ABUAD
Babcock
Uni.
Bells
Uni.
Covenant
Uni.
Lead City
Uni.
Redeemer's
Uni.
Subsidised
School
Fees for
Staff’s
Children
Poor 7 2 3 62 0 9 83
Below
Ave 20 0 8 20 0 4 52
Average 18 0 14 14 11 16 73
Good 43 22 18 4 50 14 151
Excellent 0 67 3 1 9 4 84
Total 88 91 46 101 70 47 443
Source: Researcher’s Field Survey Result (2016)
The finding from Table 4.28 reveals that only Afe Babalola University, Babcock University
and Lead City University subsidised school fees for staff children. Other Universities too
should emulate this to ensure adequate retention of good staff in their Universities. The
respondents’ perception on subsidised school fees for staff children and wards is depicted
in Figure 4.15.

123
Figure 4.15: Subsidized School Fees
Table 4.29: Loan Facilities * Universities Cross Tabulation
Universities
Total ABUAD
Babcock
Uni.
Bells
Uni.
Covenant
Uni.
Lead City
Uni.
Redeemer's
Uni.
Loan
Facilities
Poor 7 8 3 10 0 0 28
Below
Ave 27 22 10 30 14 1 104
Average 22 11 14 41 37 14 139
Good 32 22 16 13 10 20 113
Excellent 0 28 3 7 9 12 59
Total 88 91 46 101 70 47 443
Source: Researcher’s Field Survey Result (2016)
Table 4.29 depicts the respondents’ views about the loan facilities available in their various
Universities. Besides, Figure 4.16 also shows the respondents opinions about the loan
facilities available for the employees of the selected Universities.
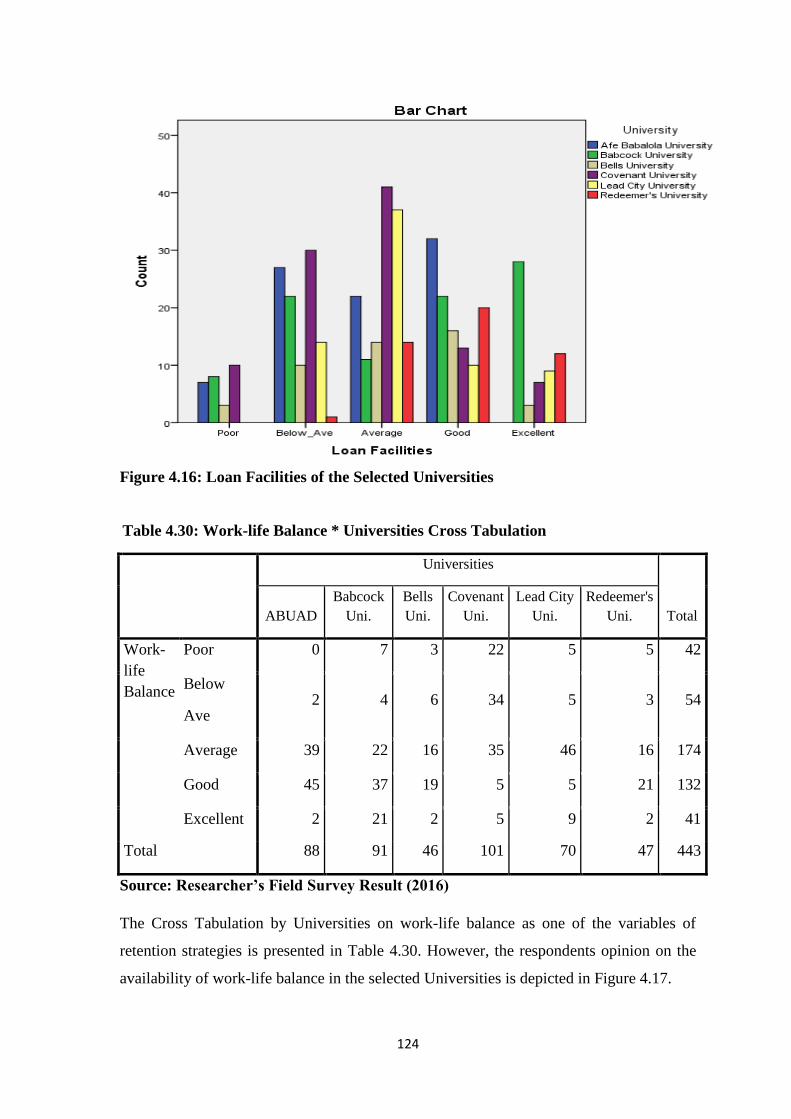
124
Figure 4.16: Loan Facilities of the Selected Universities
Table 4.30: Work-life Balance * Universities Cross Tabulation
Universities
Total ABUAD
Babcock
Uni.
Bells
Uni.
Covenant
Uni.
Lead City
Uni.
Redeemer's
Uni.
Work-
life
Balance
Poor 0 7 3 22 5 5 42
Below
Ave 2 4 6 34 5 3 54
Average 39 22 16 35 46 16 174
Good 45 37 19 5 5 21 132
Excellent 2 21 2 5 9 2 41
Total 88 91 46 101 70 47 443
Source: Researcher’s Field Survey Result (2016)
The Cross Tabulation by Universities on work-life balance as one of the variables of
retention strategies is presented in Table 4.30. However, the respondents opinion on the
availability of work-life balance in the selected Universities is depicted in Figure 4.17.

125
Figure 4.17: Work-life Balance of the Selected Universities
Table 4.31: Descriptive Statistics for University’s Corporate Identity
Descriptive Statistics
N Mean
Std.
Deviation Skewness Kurtosis
Statistic Statistic Statistic Statistic
Std.
Error Statistic
Std.
Error
My University has a
very unique culture 443 4.2257 .75121 -1.104 .116 2.140 .231
My University has a
brand that can be
recognised easily
443 3.8284 .84146 -.628 .116 .554 .231
My University’s logo
and website depict
our identity.
443 4.3002 .70722 -1.196 .116 2.272 .231
Valid N (listwise) 443
Source: Researcher’s Field Survey Result (2016)
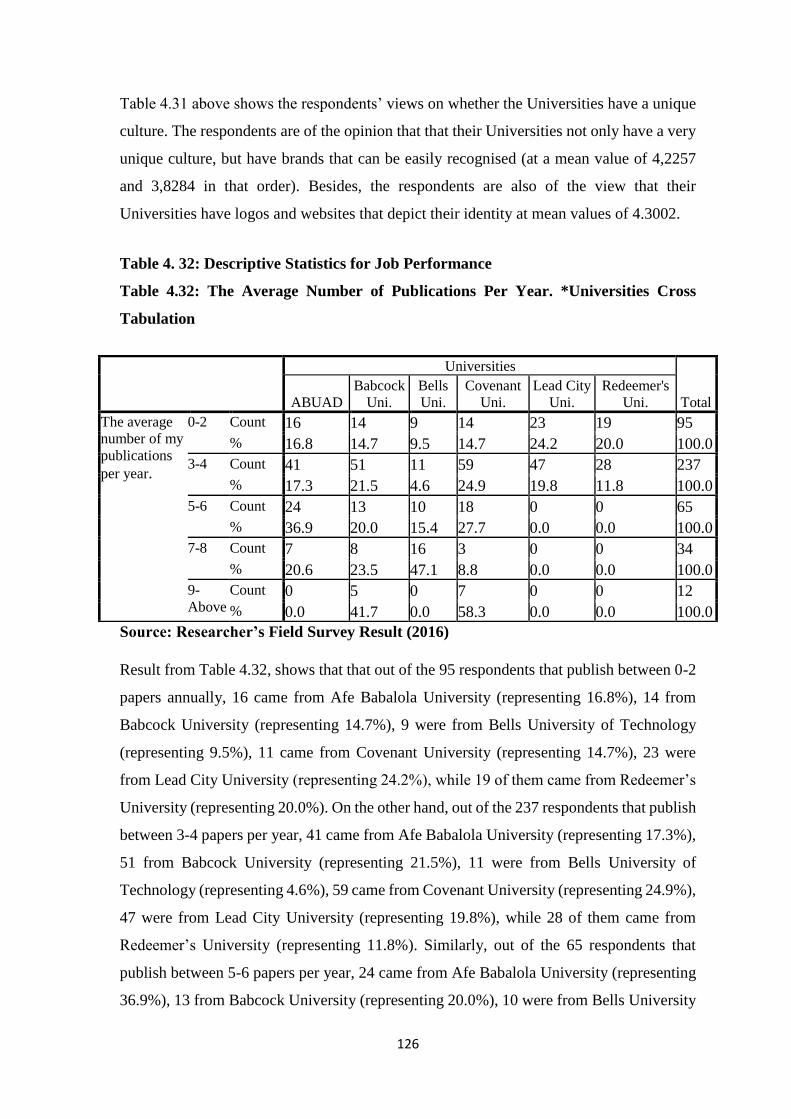
126
Table 4.31 above shows the respondents’ views on whether the Universities have a unique
culture. The respondents are of the opinion that that their Universities not only have a very
unique culture, but have brands that can be easily recognised (at a mean value of 4,2257
and 3,8284 in that order). Besides, the respondents are also of the view that their
Universities have logos and websites that depict their identity at mean values of 4.3002.
Table 4. 32: Descriptive Statistics for Job Performance
Table 4.32: The Average Number of Publications Per Year. *Universities Cross
Tabulation
Source: Researcher’s Field Survey Result (2016)
Result from Table 4.32, shows that that out of the 95 respondents that publish between 0-2
papers annually, 16 came from Afe Babalola University (representing 16.8%), 14 from
Babcock University (representing 14.7%), 9 were from Bells University of Technology
(representing 9.5%), 11 came from Covenant University (representing 14.7%), 23 were
from Lead City University (representing 24.2%), while 19 of them came from Redeemer’s
University (representing 20.0%). On the other hand, out of the 237 respondents that publish
between 3-4 papers per year, 41 came from Afe Babalola University (representing 17.3%),
51 from Babcock University (representing 21.5%), 11 were from Bells University of
Technology (representing 4.6%), 59 came from Covenant University (representing 24.9%),
47 were from Lead City University (representing 19.8%), while 28 of them came from
Redeemer’s University (representing 11.8%). Similarly, out of the 65 respondents that
publish between 5-6 papers per year, 24 came from Afe Babalola University (representing
36.9%), 13 from Babcock University (representing 20.0%), 10 were from Bells University
Universities
Total ABUAD
Babcock
Uni.
Bells
Uni.
Covenant
Uni.
Lead City
Uni.
Redeemer's
Uni.
The average
number of my
publications
per year.
0-2 Count 16 14 9 14 23 19 95
% 16.8 14.7 9.5 14.7 24.2 20.0 100.0
3-4 Count 41 51 11 59 47 28 237
% 17.3 21.5 4.6 24.9 19.8 11.8 100.0
5-6 Count 24 13 10 18 0 0 65
% 36.9 20.0 15.4 27.7 0.0 0.0 100.0
7-8 Count 7 8 16 3 0 0 34
% 20.6 23.5 47.1 8.8 0.0 0.0 100.0
9-
Above
Count 0 5 0 7 0 0 12
% 0.0 41.7 0.0 58.3 0.0 0.0 100.0
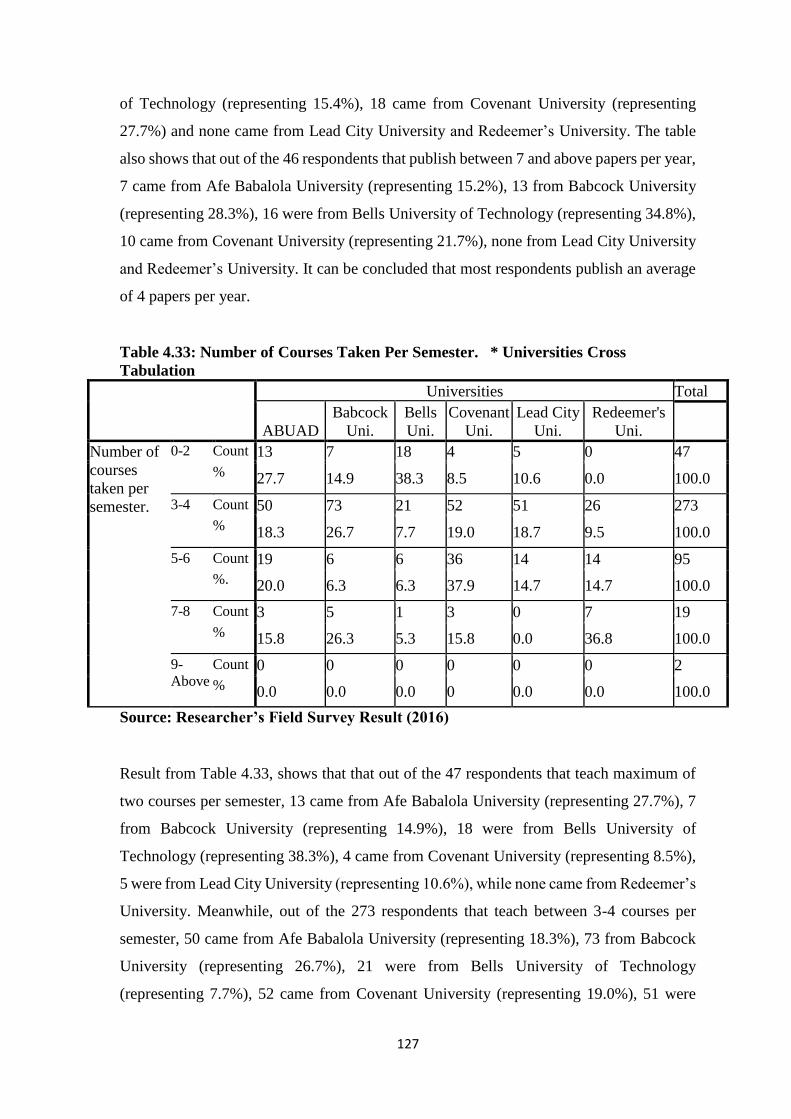
127
of Technology (representing 15.4%), 18 came from Covenant University (representing
27.7%) and none came from Lead City University and Redeemer’s University. The table
also shows that out of the 46 respondents that publish between 7 and above papers per year,
7 came from Afe Babalola University (representing 15.2%), 13 from Babcock University
(representing 28.3%), 16 were from Bells University of Technology (representing 34.8%),
10 came from Covenant University (representing 21.7%), none from Lead City University
and Redeemer’s University. It can be concluded that most respondents publish an average
of 4 papers per year.
Table 4.33: Number of Courses Taken Per Semester. * Universities Cross
Tabulation
Universities Total
ABUAD
Babcock
Uni.
Bells
Uni.
Covenant
Uni.
Lead City
Uni.
Redeemer's
Uni.
Number of
courses
taken per
semester.
0-2 Count 13 7 18 4 5 0 47
% 27.7 14.9 38.3 8.5 10.6 0.0 100.0
3-4 Count 50 73 21 52 51 26 273
% 18.3 26.7 7.7 19.0 18.7 9.5 100.0
5-6 Count 19 6 6 36 14 14 95
%. 20.0 6.3 6.3 37.9 14.7 14.7 100.0
7-8 Count 3 5 1 3 0 7 19
% 15.8 26.3 5.3 15.8 0.0 36.8 100.0
9-
Above
Count 0 0 0 0 0 0 2
% 0.0 0.0 0.0 0 0.0 0.0 100.0
Source: Researcher’s Field Survey Result (2016)
Result from Table 4.33, shows that that out of the 47 respondents that teach maximum of
two courses per semester, 13 came from Afe Babalola University (representing 27.7%), 7
from Babcock University (representing 14.9%), 18 were from Bells University of
Technology (representing 38.3%), 4 came from Covenant University (representing 8.5%),
5 were from Lead City University (representing 10.6%), while none came from Redeemer’s
University. Meanwhile, out of the 273 respondents that teach between 3-4 courses per
semester, 50 came from Afe Babalola University (representing 18.3%), 73 from Babcock
University (representing 26.7%), 21 were from Bells University of Technology
(representing 7.7%), 52 came from Covenant University (representing 19.0%), 51 were
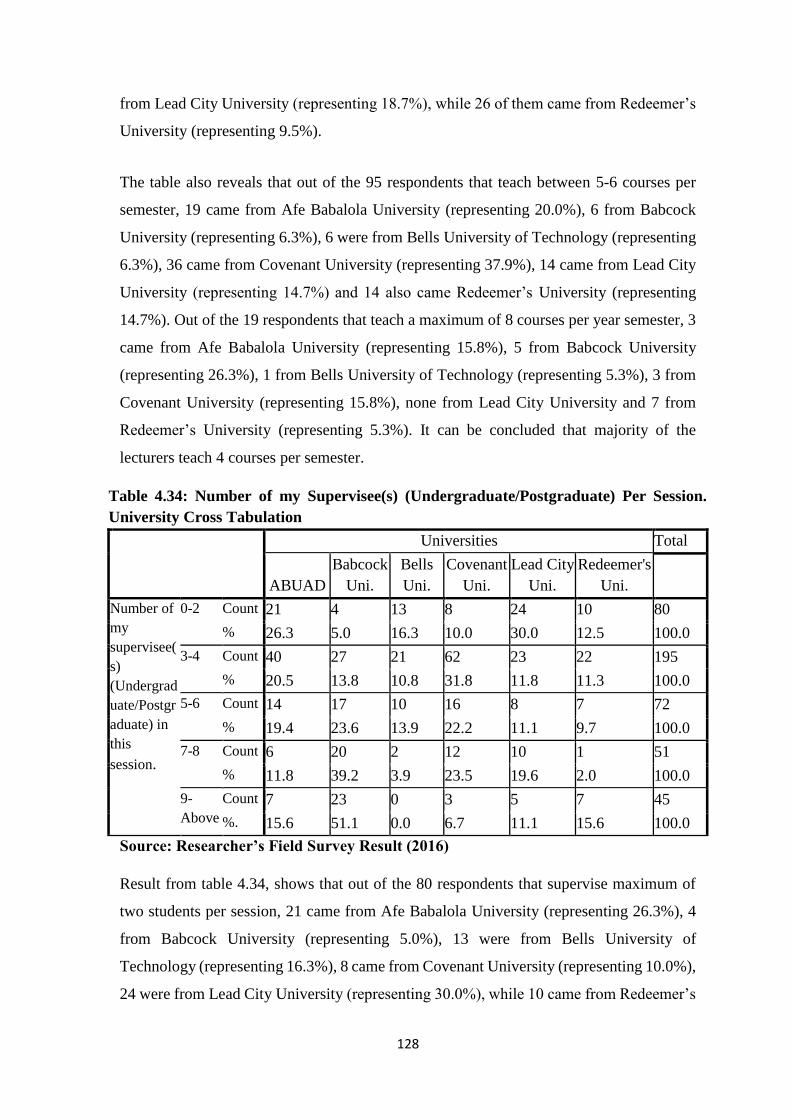
128
from Lead City University (representing 18.7%), while 26 of them came from Redeemer’s
University (representing 9.5%).
The table also reveals that out of the 95 respondents that teach between 5-6 courses per
semester, 19 came from Afe Babalola University (representing 20.0%), 6 from Babcock
University (representing 6.3%), 6 were from Bells University of Technology (representing
6.3%), 36 came from Covenant University (representing 37.9%), 14 came from Lead City
University (representing 14.7%) and 14 also came Redeemer’s University (representing
14.7%). Out of the 19 respondents that teach a maximum of 8 courses per year semester, 3
came from Afe Babalola University (representing 15.8%), 5 from Babcock University
(representing 26.3%), 1 from Bells University of Technology (representing 5.3%), 3 from
Covenant University (representing 15.8%), none from Lead City University and 7 from
Redeemer’s University (representing 5.3%). It can be concluded that majority of the
lecturers teach 4 courses per semester.
Table 4.34: Number of my Supervisee(s) (Undergraduate/Postgraduate) Per Session.
University Cross Tabulation
Universities Total
ABUAD
Babcock
Uni.
Bells
Uni.
Covenant
Uni.
Lead City
Uni.
Redeemer's
Uni.
Number of
my
supervisee(
s)
(Undergrad
uate/Postgr
aduate) in
this
session.
0-2 Count 21 4 13 8 24 10 80
% 26.3 5.0 16.3 10.0 30.0 12.5 100.0
3-4 Count 40 27 21 62 23 22 195
% 20.5 13.8 10.8 31.8 11.8 11.3 100.0
5-6 Count 14 17 10 16 8 7 72
% 19.4 23.6 13.9 22.2 11.1 9.7 100.0
7-8 Count 6 20 2 12 10 1 51
% 11.8 39.2 3.9 23.5 19.6 2.0 100.0
9-
Above
Count 7 23 0 3 5 7 45
%. 15.6 51.1 0.0 6.7 11.1 15.6 100.0
Source: Researcher’s Field Survey Result (2016)
Result from table 4.34, shows that out of the 80 respondents that supervise maximum of
two students per session, 21 came from Afe Babalola University (representing 26.3%), 4
from Babcock University (representing 5.0%), 13 were from Bells University of
Technology (representing 16.3%), 8 came from Covenant University (representing 10.0%),
24 were from Lead City University (representing 30.0%), while 10 came from Redeemer’s

129
University (representing 12.5%). Furthermore, out of the 195 respondents that supervise a
maximum 4 students per session, 40 came from Afe Babalola University (representing
20.5%), 73 from Babcock University (representing 13.8%), 21 were from Bells University
of Technology (representing 10.8%), 62 came from Covenant University (representing
31.8%), 23 were from Lead City University (representing 11.8%), while 22 of them came
from Redeemer’s University (representing 11.3%). The table also reveals that out of the 72
respondents that a supervise maximum of 6 students per session, 14 came from Afe
Babalola University (representing 19.4%), 17 from Babcock University (representing
23.6%), 10 were from Bells University of Technology (representing 13.9%), 16 came from
Covenant University (representing 22.2%), 8 came from Lead City University
(representing 11.1%) and 7 came Redeemer’s University (representing 9.7%).
It is also imperative to note here that out of the 51 respondents that supervise maximum of
8 students per session, 6 came from Afe Babalola University (representing 11.8%), 20 from
Babcock University (representing 39.2%), 2 were from Bells University of Technology
(representing 3.9%), 12 from Covenant University (representing 23.5%), 10 from Lead
City University and 1 from Redeemer’s University (representing 19.6% and 2.0%
respectively). Similarly, out of the 45 respondents that supervise more than 8 students per
session, 7 came from Afe Babalola University (representing 15.6%), 23 from Babcock
University (representing 51.1%), none from Bells University of Technology, 3 from
Covenant University (representing 6.7%), 5 from Lead City University and 7 from
Redeemer’s University (representing 11.1% and 15.6% in that order). It can be concluded
that majority of the lecturers supervise about 4 students on the average per session.

130
Table 4.35: Average Number of Committee(s) Belong to. * Universities Cross
Tabulation
Universities Total
ABUAD
Babcock
Uni.
Bells
Uni.
Covenant
Uni.
Lead City
Uni.
Redeemer's
Uni.
Average
number of
committee(s)
I belong to in
my
University.
0-2 Count 27 10 14 34 26 17 128
%. 21.1 7.8 10.9 26.6 20.3 13.3 100.0
3-4 Count 46 50 23 33 35 22 209
% 22.0 23.9 11.0 15.8 16.7 10.5 100.0
5-6 Count 14 22 8 25 9 7 85
% 16.5 25.9 9.4 29.4 10.6 8.2 100.0
7-8 Count 1 7 0 6 0 1 15
% 6.7 46.7 0.0 40.0 0.0 6.7 100.0
9-
Above
Count 0 2 0 3 0 0 5
%. 0.0 40.0 0.0 60.0 0.0 0.0 100.0
Source: Researcher’s Field Survey Result (2016)
Table 4.35, reveals that out of the 128 respondents that belong to a maximum of two
committees, 21 came from Afe Babalola University 10 from Babcock University, 14 were
from Bells University of Technology, 34 came from Covenant University, 26 were from
Lead City University while 17 came from Redeemer’s University (representing 7.8%,
10.9%, 26.6%, 20.3% and 13.3% in that order). Meanwhile, out of the 209 respondents that
that belong to a maximum of four committees, 46 (22.0%), 50 (23.9%), 23(11.0%), 33
(15.8%), 35 (16.7%), and 22(10.5%) are from Afe Babalola University, Babcock
University, Bells University of Technology, Covenant University, Lead City University
and Redeemer’s University in that order. Out of the 85 respondents that belong to maximum
of six committees, 14 came from Afe Babalola University 22 from Babcock University, 8
were from Bells University of Technology, 25 came from Covenant University, 9 were
from Lead City University while 7 came from Redeemer’s University (representing 16.5%,
25.9%, 9.4%, 29.4%, 10.6 and 8.5% respectively). Out of the 15 respondents that belong
to a maximum of eight committees, 1 came from Afe Babalola University 7 from Babcock
University, 6 came from Covenant University, while 1 came from Redeemer’s University,
none from Bells University of Technology and Lead City University (representing 6.7%,

131
46.7%, 40.0% and 6.7% respectively) It can be concluded that majority of the lecturers
belong to an average of 4 committees. (see Table 14:15d)
Table 4.36: Average Number of Papers I Reviewed in a Session. * Universities Cross
Tabulation
Universities Total
ABUAD
Babcock
Uni.
Bells
Uni.
Covenant
Uni.
Lead City
Uni.
Redeemer's
Uni.
Average
number of
papers I
reviewed in
a session.
0-2 Count 16 22 16 33 14 17 118
% 13.6 18.6 13.6 28.0 11.9 14.4 100.0
3-4 Count 28 40 25 36 33 17 179
% 15.6 22.3 14.0 20.1 18.4 9.5 100.0
5-6 Count 32 10 4 22 18 7 93
% 34.4 10.8 4.3 23.7 19.4 7.5 100.0
7-8 Count 12 7 1 5 0 3 28
% 42.9 25.0 3.6 17.9 0.0 10.7 100.0
9-
Above
Count 0 12 0 5 5 3 25
%. 0.0 48.0 0.0 20.0 20.0 12.0 100.0
Source: Researcher’s Field Survey Result (2016)
Table 4.36, reveals that out of the 297(67%) respondents that reviewed between 0-4 papers
in a session, 44 came from Afe Babalola University, 62 from Babcock University, 41 were
from Bells University of Technology, 69 came from Covenant University, 47 were from
Lead City University, while 34 came from Redeemer’s University. It can therefore be said
that majority of the Lecturers review between 0-4 papers per session (see Table 14:36).

132
4.5 Paired Sample Test of Perception of All the Sampled Universities
University 1: Afe Babalola University
Table 4.37 below describes the responses of the respondents on the four employee
resourcing strategies variables.
Table 4.37: Paired Samples Test of Perception of Afe Babalola University Staff on
Employee Resourcing Strategies and Corporate Image of the University
Paired Samples Test
Paired Differences
T df
Sig. (2-
tailed) Mean
Std.
Dev.
Std. Error
Mean
95% Confidence
Interval of the
Difference
Lower Upper
Obj. 2 Recuit_Stra -
Reserch_Image -1.0019 .66774 .07118 -1.14337 -.86041 -14.08 87 .000
Obj. 3 Select_Stra -
Corp_Image .20833 2.53094 .26980 -.32792 .74459 .772 87 .442
Obj. 1 HRP_Stra -
Brand_Image -.38258 .62010 .06610 -.51396 -.25119 -5.788 87 .000
Obj. 4 Retentn_Stra -
Corp_Identity -.50969 .46007 .04904 -.60717 -.41221 -10.40 87 .000
Source: Researcher’s Field Survey Result (2016)
Sequel to Table 4.37 above, the column labeled Sig. (2-tailed) shows the probability value
and the value is significant if it is less than 0.05. From our analysis above, in comparing
the responses in the University under consideration on the first variable of recruitment
strategies, the probability value is .000. This means that the actual probability value was
less than specified alpha value of .05. This shows that there is a significant difference in
the way respondents in Afe Babalola University perceive employee resourcing strategies
and University corporate image. On the other hand, for the constructs on selection strategies
and corporate image, there is no significant difference in the way respondents in this
University view them. At 0.000, there is a significant difference in the way respondents
perceived human resource planning and University’s corporate reputation. Again, at 0.000
for retention strategies, there is a significant difference in the way respondents perceived
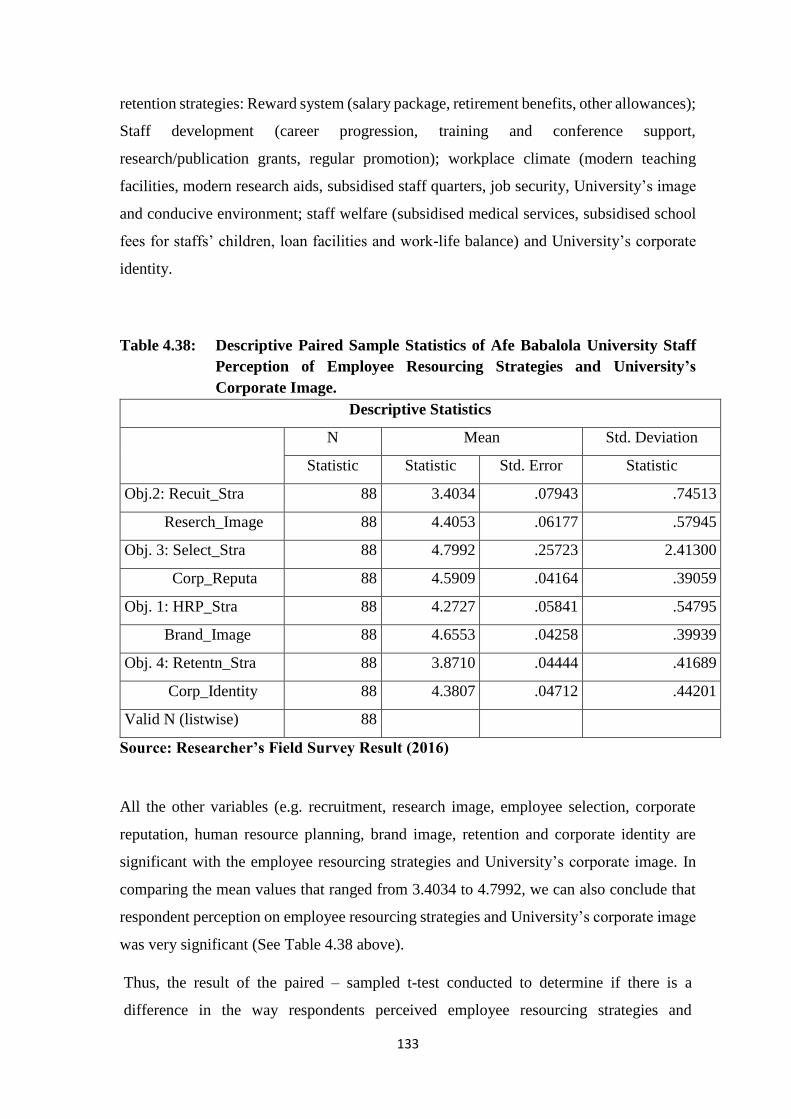
133
retention strategies: Reward system (salary package, retirement benefits, other allowances);
Staff development (career progression, training and conference support,
research/publication grants, regular promotion); workplace climate (modern teaching
facilities, modern research aids, subsidised staff quarters, job security, University’s image
and conducive environment; staff welfare (subsidised medical services, subsidised school
fees for staffs’ children, loan facilities and work-life balance) and University’s corporate
identity.
Table 4.38: Descriptive Paired Sample Statistics of Afe Babalola University Staff
Perception of Employee Resourcing Strategies and University’s
Corporate Image.
Descriptive Statistics
N Mean Std. Deviation
Statistic Statistic Std. Error Statistic
Obj.2: Recuit_Stra 88 3.4034 .07943 .74513
Reserch_Image 88 4.4053 .06177 .57945
Obj. 3: Select_Stra 88 4.7992 .25723 2.41300
Corp_Reputa 88 4.5909 .04164 .39059
Obj. 1: HRP_Stra 88 4.2727 .05841 .54795
Brand_Image 88 4.6553 .04258 .39939
Obj. 4: Retentn_Stra 88 3.8710 .04444 .41689
Corp_Identity 88 4.3807 .04712 .44201
Valid N (listwise) 88
Source: Researcher’s Field Survey Result (2016)
All the other variables (e.g. recruitment, research image, employee selection, corporate
reputation, human resource planning, brand image, retention and corporate identity are
significant with the employee resourcing strategies and University’s corporate image. In
comparing the mean values that ranged from 3.4034 to 4.7992, we can also conclude that
respondent perception on employee resourcing strategies and University’s corporate image
was very significant (See Table 4.38 above).
Thus, the result of the paired – sampled t-test conducted to determine if there is a
difference in the way respondents perceived employee resourcing strategies and
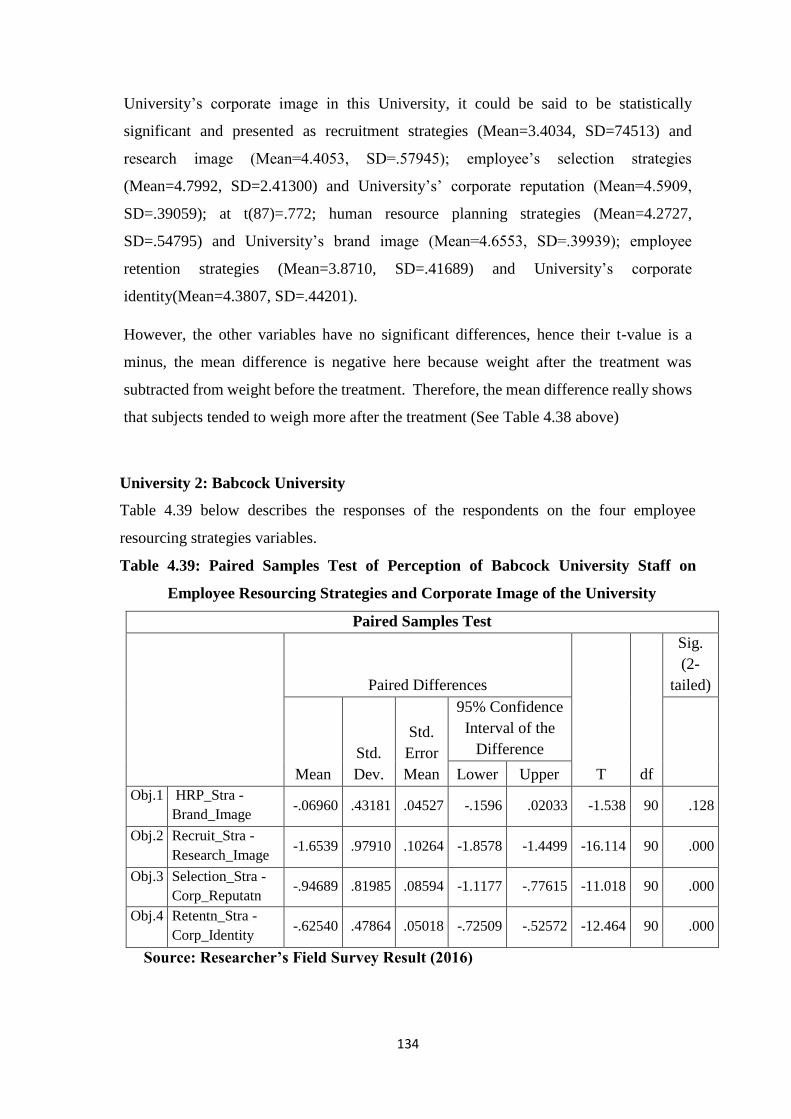
134
University’s corporate image in this University, it could be said to be statistically
significant and presented as recruitment strategies (Mean=3.4034, SD=74513) and
research image (Mean=4.4053, SD=.57945); employee’s selection strategies
(Mean=4.7992, SD=2.41300) and University’s’ corporate reputation (Mean=4.5909,
SD=.39059); at t(87)=.772; human resource planning strategies (Mean=4.2727,
SD=.54795) and University’s brand image (Mean=4.6553, SD=.39939); employee
retention strategies (Mean=3.8710, SD=.41689) and University’s corporate
identity(Mean=4.3807, SD=.44201).
However, the other variables have no significant differences, hence their t-value is a
minus, the mean difference is negative here because weight after the treatment was
subtracted from weight before the treatment. Therefore, the mean difference really shows
that subjects tended to weigh more after the treatment (See Table 4.38 above)
University 2: Babcock University
Table 4.39 below describes the responses of the respondents on the four employee
resourcing strategies variables.
Table 4.39: Paired Samples Test of Perception of Babcock University Staff on
Employee Resourcing Strategies and Corporate Image of the University
Paired Samples Test
Paired Differences
T df
Sig.
(2-
tailed)
Mean
Std.
Dev.
Std.
Error
Mean
95% Confidence
Interval of the
Difference
Lower Upper
Obj.1 HRP_Stra -
Brand_Image -.06960 .43181 .04527 -.1596 .02033 -1.538 90 .128
Obj.2 Recruit_Stra -
Research_Image -1.6539 .97910 .10264 -1.8578 -1.4499 -16.114 90 .000
Obj.3 Selection_Stra -
Corp_Reputatn -.94689 .81985 .08594 -1.1177 -.77615 -11.018 90 .000
Obj.4 Retentn_Stra -
Corp_Identity -.62540 .47864 .05018 -.72509 -.52572 -12.464 90 .000
Source: Researcher’s Field Survey Result (2016)

135
Following from Table 4.39 above, the column labeled Sig. (2-tailed) is the probability value
and the value is significant if it’s less than 0.05; then we can conclude that there is a
significant difference between our two scores. Comparing the responses in the University
under consideration on all the variables, the probability values are 0.128, 0.000, 0.000 and
0.000 in that order. This means that of all the variables of human resource planning and
brand image probability value are above the specified alpha value of .05 while others are
less than the actual probability values of .005. Therefore, we can conclude that there is
significant difference in the way respondents in Babcock University perceive employee
resourcing strategies variable (recruitment, selection and retention strategies) and
University corporate image (research image, corporate reputation and corporate identity)
except for human resource planning strategies and brand image of the University.
Table 4.40: Descriptive Paired Sample Statistics of Babcock University Staff
Perception of Employee Resourcing Strategies and University’s
Corporate Image
Descriptive Statistics
N Mean Std. Deviation
Statistic Statistic Std. Error Statistic
Obj. 1: HRP_Stra 91 4.4652 .05410 .51611
Brand_Image 91 4.5348 .04447 .42420
Obj.2: Recruit_Stra 91 3.2692 .09047 .86300
Research_Image 91 3.9231 .07604 .72534
Obj.3: Selection_Stra 91 3.6410 .08090 .77177
Corp_Reputatn 91 4.5879 .05099 .48645
Obj. 4: Retentn_Stra 91 3.9405 .06163 .58794
Corp_Identity 91 4.5659 .05076 .48425
Valid N (listwise) 91
Source: Researcher’s Field Survey Result (2016)
All the other variables (e.g. human resource planning, brand image, recruitment, research
image, employee selection, corporate reputation, retention and corporate identity are
significant with the employee resourcing strategies and University’s corporate image. In
comparing the mean values that ranged from 3.2692 to 4.5879, we can also conclude that

136
respondent perception on employee resourcing strategies and University’s corporate image
was very significant (See Table 4.19 above). Thus, the result of the paired – sampled t-test
conducted to determine if there is a difference in the way respondents perceived employee
resourcing strategies and University’s corporate image in this University, could be said to
be statistically significant and presented as human resource planning strategies
(Mean=4.4652, SD=.51611) and University’s brand image (Mean=4.5348, SD=.42420);
recruitment strategies (Mean=3.2692, SD=.86300) and research image (Mean=3.9231,
SD=.72534); employee’s selection strategy (Mean=3.6410, SD=.77177) and University’s’
corporate reputation (Mean=4.5879, SD=.48645); employee retention strategies
(Mean=3.9405, SD=.58794) and University’s corporate identity (Mean=4.5659,
SD=.48425. All variables have no significant differences. It is also important to report that
their t-value is a minus, the mean difference is negative here because weight after the
treatment was subtracted from weight before the treatment. The mean difference shows
that subjects tend to weigh more after the treatment (See Table 4.40 above)
University 3: Bells University of Technology
Table 4.41 below describes the responses on the four employee resourcing strategies
variables.
Table 4.41: Paired Samples Test of Perception of Bells University of Technology
Staff on Employee Resourcing Strategies and Corporate Image of the
University
Paired Samples Test
Paired Differences
t df
Sig. (2-
tailed) Mean
Std.
Dev.
Std.
Error
Mean
95% Confidence
Interval of the
Difference
Lower Upper
Obj. 1 HRP_Stra -
Brand_Image -.06522 .45877 .06764 -.20145 .07102 -.964 45 .340
Obj. 2 Recruit_Stra -
Reserach_Image -1.5688 .99292 .14640 -1.86370 -1.27398 -10.716 45 .000
Obj 3. Selection_Star -
Corp_Reputation -.93116 .82520 .12167 -1.17621 -.68610 -7.653 45 .000
Obj. 4 Retentn_Stra -
Corp_Identity -.40409 .51764 .07632 -.55781 -.25037 -5.295 45 .000
Source: Researcher’s Field Survey Result (2016)
Sequel to Table 4.41 above, the column labeled Sig. (2-tailed) is our probability value and
the value is significant if it’s less than 0.05; then we can conclude that there is a significant

137
difference between our two scores. From our analysis above, in comparing the responses
in the University under consideration on the first variable of human resource planning and
brand image, the probability value is .340. This means that the actual probability value was
more than .005. This value is substantially higher than our specified alpha value of .05.
Therefore, we can conclude that there is no significant difference in the way respondents
in Bells University of Technology perceive employee resourcing strategies and University
corporate image.
However, for the constructs on recruitment strategies and research image; selection
strategies and corporate image, there is a significant difference in the way respondents in
this University view them. At 0.000, there is a significant difference in the way respondents
perceived recruitment strategies and research image, selection strategies and University’s
corporate reputation. Again, at 0.000 for retention strategies, there is a significant
difference in the way respondents perceived retention strategies such as: Reward system
(salary package, retirement benefits, other allowances); Staff development (career
progression, training and conference support, research/publication grants, regular
promotion); workplace climate (modern teaching facilities, modern research aids,
subsidised staff quarters, job security, University’s image and conducive environment; staff
welfare (subsidised medical services, subsidised school fees for staffs’ children, loan
facilities and work-life balance) and University’s corporate identity.
Table 4.42: Descriptive Paired Sample Statistics of Bells University of Technology
Staff Perception of Employee Resourcing Strategies and University’s
Corporate Image
Descriptive Statistics
N Mean Std. Deviation
Statistic Statistic Std. Error Statistic
HRP_Stra 46 4.4493 .07906 .53618
Brand_Image 46 4.5145 .06191 .41991
Recruit_Stra 46 3.2500 .11180 .75829
Reserach_Image 46 3.8188 .10346 .70170
Selection_Star 46 3.5797 .11696 .79329
Corp_Reputation 46 4.5109 .07205 .48864
Retentn_Stra 46 3.2698 .08616 .58438
Corp_Identity 46 3.6739 .09481 .64306
Valid N (listwise) 46
Source: Researcher’s Field Survey Result (2016)

138
All the other variables (e.g. human resource planning, brand image, recruitment, research
image, employee selection, corporate reputation, retention and corporate identity are
significant with the employee resourcing strategies and University’s corporate image. In
comparing the mean values that ranged from 3.2500 to 4.5145, we can also conclude that
respondent perception on employee resourcing strategies and University’s corporate image
was very significant (See Table 4.21 above). Thus, the result of the paired – sampled t-test
conducted to determine if there is a difference in the way respondents perceived employee
resourcing strategies and University’s corporate image in this University, could be said to
be statistically significant and presented as human resource planning strategies
(Mean=4.4493, SD=.53618) and University’s brand image (Mean=4.5145, SD=.41991);
recruitment strategies (Mean=3.2500, SD=.75829) and research image (Mean=3.8188,
SD=.70170); employee’s selection strategies (Mean=3.5797, SD=..79329) and
University’s’ corporate reputation (Mean=4.5109, SD=.48864); employee retention
strategies (Mean=3.2698, SD=.58438) and University’s corporate identity (Mean=3.6739,
SD=.64306). Thus, the t(45) = -.964, -10.716, -7.653 and -5.295 respectively. The t-values
carry minus; it suggests that the mean difference is negative because weight after the
treatment was subtracted from weight before the treatment. Therefore, the mean difference
shows that subjects tended to weigh more after the treatment (See Tables 4.41 and 4.42
above)
University 4: Covenant University
Table 4.43 below describes the respondents’ views on the four employee resourcing
strategies variables.
For Covenant University, Table 4.43 below shows the responses on the employee
resourcing strategies variables and University’s corporate image variables. From the
analysis in Table 4.43 below, the responses show that all the probability values are less
than .005.

139
Table 4.44: Paired Samples Test of Perception of Covenant University Staff on
Employee Resourcing Strategies and Corporate Image of the University
Paired Samples Test
Paired Differences
t df
Sig. (2-
tailed) Mean
Std.
Dev.
Std.
Error
Mean
95% Confidence
Interval of the
Difference
Lower Upper
Obj. 1 HRP_Stra -
Brand_Image -.16172 .40446 .04025 -.24156 -.08187 -4.018 100 .000
Obj. 2 Recruit_Stra -
Reserach_Image -1.7034 1.45457 .14473 -1.9909 -1.4166 -11.772 100 .000
Obj.3 Selection_Stra -
Corp_Reputatn -.27558 .45242 .04502 -.36489 -.18626 -6.122 100 .000
Obj. 4 Retentn_Stra -
Corp_Identity -.8072 .68478 .06814 -.94241 -.67204 -11.847 100 .000
Source: Researcher’s Field Survey Result (2016)
Since all the values are lower than our specified alpha value of .05, we can then conclude
that there is a significant difference in the way respondents in Covenant University perceive
employee resourcing strategies and University’s corporate image variables such as: human
resource planning and University’s brand image; recruitment strategies and research image;
selection strategies and corporate reputation, retention strategies: Reward system (salary
package, retirement benefits, other allowances); Staff development (career progression,
training and conference support, research/publication grants, regular promotion);
workplace climate (modern teaching facilities, modern research aids, subsidised staff
quarters, job security, University’s image and conducive environment; staff welfare
(subsidised medical services, subsidised school fees for staffs’ children, loan facilities and
work-life balance) and University’s corporate identity.
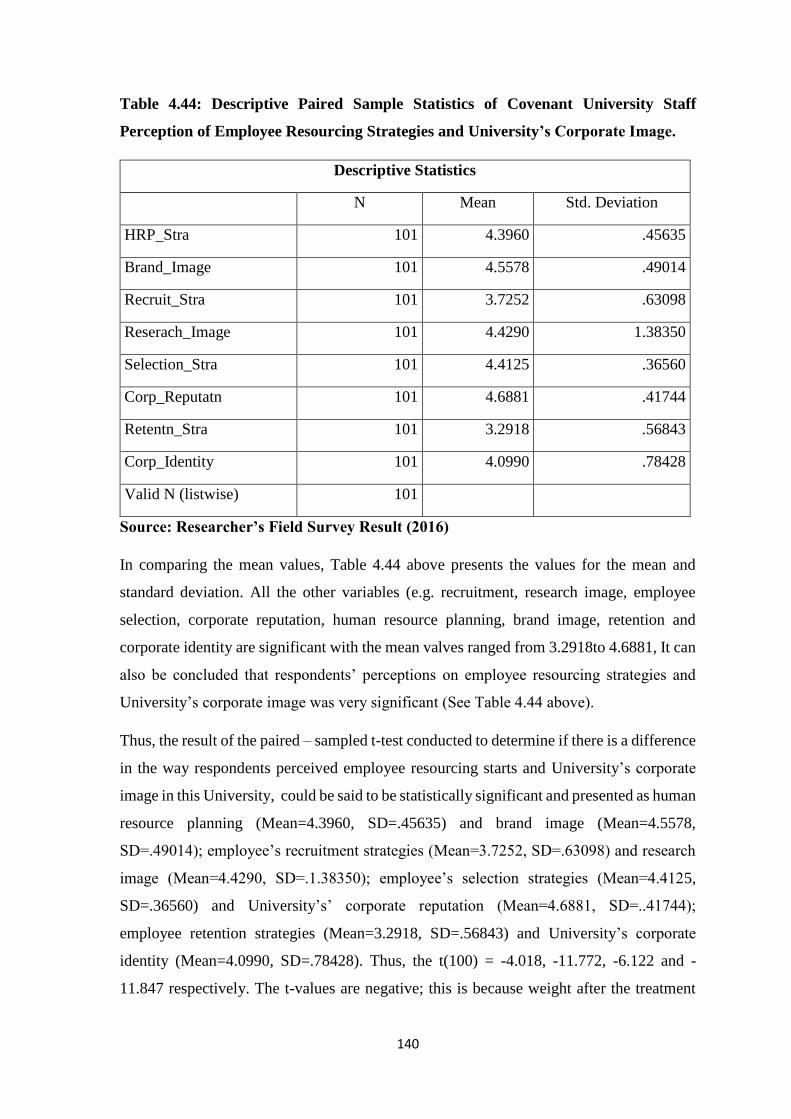
140
Table 4.44: Descriptive Paired Sample Statistics of Covenant University Staff
Perception of Employee Resourcing Strategies and University’s Corporate Image.
Descriptive Statistics
N Mean Std. Deviation
HRP_Stra 101 4.3960 .45635
Brand_Image 101 4.5578 .49014
Recruit_Stra 101 3.7252 .63098
Reserach_Image 101 4.4290 1.38350
Selection_Stra 101 4.4125 .36560
Corp_Reputatn 101 4.6881 .41744
Retentn_Stra 101 3.2918 .56843
Corp_Identity 101 4.0990 .78428
Valid N (listwise) 101
Source: Researcher’s Field Survey Result (2016)
In comparing the mean values, Table 4.44 above presents the values for the mean and
standard deviation. All the other variables (e.g. recruitment, research image, employee
selection, corporate reputation, human resource planning, brand image, retention and
corporate identity are significant with the mean valves ranged from 3.2918to 4.6881, It can
also be concluded that respondents’ perceptions on employee resourcing strategies and
University’s corporate image was very significant (See Table 4.44 above).
Thus, the result of the paired – sampled t-test conducted to determine if there is a difference
in the way respondents perceived employee resourcing starts and University’s corporate
image in this University, could be said to be statistically significant and presented as human
resource planning (Mean=4.3960, SD=.45635) and brand image (Mean=4.5578,
SD=.49014); employee’s recruitment strategies (Mean=3.7252, SD=.63098) and research
image (Mean=4.4290, SD=.1.38350); employee’s selection strategies (Mean=4.4125,
SD=.36560) and University’s’ corporate reputation (Mean=4.6881, SD=..41744);
employee retention strategies (Mean=3.2918, SD=.56843) and University’s corporate
identity (Mean=4.0990, SD=.78428). Thus, the t(100) = -4.018, -11.772, -6.122 and -
11.847 respectively. The t-values are negative; this is because weight after the treatment
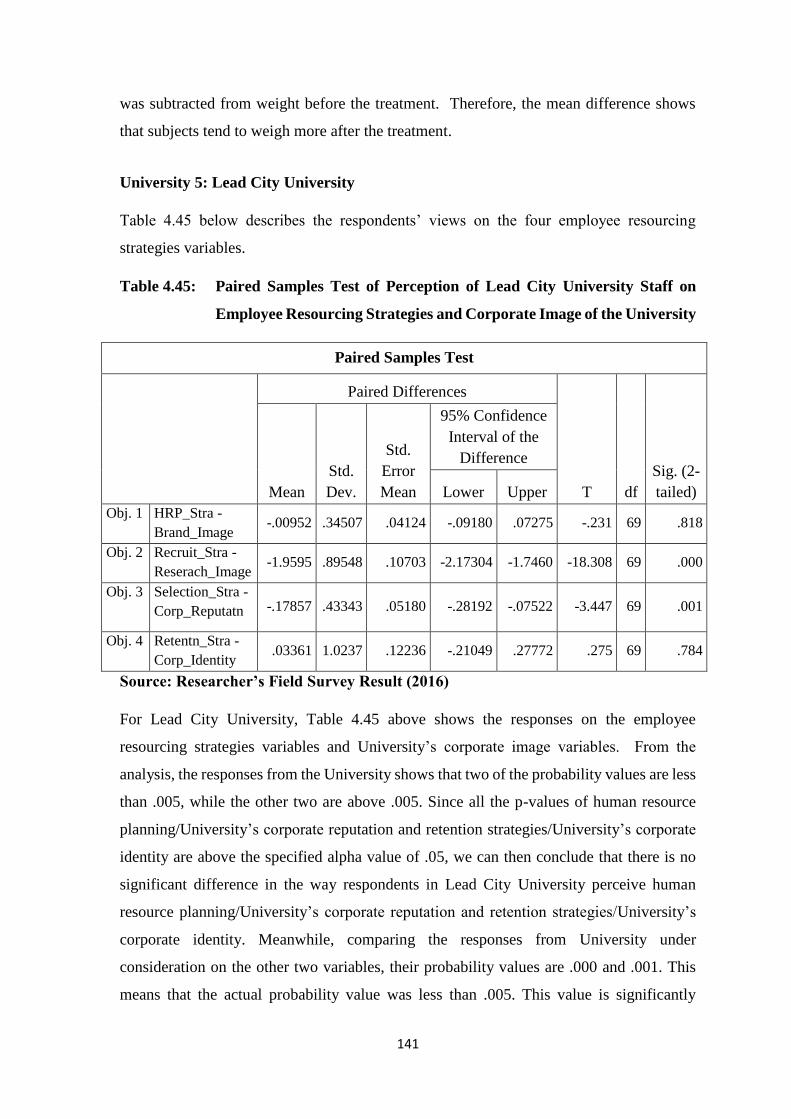
141
was subtracted from weight before the treatment. Therefore, the mean difference shows
that subjects tend to weigh more after the treatment.
University 5: Lead City University
Table 4.45 below describes the respondents’ views on the four employee resourcing
strategies variables.
Table 4.45: Paired Samples Test of Perception of Lead City University Staff on
Employee Resourcing Strategies and Corporate Image of the University
Paired Samples Test
Paired Differences
T df
Sig. (2-
tailed) Mean
Std.
Dev.
Std.
Error
Mean
95% Confidence
Interval of the
Difference
Lower Upper
Obj. 1 HRP_Stra -
Brand_Image -.00952 .34507 .04124 -.09180 .07275 -.231 69 .818
Obj. 2 Recruit_Stra -
Reserach_Image -1.9595 .89548 .10703 -2.17304 -1.7460 -18.308 69 .000
Obj. 3 Selection_Stra -
Corp_Reputatn -.17857 .43343 .05180 -.28192 -.07522 -3.447 69 .001
Obj. 4 Retentn_Stra -
Corp_Identity .03361 1.0237 .12236 -.21049 .27772 .275 69 .784
Source: Researcher’s Field Survey Result (2016)
For Lead City University, Table 4.45 above shows the responses on the employee
resourcing strategies variables and University’s corporate image variables. From the
analysis, the responses from the University shows that two of the probability values are less
than .005, while the other two are above .005. Since all the p-values of human resource
planning/University’s corporate reputation and retention strategies/University’s corporate
identity are above the specified alpha value of .05, we can then conclude that there is no
significant difference in the way respondents in Lead City University perceive human
resource planning/University’s corporate reputation and retention strategies/University’s
corporate identity. Meanwhile, comparing the responses from University under
consideration on the other two variables, their probability values are .000 and .001. This
means that the actual probability value was less than .005. This value is significantly
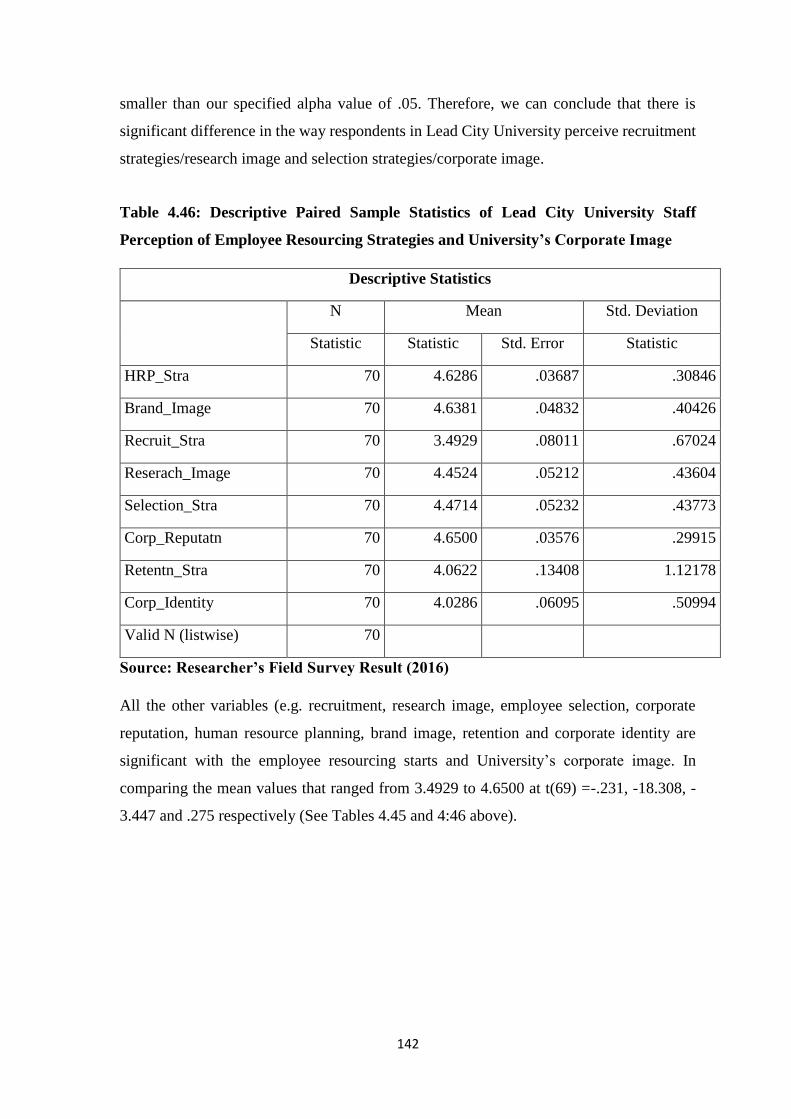
142
smaller than our specified alpha value of .05. Therefore, we can conclude that there is
significant difference in the way respondents in Lead City University perceive recruitment
strategies/research image and selection strategies/corporate image.
Table 4.46: Descriptive Paired Sample Statistics of Lead City University Staff
Perception of Employee Resourcing Strategies and University’s Corporate Image
Descriptive Statistics
N Mean Std. Deviation
Statistic Statistic Std. Error Statistic
HRP_Stra 70 4.6286 .03687 .30846
Brand_Image 70 4.6381 .04832 .40426
Recruit_Stra 70 3.4929 .08011 .67024
Reserach_Image 70 4.4524 .05212 .43604
Selection_Stra 70 4.4714 .05232 .43773
Corp_Reputatn 70 4.6500 .03576 .29915
Retentn_Stra 70 4.0622 .13408 1.12178
Corp_Identity 70 4.0286 .06095 .50994
Valid N (listwise) 70
Source: Researcher’s Field Survey Result (2016)
All the other variables (e.g. recruitment, research image, employee selection, corporate
reputation, human resource planning, brand image, retention and corporate identity are
significant with the employee resourcing starts and University’s corporate image. In
comparing the mean values that ranged from 3.4929 to 4.6500 at t(69) =-.231, -18.308, -
3.447 and .275 respectively (See Tables 4.45 and 4:46 above).
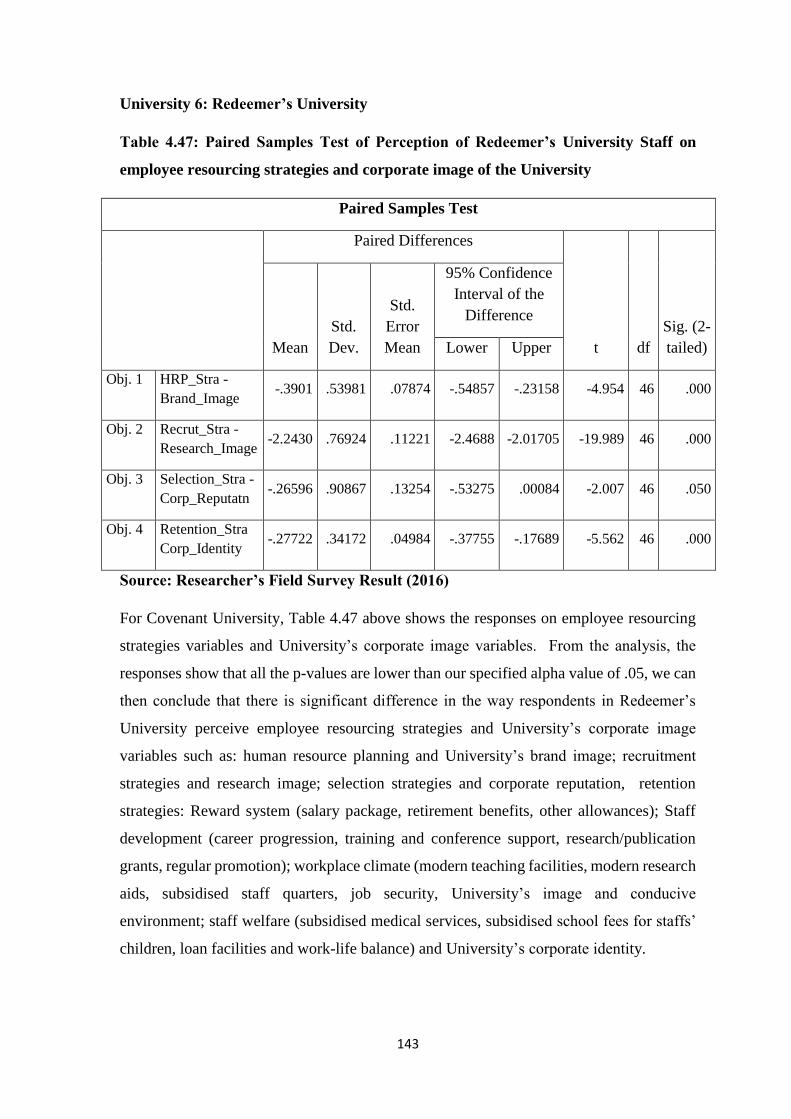
143
University 6: Redeemer’s University
Table 4.47: Paired Samples Test of Perception of Redeemer’s University Staff on
employee resourcing strategies and corporate image of the University
Paired Samples Test
Paired Differences
t df
Sig. (2-
tailed) Mean
Std.
Dev.
Std.
Error
Mean
95% Confidence
Interval of the
Difference
Lower Upper
Obj. 1 HRP_Stra -
Brand_Image -.3901 .53981 .07874 -.54857 -.23158 -4.954 46 .000
Obj. 2 Recrut_Stra -
Research_Image -2.2430 .76924 .11221 -2.4688 -2.01705 -19.989 46 .000
Obj. 3 Selection_Stra -
Corp_Reputatn -.26596 .90867 .13254 -.53275 .00084 -2.007 46 .050
Obj. 4 Retention_Stra
Corp_Identity -.27722 .34172 .04984 -.37755 -.17689 -5.562 46 .000
Source: Researcher’s Field Survey Result (2016)
For Covenant University, Table 4.47 above shows the responses on employee resourcing
strategies variables and University’s corporate image variables. From the analysis, the
responses show that all the p-values are lower than our specified alpha value of .05, we can
then conclude that there is significant difference in the way respondents in Redeemer’s
University perceive employee resourcing strategies and University’s corporate image
variables such as: human resource planning and University’s brand image; recruitment
strategies and research image; selection strategies and corporate reputation, retention
strategies: Reward system (salary package, retirement benefits, other allowances); Staff
development (career progression, training and conference support, research/publication
grants, regular promotion); workplace climate (modern teaching facilities, modern research
aids, subsidised staff quarters, job security, University’s image and conducive
environment; staff welfare (subsidised medical services, subsidised school fees for staffs’
children, loan facilities and work-life balance) and University’s corporate identity.
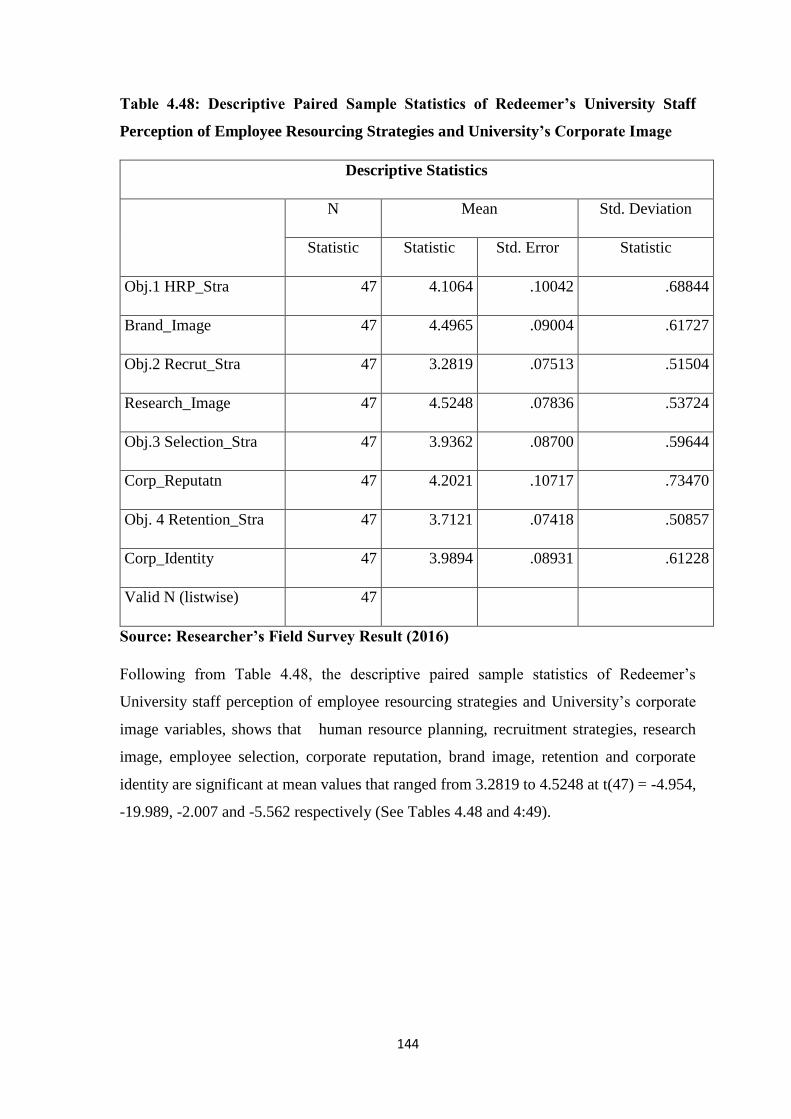
144
Table 4.48: Descriptive Paired Sample Statistics of Redeemer’s University Staff
Perception of Employee Resourcing Strategies and University’s Corporate Image
Descriptive Statistics
N Mean Std. Deviation
Statistic Statistic Std. Error Statistic
Obj.1 HRP_Stra 47 4.1064 .10042 .68844
Brand_Image 47 4.4965 .09004 .61727
Obj.2 Recrut_Stra 47 3.2819 .07513 .51504
Research_Image 47 4.5248 .07836 .53724
Obj.3 Selection_Stra 47 3.9362 .08700 .59644
Corp_Reputatn 47 4.2021 .10717 .73470
Obj. 4 Retention_Stra 47 3.7121 .07418 .50857
Corp_Identity 47 3.9894 .08931 .61228
Valid N (listwise) 47
Source: Researcher’s Field Survey Result (2016)
Following from Table 4.48, the descriptive paired sample statistics of Redeemer’s
University staff perception of employee resourcing strategies and University’s corporate
image variables, shows that human resource planning, recruitment strategies, research
image, employee selection, corporate reputation, brand image, retention and corporate
identity are significant at mean values that ranged from 3.2819 to 4.5248 at t(47) = -4.954,
-19.989, -2.007 and -5.562 respectively (See Tables 4.48 and 4:49).
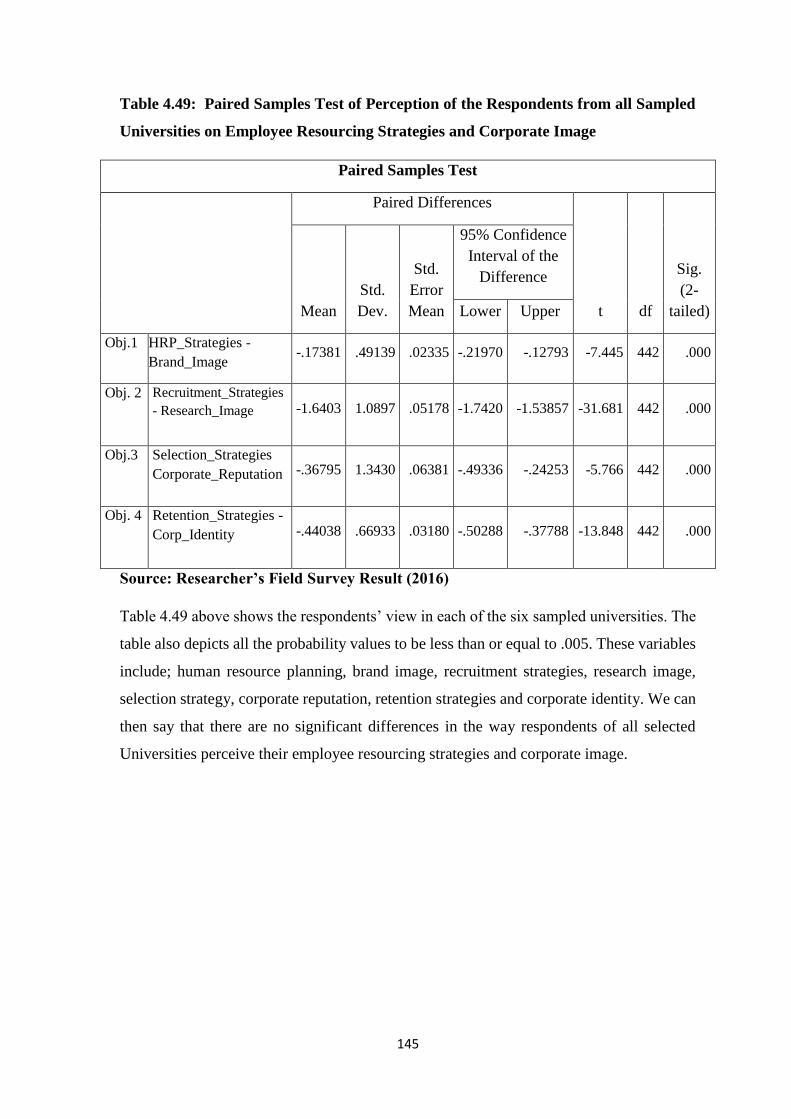
145
Table 4.49: Paired Samples Test of Perception of the Respondents from all Sampled
Universities on Employee Resourcing Strategies and Corporate Image
Paired Samples Test
Paired Differences
t df
Sig.
(2-
tailed) Mean
Std.
Dev.
Std.
Error
Mean
95% Confidence
Interval of the
Difference
Lower Upper
Obj.1 HRP_Strategies -
Brand_Image -.17381 .49139 .02335 -.21970 -.12793 -7.445 442 .000
Obj. 2 Recruitment_Strategies
- Research_Image -1.6403 1.0897 .05178 -1.7420 -1.53857 -31.681 442 .000
Obj.3 Selection_Strategies
Corporate_Reputation -.36795 1.3430 .06381 -.49336 -.24253 -5.766 442 .000
Obj. 4 Retention_Strategies -
Corp_Identity -.44038 .66933 .03180 -.50288 -.37788 -13.848 442 .000
Source: Researcher’s Field Survey Result (2016)
Table 4.49 above shows the respondents’ view in each of the six sampled universities. The
table also depicts all the probability values to be less than or equal to .005. These variables
include; human resource planning, brand image, recruitment strategies, research image,
selection strategy, corporate reputation, retention strategies and corporate identity. We can
then say that there are no significant differences in the way respondents of all selected
Universities perceive their employee resourcing strategies and corporate image.
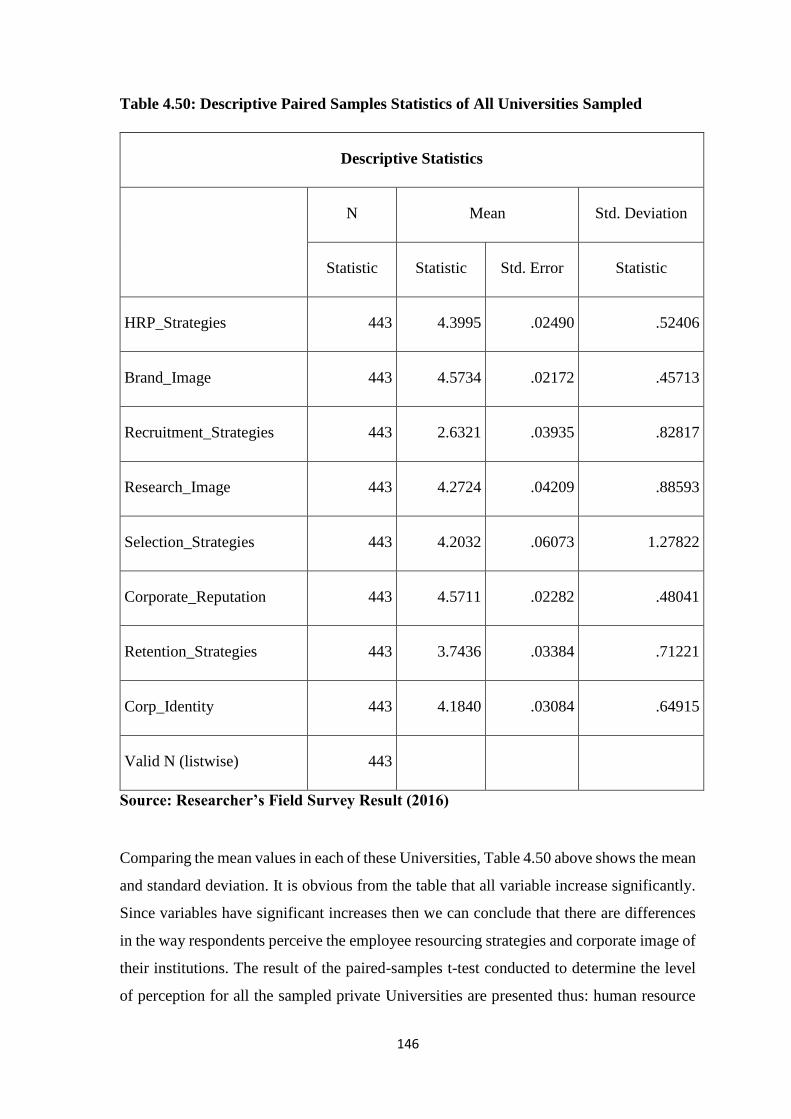
146
Table 4.50: Descriptive Paired Samples Statistics of All Universities Sampled
Descriptive Statistics
N Mean Std. Deviation
Statistic Statistic Std. Error Statistic
HRP_Strategies 443 4.3995 .02490 .52406
Brand_Image 443 4.5734 .02172 .45713
Recruitment_Strategies 443 2.6321 .03935 .82817
Research_Image 443 4.2724 .04209 .88593
Selection_Strategies 443 4.2032 .06073 1.27822
Corporate_Reputation 443 4.5711 .02282 .48041
Retention_Strategies 443 3.7436 .03384 .71221
Corp_Identity 443 4.1840 .03084 .64915
Valid N (listwise) 443
Source: Researcher’s Field Survey Result (2016)
Comparing the mean values in each of these Universities, Table 4.50 above shows the mean
and standard deviation. It is obvious from the table that all variable increase significantly.
Since variables have significant increases then we can conclude that there are differences
in the way respondents perceive the employee resourcing strategies and corporate image of
their institutions. The result of the paired-samples t-test conducted to determine the level
of perception for all the sampled private Universities are presented thus: human resource
147
planning strategies (Mean=4.3995, SD=.52406) and University’s brand image
(Mean=4.5734, SD=.45713); recruitment strategies (Mean=2.6321, SD=.82817) and
research image (Mean=4.2724, SD=.88593); employee’s selection strategies
(Mean=4.2032 SD=.1.27822) and University’s’ corporate reputation (Mean=4.5711,
SD=.48041); employee retention strategies (Mean=3.7436, SD=.71221 and University’s
corporate identity (Mean=4.1840, SD=.64915). The t(442)= -7.445, -31.681, -5.766 and -
13.848 in that order. However, all variables have no significant differences, hence their t-
value is a minus, and the mean difference is negative here because weight after the
treatment was subtracted from weight before the treatment. Therefore, the mean difference
really shows that subjects tended to weigh more after the treatment (see Table 4:50)

148
Table 4.51: Mean Scores and Standard Deviations of Measures According to the Selected Private Universities
ABUAD BABCOCK BELLS CU LEADCITY RUN
Mean Std.
Dev.
Mean Std.
Dev.
Mean Std.
Dev.
Mean Std.
Dev.
Mean Std.
Dev.
Mean Std.
Dev.
HRPS 4.2727 .54795 4.4652 .51611 4.4493 .53618 4.3960 .45635 4.6286 .30846 4.3995 .52406
BI 4.6553 .39939 4.5348 .42420 4.5145 .41991 4.5578 .49014 4.6381 .40426 4.5734 .45713
ERS 3.4034 .74513 3.2692 .86300 3.2500 .75829 3.7252 .63098 3.4929 .67024 3.6321 .82817
Res I 4.4053 .57945 3.9231 .72534 3.8188 .70170 4.4290 1.38350 4.4524 .43604 4.2724 .88593
ESS 4.7992 2.41300 3.6410 .77177 3.5797 .79329 4.4125 .36560 4.4714 .43773 4.2032 1.27822
UCR 4.5909 .39059 4.5879 .48645 4.5109 .48864 4.6881 .41744 4.6500 .30015 4.5711 .48041
ERetS 3.8710 .41689 3.9405 .58794 3.2698 .58438 3.2918 .56843 4.0622 1.12178 3.7436 .71221
UCI 4.3807 .44201 4.5659 .48425 3.6739 .64306 4.0990 .78428 4.0286 .50994 4.1840 .64915
HRPS: Human Resource Planning Strategies BI: Brand Image
ERS: Employee Recruitment Strategies ResI: Research Image
ESS: Employee Selection Strategies UCR: University’s Corporate Reputation
ERetS: Employee Retention Strategies UCI: University’s Corporate Identity
Source: Researcher’s Field Survey Result (2016)
Table 4.51 shows that none of the standard deviations were below 0.3. The implication of this is that there is a great variability among the six
selected private Universities in Southwest, Nigeria. The mean score in each measure varies greatly from one University to the other.
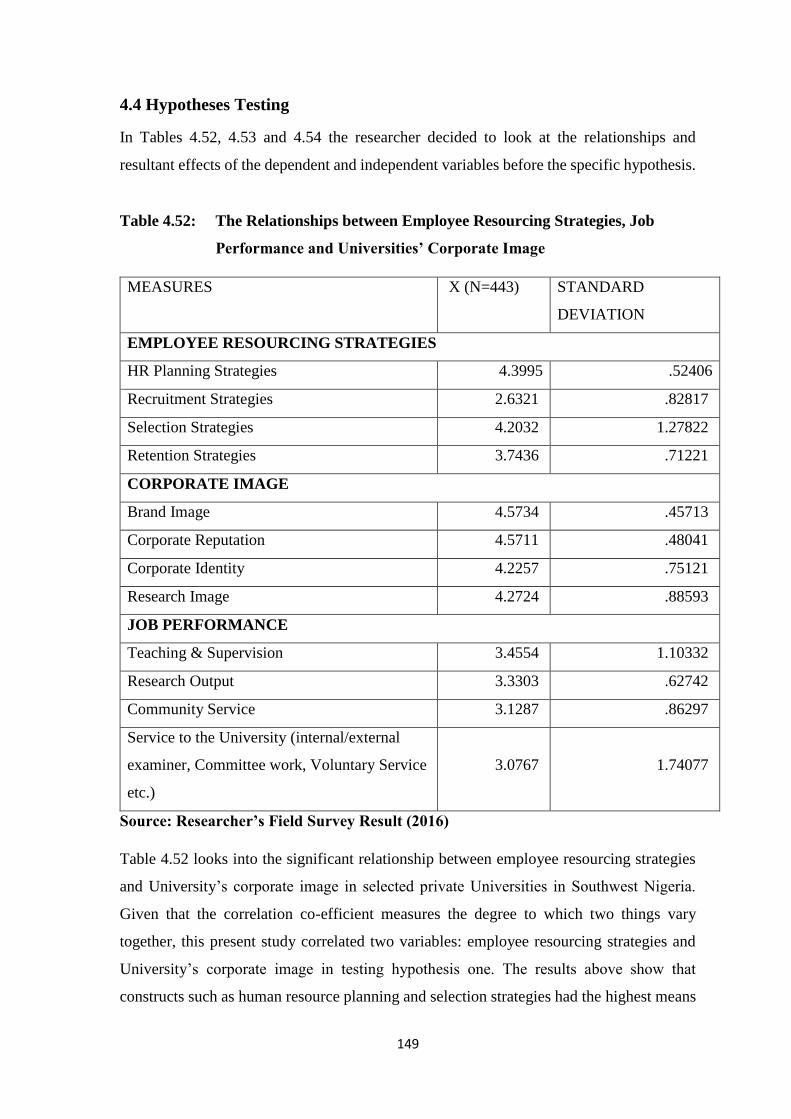
149
4.4 Hypotheses Testing
In Tables 4.52, 4.53 and 4.54 the researcher decided to look at the relationships and
resultant effects of the dependent and independent variables before the specific hypothesis.
Table 4.52: The Relationships between Employee Resourcing Strategies, Job
Performance and Universities’ Corporate Image
MEASURES X (N=443) STANDARD
DEVIATION
EMPLOYEE RESOURCING STRATEGIES
HR Planning Strategies 4.3995 .52406
Recruitment Strategies 2.6321 .82817
Selection Strategies 4.2032 1.27822
Retention Strategies 3.7436 .71221
CORPORATE IMAGE
Brand Image 4.5734 .45713
Corporate Reputation 4.5711 .48041
Corporate Identity 4.2257 .75121
Research Image 4.2724 .88593
JOB PERFORMANCE
Teaching & Supervision 3.4554 1.10332
Research Output 3.3303 .62742
Community Service 3.1287 .86297
Service to the University (internal/external
examiner, Committee work, Voluntary Service
etc.)
3.0767 1.74077
Source: Researcher’s Field Survey Result (2016)
Table 4.52 looks into the significant relationship between employee resourcing strategies
and University’s corporate image in selected private Universities in Southwest Nigeria.
Given that the correlation co-efficient measures the degree to which two things vary
together, this present study correlated two variables: employee resourcing strategies and
University’s corporate image in testing hypothesis one. The results above show that
constructs such as human resource planning and selection strategies had the highest means

150
score in employee resourcing strategies in the Universities generally, followed by retention
and recruitment strategies of the Universities. Meanwhile, the mean scores in corporate
image variables such as brand image, corporate reputation, corporate identity and research
image are high compared to job performance variables mean scores. However, the mean
scores in the 12 variables were obtained for academics in six selected private Universities
to ascertain the normative scores for the measuring instruments.
Table 4.53: Contributions of Employee Resourcing Strategies to Universities’
Corporate Image using Regression Analysis
Coefficientsa
Model
Unstandardised
Coefficients
Standardised
Coefficients
t Sig. B Std. Error Beta
1 (Constant) 1.994 .186 10.713 .000
HRP_Stra .168 .057 .190 2.920 .004
Recruit_Stra .253 .027 .377 9.266 .000
Selection_Stra .286 .055 .335 5.183 .000
Retentn_Stra .194 .026 .298 7.419 .000
R .590a
R2 .348
F-value 58.457
Remark Employee Resourcing Strategies are significant
predictors of Universities’ Corporate Image
Dependent Variable: Corp_Image
Source: Researcher’s Field Survey Result (2016)
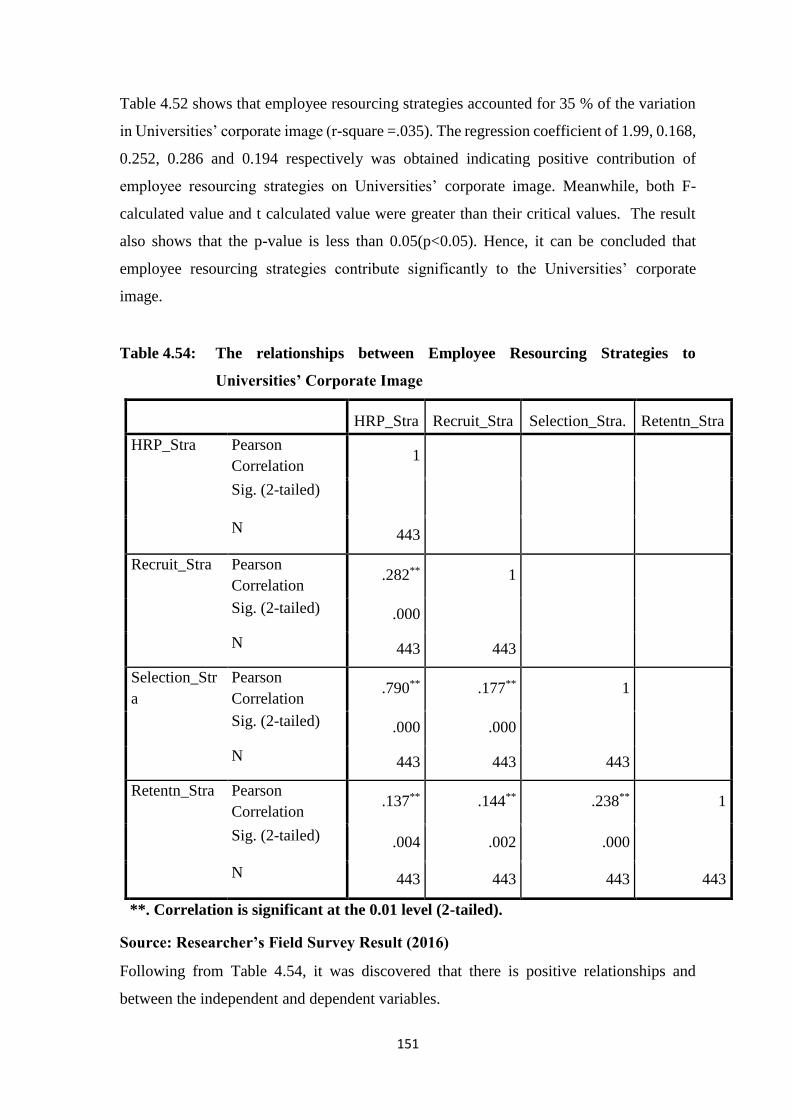
151
Table 4.52 shows that employee resourcing strategies accounted for 35 % of the variation
in Universities’ corporate image (r-square =.035). The regression coefficient of 1.99, 0.168,
0.252, 0.286 and 0.194 respectively was obtained indicating positive contribution of
employee resourcing strategies on Universities’ corporate image. Meanwhile, both F-
calculated value and t calculated value were greater than their critical values. The result
also shows that the p-value is less than 0.05(p<0.05). Hence, it can be concluded that
employee resourcing strategies contribute significantly to the Universities’ corporate
image.
Table 4.54: The relationships between Employee Resourcing Strategies to
Universities’ Corporate Image
HRP_Stra Recruit_Stra Selection_Stra. Retentn_Stra
HRP_Stra Pearson
Correlation 1
Sig. (2-tailed)
N 443
Recruit_Stra Pearson
Correlation .282** 1
Sig. (2-tailed) .000
N 443 443
Selection_Str
a
Pearson
Correlation .790** .177** 1
Sig. (2-tailed) .000 .000
N 443 443 443
Retentn_Stra Pearson
Correlation .137** .144** .238** 1
Sig. (2-tailed) .004 .002 .000
N 443 443 443 443
**. Correlation is significant at the 0.01 level (2-tailed).
Source: Researcher’s Field Survey Result (2016)
Following from Table 4.54, it was discovered that there is positive relationships and
between the independent and dependent variables.
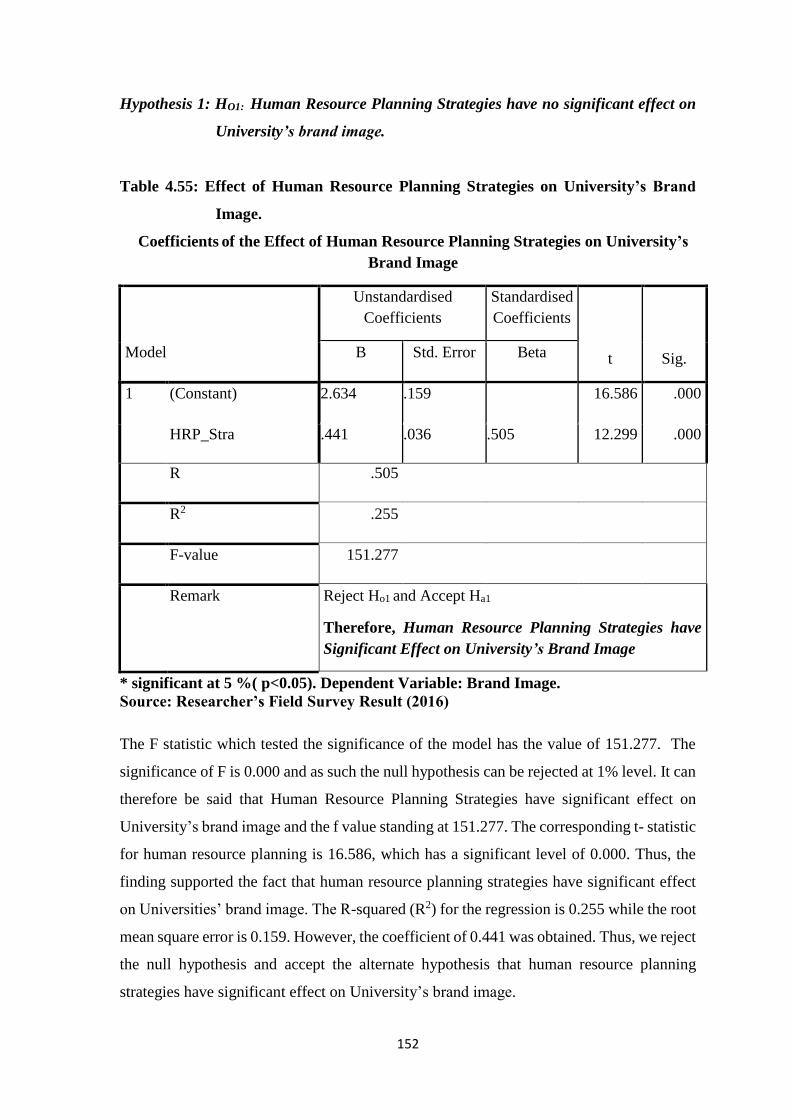
152
Hypothesis 1: HO1: Human Resource Planning Strategies have no significant effect on
University’s brand image.
Table 4.55: Effect of Human Resource Planning Strategies on University’s Brand
Image.
Coefficients of the Effect of Human Resource Planning Strategies on University’s
Brand Image
Model
Unstandardised
Coefficients
Standardised
Coefficients
t Sig. B Std. Error Beta
1 (Constant) 2.634 .159 16.586 .000
HRP_Stra .441 .036 .505 12.299 .000
R .505
R2 .255
F-value 151.277
Remark Reject Ho1 and Accept Ha1
Therefore, Human Resource Planning Strategies have
Significant Effect on University’s Brand Image
* significant at 5 %( p<0.05). Dependent Variable: Brand Image.
Source: Researcher’s Field Survey Result (2016)
The F statistic which tested the significance of the model has the value of 151.277. The
significance of F is 0.000 and as such the null hypothesis can be rejected at 1% level. It can
therefore be said that Human Resource Planning Strategies have significant effect on
University’s brand image and the f value standing at 151.277. The corresponding t- statistic
for human resource planning is 16.586, which has a significant level of 0.000. Thus, the
finding supported the fact that human resource planning strategies have significant effect
on Universities’ brand image. The R-squared (R2) for the regression is 0.255 while the root
mean square error is 0.159. However, the coefficient of 0.441 was obtained. Thus, we reject
the null hypothesis and accept the alternate hypothesis that human resource planning
strategies have significant effect on University’s brand image.
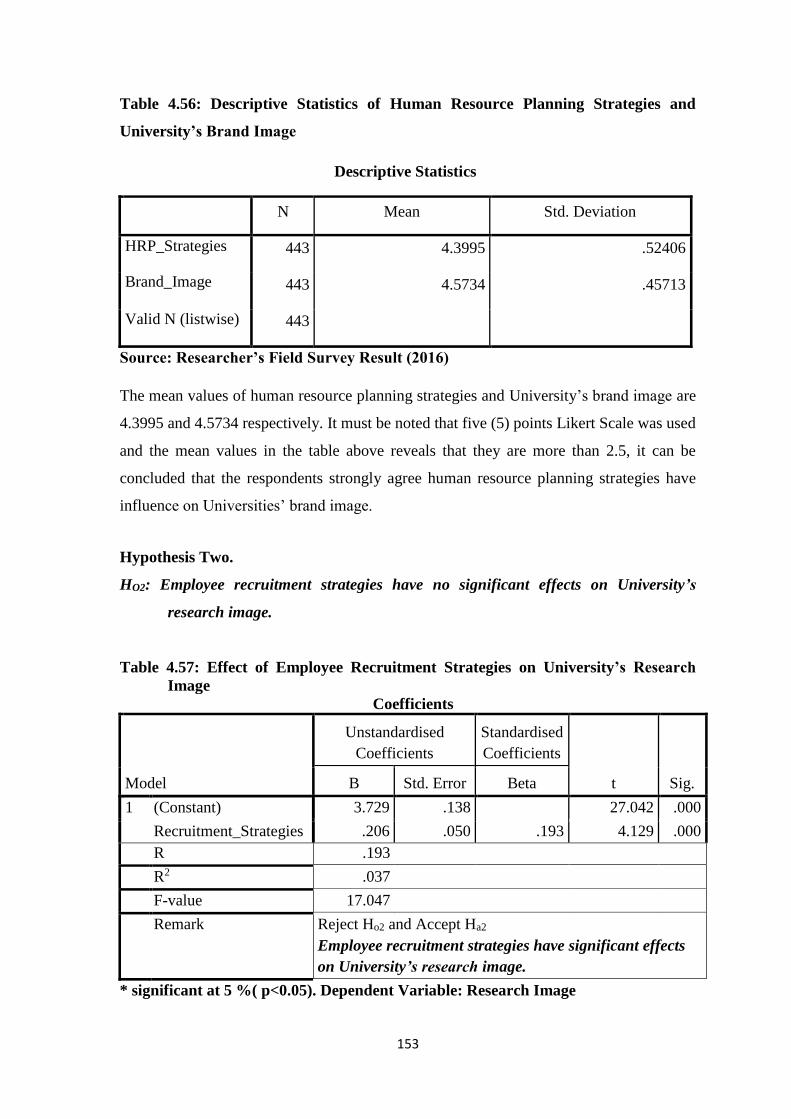
153
Table 4.56: Descriptive Statistics of Human Resource Planning Strategies and
University’s Brand Image
Descriptive Statistics
N Mean Std. Deviation
HRP_Strategies 443 4.3995 .52406
Brand_Image 443 4.5734 .45713
Valid N (listwise) 443
Source: Researcher’s Field Survey Result (2016)
The mean values of human resource planning strategies and University’s brand image are
4.3995 and 4.5734 respectively. It must be noted that five (5) points Likert Scale was used
and the mean values in the table above reveals that they are more than 2.5, it can be
concluded that the respondents strongly agree human resource planning strategies have
influence on Universities’ brand image.
Hypothesis Two.
HO2: Employee recruitment strategies have no significant effects on University’s
research image.
Table 4.57: Effect of Employee Recruitment Strategies on University’s Research
Image
Coefficients
Model
Unstandardised
Coefficients
Standardised
Coefficients
t Sig. B Std. Error Beta
1 (Constant) 3.729 .138 27.042 .000
Recruitment_Strategies .206 .050 .193 4.129 .000
R .193
R2 .037
F-value 17.047
Remark Reject Ho2 and Accept Ha2
Employee recruitment strategies have significant effects
on University’s research image.
* significant at 5 %( p<0.05). Dependent Variable: Research Image
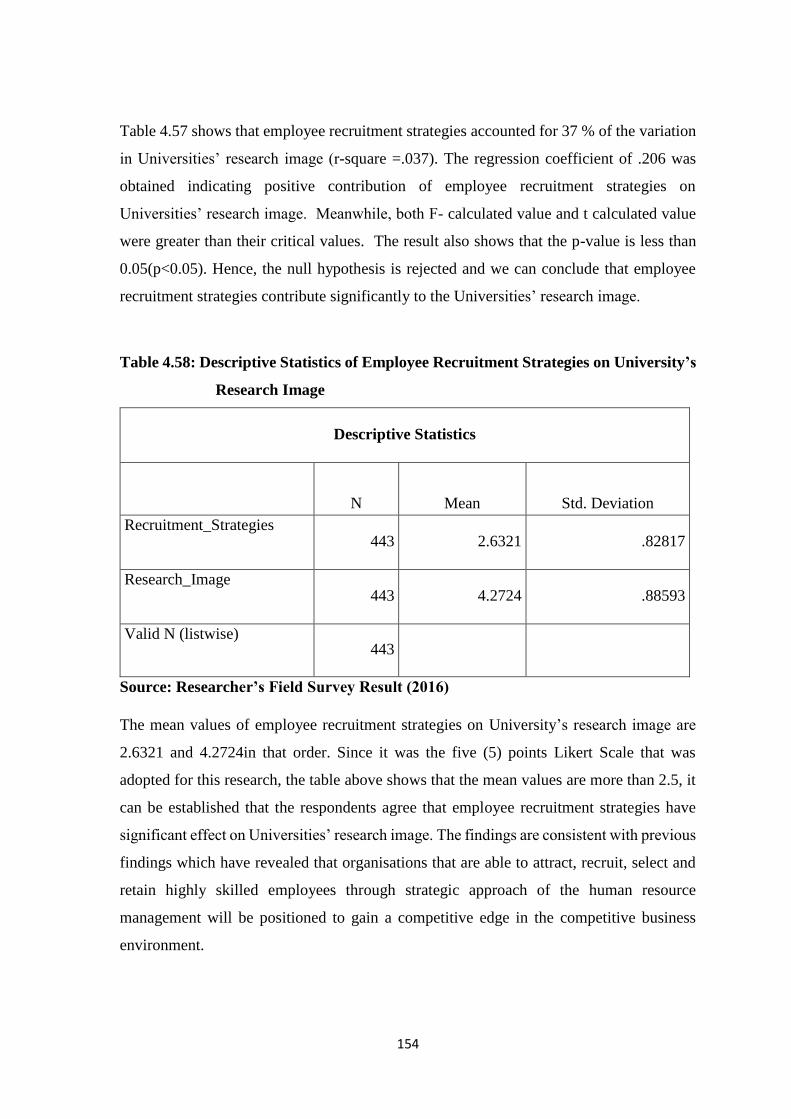
154
Table 4.57 shows that employee recruitment strategies accounted for 37 % of the variation
in Universities’ research image (r-square =.037). The regression coefficient of .206 was
obtained indicating positive contribution of employee recruitment strategies on
Universities’ research image. Meanwhile, both F- calculated value and t calculated value
were greater than their critical values. The result also shows that the p-value is less than
0.05(p<0.05). Hence, the null hypothesis is rejected and we can conclude that employee
recruitment strategies contribute significantly to the Universities’ research image.
Table 4.58: Descriptive Statistics of Employee Recruitment Strategies on University’s
Research Image
Descriptive Statistics
N Mean Std. Deviation
Recruitment_Strategies 443 2.6321 .82817
Research_Image 443 4.2724 .88593
Valid N (listwise) 443
Source: Researcher’s Field Survey Result (2016)
The mean values of employee recruitment strategies on University’s research image are
2.6321 and 4.2724in that order. Since it was the five (5) points Likert Scale that was
adopted for this research, the table above shows that the mean values are more than 2.5, it
can be established that the respondents agree that employee recruitment strategies have
significant effect on Universities’ research image. The findings are consistent with previous
findings which have revealed that organisations that are able to attract, recruit, select and
retain highly skilled employees through strategic approach of the human resource
management will be positioned to gain a competitive edge in the competitive business
environment.

155
Hypothesis Three.
HO3: There is no significant relationship between employee selection strategies and
University’s corporate reputation.
Table 4.59: The Relationship between Employee Selection Strategies and University’s
Corporate Reputation
Correlations
Selection_Strategies Corporate_Reputation
Selection_Strategies Pearson Correlation 1 .250
Sig. (2-tailed) .000
N 443 443
Corporate_Reputation Pearson Correlation .250 1
Sig. (2-tailed) .000
N 443 443
Remark Reject Ho3 and Accept Ha3
There is significant relationship between employee selection
strategies and University’s corporate reputation.
Source: Researcher’s Field Survey Result (2016)
Correlation is significant at the 0.01 level (2-tailed).
Table 4.36 shows the relationship between employee selection strategies and Universities’
corporate reputation at the correlation coefficient of 0.250. This implies that there is a
significant relationship between the two variables. However, the probability value is less
than 0.05(p<0.05). This implies that the level of relationship between employee selection
strategies and Universities’ corporate reputation is significant. The null hypothesis is
therefore rejected. This suggests that the selection of people with distinctive capabilities
will help promote University’s corporate image.
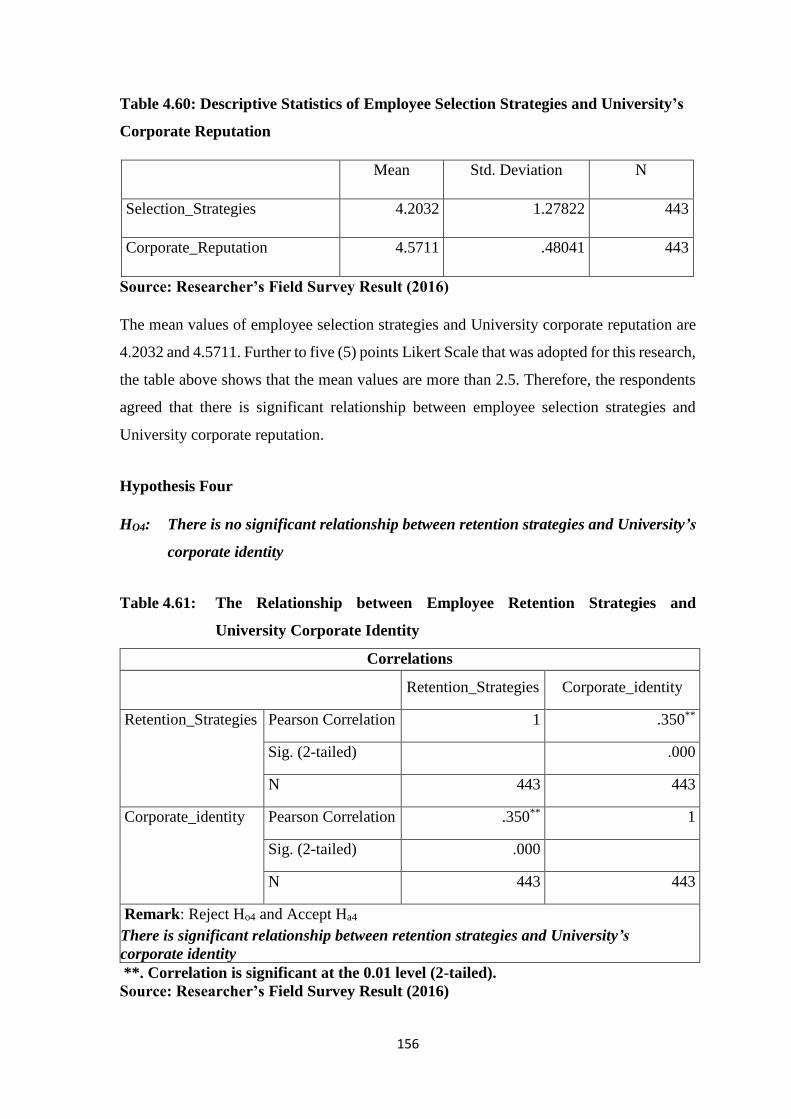
156
Table 4.60: Descriptive Statistics of Employee Selection Strategies and University’s
Corporate Reputation
Mean Std. Deviation N
Selection_Strategies 4.2032 1.27822 443
Corporate_Reputation 4.5711 .48041 443
Source: Researcher’s Field Survey Result (2016)
The mean values of employee selection strategies and University corporate reputation are
4.2032 and 4.5711. Further to five (5) points Likert Scale that was adopted for this research,
the table above shows that the mean values are more than 2.5. Therefore, the respondents
agreed that there is significant relationship between employee selection strategies and
University corporate reputation.
Hypothesis Four
HO4: There is no significant relationship between retention strategies and University’s
corporate identity
Table 4.61: The Relationship between Employee Retention Strategies and
University Corporate Identity
Correlations
Retention_Strategies Corporate_identity
Retention_Strategies Pearson Correlation 1 .350**
Sig. (2-tailed) .000
N 443 443
Corporate_identity Pearson Correlation .350** 1
Sig. (2-tailed) .000
N 443 443
Remark: Reject Ho4 and Accept Ha4
There is significant relationship between retention strategies and University’s
corporate identity
**. Correlation is significant at the 0.01 level (2-tailed).
Source: Researcher’s Field Survey Result (2016)
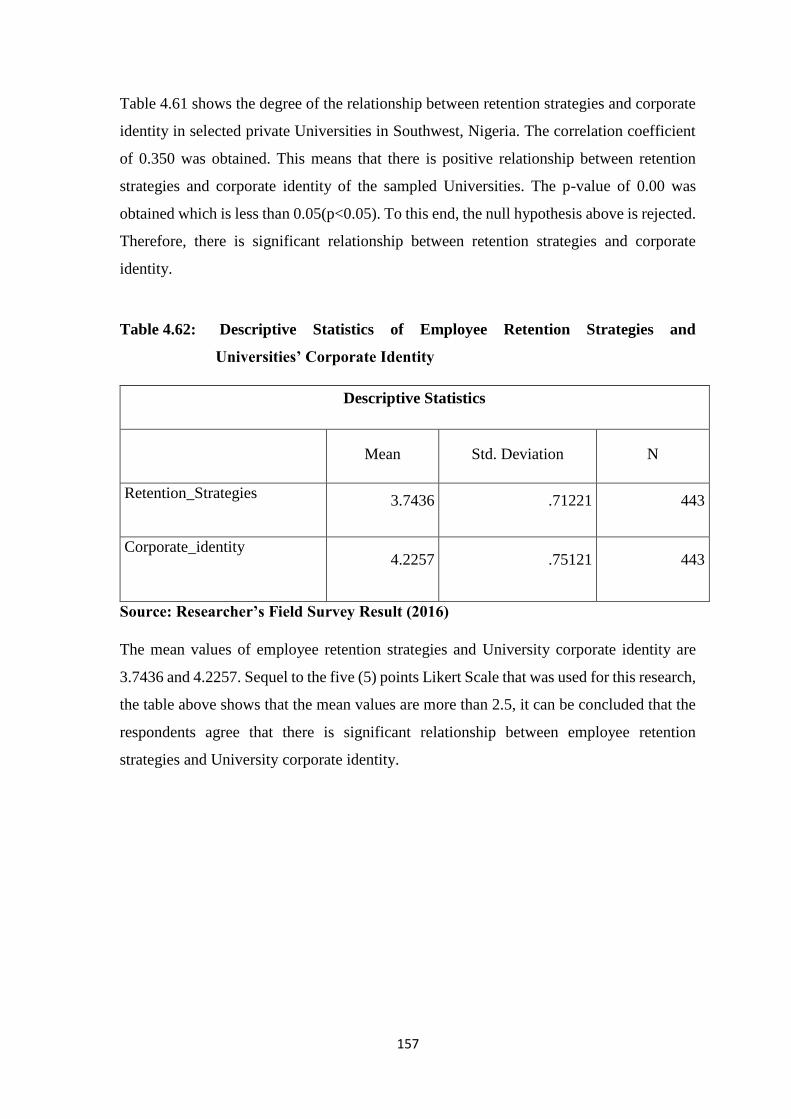
157
Table 4.61 shows the degree of the relationship between retention strategies and corporate
identity in selected private Universities in Southwest, Nigeria. The correlation coefficient
of 0.350 was obtained. This means that there is positive relationship between retention
strategies and corporate identity of the sampled Universities. The p-value of 0.00 was
obtained which is less than 0.05(p<0.05). To this end, the null hypothesis above is rejected.
Therefore, there is significant relationship between retention strategies and corporate
identity.
Table 4.62: Descriptive Statistics of Employee Retention Strategies and
Universities’ Corporate Identity
Descriptive Statistics
Mean Std. Deviation N
Retention_Strategies 3.7436 .71221 443
Corporate_identity 4.2257 .75121 443
Source: Researcher’s Field Survey Result (2016)
The mean values of employee retention strategies and University corporate identity are
3.7436 and 4.2257. Sequel to the five (5) points Likert Scale that was used for this research,
the table above shows that the mean values are more than 2.5, it can be concluded that the
respondents agree that there is significant relationship between employee retention
strategies and University corporate identity.

158
Hypothesis Five
Ho5: Job performance does not mediate the relationship between employee resourcing
strategies and corporate image.
Table 4. 63: The Mediating Role of Job Performance between Employee Resourcing
Strategies and Corporate Image
Coefficientsa
Model
Unstandardised
Coefficients
Standardised
Coefficients
t Sig.
Collinearity
Statistics
B Std. Error Beta Tolerance VIF
1 (Constant) 3.134 .174 18.055 .000
Overall_ERS .352 .048 .330 7.340 .000 1.000 1.000
2 (Constant) 2.746 .176 15.568 .000
Overall_ERS .273 .047 .256 5.758 .000 .935 1.070
Overall_Perfor .242 .037 .289 6.501 .000 .935 1.070
R1 .330a R2 .432b
R21 .109 R22 .187
R2Change1 .109
R2Chan
ge2 .078
F1 53.869 F2 50.587
F Change 53.869
Sig. of F
Change .000
Remark Reject Ho5 and Accept H05
Job performance mediates the relationship between employee resourcing
strategies and corporate image.
a. Dependent Variable: Corp_Image
Source: Researcher’s Field Survey Result (2016)
Table 4:63 shows the mediating role of job performance between employee resourcing
strategies and corporate image. The regression coefficient of 0.352 was obtained indicating
positive mediating role of job performance between employee resourcing strategies and
Universities’ corporate image. Meanwhile, both F- calculated value (53.869; 50.587) and
t calculated value (18.055) were greater than their critical values. The result also shows
that the p-value is less than 0.05(p<0.05) and the significance of F is 0.000 and as such the
null hypothesis can be rejected at 1% level.
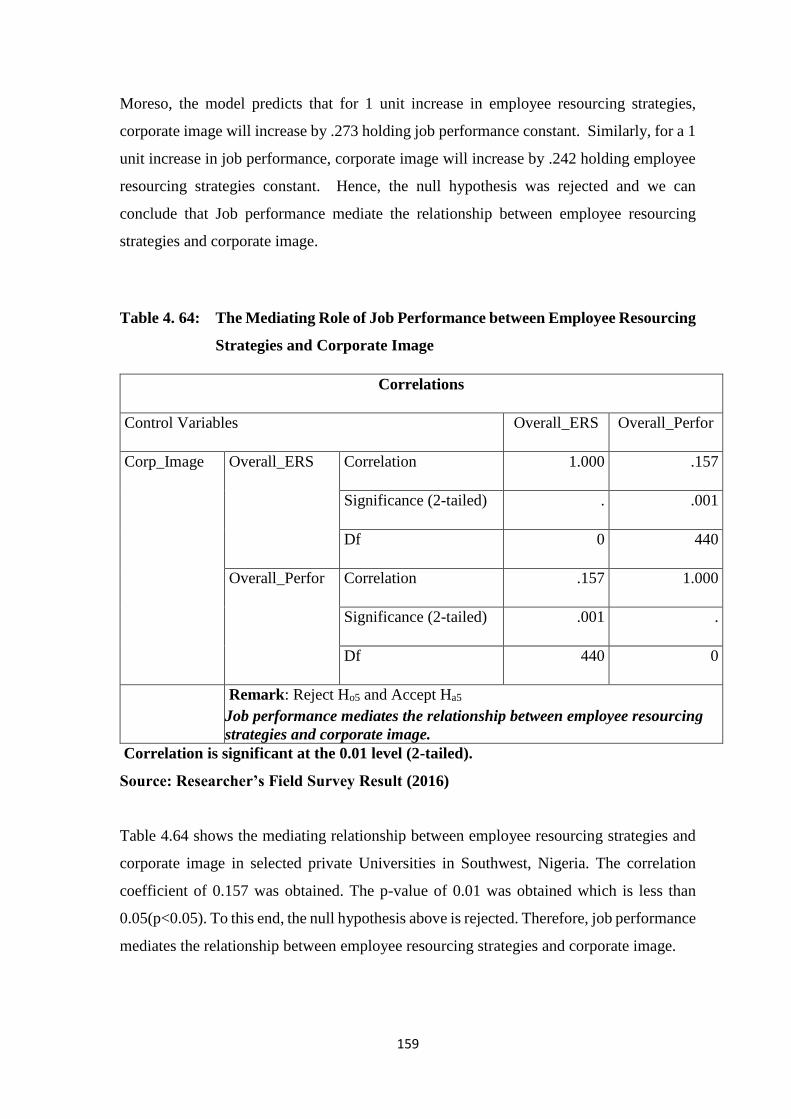
159
Moreso, the model predicts that for 1 unit increase in employee resourcing strategies,
corporate image will increase by .273 holding job performance constant. Similarly, for a 1
unit increase in job performance, corporate image will increase by .242 holding employee
resourcing strategies constant. Hence, the null hypothesis was rejected and we can
conclude that Job performance mediate the relationship between employee resourcing
strategies and corporate image.
Table 4. 64: The Mediating Role of Job Performance between Employee Resourcing
Strategies and Corporate Image
Correlations
Control Variables Overall_ERS Overall_Perfor
Corp_Image Overall_ERS Correlation 1.000 .157
Significance (2-tailed) . .001
Df 0 440
Overall_Perfor Correlation .157 1.000
Significance (2-tailed) .001 .
Df 440 0
Remark: Reject Ho5 and Accept Ha5
Job performance mediates the relationship between employee resourcing
strategies and corporate image.
Correlation is significant at the 0.01 level (2-tailed).
Source: Researcher’s Field Survey Result (2016)
Table 4.64 shows the mediating relationship between employee resourcing strategies and
corporate image in selected private Universities in Southwest, Nigeria. The correlation
coefficient of 0.157 was obtained. The p-value of 0.01 was obtained which is less than
0.05(p<0.05). To this end, the null hypothesis above is rejected. Therefore, job performance
mediates the relationship between employee resourcing strategies and corporate image.

160
Table 4.65: The Correlation Matrix of All Measures
1 2 3 4 5 6 7 8 9
1 HRP_Stra Pearson Correlation 1
Sig. (2-tailed)
2Rement_Stra Pearson Correlation -.032 1
Sig. (2-tailed) .497
3 Selectn_Stra Pearson Correlation .231** .216** 1
Sig. (2-tailed) .000 .000
4 Retentn_Stra Pearson Correlation .137** .127** .051 1
Sig. (2-tailed) .004 .007 .289
5 Brand_Image Pearson Correlation .505** .148** .187** .294** 1
Sig. (2-tailed) .000 .002 .000 .000
6 Resh_Image Pearson Correlation .080 .193** .138** .167**
.152*
* 1
Sig. (2-tailed) .094 .000 .004 .000 .001
7 Corp_Repu Pearson Correlation .294** .195** .049 .192**
.296*
*
.155*
* 1
Sig. (2-tailed) .000 .000 .299 .000 .000 .001
8 Corp_identity Pearson Correlation .025 -.073 -.026 .350**
.266*
* -.039
.162*
* 1
Sig. (2-tailed) .597 .127 .587 .000 .000 .409 .001
9 Job_Perfor Pearson Correlation .154** .172** .071 .075 .099* .082 .099* -.018 1
Sig. (2-tailed) .001 .000 .134 .115 .036 .086 .037 .699
**. Correlation is significant at the 0.01 level (2-tailed).
*. Correlation is significant at the 0.05 level (2-tailed).

161
A correlation matrix analysis of all variables was conducted to check for multicollinearity
and to find the degree of relationship between the variables. Specifically, multicollinearity
is shown when intercorrelation between explanatory variables exceed 0.8. Roundtree
(1987) classification of correlation of co-efficient benchmark will be used to determine the
level of relationships between the variables. Roundtree classification of correlation co-
efficient (r) is as follows:
• weak and low- 0.00 to 0.02
• moderate -0.02 to 0.04
• strong and high - 0.04 to 0.07
• very strong and very high-v 0.07 to 0.09
Employee resourcing strategies and University corporate image variables were subjected
to correlational analysis to determine relationships that exist if any among the variables.
Table 4.25 shows that employee resourcing strategies variables are positively related to
University corporate image variables. The degree of the relationships was determined with
the hypotheses testing.
Perception of Respondents on Employee Resourcing Strategies and Universities’ Corporate
Image
In order to determine the perception of the respondents on the subject matter, the responses
from each of the six sampled Universities were tested to see their perceptions on employee
resourcing and corporate image of the institutions using the four variables of employee
resourcing strategies, which are; human resource planning, employee recruitment,
employee selection and retention strategies and four variable of corporate image which are:
brand image, research image, corporate reputation and corporate identity. Thereafter, the
overall perceptions of the academics in each of these six Universities were correlated to
view their responses on the subject matter.
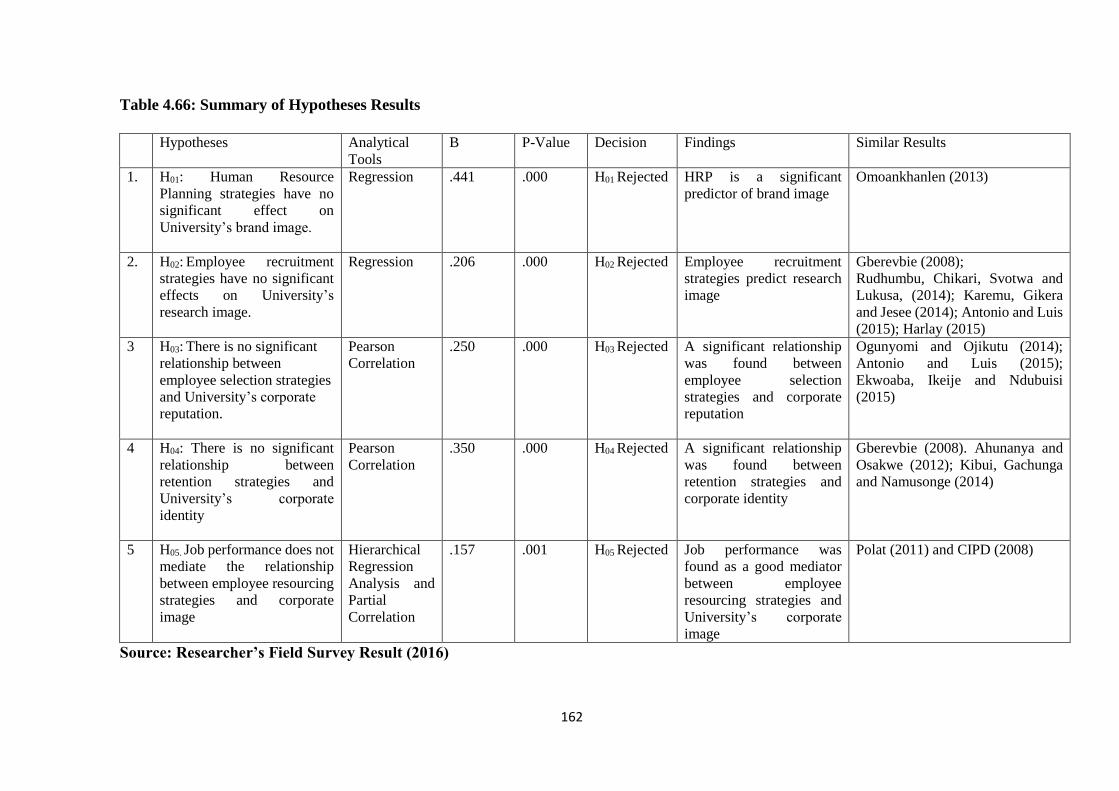
162
Table 4.66: Summary of Hypotheses Results
Hypotheses Analytical
Tools
B P-Value Decision Findings Similar Results
1. H01: Human Resource
Planning strategies have no
significant effect on
University’s brand image.
Regression .441 .000 H01 Rejected
HRP is a significant
predictor of brand image
Omoankhanlen (2013)
2. H02: Employee recruitment
strategies have no significant
effects on University’s
research image.
Regression .206 .000 H02 Rejected
Employee recruitment
strategies predict research
image
Gberevbie (2008);
Rudhumbu, Chikari, Svotwa and
Lukusa, (2014); Karemu, Gikera
and Jesee (2014); Antonio and Luis
(2015); Harlay (2015)
3 H03: There is no significant
relationship between
employee selection strategies
and University’s corporate
reputation.
Pearson
Correlation
.250 .000 H03 Rejected
A significant relationship
was found between
employee selection
strategies and corporate
reputation
Ogunyomi and Ojikutu (2014);
Antonio and Luis (2015);
Ekwoaba, Ikeije and Ndubuisi
(2015)
4 H04: There is no significant
relationship between
retention strategies and
University’s corporate
identity
Pearson
Correlation
.350 .000 H04 Rejected
A significant relationship
was found between
retention strategies and
corporate identity
Gberevbie (2008). Ahunanya and
Osakwe (2012); Kibui, Gachunga
and Namusonge (2014)
5 H05. Job performance does not
mediate the relationship
between employee resourcing
strategies and corporate
image
Hierarchical
Regression
Analysis and
Partial
Correlation
.157 .001 H05 Rejected
Job performance was
found as a good mediator
between employee
resourcing strategies and
University’s corporate
image
Polat (2011) and CIPD (2008)
Source: Researcher’s Field Survey Result (2016)

163
4.5: Employee Resourcing Strategies, Job Performance and Corporate Image
Model
Structural equation model (SEM) was adopted to analysis the fitness of employee
resourcing strategies, job performance and corporate image variables, and the outcome is
depicted in Figure 4:18 below:
Figure 4.18 Result of Structural Equation Model (SEM)
Source: Researcher’s Field Survey Result (2016)
Structural Equation Modelling AMOS 22.0 was adopted to determine the level of fitness
between independent and dependent variables. Comparative Fit Index (CFI); Normed Fit
Index (NFI); Relative Fix Index (RFI); Incremental Fix Index (IFI); Root Mean Square
Error of Approximation (RMSEA); CMIN were used as model fit indices. In view of the
scores obtained from the analysis and in comparison, with the benchmarks as proposed by
Awang, (2012); Tabachinck and Fidell, (2007), it may therefore be concluded that the level
of fitness is good and acceptable. The summary of the fitness index measurement is
depicted in Table 4.41 below

164
Table 4.67: Fitness Index Measurement
Fit Indices Benchmark Value Results
Chisq p>0.05 178.694 Achieved
RMSEA <0.80 0.112 Achieved
GFI >0.90 .993 Achieved
AGFI >0.90 .998 Achieved
CFI >0.90 .979 Achieved
NFI >0.90 .932 Achieved
IFI >0.90 .995 Achieved
Source: Researcher’s Field Survey Result (2016)
RMSEA: Root Mean Square Error of Approximation
GFI: Goodness-of-fit index
AGFI: adjusted goodness-of-fit index
CFI: Comparative Fit Index
NFI: Normed Fit Index
IFI: Incremental fit index
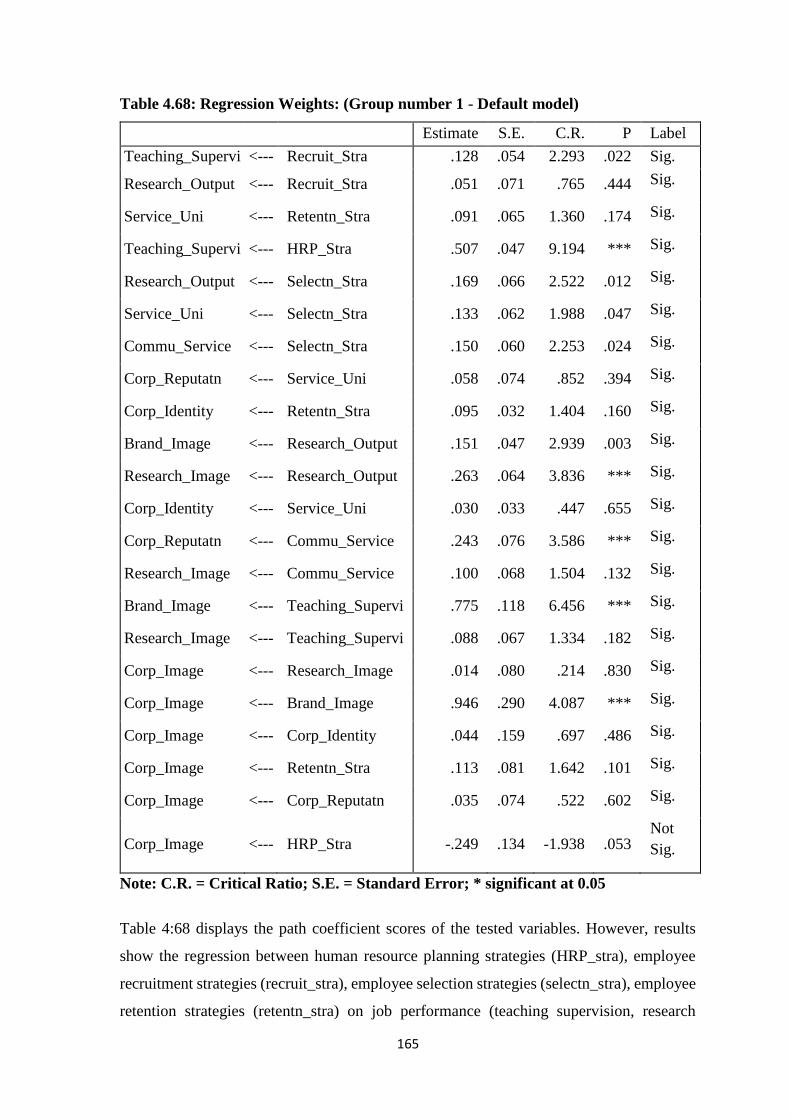
165
Table 4.68: Regression Weights: (Group number 1 - Default model)
Estimate S.E. C.R. P Label
Teaching_Supervi <--- Recruit_Stra .128 .054 2.293 .022 Sig.
Research_Output <--- Recruit_Stra .051 .071 .765 .444 Sig.
Service_Uni <--- Retentn_Stra .091 .065 1.360 .174 Sig.
Teaching_Supervi <--- HRP_Stra .507 .047 9.194 *** Sig.
Research_Output <--- Selectn_Stra .169 .066 2.522 .012 Sig.
Service_Uni <--- Selectn_Stra .133 .062 1.988 .047 Sig.
Commu_Service <--- Selectn_Stra .150 .060 2.253 .024 Sig.
Corp_Reputatn <--- Service_Uni .058 .074 .852 .394 Sig.
Corp_Identity <--- Retentn_Stra .095 .032 1.404 .160 Sig.
Brand_Image <--- Research_Output .151 .047 2.939 .003 Sig.
Research_Image <--- Research_Output .263 .064 3.836 *** Sig.
Corp_Identity <--- Service_Uni .030 .033 .447 .655 Sig.
Corp_Reputatn <--- Commu_Service .243 .076 3.586 *** Sig.
Research_Image <--- Commu_Service .100 .068 1.504 .132 Sig.
Brand_Image <--- Teaching_Supervi .775 .118 6.456 *** Sig.
Research_Image <--- Teaching_Supervi .088 .067 1.334 .182 Sig.
Corp_Image <--- Research_Image .014 .080 .214 .830 Sig.
Corp_Image <--- Brand_Image .946 .290 4.087 *** Sig.
Corp_Image <--- Corp_Identity .044 .159 .697 .486 Sig.
Corp_Image <--- Retentn_Stra .113 .081 1.642 .101 Sig.
Corp_Image <--- Corp_Reputatn .035 .074 .522 .602 Sig.
Corp_Image <--- HRP_Stra -.249 .134 -1.938 .053 Not
Sig.
Note: C.R. = Critical Ratio; S.E. = Standard Error; * significant at 0.05
Table 4:68 displays the path coefficient scores of the tested variables. However, results
show the regression between human resource planning strategies (HRP_stra), employee
recruitment strategies (recruit_stra), employee selection strategies (selectn_stra), employee
retention strategies (retentn_stra) on job performance (teaching supervision, research
166
output, community service and service to the University) and University’s corporate image
(brand image, research image, corporate reputation, corporate identity). The result reveals
that all the variables tested under independent construct have positive path coefficients as
factors under employee resourcing strategies that tend to influence employee job
performance and corporate image. However, the path coefficient scores (regression
weights) of the observed constructs explain the regression between the studied variables.
The regression weight between recruitment strategies and teaching/supervision is .218
(p<0.001) which indicates that when recruitment strategies go up by 1 standard deviation,
teaching and supervision of students’ project goes up by 0.218 standard deviations. In
addition, the regression weight between recruitment strategies and research output is .051
(p<0.001) which indicates that when recruitment strategy goes up by 1 standard deviation,
research output goes up by 0.051 standard deviations. Meanwhile, the regression weight
for employee recruitment strategies in the prediction of teaching/supervision and research
output are significantly different from zero at the 0.05 level. The implication is that
employee recruitment strategies will help in improving employee job performance which
will invariably motivate quality teaching and research image.
Besides, the effect of employee retention strategies on service to the University, shows the
path coefficient of .091 (p <0.05). Therefore, when employee retention strategies go up by
1 standard deviation, service to the University goes up by 0.091 standard deviations. It is
also important to note that the effect of employee retention strategies on corporate identity
shows the path coefficient of .095 (p <0.05). Therefore, when employee retention strategy
goes up by 1 standard deviation, corporate identity goes up by 0.095 standard deviations.
Meanwhile, the effect of employee retention strategy on corporate image shows the path
coefficient of .113 (p <0.05). Therefore, when employee retention strategy goes up by 1
standard deviation, corporate image goes up by 0.113 standard deviations.
The regression weight for employee retention strategies in the prediction of corporate
identity and corporate image is significantly different from zero at the 0.05 level. Therefore,
employee recruitment strategies have a positive influence on corporate identity and
University’s corporate image. The effect of human resource planning strategies on
teaching/supervision shows the path coefficient of .507 (p <0.05). Therefore, when human
resource planning strategies go up by 1 standard deviation, teaching/supervision goes up

167
by .507 standard deviations. It is also important to note that the direct effect of human
resource planning strategies on corporate image shows the path coefficient of. -.249 (p
<0.05). Therefore, when human resource planning strategies go up by 1 standard deviation,
corporate image goes down by -0.249 standard deviations. The regression weight for
human resource planning strategies in the prediction of corporate image is negative. It can
therefore be concluded that there is no direct relationship between human resource planning
strategies and corporate image.
Table 4:42 also revealed the effect of employee selection strategies on research output,
service to the University and community service show the path coefficient of .169 (p
<0.05), .133 (p <0.05) and .150 (p <0.05) respectively. Therefore, when employee
selection strategies go up by 1 standard deviation, research output, service to the University
and community service go up by 0.169, 0.133 and 0.150 standard deviations. The
regression weight for employee selection strategies in the prediction of research output,
service to the University and community service is significantly different from zero at the
0.05 level. Therefore, employee selection strategies have a positive influence on research
output, service to the University and community service. The effect of employee service to
the University on corporate reputation and corporate identity shows the path coefficient of.
.058 (p <0.05) and .030 (p <0.05) respectively.
The implication is that when employee service to the University goes up by 1 standard
deviation, corporate reputation and corporate image go up by 0.058 and 0.030 standard
deviations in that order.
The regression weight for service to the University in the prediction of corporate reputation
and corporate image is significantly different from zero at the 0.05 level. The effect of
research output on brand image and research image show the path coefficient of. .151 (p
<0.05) and .263 (p <0.05) respectively. The outcome is that when research output goes up
by 1 standard deviation, brand image and research image go up by 0.151 and 0.263 standard
deviations in that order.
The regression weight for research output in the prediction of brand image and research
image is significantly different from zero at the 0.05 level. The resultant effects of
community service on corporate reputation and research image show the path coefficient
of. .243 (p <0.05) and .100 (p <0.05) respectively. The consequence is that when
168
community service goes up by 1 standard deviation, corporate reputation and research
image go up by 0.243 and 0.100 standard deviations in that order.
The regression weight for community service in the prediction of corporate reputation and
research image is significantly different from zero at the 0.05 level. The effects of teaching
and supervision on brand image ad research image show the path coefficient of. .775 (p
<0.05) and .088 (p <0.05) respectively. The implication is that when teaching/supervision
goes up by 1 standard deviation, brand image and research image go up by 0.775 and 0.088
standard deviations in that order. The regression weight for teaching/supervision in the
prediction of brand image and research image is significantly different from zero at the 0.05
level.
Not only that, the effects of research image on corporate image show the path coefficient
of .014 (p <0.05) while the relationship between brand image and corporate image shows
the path coefficient of 0.946 and corporate identity on corporate image shows 0.044. The
implication is that when research image goes up by 1 standard deviation, corporate image
goes up by 0.014 standard deviation; when brand image goes up by 1 standard deviation,
corporate image goes up by 0.946 standard deviation and when corporate identity goes up
by 1 standard deviation, corporate image goes up by 0.044 standard deviation. The
significant effect of retention strategies on corporate image show the path coefficient of
.113 (p <0.05) while that of corporate reputation on corporate image shows the path
coefficient of .035 (p <0.05).
Therefore, when retention strategies go up by 1 standard deviation and corporate reputation
goes up by 1 standard deviation, then corporate image goes up by 0.113 and 0.035
respectively. The variation in the perception of Academic Staff on job performance across the
respondents’ demographical characteristics is depicted in Table 4:69 below.
4.6 Variation in Perception of Employee on Job Performance
The variation in the perception of Academic Staff on job performance across the respondents’
demographical characteristics is depicted in Table 4:69 below

169
Table 4:69: Variation in Perception of Employee on Job Performance across
Demographic Characteristics of Respondents
Gender Age Marital Status Current Rank
Work
Experience
Chi-Square 7.051 25.294 3.396 9.428 21.838
Df 3 3 3 3 3
Asymp. Sig. .070 .000 .335 .024 .000
a. Kruskal Wallis Test
b. Grouping Variable: Job_Performance
Table 4.69 shows the result of Kruskal Wallis test carried out to examine the level of
respondents’ perception on job performance using respondents’ demographic
characteristics such as gender, age, marital status, current ranks, and work experience
as independent variable. From the table above, the result showed that difference in the
perception of academic staff on the relationship between employee resourcing strategies
and job performance by gender (λ2 = 7.051, df=3, P>0.05) and marital status (λ2 =
25.294, df=3, P>0.05) are not statistically significant, the reason is because, the actual
probability value was more than .005 and the values are substantially higher than the
specified alpha value of .05. This suggests that the difference in the perception of
academic staff on the relationship between employee resourcing strategies and job
performance are not due to gender and marital status. It was also discovered from the
Kruiskal Wallis test that the difference in the perception of academic staff on the
relationship between employee resourcing strategies and job performance by age (λ2 =
25.294, df=3, P<0.05), employee level/rank (λ2 = 9.428, df = 3, P<0.05) and years of
experience (λ2 = 21.838, df=3, P<0.05) are statistically significant. This indicates that
the differences in the perception of academic staff on the relationship employee
resourcing strategies and job performance can be linked to the age, level/rank and years
of experience of the academic staff of the selected Universities.
4.7: Responses to Open Ended Questions
The respondents were asked to mention other recruitment and selection strategies of their
University. They were asked to state what the University’s management should do to
improve on the retention strategies as well as other measures put in place by the University
to ensure high performance of academic staff. The respondents indicated in their own words
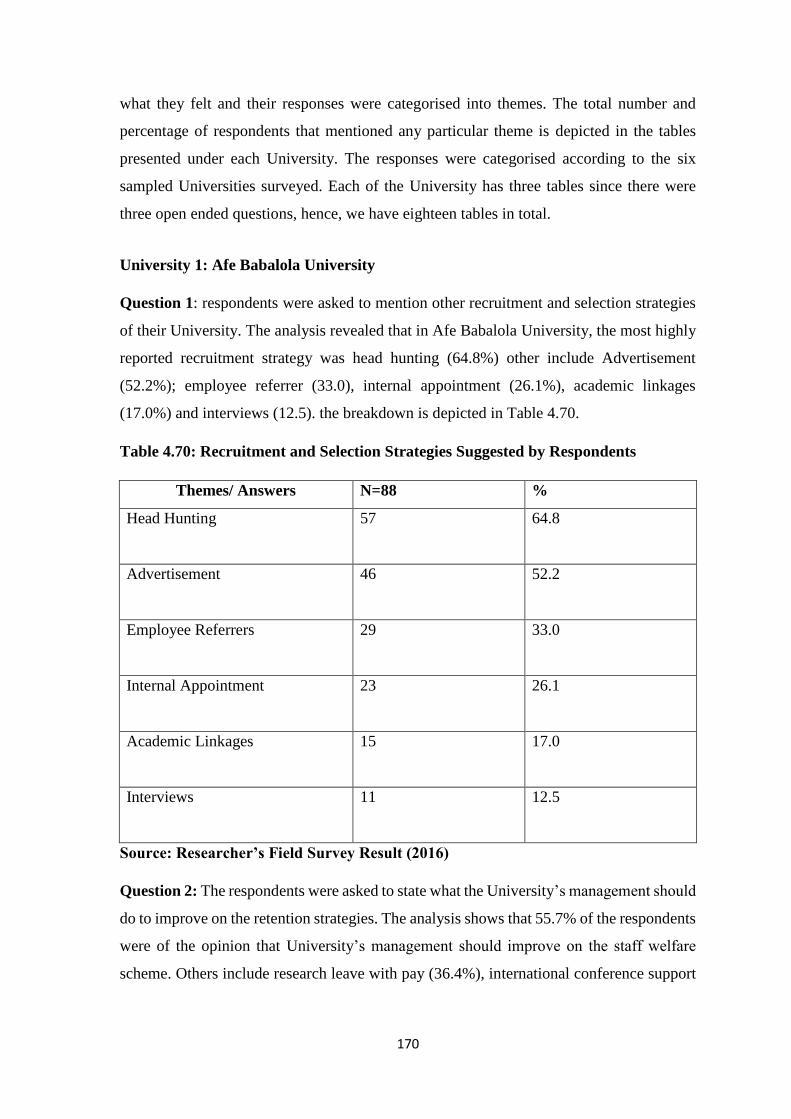
170
what they felt and their responses were categorised into themes. The total number and
percentage of respondents that mentioned any particular theme is depicted in the tables
presented under each University. The responses were categorised according to the six
sampled Universities surveyed. Each of the University has three tables since there were
three open ended questions, hence, we have eighteen tables in total.
University 1: Afe Babalola University
Question 1: respondents were asked to mention other recruitment and selection strategies
of their University. The analysis revealed that in Afe Babalola University, the most highly
reported recruitment strategy was head hunting (64.8%) other include Advertisement
(52.2%); employee referrer (33.0), internal appointment (26.1%), academic linkages
(17.0%) and interviews (12.5). the breakdown is depicted in Table 4.70.
Table 4.70: Recruitment and Selection Strategies Suggested by Respondents
Themes/ Answers N=88 %
Head Hunting 57
64.8
Advertisement 46
52.2
Employee Referrers 29
33.0
Internal Appointment 23
26.1
Academic Linkages 15
17.0
Interviews 11
12.5
Source: Researcher’s Field Survey Result (2016)
Question 2: The respondents were asked to state what the University’s management should
do to improve on the retention strategies. The analysis shows that 55.7% of the respondents
were of the opinion that University’s management should improve on the staff welfare
scheme. Others include research leave with pay (36.4%), international conference support
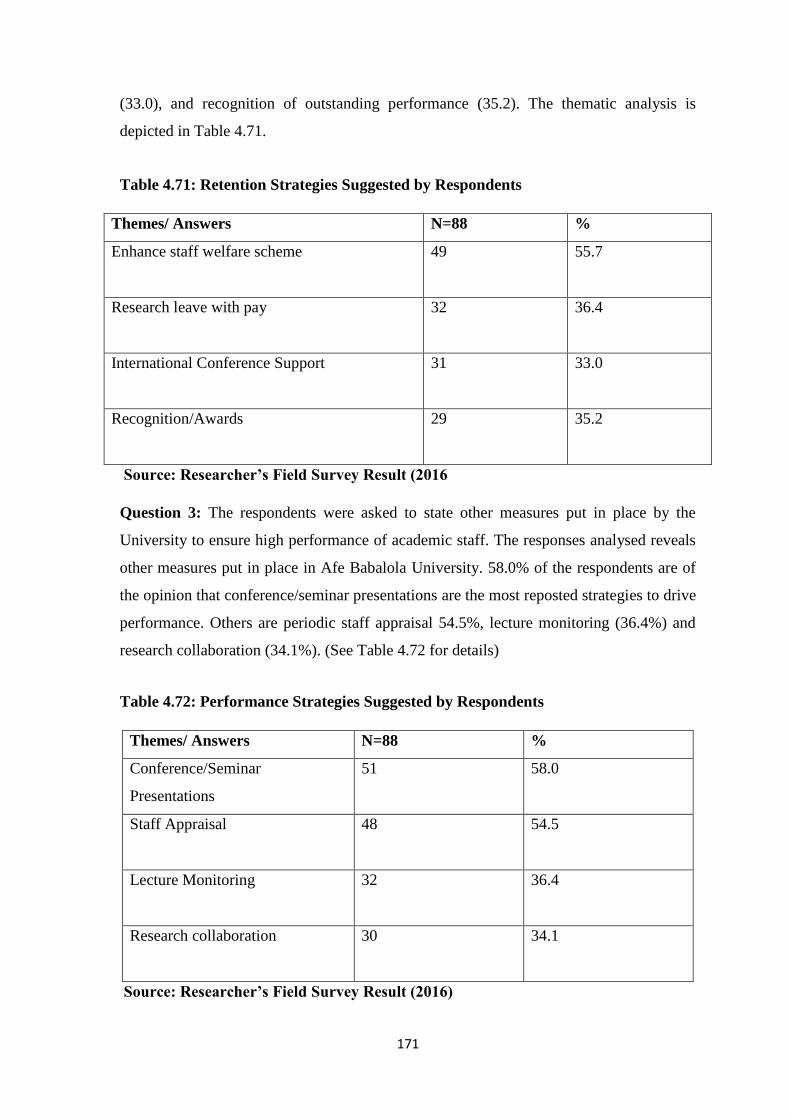
171
(33.0), and recognition of outstanding performance (35.2). The thematic analysis is
depicted in Table 4.71.
Table 4.71: Retention Strategies Suggested by Respondents
Themes/ Answers N=88 %
Enhance staff welfare scheme 49
55.7
Research leave with pay 32
36.4
International Conference Support 31
33.0
Recognition/Awards 29
35.2
Source: Researcher’s Field Survey Result (2016
Question 3: The respondents were asked to state other measures put in place by the
University to ensure high performance of academic staff. The responses analysed reveals
other measures put in place in Afe Babalola University. 58.0% of the respondents are of
the opinion that conference/seminar presentations are the most reposted strategies to drive
performance. Others are periodic staff appraisal 54.5%, lecture monitoring (36.4%) and
research collaboration (34.1%). (See Table 4.72 for details)
Table 4.72: Performance Strategies Suggested by Respondents
Themes/ Answers N=88 %
Conference/Seminar
Presentations
51
58.0
Staff Appraisal 48
54.5
Lecture Monitoring 32
36.4
Research collaboration 30
34.1
Source: Researcher’s Field Survey Result (2016)

172
University 2: Babcock University
Question 1: respondents were asked to highlight other recruitment and selection strategies
of their University. Analysis revealed that in Babcock University, the most highly reported
recruitment strategy was church platform (51.6%) others include referral (39.6%);
interviews (36.3%), Postgraduate Training and Sponsorship (27.4%).
Table 4.73: Recruitment and Selection Strategies Suggested by Respondents
Themes/ Answer N=91 %
Church Platform 47
51.6
Referral/ Headhunting 36
39.6
Interviews 33
36.3
Postgraduate Training and
Sponsorship
25
27.4
Source: Researcher’s Field Survey Result (2016)
Question 2: The respondents were asked to mention what the University management
should do to improve on the retention strategies. The analysis reveals that 59.3% of the
respondents were of the view that University management should improve on the research
and publication grants. Others include Regular Promotion (56.0%), and conference support
(40.7%). The thematic analysis is depicted in Table 4.74.
Table 4.74: Retention Strategies Suggested by Respondents
Themes/Answer N=91 %
Research and Publication Grants 54
59.3
Regular Promotion 51
56.0
Conference Support 37
40.7
Source: Researcher’s Field Survey Result (2016)

173
Question 3: The respondents were asked to state other measures put in place by the
University to ensure high performance of academic staff. The responses thematically
analysed reveals other measures put in place in Babcock University. 56.0% of the
respondents are of the opinion that training and conference are the most reposted strategies
to drive performance. Others are periodic staff appraisal 45.1% and lecture monitoring
(36.3%)
Table 4.75: Performance Strategies Suggested by Respondents
Themes/Answer N=91 %
Training and Conference 51
56.0
Staff Appraisal 41
45.1
Lecture Monitoring 33
36.3
Source: Researcher’s Field Survey Result (2016)
University 3: Bell University of Technology
Question 1: Respondents were asked to mention other recruitment and selection strategies
of their Universities
Table 4.76: Recruitment and Selection Strategies Suggested by Respondents
Themes/Answer N=46 %
Head Hunting 23
50.0
Advertisement 23
50.0
Lectures on Sabbatical 19
41.3
Source: Researcher’s Field Survey Result (2016)
Following from Table 4.76, the analysis revealed that in Bells University of Technology,
out of 46 respondents, 23(50%) of the respondents believe head hunting is one of the

174
recruitment and selection as well as advertisement strategies used by the institution to
attract competent academic staff, while 19(41.3%) posited that lecturers on
sabbatical/adjunct/visiting are also engaged by the University.
Question 2: The respondents were asked to enumerate what the University’s management
should do to improve on retention strategies.
Table 4.77: Retention Strategies Suggested by Respondents
Themes/Answers N=46 %
Salary and Allowances 30
65.2
Regular Promotion 29
63.0
Research grants 27
58.7
Job Security 20
43.5
Source: Researcher’s Field Survey Result (2016)
The analysis in Table 4.77 shows that 30 respondents representing (65.2%) attests to the
fact that salary and other allowances package of the University should be improved.
Meanwhile, 29 respondents representing (63%) suggested that University management
should ensure regular promotion for deserving employees while 27(58.7) and 20(43.5)
respondents suggested research grants and job security as a means through which
University can retain best hands.
Question 3: The respondents were asked to state other measures put in place by the
University to ensure high performance of academic staff.
Table 4.78: Performance Strategies Suggested by Respondents
Performance Enhancement N=46 %
Training and Conference Support 21
45.7
Staff Assessment and Monitoring 17
37.0
Source: Researcher’s Field Survey Result (2016)

175
Sequel to the responses of respondents reveal that 21(45.7%) respondents posited that
training and conference support are part of the measures the University management put in
place to ensure high performance of the employees while 17(37.0%) noted that staff
assessment and monitoring are also put in place.
University 4: Covenant University
Question 1: respondents were asked to mention other recruitment and selection strategies
of their University.
Table 4.79: Recruitment and Selection Strategies Suggested by Respondents
Themes/ Answers N=101 %
Internal and External
Advertisement
53
52.5
Ph.D. Bond Arrangement 47
46.5
Head Hunting 39
38.6
Unsolicited Application 31
30.7
Academic Linkages 20
19.8
Professional Linkages 05
5.0
Source: Researcher’s Field Survey Result (2016)
The responses in Table 4.79 reveals that out of 101 respondents in Covenant University,
53 respondents representing 52.5% and 47 respondents representing 46.5% respectively are
of the opinion that internal and external advertisement, Ph.D. bond arrangement are part of
their recruitment strategies in the University. Similarly, the result also shows that
39(38.6%), 31(30.7%, 20(19.8%) and 5(5.0%) are of the view that head hunting,
unsolicited application, collaboration and academic linkages, professional linkages in that
order formed the recruitment and selection strategies of the University.

176
Question 2: The respondents were asked to mention what the University management
should do to improve on the retention strategies.
Table 4.80: Retention Strategies Suggested by Respondents
Themes/Answers N=101 %
Academic Freedom 87
86.1
Stoppage of Attendance Capturing 74
73.3
Subsidised School Fees for Staff
Children
54
53.5
Recognition and Awards 49
48.5
NIHS for Staff and Family 41
40.6
Source: Researcher’s Field Survey Result (2016)
The responses show that out of 101 respondents 86.1% of the respondent believed academic
freedom will increase the retention of academic staff. Besides, 73.3% of the respondents
were also of the opinion that stoppage of attendance capturing will also help in retaining
good heads. Similarly, 53.5%, 48.5% and 40.6% of the respondents believe that the
willingness of the University management to provide subsidised school fees for staff
children, recognition and awards, and availability of National Health Insurance Scheme for
staff and their immediate family members in that order will help in reducing labour turnover
(see Table 4.80).

177
Question 3: The respondents were asked to state other measures put in place by the
University to ensure high performance of academic staff.
Table 4.81: Performance Strategies Suggested by Respondents
Themes/ Answer N=101 %
Conference Support and Full Payment
of articles indexed in ISI and Scopus
Journal Outlets
58
57.4
Regular power supply and Internet
Facilities
49
48.5
Executive Advance and Conference
Participation
40
40.0
Modern Teaching and Research aids 40
40.0
Research Clusters 38
37.6
Lecture Monitoring/e-learning Moodle
platform
36
35.6
Source: Researcher’s Field Survey Result (2016)
The responses in Table 4.81 shows that out of 101 respondents, 57.4%, 48.5%, 40.0%,
40.0%, 37.6% and 35.6% are of the opinion that, Conference Support and Full Payment of
articles indexed in ISI and Scopus Journal Outlets, uninterrupted power supply and internet
facility, executive advance/conference participation, modern teaching and research aids,
research cluster, lecture monitoring/e-learning module platform in that order are the
measures put in place by the University to ensure productive performance of the employees.
University 5: Lead City University
Question 1: respondents were asked to mention other recruitment and selection strategies
of their University.
Table 4.82: Recruitment and Selection Strategies Suggested by Respondents
Recruitment and Selection
Strategies
N=70 %
Internal and External Advertisement 35
50
Head Hunting 32
45.7
Unsolicited Application 31
44.3
Academic Linkages 27
38.6
Source: Researcher’s Field Survey Result (2016)

178
The result in Table 4.82 reveals that out of 70 respondents in Lead City University, 35
respondents representing 50% and 32 respondents representing 45.7% respectively believe
internal and external advertisement, head hunting are part of the recruitment strategies of
the institution. Similarly, the result also shows that 31(44.3%) and 27(38.6 %,) of the
respondents are of the view that unsolicited application and academic linkages formed the
recruitment and selection strategies of the University.
Question 2: The respondents were asked to mention what the University management
should do to improve on retention strategies.
Table 4.83: Retention Strategies Suggested by Respondents
Themes/Answer N=70 %
Regular Promotion 38
54.3
International Conference Support 36
51.4
Research grants 29
41.4
Enhanced staff welfare 35
50
Source: Researcher’s Field Survey Result (2016)
The analysis shows that out of 70 respondents 54.3% of the respondents believed regular
promotion will increase the retention of academic staff. In addition, 51.4% of the
respondents were also of the opinion that international conference support will also help in
retaining competent staff, while 41.4% and 50% respondents believe that the willingness
of the University management to provide research grant and enhanced staff welfare, will
go a long way in retaining staff with distinctive capabilities.

179
Question 3: The respondents were asked to state other measures put in place by the
University to ensure high performance of academic staff.
Table 4.84: Performance Strategies Suggested by Respondents
Themes/Answers N=70 %
Incentives 38
54.2
Organisational Learning 29
41.4
Career Progression 29
41.4
Source: Researcher’s Field Survey Result (2016)
Analysis in Table 4.84 shows that out of 70 respondents, 54.2% are of the opinion that
University management was using incentives as one of the measures to improve
employees’ performance. Meanwhile, 41.4% of the respondents are of the view that the
management employs organisational learning and the other 41.4% view performance
improvement based on career progression.
University 6: Redeemer’s University
Question 1: Respondents were asked to mention other recruitment and selection strategies
of their University.
Table 4.85: Recruitment and Selection Strategies Suggested by Respondents
Themes/Answers N=47 %
Internal and External Advertisement 27
57.4
Unsolicited Application 25
53.2
Interviews 24
51.1
Church Networks 20
42.6
Source: Researcher’s Field Survey Result (2016)

180
Analysis in Table 4.85, reveals that out of 47 respondents in Redeemer’s University, 27
respondents representing 57.4% and 25 respondents representing 53,2% respectively, are
of the view that internal and external advertisement and unsolicited application are part of
the recruitment strategies of the University. Also, the result also shows that 24(51.1%) and
20(42.6%) are of the view that interviews and church networks, formed the recruitment and
selection strategies of the University.
Question 2: The respondents were asked to mention what the University management
should do to improve on the retention strategies.
Table 4.86: Retention Strategies Suggested by Respondents
Themes/Answers N=46 %
Introduction of Gratuity and
Retirement Benefit
27
58.7
Pension Contribution Based on
Gross Salary
24
52.2
Staff Welfare 23
50
International Conference Support 21
45.7
Source: Researcher’s Field Survey Result (2016)
The analysis show that out of 46 respondents, 58.7% were of the opinion that introduction
of gratuity/retirement benefits will increase the retention of academic staff. Besides, 52.2%
of the respondents were also of the opinion that pension contribution based on gross salary
will also help in retaining good heads. Similarly, 50% believe that staff welfare will
enhance the retention of competent staff, while 45.7% of the respondents believe
international conference support will encourage experienced faculty members to stay (see
Table 4.86)
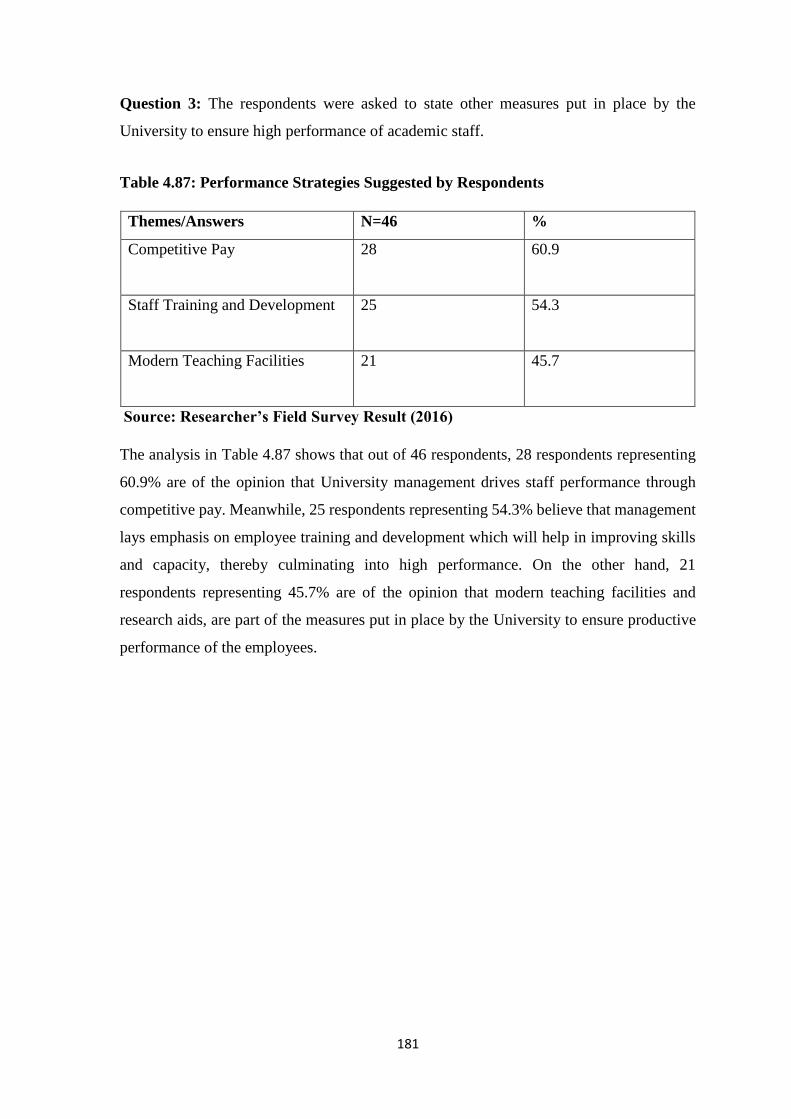
181
Question 3: The respondents were asked to state other measures put in place by the
University to ensure high performance of academic staff.
Table 4.87: Performance Strategies Suggested by Respondents
Themes/Answers N=46 %
Competitive Pay 28
60.9
Staff Training and Development 25
54.3
Modern Teaching Facilities 21
45.7
Source: Researcher’s Field Survey Result (2016)
The analysis in Table 4.87 shows that out of 46 respondents, 28 respondents representing
60.9% are of the opinion that University management drives staff performance through
competitive pay. Meanwhile, 25 respondents representing 54.3% believe that management
lays emphasis on employee training and development which will help in improving skills
and capacity, thereby culminating into high performance. On the other hand, 21
respondents representing 45.7% are of the opinion that modern teaching facilities and
research aids, are part of the measures put in place by the University to ensure productive
performance of the employees.
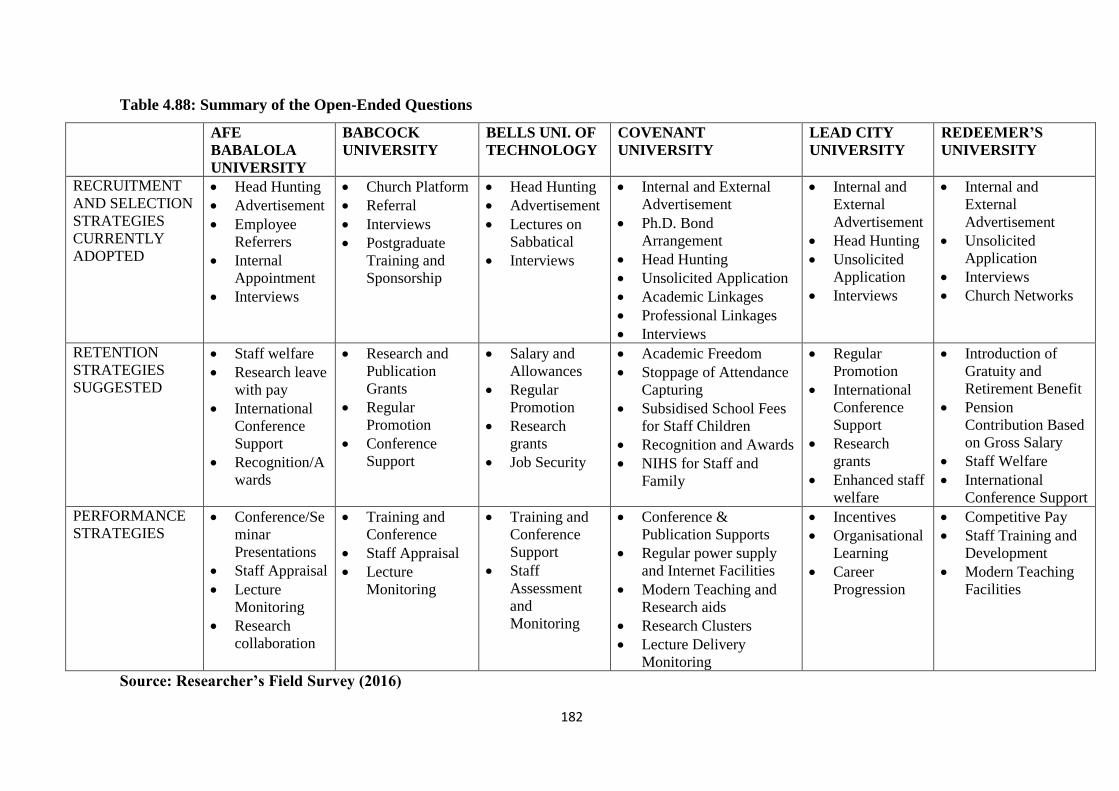
182
Table 4.88: Summary of the Open-Ended Questions
AFE
BABALOLA
UNIVERSITY
BABCOCK
UNIVERSITY
BELLS UNI. OF
TECHNOLOGY
COVENANT
UNIVERSITY
LEAD CITY
UNIVERSITY
REDEEMER’S
UNIVERSITY
RECRUITMENT
AND SELECTION
STRATEGIES
CURRENTLY
ADOPTED
• Head Hunting
• Advertisement
• Employee
Referrers
• Internal
Appointment
• Interviews
• Church Platform
• Referral
• Interviews
• Postgraduate
Training and
Sponsorship
• Head Hunting
• Advertisement
• Lectures on
Sabbatical
• Interviews
• Internal and External
Advertisement
• Ph.D. Bond
Arrangement
• Head Hunting
• Unsolicited Application
• Academic Linkages
• Professional Linkages
• Interviews
• Internal and
External
Advertisement
• Head Hunting
• Unsolicited
Application
• Interviews
• Internal and
External
Advertisement
• Unsolicited
Application
• Interviews
• Church Networks
RETENTION
STRATEGIES
SUGGESTED
• Staff welfare
• Research leave
with pay
• International
Conference
Support
• Recognition/A
wards
• Research and
Publication
Grants
• Regular
Promotion
• Conference
Support
• Salary and
Allowances
• Regular
Promotion
• Research
grants
• Job Security
• Academic Freedom
• Stoppage of Attendance
Capturing
• Subsidised School Fees
for Staff Children
• Recognition and Awards
• NIHS for Staff and
Family
• Regular
Promotion
• International
Conference
Support
• Research
grants
• Enhanced staff
welfare
• Introduction of
Gratuity and
Retirement Benefit
• Pension
Contribution Based
on Gross Salary
• Staff Welfare
• International
Conference Support
PERFORMANCE
STRATEGIES • Conference/Se
minar
Presentations
• Staff Appraisal
• Lecture
Monitoring
• Research
collaboration
• Training and
Conference
• Staff Appraisal
• Lecture
Monitoring
• Training and
Conference
Support
• Staff
Assessment
and
Monitoring
• Conference &
Publication Supports
• Regular power supply
and Internet Facilities
• Modern Teaching and
Research aids
• Research Clusters
• Lecture Delivery
Monitoring
• Incentives
• Organisational
Learning
• Career
Progression
• Competitive Pay
• Staff Training and
Development
• Modern Teaching
Facilities
Source: Researcher’s Field Survey (2016)
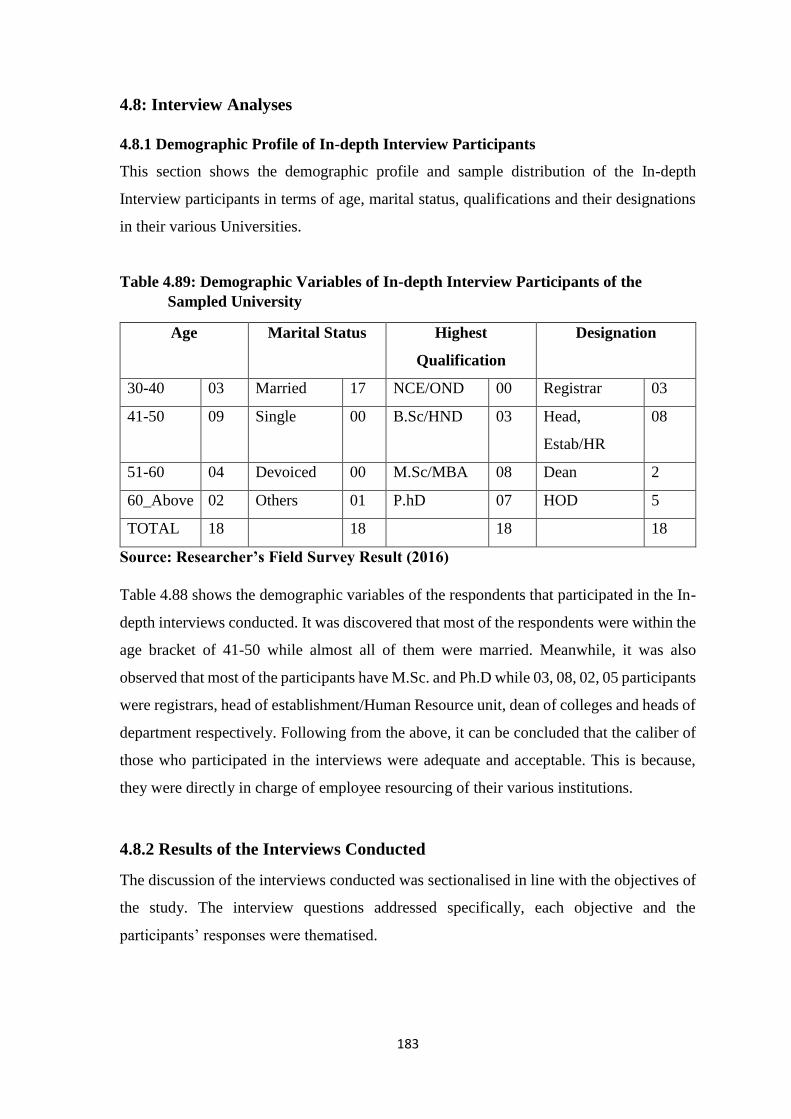
183
4.8: Interview Analyses
4.8.1 Demographic Profile of In-depth Interview Participants
This section shows the demographic profile and sample distribution of the In-depth
Interview participants in terms of age, marital status, qualifications and their designations
in their various Universities.
Table 4.89: Demographic Variables of In-depth Interview Participants of the
Sampled University
Age Marital Status Highest
Qualification
Designation
30-40 03 Married 17 NCE/OND 00 Registrar 03
41-50 09 Single 00 B.Sc/HND 03 Head,
Estab/HR
08
51-60 04 Devoiced 00 M.Sc/MBA 08 Dean 2
60_Above 02 Others 01 P.hD 07 HOD 5
TOTAL 18 18 18 18
Source: Researcher’s Field Survey Result (2016)
Table 4.88 shows the demographic variables of the respondents that participated in the In-
depth interviews conducted. It was discovered that most of the respondents were within the
age bracket of 41-50 while almost all of them were married. Meanwhile, it was also
observed that most of the participants have M.Sc. and Ph.D while 03, 08, 02, 05 participants
were registrars, head of establishment/Human Resource unit, dean of colleges and heads of
department respectively. Following from the above, it can be concluded that the caliber of
those who participated in the interviews were adequate and acceptable. This is because,
they were directly in charge of employee resourcing of their various institutions.
4.8.2 Results of the Interviews Conducted
The discussion of the interviews conducted was sectionalised in line with the objectives of
the study. The interview questions addressed specifically, each objective and the
participants’ responses were thematised.

184
Objective 1
The first interview conducted was to identify human resource planning strategies adopted
by the sampled Universities. At the end of the interview, two themes were formed based
on what the participant said. The themes are:
a. Gap Analysis
b. Job Analysis
Gap Analysis
The participants noted that the gap analysis are usually carried out on regular basis to ensure
minimum staff mix by rank of 20:35:45 for Professors; Senior Lectures, Lecturer 1 and
below as well as staff-student ratio minimum benchmark by the National Universities
Commission. One of the respondents said:
“The University’s management usually asked the Heads of Departments to do the gap
analysis of staff mostly when there is promotion exercise or when accreditation is fast
approaching. The University does this in order to know if the identified positions will be
filled internally by way of promotion or recruit from external context” (Participant4)
Job Analysis
Job analysis is another form of human resource planning strategies adopted by the sampled
Universities. All the participants are of the opinion that job analysis is a strategic approach
that allows the University system to plan on job duties that will be included in the
advertisement of the identified positions, determining the appropriate salary for the
positions; the minimum requirement of academic qualifications and experiences;
recruitment and selection methods among others. For instant, participant 9 reported that:
“Job analysis is a very good strategic approach that has helped our University system to
identify needed skills or talent as well as the basic requirements for any identified
positions. I must also say that job analysis does not only help our University to determine
the job responsibilities, minimum academic requirements, it also helps to identifying
training needs, determining training content, assessment tests to measure effectiveness
and efficiency of training and appropriate training methods”
185
Objectives 2 and 3
Following from research objectives 2 and 3, another set of interviews conducted were to
identify recruitment and selection strategies put in place by the Universities to attract
competent academic staff. At the end of the interviews, two themes were formed based on
what the participant said. The themes are:
a. Head Hunting
b. Internal and External Sources
Headhunting
Following from the interview conducted, most respondents were of the opinion that
headhunting which is a form of recruitment and selection where the University finds the
contact details of someone with needed skills and experiences while also taking steps to
attract or woo the person to join the University, has been one of the strategies used in
attracting academic staff. One of the Heads of Establishment Unit in the sampled University
noted and I quote:
"It is very important to have the right talent on board for the University system to be
effective, efficient and productive in teaching research, innovation and community
service. However, hunt for talent is hitting up because of the level of competition in the
academic environment. (Participant 7)
Another respondent noted
“I want to say that attracting senior academic staff has been one of the critical
challenges faced by our University most especially when accreditation exercise by
National Universities Commission is fast approaching, the University goes to any length
in ensuring that the required number of academic staff are available. (Participant 15)
Another respondent posited that hunting for talent is one of the recruitment strategies
adopted by his University. He opined that:
“…..our University has devised means of attracting senior faculty staff which includes
headhunting of the academic staff within the economically active population as well as
those who are retired but not tired”(Participant 18)
This was validated by some principal officers of the sampled Universities. Meanwhile,
another interviewee from a faith based University among the selected Universities, noted
186
that church network is been used to attract qualified church members from within and
outside the country who are currently serving in other Universities.
Internal and External Sources
The sampled Universities recruit talented academic staff through a variety of channels
including, internal and external sources. One of the participants noted:
“Our University usually considers internal candidates for any vacancies which is usually
posted on the University websites and notice boards within the University premises for
qualified staff to apply” (Participant 11)
“Let me also mention here that if there are no qualified persons from within, then the
University usually advertises the vacancies in the national dailies and University’s
websites with job responsibilities and job specifications clearly spelt out” (Participant 2)
Objective 4
Another set of interviews was conducted to provide insights into the employee retention
strategies of the selected private Universities. At the end of the interviews, two themes were
formed based on what the participant said. The themes are:
a. Staff Welfare and
b. Sponsorship and Grants
Staff Welfare
All the participants are of the opinion that staff welfare benefits such as good
accommodation, personal and asset loans, study leave, pension and gratuities, security,
conducive working environment, well ventilated and air conditioned office accommodation
are some of the strategies that the University is using in retaining their best hands.
“Staff welfare will induce the employees to be loyal and committed to the University. You
will agree with me that staff welfare will not only encourage them to stay but rather it will
also induce them to be more effective” (Participant 9)
Another respondent noted that
“Academic staff usually compare the quality of welfare packages offered by the
Universities around and this often times influence their intention to stay or leave a
University” (Participant 1)
187
Most of the respondents are of the opinion that retention of senior faculty is been a serious
challenge in their Universities because of the shortage of senior academic staff coupled
with ever increasing number of Universities.
“The way Universities in Nigeria are springing up today makes retention of senior
academic staff more competitive and challenging. The reason is because all the newly
established Universities require senior academic staff for accreditations of their courses
and they will want to attract them to come to their Universities” (Participant 17)
“The high level of competition in attracting experienced, active and competent academic
staff in Nigerian Universities have made our Universities most especially the privately
owned to be more proactive and strategic in our approach toward the retention of
competent senior academic staff. What we do here is to give our staff necessary comforts
in terms of good accommodation, competitive pay, retirement benefit, pension scheme
among others” (Participant 8)
The above statement was buttressed by many participants that staff welfare cannot be
overemphasised when it comes to employee retention in a competitive environment.
Sponsorship and Support
Most participants of the selected Universities opined that senior faculty hardly stay long in
a University, they usually move from one University to another. A director of Human
Resource Department of one of the selected Universities also buttressed the above
statement that the limited experienced senior faculty have greater international
opportunities and would want to explore such opportunities when available. This was also
validated by some principal officers interviewed. Some of the interviewees noted that
employee retention strategies adopted by some of the private universities includes: training
and conference support, research grants, publication support and Ph.D sponsorship.
Objective 5
Another set of interviews conducted was to provide insights into the performance of the
academic staff in the selected Universities. At the end of the interviews, two themes were
formed based on what the participant said. The themes are
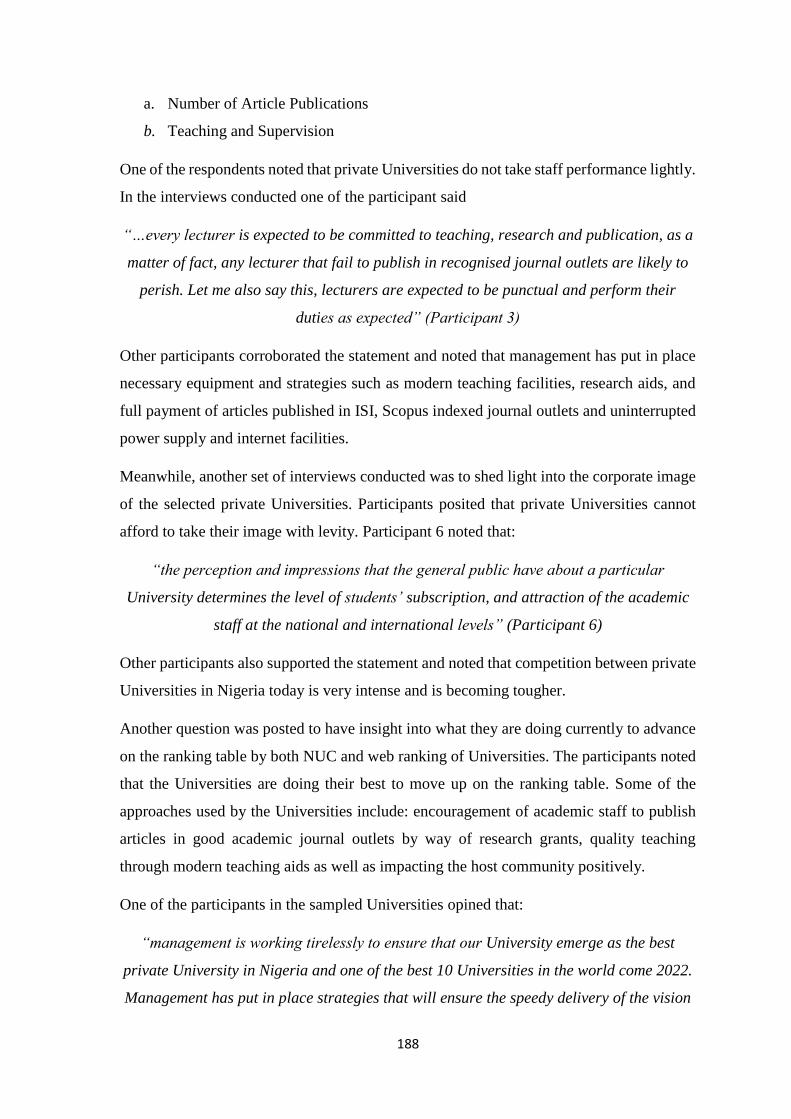
188
a. Number of Article Publications
b. Teaching and Supervision
One of the respondents noted that private Universities do not take staff performance lightly.
In the interviews conducted one of the participant said
“…every lecturer is expected to be committed to teaching, research and publication, as a
matter of fact, any lecturer that fail to publish in recognised journal outlets are likely to
perish. Let me also say this, lecturers are expected to be punctual and perform their
duties as expected” (Participant 3)
Other participants corroborated the statement and noted that management has put in place
necessary equipment and strategies such as modern teaching facilities, research aids, and
full payment of articles published in ISI, Scopus indexed journal outlets and uninterrupted
power supply and internet facilities.
Meanwhile, another set of interviews conducted was to shed light into the corporate image
of the selected private Universities. Participants posited that private Universities cannot
afford to take their image with levity. Participant 6 noted that:
“the perception and impressions that the general public have about a particular
University determines the level of students’ subscription, and attraction of the academic
staff at the national and international levels” (Participant 6)
Other participants also supported the statement and noted that competition between private
Universities in Nigeria today is very intense and is becoming tougher.
Another question was posted to have insight into what they are doing currently to advance
on the ranking table by both NUC and web ranking of Universities. The participants noted
that the Universities are doing their best to move up on the ranking table. Some of the
approaches used by the Universities include: encouragement of academic staff to publish
articles in good academic journal outlets by way of research grants, quality teaching
through modern teaching aids as well as impacting the host community positively.
One of the participants in the sampled Universities opined that:
“management is working tirelessly to ensure that our University emerge as the best
private University in Nigeria and one of the best 10 Universities in the world come 2022.
Management has put in place strategies that will ensure the speedy delivery of the vision

189
through the establishment of research clusters, encouragement of academic staff to
publish articles where it will count for ranking i.e. ISI or Scopus indexed journal outlets,
innovation, product development, industry partnership among others’ (Participant 5)
Other participants noted that their Universities have been able to identify areas of strengths
and working assiduously to have a major research breakthrough, as this will promote the
image of the institution both at local and international levels.

190
CHAPTER FIVE
DISCUSSIONS
5.1 Introduction
The chapter presents the discussion of findings in relation to related previous studies in the
area of employee resourcing strategies, job performance and corporate image, with a view
to drawing practicable policy implications for institutions of higher learning and other
sectors.
5.2 Quantitative Findings
The discussion of research findings is based on the analysis of five tested hypotheses.
Hypothesis 1: Human Resource Planning strategies have no significant effect on
University’s brand image.
Findings from the test of hypothesis 1 show that human resource planning strategies (gap
analysis, staff mix, staff-students’ ratio, job analysis and manpower utilisation) have
significant effects on University’s brand image (product, service). The result also revealed
that the measures of human resource planning strategies, i.e. job analysis, gap analysis and
employee utilisation are statistically significant in contributing to job performance and
enhancing University’s brand image. It is imperative to note that human resource planning
in this context involves evaluating future academic needs and deciding on the right numbers
of people with relevant skills required, either from within the organisation or from the
labour market. Most often, it involves preparing long-term plans for ensuring that
recruitment and selection processes will satisfy the need of the organisation. Studies have
shown that organisations perform below expectation because individuals are not properly
matched with their jobs which invariably impair on their performance and as well affect
the overall product or service of the organisation (Brewster, Brookes, Croucher & Wood,
2014). Some studies highlight that job analysis and gap analysis are found to be a strong
predictor of job performance and brand image (Brewster & Mayrhofer, 2013). The
implication of this result is that, the organisation will be properly and rightly staffed and
employees would be more creative, committed and productive if there are proper manpower
planning strategies that will enforce standards in alignment with organisational objectives
through which skill, ability and knowledge requirements will be clearly defined, and thus,
result in improved performance and enhance corporate image.
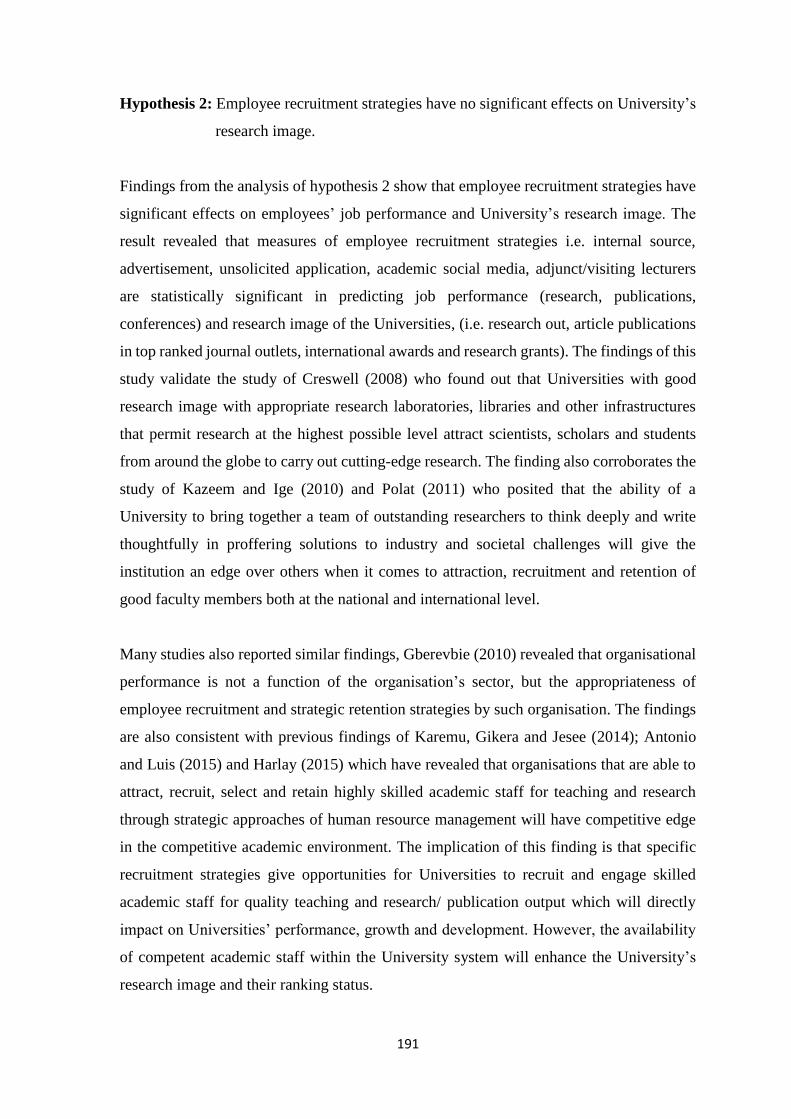
191
Hypothesis 2: Employee recruitment strategies have no significant effects on University’s
research image.
Findings from the analysis of hypothesis 2 show that employee recruitment strategies have
significant effects on employees’ job performance and University’s research image. The
result revealed that measures of employee recruitment strategies i.e. internal source,
advertisement, unsolicited application, academic social media, adjunct/visiting lecturers
are statistically significant in predicting job performance (research, publications,
conferences) and research image of the Universities, (i.e. research out, article publications
in top ranked journal outlets, international awards and research grants). The findings of this
study validate the study of Creswell (2008) who found out that Universities with good
research image with appropriate research laboratories, libraries and other infrastructures
that permit research at the highest possible level attract scientists, scholars and students
from around the globe to carry out cutting-edge research. The finding also corroborates the
study of Kazeem and Ige (2010) and Polat (2011) who posited that the ability of a
University to bring together a team of outstanding researchers to think deeply and write
thoughtfully in proffering solutions to industry and societal challenges will give the
institution an edge over others when it comes to attraction, recruitment and retention of
good faculty members both at the national and international level.
Many studies also reported similar findings, Gberevbie (2010) revealed that organisational
performance is not a function of the organisation’s sector, but the appropriateness of
employee recruitment and strategic retention strategies by such organisation. The findings
are also consistent with previous findings of Karemu, Gikera and Jesee (2014); Antonio
and Luis (2015) and Harlay (2015) which have revealed that organisations that are able to
attract, recruit, select and retain highly skilled academic staff for teaching and research
through strategic approaches of human resource management will have competitive edge
in the competitive academic environment. The implication of this finding is that specific
recruitment strategies give opportunities for Universities to recruit and engage skilled
academic staff for quality teaching and research/ publication output which will directly
impact on Universities’ performance, growth and development. However, the availability
of competent academic staff within the University system will enhance the University’s
research image and their ranking status.
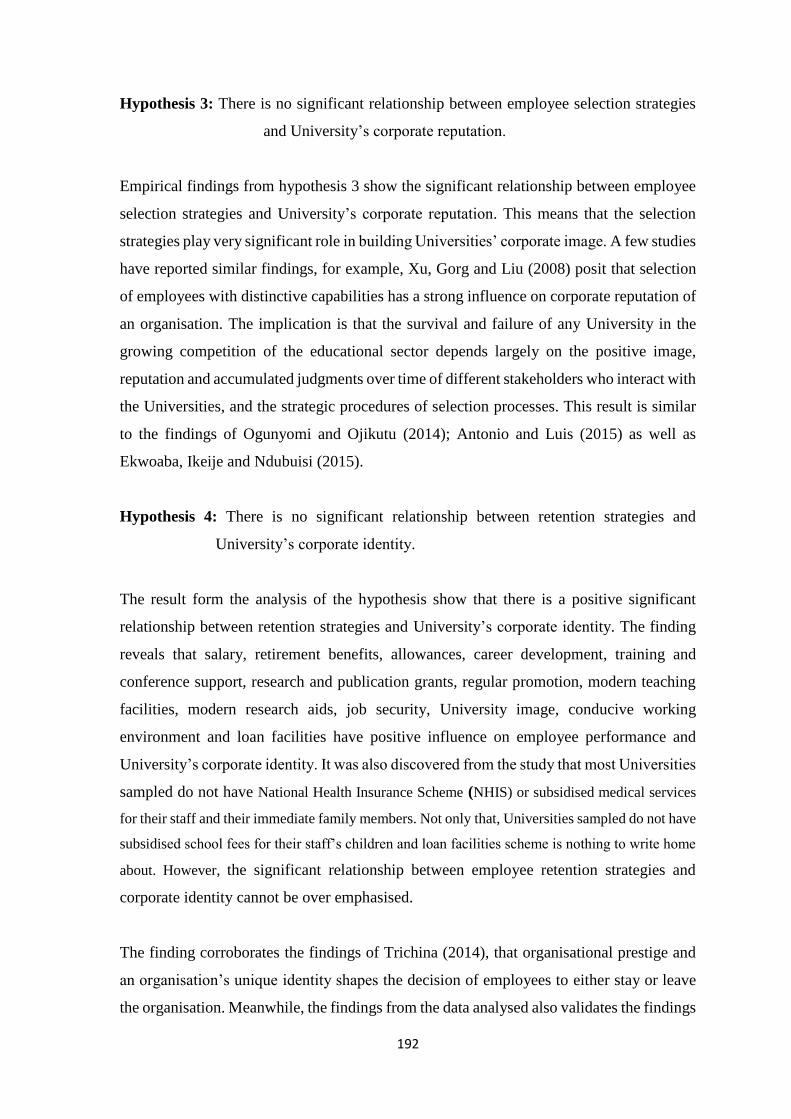
192
Hypothesis 3: There is no significant relationship between employee selection strategies
and University’s corporate reputation.
Empirical findings from hypothesis 3 show the significant relationship between employee
selection strategies and University’s corporate reputation. This means that the selection
strategies play very significant role in building Universities’ corporate image. A few studies
have reported similar findings, for example, Xu, Gorg and Liu (2008) posit that selection
of employees with distinctive capabilities has a strong influence on corporate reputation of
an organisation. The implication is that the survival and failure of any University in the
growing competition of the educational sector depends largely on the positive image,
reputation and accumulated judgments over time of different stakeholders who interact with
the Universities, and the strategic procedures of selection processes. This result is similar
to the findings of Ogunyomi and Ojikutu (2014); Antonio and Luis (2015) as well as
Ekwoaba, Ikeije and Ndubuisi (2015).
Hypothesis 4: There is no significant relationship between retention strategies and
University’s corporate identity.
The result form the analysis of the hypothesis show that there is a positive significant
relationship between retention strategies and University’s corporate identity. The finding
reveals that salary, retirement benefits, allowances, career development, training and
conference support, research and publication grants, regular promotion, modern teaching
facilities, modern research aids, job security, University image, conducive working
environment and loan facilities have positive influence on employee performance and
University’s corporate identity. It was also discovered from the study that most Universities
sampled do not have National Health Insurance Scheme (NHIS) or subsidised medical services
for their staff and their immediate family members. Not only that, Universities sampled do not have
subsidised school fees for their staff’s children and loan facilities scheme is nothing to write home
about. However, the significant relationship between employee retention strategies and
corporate identity cannot be over emphasised.
The finding corroborates the findings of Trichina (2014), that organisational prestige and
an organisation’s unique identity shapes the decision of employees to either stay or leave
the organisation. Meanwhile, the findings from the data analysed also validates the findings

193
of some scholars that institutions of higher learning with adequate employee retention
strategies in form of regular promotion, career growth, conference support, research grants,
job security, competitive remuneration, participation in decision making, welfare packages
for staff and their family will be able to attract and retain key talents which will invariably
promote the quality of teaching, research output, and community impact and as well
enhance the image of the institutions (Gberevbie, 2006; Naris & Ukpere, 2010; Ahunanya
& Osakwe, 2012; Kibui, Gachunga & Namusonge, 2014). The implication of this finding
in the data analysed is that any University or institution of higher learning that fails to put
in place adequate retention strategies will find it difficult to attract and retain competent
and talented individuals with distinctive capabilities in its employment, and therefore
experience poor performance and frequent employee turnover.
Hypothesis 5
Ho5: Job performance does not mediate the relationship between employee resourcing
strategies and corporate image.
The findings from the analysed data in hypothesis 5 show that job performance indicators
in University environments such as teaching and supervision of students’ projects, research
and publication outputs, service to the University, i.e. committee membership,
administrative positions and community service mediate the relationships between
employee resourcing strategies, i.e. human resource planning strategies, recruitment
strategies, selection strategies, retention strategies and University’s corporate image i.e.
brand image (product and service), research image, corporate reputation and corporate
identity. The study corroborates the finding of Polat (2011) and CIPD (2008) that reveal a
significant moderate positive relationship between performance and perceived
organisational image. The implication of these findings to the Universities is that the more
appropriate staff resourcing strategies in operation, the more the University’s corporate
image will be enhanced.
5.3 Qualitative Findings
Further to the objectives of this study and the themes developed from the interviews
conducted in the sampled Universities, the following are the findings:
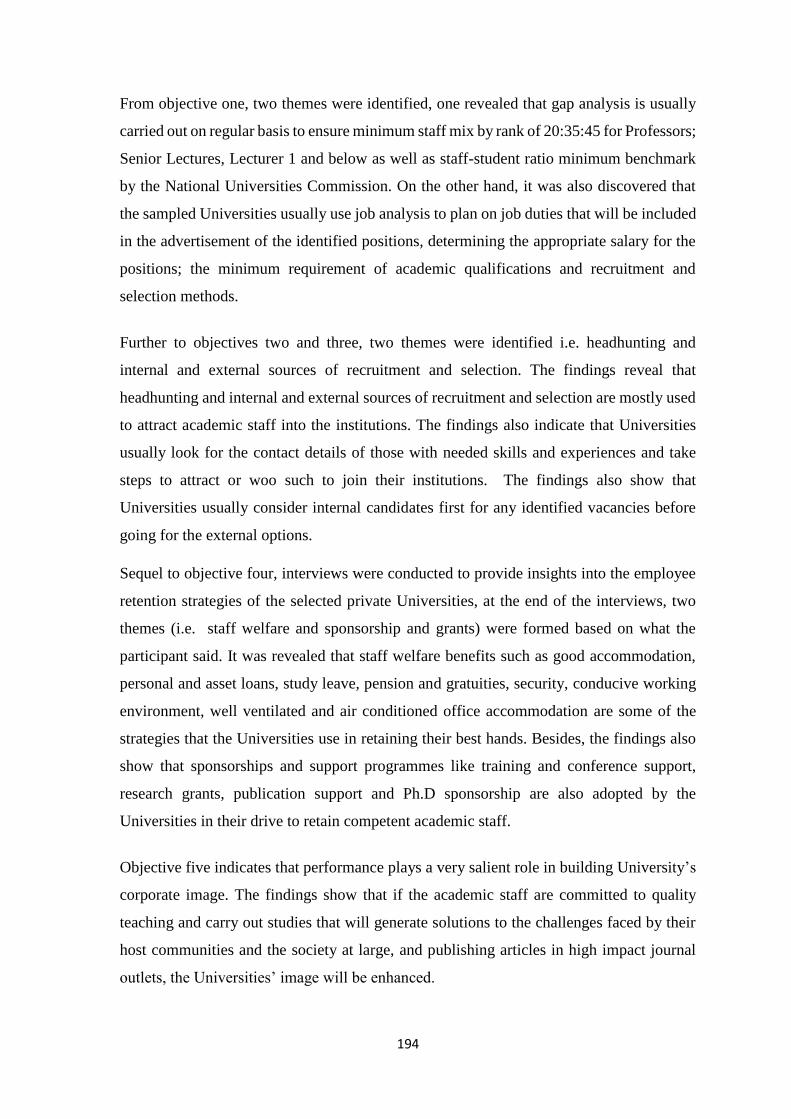
194
From objective one, two themes were identified, one revealed that gap analysis is usually
carried out on regular basis to ensure minimum staff mix by rank of 20:35:45 for Professors;
Senior Lectures, Lecturer 1 and below as well as staff-student ratio minimum benchmark
by the National Universities Commission. On the other hand, it was also discovered that
the sampled Universities usually use job analysis to plan on job duties that will be included
in the advertisement of the identified positions, determining the appropriate salary for the
positions; the minimum requirement of academic qualifications and recruitment and
selection methods.
Further to objectives two and three, two themes were identified i.e. headhunting and
internal and external sources of recruitment and selection. The findings reveal that
headhunting and internal and external sources of recruitment and selection are mostly used
to attract academic staff into the institutions. The findings also indicate that Universities
usually look for the contact details of those with needed skills and experiences and take
steps to attract or woo such to join their institutions. The findings also show that
Universities usually consider internal candidates first for any identified vacancies before
going for the external options.
Sequel to objective four, interviews were conducted to provide insights into the employee
retention strategies of the selected private Universities, at the end of the interviews, two
themes (i.e. staff welfare and sponsorship and grants) were formed based on what the
participant said. It was revealed that staff welfare benefits such as good accommodation,
personal and asset loans, study leave, pension and gratuities, security, conducive working
environment, well ventilated and air conditioned office accommodation are some of the
strategies that the Universities use in retaining their best hands. Besides, the findings also
show that sponsorships and support programmes like training and conference support,
research grants, publication support and Ph.D sponsorship are also adopted by the
Universities in their drive to retain competent academic staff.
Objective five indicates that performance plays a very salient role in building University’s
corporate image. The findings show that if the academic staff are committed to quality
teaching and carry out studies that will generate solutions to the challenges faced by their
host communities and the society at large, and publishing articles in high impact journal
outlets, the Universities’ image will be enhanced.

195
5.4 Theoretical Findings
There are different theoretical perspectives on strategic human resource management and
organisational behaviours. Notable among them are: universalistic theory of management
(Pfeffer, 2001; Luthans & Summer, 2005; Marchington & Wilkinson, 2008; Pedro, 2012);
Configurational theory of management (MacDuffie, 2005; Storey, 2007; Waiganjo,
Mukulu & Kahiri, 2012; Brewster & Mayrhofer, 2013); equity theory (Adams, 1963; 1965;
Mowday, 1991; Donovan, 2001); decision-making theory and contingency theory of
management (Burns & Stalker, 1961; Miles & Snow, 1978; Dyer, 2005; Wright & Snell,
2005; Purcell & Hutchinson, 2007; Boxall & Purcell, 2008), among others.
This study adopted the contingency management theory as its exploratory framework. The
contingency theory, also known as best fit, theory emphasises the relationships between
variables in the world of work, and the approach used depends on the context and culture
of the organisation within a situation. The importance of the theory premises on its
integration of diverse process, quantitative and behavioural approaches to management in
organisations, be it private or public within a peculiar situation. Wright and Snell (2005)
opined that human resource management practices would be more effective and efficient if
integrated into the specific organisational strategy and environmental context. The
peculiarity of an organisation in terms of culture, core values, operational processes, and
external environment should be taken into consideration when planning for the immediate
and future needs of the organisation towards maximising performance during competition.
The empirical findings of this study validate the theoretical underpinning of the
contingency theory of management by supporting the fact that human resource planning
strategies have significant effects on job performance and in promoting good organisational
image. This means that institutions of higher learning can use different human resource
planning strategies that best fit their overall corporate strategy depending on the changing
circumstances of the Universities.
The contingency approach to management emphasises that there is no single best approach
to the management of people in the world of work, thus, it is based on immediate contingent
situations. The employee resourcing strategies such as recruitment, selection, placement
and retention must be tailored towards the effective actualisation of the organisational
goals. The theory also posits that conditions of a task, the requirements of the management
job, and people involved as parts of a complete management situation, must be identified
196
and properly integrated to all facets of the organisation into a resolution that is considered
to be the most appropriate for an explicit situation. This was validated by the result of the
empirical findings of this study which revealed that the measures of employee resourcing
strategies are statistically significant in contributing to the job performance and enhancing
Universities’ brand image. This implies that there is no best way of employee resourcing,
thus, different strategies could be used depending on the strategies that best fit or suit the
overall strategy of the Universities.
Similarly, organisations are more efficient and effective when there is integration between
the overall organisation business strategies and human resource management practices
(Legge, 2005; Wright, Gardner & Allen, 2005). Besides, the availability of employees with
distinctive capabilities and good disposition in an organisation, in alignment with overall
strategic goal of the organisation, determines the level of performance. It is important to
note that no two situations are unquestionably identical. The empirical findings of this
study validate the theoretical underpinning of the contingency theory of management by
supporting the significance of employee resourcing strategies in alignment with overall
organisational strategic goals. The implication is that, Universities must be flexible and as
well ready to adapt to changing circumstances in solving employee resourcing challenges
via strategies that best fits or suit the Universities.

197
CHAPTER SIX
CONCLUSIONS AND RECOMMENDATIONS
6.1 Introduction
The chapter presents the summary of the entire research work, conclusions and
recommendations, with a view to drawing practicable policy implications for institutions
of higher learning in the area of employee resourcing strategies, job performance and
corporate image.
6.2 Summary of the Study
The main objective of the study was to examine the employee resourcing strategies and the
implications of these for job performance and perceived corporate image.
In specific terms, the study sought to:
i. examine how human resource planning strategies can enhance job performance
and thereby promote University’s brand image.
ii. determine whether employee recruitment strategies can promote University’s
research image, that is, through research output.
iii. investigate how employee selection strategies can enhance University’s
effectiveness in promoting its corporate reputation.
iv. analyse the extent to which employee retention strategies can improve
University’s efficiency in building her corporate identity.
v. ascertain the influence of job performance as a mediator of employee resourcing
strategies and corporate image.
Sequel to the objectives of the study, some research questions were generated which
include: to what extent can human resource planning affect job performance and
University’s brand image? In what ways would employee recruitment affect University’s
research image? To what extent can employee selection enhance University’s effectiveness
and corporate reputation? In what ways can employee retention affect University’s
efficiency in building her corporate identity? What is the mediating influence of job
performance on the relationship between employee resourcing strategies and corporate
image?

198
The study adopted research designs and constructs that were developed in previous studies
on employee resourcing strategies, job performance and corporate image in educational
organisations to achieve the above stated objectives. Meanwhile, it appears that private
Universities in Nigeria generally find it difficult to attract and retain senior academics with
distinctive capabilities despite the conducive working environments and incentives put in
place by some private Universities in Nigeria. This is evident in the way senior faculty
members move from one University to another.
To achieve the objectives of the study, data sample was drawn from six private Universities
in Southwest, Nigeria as ranked by National Universities Commission (NUC) 2016. The
sampled Universities were Afe Babalola University, Ekiti State; Babacok University,
Ilishan-Remo, Ogun State; Bells University of Technology, Ota, Ogun State; Covenant
University, Ota, Ogun State; Lead City University, Ibadan, Oyo State and Redeemer’s
University, Ede, Osun State. These private Universities were also considered based on their
relative performance in the latest ranking of Universities by NUC and Webometric.
The study is summarised thus. Chapter One considered the background to the study,
statement of the research problem, objectives of the study, research questions, hypotheses,
significance of the study, scope, operationalisation of the variables, schematic model and
definition of operational terms.
In Chapter Two, the subject of employee resourcing strategies and its influence on job
performance and corporate image were examined. In addition, the conceptual framework,
theoretical and empirical frameworks were thoroughly reviewed. The chapter also
introduced the universalistic theory, contingency theory and configurational theory of
management which were adopted for the study.
Chapter Three focused on the procedures or various sequential steps for data gathering,
research design, population, sample size, sampling techniques, sampling frame, research
instruments, and the techniques adopted in analysing the data. It also accounted for the
validity and reliability of methods adopted, ethical considerations among others. In this
study, a cross-sectional research design as well as exploratory and descriptive designs was
adopted. The justification for these designs was that the researcher adopted a one-time
observation, including proximate and conclusive variables essential for the study, and

199
phenomenon of interest, which according to this study, is to investigate whether employee
resourcing strategies have any effect on job performance of academic staff and the
corporate image of the sampled Universities.
There are 61 private Universities in Nigeria, 28 of these are located in Southwest Nigeria.
Therefore, the study population from which sample was drawn consists of all 28 private
Universities in Southwest Nigeria. Out of these twenty-eight private Universities, six were
selected as the study sample through judgmental sampling method. The choice of the
Universities was because they are the first six private Universities as ranked by NUC 2016.
Copies of Questionnaire were administered to the academic staff vis-à-vis Professors,
Associate Professors, Senior Lecturers, etc. The research design, population and sample
were explained. The research instrument, the validity and reliability of the instrument were
explained. Questionnaire copies were administered to 500 respondents out of which 433
were retrieved and analysed.
Chapter Four focused on the results of the empirical findings. The main drive of the
research was to investigate the resultant effects and the level of relationships between
employee resourcing strategies, job performance and perceived corporate image of some
selected private Universities in Southwest, Nigeria. Six private Universities were
considered for the study. 500 copies of questionnaire were administered to the selected
Universities out of which 443 copies of questionnaire which represent 86.86%, were
retrieved and adjudged suitable for the analysis. An analysis of the questionnaire by total
responses showed that Afe Babalola University has 88 (20%); Babcock University has
91(21%); Bells University of Technology has 46 (10%); Covenant University has 101
(23%); Lead City University has 70 (16%) and Redeemer’s University has 47 (10%) total
number of respondents.
Tables 4.1 to Tables 4.6b report responses on the demographic profile of the participants,
showing their distributions in terms of age, marital status, rank/level in the University, and
experience. Table 4.7 – 4.21 gave the descriptive statistics on the respondents’ views about
the components of employee resourcing strategies, job performance and the University’s
corporate image. Table 4.16 – 4.25 reported the responses from the four hypotheses tested.
These tables among other enabled the researcher to have insight into employee resourcing
strategies and corporate image of the selected Universities in Southwest Nigeria. This
further enabled the researcher to draw specific and relevant conclusions.
200
The study reveals that human resource planning is usually carried out through gap analysis,
staff mix by rank, and NUC staff-students ratio. It is also important to note that even though
the sampled Universities do not recruit academic staff for research and publications only,
faculty members are usually encouraged and supported with research and publication
grants, modern research aids, among others to conduct research and publish same. It was
discovered from the study that sampled private Universities put in place appropriate staff
recruitment strategies in terms of educational qualification, skills and experience and
adequate retention strategies to retain their competent faculty members.
Meanwhile, sourcing of competent academics is largely done through advertisement of
vacant positions in national newspapers, the internet, unsolicited applications and lately,
academic social networks like researchgate, academia, LinkedIn etc. With these strategies,
the emphasis is on merit, that is, recruitment is based on relevant qualifications in terms of
education, skills and experience. Also, the retention strategies put in place by these
Universities are, but not limited to: training and conference support (both at local and
international levels), career progression, conducive working environment, research and
publication grants, modern teaching facilities, good accommodation, training of young
graduate for Ph.D. through bond and modern research aids. The study also revealed that
the Universities need to improve on other welfare packages such as free medical services
for staff, spouse and their children, payment of thirteenth month salary or end of year bonus
to staff, outstanding research award to faculty members for different categories, health
insurance scheme to staff, subsidised school fees to staff’s children, subsidised staff
quarters among others.
In Chapter Five which is the last chapter of this thesis, discussions on the findings,
conclusion, recommendations, suggestions for further studies, contributions to knowledge
and proposed model for analysis were addressed.
6.3 Conclusion
The conclusions of this study are based on the findings from test of hypotheses. This
provides answers to the formulated research questions. This study concludes that
manpower planning strategies (gap analysis, job analysis, manpower inventory among
others) have positive significant effect on Universities’ brand image (product and service).
The implication of this is that, if manpower planning is given necessary attention,
201
Universities would effortlessly achieve minimum required staff mix and staff-students ratio
as recommended by NUC.
The study also concludes that, employee recruitment and selection strategies have positive
significant effect on Universities’ research image and corporate reputation. However, it is
evidence to validate that recruitment and selection strategies can help in promoting
Universities’ research image and corporate reputation via scholarly research outputs
published in good indexed academic journal outlets.
Besides, study also concludes that employee retention strategies could be used as a platform
to drive Universities’ corporate identity. However, if this is given necessary attention, it
would compel faculty members with distinctive capabilities to stay, and at the same time,
attract others to join the University. The study also concludes that job performance such
as teaching and supervision, research productivity, community service and service to the
University play a very significant mediating role between employee resourcing strategies
and corporate image.
6.4 Recommendations
The following are the recommendations using the corporate image, job performance
antecedents and the various employee resourcing strategies variables identified in the study.
i. Employee resourcing strategies are regarded as the “nuts” and “bolts” of
strategic human resource management practices. However, University
managements should be more proactive in adopting/adapting this practice in
order to enhance their Universities’ ability to fulfil their strategic objectives.
ii. Since research/publication output is one of the fundamental criteria for
Universities’ ranking, the management of Universities should endeavour to
recruit academic staff for research and publications only. The post doc scheme
should also be encouraged. This will enhance their Universities’ image.
iii. University managements should ensure that their recruitment and selection
practices emphasise the core attribute and values that define their Universities’
goals and agenda.
iv. Retention of valuable and competent employees is the major issue among
sampled Universities. Recommendations specific to this issue are as follows:

202
a. The management of the Universities must ensure competitive remuneration
for all categories of staff most especially the senior academic staff in order
not to lose them to the competitor. This is because private University
education in Nigeria is very competitive and new Universities are springing
up on regular basis, making the competition more intense as those new ones
require the services of the senior academic staff for accreditation and
principal offices.
b. It was also discovered that most Universities sampled do not have National
Health Insurance Scheme (NHIS) or subsidised medical services for their staff and
their immediate family members. It is therefore recommended that the
Universities’ managements should endeavour to provide NHIS for their staff. Also,
National Universities Commission should formulate a policy that will mandate all
the Universities in Nigeria to have NHIS or subsidised medical services for all the
staff.
c. Most Universities sampled do not have subsidised school fees for their staff’s
children. It is therefore recommended that staff should be given discount on the
school fees of their children schooling either in the staff school or University itself.
This will make the employees to be more committed, loyal, and productive. This
will reduce the chances of employees leaving the University.
d. Loan facilities for members of staff is another very critical issue in most of
the sampled Universities. Staff do not have access to loan facilities that will
enable them to meet certain needs. Thus, the researcher recommends that
Universities’ managements should formulate policies on loan facilities that
will enable staff to access personal or asset loans.
v. Human resource planning should be taken serious by Universities’
managements as this will help to systematically forecast the Universities’ future
demand and supply of academic staff and therefore, matches supply with
demand.
6.5 Contributions to Knowledge
i. The study provides a practical way of implementing employee resourcing strategies
and policies that will enhance the corporate image of Nigerian Universities.
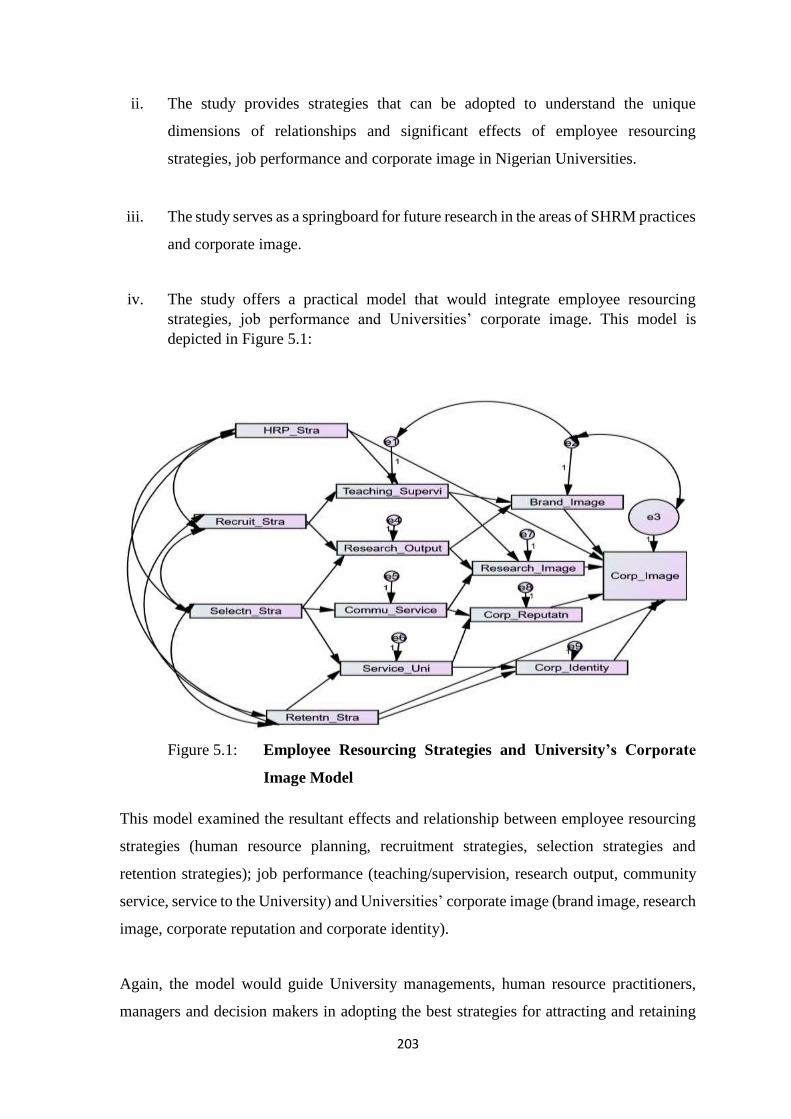
203
ii. The study provides strategies that can be adopted to understand the unique
dimensions of relationships and significant effects of employee resourcing
strategies, job performance and corporate image in Nigerian Universities.
iii. The study serves as a springboard for future research in the areas of SHRM practices
and corporate image.
iv. The study offers a practical model that would integrate employee resourcing
strategies, job performance and Universities’ corporate image. This model is
depicted in Figure 5.1:
Figure 5.1: Employee Resourcing Strategies and University’s Corporate
Image Model
This model examined the resultant effects and relationship between employee resourcing
strategies (human resource planning, recruitment strategies, selection strategies and
retention strategies); job performance (teaching/supervision, research output, community
service, service to the University) and Universities’ corporate image (brand image, research
image, corporate reputation and corporate identity).
Again, the model would guide University managements, human resource practitioners,
managers and decision makers in adopting the best strategies for attracting and retaining
204
competent employees. The integration of the model into the overall goals of the University
system and other institutions of higher learning will afford the institutions to have faculty
members with distinctive capabilities that will be committed and productively engaged for
research, teaching, innovation and community impact. This will therefore promote the
image of the institutions. Moreover, the model emphasises that job performance and the
corporate image of organisations are dependent factors on the observed variables.
6.6 Limitations of the Study
It is imperative to note here that in the course of carrying out this study, the researcher
encountered some limitations. The study was limited in scope as it only covered six private
Universities in Southwest Nigeria. The implication of the findings may not be generalised
to other Universities that were not selected. In addition, it is also important to report that,
the study covered only five hundred employees and only regression, product moment
correlation and structural equation modelling were used for the analysis of the hypotheses.
6.7 Suggestion for Further Studies
i. The scope of this study was limited to six (6) private Universities in Southwest
Nigeria, but was able to accomplish the objective of the study. However, it is
suggested that future studies can widen research scope across the private
Universities in all the six geopolitical regions of Nigeria.
ii. This study only focused on private Universities, meanwhile, for a generalised
perspective, a comparative study should be carried out to compare and validate
applicability of the findings to public Universities in Nigeria.
iii. In this study, the researcher used job performance as a mediating variable
between employee resourcing strategies and Universities’ corporate image,
future studies can make use of other mediating variables such as employee
satisfaction, staff loyalty, and so on
iv. Additional survey research could also be carried out to explore the possible
application of the findings of this research to other sectors of the Nigerian
economy.
205
v. Employees’ perceptions of both private and public Universities can be
compared in terms of their views on the relationship between employee
resourcing strategies and corporate image.
vi. The researcher used cross-sectional research design for this study, other
researchers can make use of longitudinal study in order to confirm the
consistency of the continuous relationships or resultant effects between the
variables.
206
REFERENCES
Abdullah, A. (2014). The impact of affective human resources management practices on
the financial performance of the Saudi Banks. Review of Integrative Business and
Economics Research, 3(1): 327-336.
Abdul, H. and Aamer, W. (2011). Employee development and its effect on employee
performance a conceptual framework. International Journal of Business and Social
Science, 2(13): 224-229.
Abdul, M.K. (2015). How do recruitment and selection practices impact small and medium
enterprises performance in the construction industry in Sierra Leone? Journal of Economics
and Sustainable Development, 6(5): 253-270.
Abudulkereem, A.Y., and Oyeniran, S. (2011). Managing performance of Nigerian
universities for sustainable development. International Journal of Academic Research in
Business and Social Sciences, 1(3): 1-9.
Abel, M.H. (2008). Competencies management and learning organisational memory.
Journal of Knowledge Management, 12(6): 12-30.
Abome, O.S. (2013). Assessment of recruitment practice on organisation performance:
empirical study of hospitality businesses in Abuja. National institute for hospitality and
tourism. European Scientific Journal, 9(29): 43-57.
Adams, J.S. (1963). Towards an understanding of inequality. Journal of Abnormal and
Normal Social Psychology. (67): 422-436.
Adams, J.S. (1965). Inequality in social exchange in advances in experimental psychology,
Academic Press, New York, NY.
Adeniji, A.A., Osibanjo, A.O. and Abiodun, A.J. (2013). Organisational change and human
resource management interventions: an investigation of the Nigerian banking industry.
Serbian Journal of Management, 8(2): 104-115.
Adeniji, A.A. and Osibanjo, A.O. (2012). Human resource management: theory and
practice. Lagos, Pumark.
Adeyeye, J.O. (2009). An evaluation of human resource management practices in Nigerian
universities: the impact of size. The Social Sciences, 4(5): 494-498.
Ahunanya, S. and Osakwe, T. (2012). Private universities in Nigeria: emergent realities and
coping strategies, Journal of Emerging Trends in Educational Research and Policy Studies,
3(5): 695-700.
Aguirre-Urreta, M. and Ronkko, M. (2015). Sample size determination and statistical
power analysis in PLS using R: an annotated tutorial. Communications of the Association
for Information Systems, 36(1): 3.
207
Aina, T.A. (2010). The role of private universities in driving social and economic change:
challenges and opportunities. The 5th convocation ceremony distinguished lecture,
Covenant University, Ota, Nigeria.
Ajayi, I.A., Awosusi, O.O., Arogundade, B.B. and Ekundayo, H.T. (2015). Work
environment as correlate of academic staff job performance in Southwest Nigerian
Universities. European Journal of Educational Studies, 3(1): 1-9.
Akinusi, D.M. (2008). Benchmarking of human resource management in the public sector:
prospects, problems and challenges. South African Journal of Human Resource
Management, 6(2): 25-31.
Akhigbe, O.J. (2013). Human resource planning: a key factor in ensuring the effectiveness
and efficiency of organisation. Journal of Emerging Trends in Economics and Management
Sciences, 4(4): 388-392.
Alan, P. (2007). Human resource management in business context. UK, Jennifer Pegg 3rd
ed
Altbach, P.G. and Balan, J. (2007). World class worldwide: transforming research
universities in Asia and Latin America. Baltimore: Johns Hopkins University Press.
Ambrose, K. and Philip, O. (2015). Effects of employee resourcing and development
practices on organisation performance. International Journal of Business and Social
Research, 5(7): 51-60.
American Management Association AMA (2014). Strategic human resource management.,
New York, AMACOM publishing.
Andersson, M., Asplund, C., Byström, M. and Ekman, P. (2014). Tools and strategies for
innovative talent attraction and retention: A handbook on talent attraction management for
cities and regions, Tendensor.
Antonio, L.G., and Luis, F.D. (2015). Employee recruitment, selection, and assessment.
Current Issues in Work and Organisational Psychology. New York, Psychological Press.
Arbnor, I. and Bjerke, B. (1997). Methodology for creating business knowledge (2nd ed.),
UK, Sage Publications.
Argenti, P. and Druckenmiller, B. (2004). Reputation and the corporate brand. Corporate
Reputation Review, 6(4): 368-374.
Armstrong, M. and Taylor, S. (2014). Armstrong's handbook of human resource
management practice (13th ed.), UK, Kogan Page.
Armstrong, M. (2010). Armstrong’s handbook on strategic human resources management.
UK, Kogan Page.
Armstrong, M. (2009). Handbook of human resources management, UK, Kogan Page
208
Aryee, S., Walumbwa, F.O., Seidu, E.Y. and Otaye, L.E. (2016). Developing and leveraging
human capital resource to promote service quality: testing a theory of performance. Journal
of Management, 42(3): 480-499.
Asika, N. (2000). Research methodology in the behavioural science. Ikeja: Longman.
Awang, Z. (2012). A handbook on structural equation modeling, using AMOS graphic.
Kota Baharu: Universiti Teknologi Mara Kelantan.
Batt, R. and Banerjee, M. (2012). The scope and trajectory of strategic HR research:
evidence from American and British journals. International Journal of Human Resource
Management, 23(6): 1739–1762.
Becker, B.E., Huselid, M.A. and Beatty, R.W. (2009). The differentiated workforce.
Boston: Harvard Business Press.
Beer, M., Spector, B., Lawrence, P.R., Mills, D.Q. and Walton, R.E. (1984). Managing
human assets: The groundbreaking Harvard business school programme. New York: The
Free press.
Bernstein, D. (2004). Company image and reality: a critique of corporate communication.
London: Holt, Rinehart and Winston.
Bidin, R., Muhaimi, A. and Bolong, J. (2014). Strategizing corporate identity for the
perception of corporate image in the selected government-linked companies in Malaysia
social and behavioral sciences. 155:329
Bloemer, J. and Ruyter, K.D. (2008). On the relationship between store image, store
satisfaction and store loyalty. European Journal of Marketing, 32(5/6): 499-513.
Boxall, P. and Purcell, J. (2008). Strategy and human resources management. Basingstoke:
Palgrave Macmillan.
Brewster, C.J. and Mayrhofer, W. (2013). Handbook of research in comparative human
resource management. London: Edward Elgar Publishing.
Brewster, C.J., Brookes, M., Croucher, R. and Wood, G. (2014). Human resource
management and the institutional perspective. London: Routledge.
Breaugh, J.A. (2008). Employee recruitment current knowledge and important areas for
future research. Human Resource Management Review, 18(3): 103–118.
Bromley, D.B. (2003). Reputation, image and impression management. Corporate
Reputation Review, 1(9): 76-80.
Brown, B. and Perry, S. (2004). Removing the financial performance halo from fortune’s
most admired companies. Academy of Management Journal, 37(1): 1347–1359.
Bunzel, D.L. (2007). Universities sell their brands. Journal of Product and Brand
Management, 16(2): 152–153.

209
Burns, T. and Stalker, G.M. (1961). The management of innovation. London. Tavistock
Publications (reprinted Oxford: Oxford University Press, 1994).
Cairns, T.D. (2009). Talent management at homeland security: a corporate model suggests
a recipe for success. Employment Relations Today, 19-26.
Cetu, A. E. and Brodie, R.J. (2007). The influence of brand image and company reputation
where manufacturers market to small firms: a customer value perspective. Industrial
Marketing Management, 36(9): 230-240.
Chan, J., Beckman, S. and Lawrence, P. (2007). Workplace design: a new managerial
imperative. California Management Review, 49(2): 6-14.
Chan, S.C.H. and Mak, W. (2012). High performance human resource practices and
organisational performance: the mediating role of occupational safety and health. Journal
of Chinese Human Resource Management, 3(2): 136–150.
Cheese, P. (2010). Talent management for a new era: what we have learned from the
recession and what we need to focus on next. Human Resource Management International
Digest, 18(3): 3-5.
Chen, S.J., Lawler, J.J. and Bae, J. (2005). Convergence in human resource systems: a
comparison of locally owned and MNC subsidiaries in Taiwan. Human Resource
Management, 44(8): 237–256.
Chidi, O.C. (2014). Human capital selection practices and performance of unionised
organisations in the food, beverage and tobacco industry in Lagos State, Nigeria. Ife
Psychologia, 22(1): 105-129
Chuai, X. and Preece, D., and Iles, P. (2013). "Is talent management just ‘‘old wine in new
bottles’’? Emerald Group, Management Research News, 31(12): 901-911.
Chuang, C.H. and Liao, H. (2010). Strategic human resource management in service
context: taking care of business by taking care of employees and customers. Personnel
Psychology, 63(3): 153–196.
Chun, R. (2005). Corporate reputation: meaning and measurement. International Journal
of Management Reviews, 7(2): 91-109.
Chukwunonso, F. (2013). The development of human resource management from historical
perspective and its implications for the human resource manager, in strategic human
resource management at tertiary level, Malaysia, Rivers Publishers, 87-101.
CIPD, (2015). Resourcing and talent planning. retrieved from http://www.cipd.co.uk/hr-
resources/survey-reports/resourcing-talent-planning-2015.aspx.
Clarke, M. (2013). The organisational career: not dead but in need of redefinition. The
International Journal of Human Resource Management, 24(4): 684-703.

210
Clarke, V. and Braun, V. (2013). Teaching thematic analysis: overcoming challenges and
developing strategies for effective learning. The Psychologist, 26(2): 120-123.
Cool, Karel, Almeida Costa, Luis, Dierickx and Ingemar. (2002). Cited in Pettigrew, A.M,
Thomas, H., and Whittington, R. (Eds). Handbook of strategy and management, Sage
Publications.
Collings, D.G. and Mellahi, K. (2009). Strategic talent management: a review and research
agenda. Human Resource Management Review 19: 304-313.
Collins C.J. and Steven, C.K. (2001). Initial organisational images and recruitment: a
within subjects’ investigation of the factors affecting job choices. Corporate
communications: An International Journal, 6(4): 205– 216.
Collis, J. and Hussey, R. (2009). Business research third edition. Houndmills, Basingstoke,
Hampshire: Palgrave Macmillan.
Cooper, D. and Schinder, P. (2006). Business research methods (8th ed.). New York.
McGraw Hill,
Creswell, J.W. (2008). Educational research: planning, conducting, and evaluating
quantitative and qualitative research (3rd ed.). Upper Saddle River, NJ: Pearson
Education.
Creswell, J.W. (2003). Research design: qualitative, quantitative and mixed methods
approach (2nd ed.), Thousand Oaks, CA, SAGE Publications
Daymon, C. and Holloway, I. (2002). Qualitative research methods in public relations and
marketing communications. Routledge.
Devanna, M.A., Fombrun, C.J. and Tichy, N.M. (1981). Human resource management: a
strategic perspective. Organisational Dynamics, 9(3): 51–68.
Dhar, R.L. (2015). Effects of high performance human resource practices on service
innovative behavior. International Journal of Hospitality Management, 51(3): 67-75.
Dill, D.D. and Van-Vught, F.A. (2010). National innovation and the academic research
enterprise: public policy in global perspective. Baltimore: Johns Hopkins University Press.
Dimba, B.A., (2010). Strategic human resource management practices: effect on
performance. African Journal of Economic and Management Studies, 1(2): 128 – 137.
Donovan, J.J. (2001). Work motivation. In Anderson, N., Ones, D.S., Sinangil, H. K., and
Viswesvaran, C. (Eds.), handbook of industrial, work, and organizational psychology. 2:
53-76.
Dyer, J. (2005). Human resource management: evolving roles and responsibilities.
Washington DC: Bureau of National Affairs.
211
Ehnert, I., and Harry, W. (2012). Recent developments and future prospects on sustainable
human resource management: introduction to the special issue. Management Review, 23,
221–238.
Ekwoaba, J.O., Ikeije, U.U. and Ndubuisi, U. (2015). The impact of recruitment and
selection criteria on organisational performance. Global Journal of Human Resource
Management. 3(2): 22-33.
Elegbe, J.A, (2010). Talent management in the developing world. adopting a global
perspective: England. Grower Publishing Ltd.
Ermolina, L.V., Chechina, O.S. and Sultanov, A.V. (2016). Human resources as foundation
for innovational potential and strategic competitiveness of modern enterprises.
Mediterranean Journal of Social Sciences, 7(1): 274-278.
Faborode, M. (2016). Benchmarking the quality and relevance of higher education for
national development. Convocation lecture delivered at Covenant University, Ogun State,
Nigeria.
Fajana, S., Owoyemi, O., Elegbede, T. and Gbajumo-Sheriff, M. (2011). Human resource
management practices in Nigeria. Journal of Management and Strategy, 2(2): 57-62.
Fajana, S. (2009) Human resource management in Africa: the social and economic
framework. Personalfuhrung, 7(3): 80-86.
Farndale, E., Scullion, H. and Sparrow, P. (2010). The role of the corporate human resource
function in global talent management. Journal of World Business, 45(2): 161-168.
Fill, C. (2006). Simply marketing communications. Harlow: Prentice Hall.
Garavan, T.N., Carbery, R. and Rock, A. (2012). Mapping talent development: definition,
scope and architecture. European Journal of Training and Development, 31(1): 5-24.
Gathungu, J.J.W. and Karoki, A.W. (2010). Service branding: from developing service
brands to value creation in the hospitality and tourism industry in kenya. paper presented
at the international research symposium in service management. Republic of Mauritius.
Gamage, A.S. (2014). Recruitment and selection practices in manufacturing smes in japan:
an analysis of the link with business performance. Ruhuna Journal of Management and
Finance, 1(1): 37-52.
Gberevbie, D.E. (2006). Recruitment and quality academic staff selection: the case study
of Covenant University. Ife Psychologia, An International Journal, 14(2): 117-141.
Gberevbie, D.E (2008). Staff recruitment, retention strategies and performance of selected
public and private organisations in Nigeria. Ph.D Thesis, Covenant University, Ota.
Gberevbie, D.E. (2010). Strategies for employee recruitment, retention and performance:
dimension of the federal civil service of Nigeria. African Journal of Business Management,
4(8): 1447-1456.

212
Gilbart, C., DeWinne, S. and Sels, L. (2015). Strong human resource management process
and line managers’ effective HRM implementation: a balanced view. Human Resource
Management Journal, 25(4): 600-616.
Guest, D.E. (2011). Human resource management and performance: still searching for
some answers. Human Resource Management Journal, 21, 3–13.
Hanan, K. and John, H. (2013). Measuring the benefits of university research: impact and
the REF in the UK. Research Evaluation, 24(2): 41-52.
Harsh, S. (2011). Purposeful sampling in qualitative research synthesis. Qualitative
Research Journal, 11(2): 63 - 75
Harris, F. and De-Chernatony, L. (2001). Corporate branding and corporate brand
performance. European Journal of Marketing, 35(3/4): 441-456.
Harlay, B. (2015). The one best way? Scientific’ research on HRM and the treat to critical
scholarship. Human Resource Management Journal, 25(4): 399-407.
Harvey, G., Williams, K. and Probert, J. (2013). Greening the airline pilot: HRM and the
green performance of airlines in the UK. International Journal of Human Resource
Management, 24(4): 152–166.
Hauff, S., Alewell, D. and Hansen, N.K. (2014). HRM systems between control and
commitment: occurrence, characteristics and effects on HRM outcomes and firm
performance. Human Resource Management Journal, 24(4): 424–441.
Herr, P. (2001). Higher education institutional brand value in transition: Measurement and
management issues. Forum Futures, 1(3): 23–26.
Hsieh, A.T. and KaiLi, C. (2008). The moderating effect of brand image on public relations
perception and customer loyalty. Marketing Intelligence and Planning Journal. 26(1): 26-
42.
Hughes, J.C. and Rog, E. (2011). A strategy for improving employee recruitment, retention
and engagement within hospitality organisations: UK, Emerald Group Publishing.
Hussain, T. and Rehman, S.S., (2013). Do human resource management practices inspire
employees’ retention? Research Journal of Applied Sciences, Engineering and Technology,
6(19): 3625-3633.
Idogho, P.O. (2011). Higher education in Nigeria and the challenges ahead. European
Journal of Educational Studies, 3(2): 269-276.
Imhonopi, D. and Urim, U.M., (2013). Factors affecting scholarly research output in
Nigeria: perception of academics in South-Western Universities. Unilag Sociological
Review, 10, 24- 58.

213
Ishak, M.I., Suhaida, M.S. and Yuzainee, M.Y., (2009). Performance measurement
indicators for academic staff in Malaysia private higher education. Institutions performance
measurement association conference, University of Otago, New Zealand.
Ishrat, G. and Habib, J. (2012). Impact of HR audit on an educational institute in order to
gain insight into the present scenario and future prospects so that it can set a benchmark for
educational sector, Journal of Business and Management, 6(2): 1-8.
Jackson, S.E. and Seo, J. (2010). The greening of strategic HRM scholarship in
Organisation. Management Journal, 7(2): 278–290.
Jain, A. (2015). Learning by hiring and change to organisational knowledge: countering
obsolescence as organisations age. Strategic Management Journal, 37(8): 1667-1687.
Jarvis, P. (2001). Universities and corporate universities: The higher learning industry in
global society. London: Kogan Page.
Johnson, G. and Scholes, K. (1999). Exploring corporate strategy (5th ed.), Prentice Hall
Harlow, UK.
Johnson, G., Whittington, R., Scholes, K., Angwin, D. and Regner, P., (2015).
Fundamentals of strategy (3rd ed.), UK, Prentice Hall.
Kandampully, J. and Hu, H.H., (2007). Do hoteliers need to manage image to retain loyal
customers? International Journal of Contemporary Hospitality Management, 19(6): 435 –
443.
Kanyemba, M., Iwu, C.G., and Allen-Ile, C.O. (2015). Impact of recruitment and selection
on organisational productivity. evidence from staff of a university in South Africa.
Corporate Ownership and Control, 12(2): 177-185.
Karemu, G., Gikera, K. and Josee, V.M. (2014). An analysis of the effect of employee
recruitment strategies on employee retention at Equity Bank, Kenya. European Journal of
Business and Management, 6(17): 88-92.
Katua, T., Mukulu, E. and Gachunga, H. (2014). Effect of employee resourcing strategies
on the performance of commercial banks in Kenya. International Journal of Education and
Research, 2(1): 1-20.
Karikari, A.F, Boateng, P.A. and Ocansey, E.D. (2015). The role of human resource
information system in the process of manpower activities. American Journal of Industrial
and Business Management, 5(3): 424-431.
Kase, R. and Batistic, S. (2012). Exploring the landscape of human resource management
and firm performance debate domains: a co-citation analysis. Presented at the annual
conference of the academy of management, Boston, MA.
Kaufman, B.E. (2012). Strategic human resource management research in the United
States: a failing grade after 30 years? Academy of Management Perspectives, 26(5): 12–
36.
214
Kavoo-Linge, T. and Kiruri, J. (2013). The effect of placement practices on employee
performance in small service firms in the information technology sector in Kenya.
International Journal of Business and Social Science, 4(15): 213-219.
Kazeem, K. and Ige, O. (2010). Redressing the growing concern of the education sector in
Nigeria. Edo Journal of Counselling, 3(1): 40-49.
Kemboi1, A. and Onyango, P. (2015). Effects of employee resourcing and development
practices on organisation performance in public secondary schools in Rachuonyo south sub
country. International Journal of Business and Social Research. 5(7): 51-60.
Kepha, O., Mukulu, E. and Waititu, G. A. (2014). The influence of recruitment and
selection on the performance of employees in research institutes in Kenya. International
Journal of Science and Research, 3(5): 132-138.
Keupp, M.M., Palmie, M. and Gassmann, O. (2012). The strategic management of
innovation: a systematic review and paths for future research. International Journal of
Management Reviews, 14(7): 367–390.
Kibui, A.W, Gachunga, H. and Namusonge, G.S. (2014). Role of talent management on
employees’ retention in kenya: a survey of state corporations in Kenya: Empirical Review.
International Journal of Science and Research, 3(2): 414-424.
Lamba, S., and Choudhary, N. (2013). Impact of human resource management practices on
organisational commitment of employees. International Journal of Advancements in
Research and Technology, 2(4): 407-423.
Legge, K. (2005). Human resource management rhetoric and realities. London: Palgrave
Macmillan.
Lines, V.L. (2004). Corporate reputation in Asia: looking beyond bottom-line performance.
Journal of Communication Management, 8(3): 233-245.
Li, Y., Zhang, G., Yang, X. and Li, J. (2015). The influence of collectivist human resource
management practices on team-level identification. International Journal of Human
Resource Management, 26(14): 1791-1806.
Lockwood, N.R. (2006). Talent management: driver for organisational successes. Research
Quarterly, Society for Human Resource Management, 24(5): 93-102.
Lathans, J.D. and Summer, K.E. (2005). Loosely coupled systems: a reconceptualisation.
Academy of Management Review, 15: 203-223.
MacDuffie, J.P. (2005). Human resource bundles and manufacturing performance.
Industrial Relations Review, 48(2): 199-221.
MacMillan, K., Money, K., Downing, S. and Hillenbrand, C. (2005). Reputation in
relationships: Measuring experiences, emotions and behaviors. Corporate Reputation
Review, 8(2): 214–232.
215
Md, M.U. (2010). Systematic approach of conducting employee selection interview.
International Journal of Business and Management, 5(6): 106-112.
Maina, D.K. and Kwasira, J. (2015). Role of human resource planning practices on
employee performance in kenya. International Journal of Economics, Commerce and
Management. 3(5): 1569-1580.
Manafi, M., Subramaniam, I.D. (2015). Balancing performance by human resource
management practices. Asian Social Science, 11(10): 386-400.
Marchington, M. and Wilkinson, A. (2008). Human resource management at work: people
management and development (4th ed.), Harlow: Pearson Education.
Marken, G.A. (2002). One-minute corporate reputation management. Public Relations
Quarterly, 47(4): 21-23.
Maliku, M.K., (2014). The perceived relationship between employee retention and
organisational performance at national oil corporation of Kenya. Dissertation, University
of Nairobi.
Melewar, T.C. and Akel, S. (2005). The role of corporate identity in the higher education
sector. Corporate Communications: An International Journal, 10(1): 41–57.
Mendez, S. and Stander, A. (2011). Positive organisation: the role of leader behaviour in
work engagement and retention. South African Journal of Industrial Psychology, (37)1:
23-32.
Minchington, B. (2010). The employer brand manager’s handbook: Torrensville:
Collective Learning.
Miles, R. and Snow, C. (1978). Organisational strategy, structure and process. New York,
McGraw-Hill.
Moogan, Y. (2010). Can a higher education institution’s marketing strategy improve the
student-institution match? Kaplan Business School Journal, 25(2): 570–589.
Moore, R.M. (2004). The rising tide: branding and the academic marketing place. Change,
36(3): 56–61.
Morton, L. (2005). Talent management value imperatives: strategies for execution. New
York: The Conference Board.
Mowday, R., Steers, R. and Porter L. (1979). The measure of organizational commitment.
Journal of Vocational Behaviour. 14(2): 224-227.
Naris, S. and Ukpere, W.I. (2010). Developing a retention strategy for qualified staff at the
Polytechnic of Namibia. Business Papers and Reports. No. 26.
216
Neal, A., West, M.A. and Patterson, M.G. (2005). Do organisational climate and
competitive strategy moderate the relationship between human resource management and
productivity? Journal of Management, 31(4): 492-512.
Ngui, T.K, Elegwa M. and Gachunga, H.G. (2014). Effects of employee resourcing
strategies on the performance of commercial banks in Kenya. International Journal of
Education and Research, 2(1): 1-20.
Nirmala, N. and Sumangala, C. (2015). Hierarchical analysis of employee retention
strategies among manufacturing and it firms: A Comparative Study. International Journal
of Application or Innovation in Engineering and Management. 4(8): 147-152.
National Universities Commission, (2015). National Universities Commission prospectus.
OECD (2012), Assessment of higher education learning outcomes: feasibility study for an
assessment of higher education learning outcomes, Paris, OECD.
Ogunyomi, P. and Bruning, N.S. (2015). Human resource management and organisational
performance of small and medium enterprises in Nigeria. International Journal of Human
Resource Management, 27(6): 612-634.
Okebukola, P.A.O. (2010). The future of university education in Nigeria. Lagos:
Okebukola Science Foundation.
Okebukola, P.A.O. (2008). Education reform: imperatives for achieving vision 202020.
Paper presented at the national summit on education organised by senate committee on
education, held at Sheraton Hotel. Abuja.
Okiki, O.C. (2013). Availability of information resources for research output: perception
of academic staff members in Nigerian federal universities. International Journal of
Computer Science and Telecommunications, 4(8): 26 – 33.
Ombui, K., Elegwa, M., Gichuhi, A. and Waititu, A. (2014). The influence of recruitment
and selection on the performance of employees in research institutes in Kenya.
International Journal of Science and Research, 3(5): 132-138.
Omondi, G.O., Magutu, P.O., Onsongo, C.O. and Abong’o, L.A. (2011). The adoption of
strategic human resource management practices in commercial banks: the process and
challenges in Kenya. Journal of Human Resources Management Research, 20(11): 1-19.
Olins, W. (2014). Corporate identity: making business strategy visible through design.
Harvard business school press.
Ogunyomi, P.O. and Ojikutu, R.K. (2014) Employee resourcing and organisational
performance of small and medium enterprises in Lagos State, Nigeria.
Oyetunde, M.O. and Ayeni, O.O. (2014). Exploring factors influencing recruitment and
retention of nurses in Lagos state, Nigeria within year 2008 and 2012. Open Journal of
Nursing, 4(8): 1-12.
217
Paden, N. and Stell, R. (2006). Branding options for distance learning programs: managing
the effect on university image. International Journal of Instructional Technology and
Distance Learning, 3(8): 45-54.
Pedro, N., and Robert, E. (2012). Management communication and employee performance:
the contribution of perceived organisational support. Human Performance, 25(5): 452-464.
Pfeffer, J. (2001). Fighting the war for talent is hazardous for your organisation. Stanford:
Pearson Education.
Pienaar, C., and Bester, C.L. (2008). The retention of academics in the early career phase:
empirical research. South Africa Journal of Human Resource Management, 6(2): 32–41.
Polat, S., (2011). The relationship between university students’ academic achievement and
perceived organisational image. Educational Sciences: Theory and Practice, 11(11): 257-
262.
Porter, M. (1985). Competitive advantage. Free Press, New York.
Presbitero, A., Roxas, B. and Chadee, D. (2015). Looking beyond HRM practices in
enhancing employee retention in bpos: focus on employee organisation value fit.
International Journal of Human Resource Management, 27(6): 635-652.
Prinsloo, K. (2008). Managing people for competitive advantage. master’s curriculum in
leadership, performance and change. Johannesburg: University of Johannesburg.
Purcell, J. and Hutchinson, S. (2007). Frontline managers as agents in the HRM-
performance causal chain: theory analysis and evidence. Human Resource Management
Journal, 17(1): 3-20.
Richard, S.W., Audrey, B.S. and Scott E., (2011). Nine best practices for effective talent
management. development dimensions international. White paper available online at
http://www.ddiworld.com.
Riccio, S.J. (2010). Talent management in higher education: developing emerging leaders
within the administration at private colleges and universities. Ph.D. Thesis, University of
Nebraska, Lincoln.
Roberts, P.; Dowling, W. and Graham, R. (2007). Corporate reputation and sustained
superior financial performance. Strategic Management Journal, 23(11): 1077 – 1093.
Rosenthal, G. (2003). A name by any other name: responding to increasing role of
marketing in higher education. Doctoral thesis, University of Pennsylvania.
Rudhumbu. N., Chikari. G.; Svotwa. D. and Lukusa. J.P. (2014). Use of employer branding
as a tool for attracting and retaining talent: evidence from private higher education
institutions. Botswana Journal of Education and Practice, 4(4): 45-52.
Ryan, A.M. and Ployhart, R.E. (2014). A century of selection. Annual Review of
Psychology, 65, 693–717.
218
Satope, B.F. (2014). Human resource planning in the Nigerian universities. Computing,
Information Systems, Development Informatics and Allied Research Journal, 5(4): 1-12.
Sani, A.D (2012). Strategic human resource management and organisational performance
in the Nigerian insurance industry: the impact of organisational climate. Business
Intelligence Journal, 5(1): 8-20.
Sarstedt, M.; Wilczynski, P. and Melewar, T.C., (2012). Measuring reputation in global
markets: a comparison of reputation measures’ convergent and criterion validities. Journal
of World Business, 2(3):1-11.
Schuler, M. (2004). Management of the organisational image: a method for organisational
image configuration. Corporate Reputation Review, 7(1): 37–53.
Schuler, R.S., Jackson, S.E. and Tarique, I. (2011). Global talent management and global
talent challenges: strategic opportunities for international human resource management.
Journal of World Business, 46(4):506-516.
Scullion, H. and Collings, D.G. (2010). Global talent management. Journal of World
Business, 45(1): 105-108.
Smaiziene, I. and Jucevicius R. (2013). Structural composition of corporate reputation
portfolio: sustainable development perspective. International Journal of Business and
Management, 8(1): 107-113.
Song, M., Zhao, Y.L., Arend, R.J. and Im, S. (2015). Strategic planning as a complex and
enabling managerial tool. Strategic Management Journal, 37(8): 1455-1464.
Sondoh, S.L., Omar, M.W., Wahid, N.A., Ismail, I. and Harun, A. (2007). The effect of
brand image on overall satisfaction and loyalty intention in the context of color cosmetic.
Asian Academy of Management Journal, 12(1): 83–107.
Startup, R, Gruenberg, M.M. and Tapfield, P., (1975). The satisfaction of university staff
with their teaching. Research in Education, 13(3): 57-66.
Storey, J. (2007). Human resource management: a critical text (3rd ed.), London, Thomson.
Tabachnick, B.G. and Fidell, L.S. (2007). Using multivariate statistics (5th ed.), New York,
Allyn and Bacon.
Tarique, I. and Schuler, R. (2010). Global talent management: literature review, integrative
framework, and suggestions for further research. Journal of World Business, 45(2): 122-
133.
Tettey, J.W. (2009). Deficits in academic staff capacity in Africa and challenges of
developing and retaining the next generation of academics. Partnership for Higher
Education in Africa.
219
Tong, L. (2015). Nestle employee recruitment research. International Journal of Business
and Social Science, 6(4): 97-113.
Tichaona, M. (2014). Effectiveness of staff retention strategies in Zimbabwe’s public and
private universities: Returnee lecturers’ perspective. International Journal of Public
Administration and Policy Research, 1(1): 008-020.
Ugheoke, S.O., Isa, M.F., and MohdNoor, W.S. (2015). Antecedents of strategic human
resource management practices on intangible firm performance, analytical investigation of
SMES. Asian Social Science, 11(13): 33-44.
Vaiman, V., Scullion, H. and Collings, D. (2012). Talent management decision making.
Management Decision, 50(5): 925-941.
Vander M.W. Basson, J.S. and Coetzee, M. (2009). Nonfinancial recognition: exploring
employees’ preferences in a south African information technology organisation. South
African Journal of Labour Relations, 33(2): 75-98.
Venkateswaran, N., (2012). Strategies for adopting talent management issues in software
companies. International Journal of Management, Economics and Social Sciences, 1(2):
33 – 41.
Vikram, J. and Sayeeduzzafar, R. (2014). A study of HRM practices and its impact on
employees’ job satisfaction in private sector banks: a case study of HDFC bank.
International Journal of Advance Research in Computer Science and Management Studies,
2(1): 70-75.
Walker, J.W. (1980). Human resource planning. New York, McGraw-Hill.
Waiganjo, E.W, Mukulu, E. and Kahiri, J. (2012). Relationship between strategic human
resource management and firm performance of Kenya’s corporate organisations.
International Journal of Humanities and Social Science, 2(10): 62-70.
Wang, X. (2010). Performance measurement in universities; managerial perspectives.
Thesis, University of Twente, Netherlands.
Weiwei, T., (2007). Impact of corporate image and corporate reputation on customer
loyalty: a review. Management Science and Engineering, 1(2): 57-62.
Wenger, E. (2006). Communities of practice a brief introduction. Wenger, Etienne.
Whelan, E., Collings, D.G. and Donnellan, B. (2010). Talent management in knowledge
intensive settings. Journal of Knowledge Management, 14(1): 486-504.
Williams, C., (2007). Research methods. Journal of Business and Economic Research,
5(3): 65-72.
Worcester, R.M. (1997). Managing the image of your bank: the glue that binds.
International Journal of Bank Marketing, 15(5): 146-152.

220
Wright, P., Gardner, T., Moynihan, L. and Allen, M. (2005). The relationship between HR
practices and firm performance: examining causal order. Personnel Psychology Journal,
58(2): 409-446.
Wright, P.M. and Snell, S.A. (2005). Partner or guardian? HR challenge in balancing value
and values. Human Resource Management, 44(2): 177–182.
Xu, J., Gong, Y. and Liu, Z. (2008). Study of corporate reputation’s impact on customer
loyalty. Foreign Economics and Management, 13(7): 44-50.
Yadav, R.K. and Dabhade, N. (2014). Human resource planning and audit – a case study
of HEG limited. International Letters of Social and Humanistic Sciences, 5(1): 44-62.
Yousuf, M.I., Imran, M., Sarwar, A.N. and Ranjha, M. (2011). A study of non-cognitive
variables of academic achievement at higher education: nominal group study. Asian Social
Science, 7(7): 53-58.
Zhang, Y. (2009), A study of corporate reputation’s influence on customer loyalty based
on PLS-SEM model. International Business Research, 2(3): 28-36.
Zheng, A.Y. and Kleiner, B.H., (2001). Developments concerning career development and
transition. Journal of Management Research, 24(3): 33-39.
Zhou, Y. and Volkwein, J. (2004). Examining the influences on faculty departure
intentions: a comparison of tenured versus non-tenured faculty at research universities.
Research in Higher Education, 45(2): 139-176.

221
APPENDIX ONE
RESEARCH QUESTIONNAIRE
Department of Business Management
Covenant University
Ota. Ogun State
January 14, 2016.
Dear Respondent,
I am a Ph.D. student of Covenant University conducting a research in Industrial Relations
and Human Resource Management field. Topic “Employee Resourcing Strategies:
Implications for Job Performance and Perceived Corporate Image in Selected Nigerian
Private Universities”. The research is primarily for academic purpose and all responses
shall be treated with utmost confidentiality. I therefore solicit your co-operation by your
honest response to these questions.
Thank you.
Yours faithfully,
Falola Hezekiah O
SECTION A: RESPONDENT BIO DATA
Instruction: Please mark (√) as appropriate in the boxes provided as required.
1. SEX: Male [ ] Female [ ]
2. AGE: 18 – 30 [ ] 31 – 40 [ ] 41 – 50 [ ] 51 and above [ ]
3. MARITAL STATUS: Single [ ] Married [ ] Others [ ]
4. CURRENT RANK/ LEVEL IN THE UNIVERSITY:
Prof. [ ] Associate Prof. [ ] Snr. Lecturer [ ] Lecturer I [ ]
Lecturer II [ ] Asst. Lecturer [ ] Graduate Asst. [ ]
5. CURRENT ADMINISTRATIVE POSITION: (e.g Registrar, Dean, HOD,
etc.)______________
6. WORK EXPERIENCE:
1-10years [ ] 11-20years [ ] 21years and above [ ]
7. Please state your current University: ____________________________________

222
SECTION B
Please tick the appropriate option where SA- Strongly Agree, A- Agree, U-
Undecided, D- Disagree, SD- Strongly Disagree
Recruitment Strategy and University’s Research Image
S/N VIEW SA A U D SD
1 My University recruits some Lecturers for research and
publications only
2 Academic staff are sourced from academic networks
such as researchgate, academia.edu, linkedin etc.
3 My University engages adjuncts/visiting Lecturers for
research publications
4 The main source of recruitment is done via internal
advert
5 My University is known for scholarly research outputs
6 Most of the Lecturers have published articles in top
ranked journal outlets
7 My University has won several international grants and
research awards
Employee Selection Strategy and Corporate Reputation
S/N VIEW SA A U D SD
8 When vacancies occur, existing employees are usually
considered via appointment route
9 My University gives priority to article publications
indexed in ISI, Scopus and School-Based for selection
10 Google scholar citations is considered as one of the
criteria for selection
11 My University is fully accredited by National
Universities Commission
12 My University engages academic staff from outside the
country
Human Resource Planning Strategies and University’s Brand Image
S/N STATEMENT SA A U D SD

223
13 Gap analysis is regularly carried out to identify if there
is need for more senior academic staff.
14 There are plans on how to ensure that the staff mix by
rank in my department meets the minimum requirement
of 20:35:45 for Professors: Snr. Lecturers: Lecturer I
and below, respectively
15 Adequate plan is put in place to ensure that the staff-
students ratio in my department meets minimum NUC
benchmark
16 The teaching facilities in my University have enhanced
the teaching quality
17 The University’s environment is conducive for learning
18 My University provides good services that are widely
perceived as unique
Instruction: Please mark as appropriate the point that represent retention strategies of
your University.
Reward System
Poor
1-20%
Below
Ave
21-40%
Ave.
41-59%
Good
60-79%
Excellent
80-100%
19 Salary package
20 Retirement Benefits
21 Allowances
Staff Development:
22 Career Progression
23 Training & Conference Supports
24 Research/ Publication Grants
25 Regular Promotion
Workplace Climate
26 Modern Teaching Facilities

224
27 Modern Research Aids
28 Subsidised Staff Quarters
29 Job Security
30 University’s Image
31 Conducive Environment
Staff welfare:
32 Subsidised Medical Services
33 Subsidised Sch. Fees for Staff
Children
34 Loan Facilities
35 Work life Balance
University’s Corporate Identity
S/N STATEMENT SA A U D SD
36 My University has a very unique culture
37 My University has a brand that I can recognise easily
Job Performance
0-2 3-4 5-6 7-8 9-Above
38 The average number of my publications per
year
39 Number of courses taken per semester
40 Number of my supervisee(s) (Undergraduate
and Postgraduate) in this session
41 Average number of committee(s) I belong to in
my University
42 Average number of papers I reviewed in a
session
43 Number of community service involved in the
last one year
225
SECTION C.
44. Please mention other recruitment and retention strategies of your University
i. ________________________________________
ii. ________________________________________
iii. ________________________________________
iv. ______________________________________
v. ______________________________________
45. What are the retention strategies you think the management of your University
should put in place?
vi. ______________________________________
vii. _______________________________________
viii. ________________________________________
ix. ________________________________________
x. ________________________________________
46. State other measures put in place by your University to ensure high performance
of academic staff.
i. _________________________________________
ii. _________________________________________
iii. _________________________________________
iv. ________________________________________
v. _________________________________________
226
APPENDIX TWO
A Guide for In-depth Interview
1. What is the name of your University?
2. How old are you? If you don’t mind
3. What is the highest degree you have completed?
4. What is your marital status?
5. What is your current position in this University?
6. What are the human resource planning strategies put in place by your University?
7. What are the recruitment and selection strategies put in place by the Universities
to attract competent academic staff?
8. What are the retention challenges faced by your University? What strategies are
you using to retention your competent staff?
9. What are the measures put in place by your University to ensure optimal
performance of the staff?
10. Of what significance is the image of your University? How would you describe
the University’s corporate image?
Thank you.
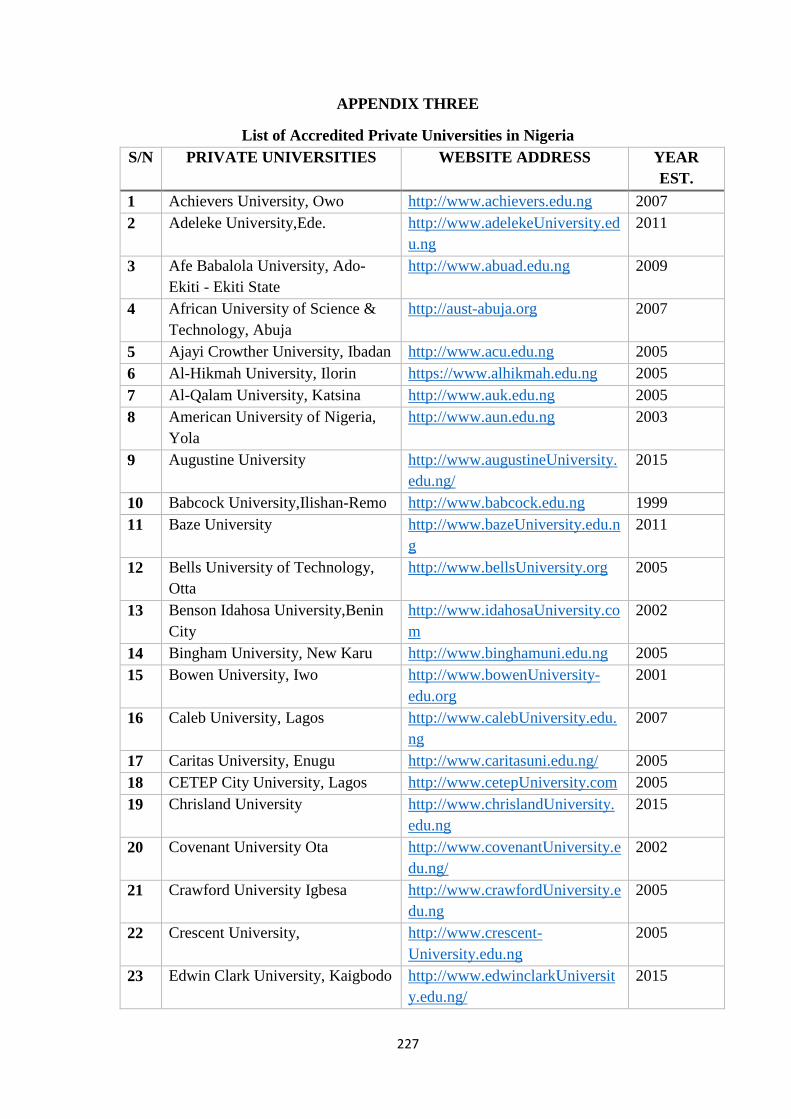
227
APPENDIX THREE
List of Accredited Private Universities in Nigeria
S/N PRIVATE UNIVERSITIES WEBSITE ADDRESS YEAR
EST.
1 Achievers University, Owo http://www.achievers.edu.ng 2007
2 Adeleke University,Ede. http://www.adelekeUniversity.ed
u.ng
2011
3 Afe Babalola University, Ado-
Ekiti - Ekiti State
http://www.abuad.edu.ng 2009
4 African University of Science &
Technology, Abuja
http://aust-abuja.org 2007
5 Ajayi Crowther University, Ibadan http://www.acu.edu.ng 2005
6 Al-Hikmah University, Ilorin https://www.alhikmah.edu.ng 2005
7 Al-Qalam University, Katsina http://www.auk.edu.ng 2005
8 American University of Nigeria,
Yola
http://www.aun.edu.ng 2003
9 Augustine University http://www.augustineUniversity.
edu.ng/
2015
10 Babcock University,Ilishan-Remo http://www.babcock.edu.ng 1999
11 Baze University http://www.bazeUniversity.edu.n
g
2011
12 Bells University of Technology,
Otta
http://www.bellsUniversity.org 2005
13 Benson Idahosa University,Benin
City
http://www.idahosaUniversity.co
m
2002
14 Bingham University, New Karu http://www.binghamuni.edu.ng 2005
15 Bowen University, Iwo http://www.bowenUniversity-
edu.org
2001
16 Caleb University, Lagos http://www.calebUniversity.edu.
ng
2007
17 Caritas University, Enugu http://www.caritasuni.edu.ng/ 2005
18 CETEP City University, Lagos http://www.cetepUniversity.com 2005
19 Chrisland University http://www.chrislandUniversity.
edu.ng
2015
20 Covenant University Ota http://www.covenantUniversity.e
du.ng/
2002
21 Crawford University Igbesa http://www.crawfordUniversity.e
du.ng
2005
22 Crescent University, http://www.crescent-
University.edu.ng
2005
23 Edwin Clark University, Kaigbodo http://www.edwinclarkUniversit
y.edu.ng/
2015

228
24 Elizade University, Ilara-Mokin http://www.elizadeUniversity.ed
u.ng
2012
25 Evangel University, Akaeze http://www.evangeluniv.edu.ng 2012
26 Fountain Unveristy,Oshogbo http://www.fountainUniversity.e
du.ng
2007
27 Godfrey Okoye University,
Ugwuomu-Nike - Enugu State
http://www.gouni.edu.ng 2009
28 Gregory University, Uturu http://www.gregoryUniversity.co
m
2012
29 Hallmark University http://www.hallmark.edu.ng 2015
30 Hezekiah University, Umudi http://hezekiah.edu.ng/ 2015
31 Igbinedion University Okada http://www.iuokada.edu.ng 1999
32 Joseph Ayo Babalola University,
Ikeji-Arakeji
http://www.jabu.edu.ng 2006
33 Kings University http://www.kingsUniversity.edu.
ng/
2015
34 Kwararafa University, Wukari http://www.wukarijubileeUniver
sity.org
2005
35 Landmark University,Omu-Aran. http://www.lmu.edu.ng 2011
36 Lead City University, Ibadan http://www.lcu.edu.ng 2005
37 Madonna University, Okija http://www.madonnaUniversity.
edu.ng
1999
38 Mcpherson University, Seriki
Sotayo, Ajebo
http://www.mcu.edu.ng 2012
39 Micheal & Cecilia University http://mciu.edu.ng/ 2015
40 Mountain Top University http://www.mountaintopUniversi
ty.org/
2015
41 Nigerian-Turkish Nile University,
Abuja
http://www.ntnu.edu.ng 2009
42 Novena University, Ogume http://www.novenaUniversity.ed
u.ng
2005
43 Obong University, Obong Ntak http://www.obongUniversity.net 2007
44 Oduduwa University, Ipetumodu -
Osun State
http://www.oduduwaUniversity.
edu.ng
2009
45 Pan-Atlantic University, Lagos http://www.pau.edu.ng 2002
46 Paul University, Awka - Anambra
State
http://www.paulUniversity.edu.n
g
2009
47 Redeemer's University, Mowe http://www.run.edu.ng 2005
48 Renaissance University,Enugu http://www.renaissanceUniversit
yng.com
2005
49 Rhema University, Obeama-Asa -
Rivers State
http://www.rhemaUniversity.edu
.ng
2009

229
50 Ritman University http://www.ritmanUniversity.edu
.ng
2015
51 Salem University,Lokoja http://www.salemUniversity.org 2007
52 Samuel Adegboyega
University,Ogwa.
http://www.sau.edu.ng 2011
53 Southwestern University, Oku
Owa
http://www.southwesternUnivers
ity.edu.ng
2012
54 Summit University 2015
55 Tansian University,Umunya http://www.tansian-edu.com 2007
56 University of Mkar, Mkar http://www.unimkar.edu.ng 2005
57 Veritas University http://www.veritas.edu.ng 2007
58 Wellspring University,
Evbuobanosa - Edo State
http://www.wellspringUniversity
.net
2009
59 Wesley Univ. of Science &
Tech.,Ondo
http://www.wusto.edu.ng 2007
60 Western Delta University, Oghara
Delta State
http://wdu.edu.ng 2007
61 Christopher University Mowe http://www.christopherUniversit
y.edu.ng/
2015
Source: NUC Official Website Accessed April 2016


![Untitled-1 [eprints.covenantuniversity.edu.ng]eprints.covenantuniversity.edu.ng/13046/3/2008.pdfDavid O. Oyedepo ChancellOr, Covenant University The Chainnan. Alanavnwnt esrremfhearrtry](https://static.fdocuments.in/doc/165x107/5e6b66d85b717f75171bc9f4/untitled-1-david-o-oyedepo-chancellor-covenant-university-the-chainnan-alanavnwnt.jpg)