April 2019 - Wheat Ridge, CO
50
April 2019
Transcript of April 2019 - Wheat Ridge, CO
April 2019
WADSWORTH BOULEVARD WIDENING 35th Avenue to Interstate 70
AIR QUALITY TECHNICAL REPORT
Prepared for:
April 2019
35th Avenue to In ters ta te 70
AIR QUALITY TECHNICAL REPORT April 2019
ENVIRONMENTAL ASSESSMENT Acronyms and Abbreviations I
Acronyms and Abbreviations ADA Americans with Disabilities Act
APCD Air Pollution Control Division
CAA Clean Air Act
CDOT Colorado Department of Transportation
CEQ Council on Environmental Quality
CFR Code of Federal Regulations
CO carbon monoxide
DRCOG Denver Regional Council of Governments
EA Environmental Assessment
EPA Environmental Protection Agency
FHWA Federal Highway Administration
FTA Federal Transit Administration
GHG greenhouse gases
I-70 Interstate 70
LOS level of service
MOVES Motor Vehicle Emissions Simulator
MSAT mobile source air toxics
NAAQS National Ambient Air Quality Standards
NO2 nitrogen dioxide
NEPA National Environmental Policy Act
O3 ozone
Pb lead
PEL Planning and Environmental Linkages
PM2.5 particulate matter smaller than 2.5 microns in diameter
PM10 particulate matter smaller than 10 microns in diameter
ppb parts per billion
RTD Regional Transportation District
RTP Regional Transportation Plan
SH State Highway
SIP State Implementation Plan
SO2 sulfur dioxide
USDOT United States Department of Transportation
VMT vehicle miles traveled
35th Avenue to In ters ta te 70
AIR QUALITY TECHNICAL REPORT April 2019
ENVIRONMENTAL ASSESSMENT Table of Contents i
Contents Page No.
1.0 Introduction ........................................................................................................................................... 1
2.0 Background ........................................................................................................................................... 1 2.1 PEL Study .......................................................................................................................................... 1 2.2 Environmental Assessment ............................................................................................................... 2
3.0 Description of Alternatives .................................................................................................................... 3 3.1 No-Action Alternative ......................................................................................................................... 3 3.2 Proposed Action ................................................................................................................................ 3
3.2.1 Typical Sections .......................................................................................................................... 5 3.2.2 Access Management ................................................................................................................... 5 3.2.3 Intersections ................................................................................................................................ 6 3.2.4 Multimodal Facilities .................................................................................................................... 9 3.2.5 Structures .................................................................................................................................... 9 3.2.6 Drainage Structures .................................................................................................................. 10
4.0 Affected Environment and Regulatory Framework ............................................................................. 10 4.1 Current Air Quality Standards and Guidelines................................................................................. 10 4.2 Regulatory Setting ........................................................................................................................... 11
4.2.1 Conformity Rules ....................................................................................................................... 12 4.2.2 State Implementation Plan ........................................................................................................ 13 4.2.3 Existing Air Quality and Climate ................................................................................................ 13 4.2.4 Pollutants of Concern ................................................................................................................ 14
5.0 Environmental Consequences ............................................................................................................ 15 5.1 Microscale CO Analysis ................................................................................................................... 15 5.2 Particulate Matter Screening ........................................................................................................... 17 5.3 MSAT Analysis ................................................................................................................................ 18 5.4 GHG Analysis .................................................................................................................................. 20 5.5 Construction Impacts ....................................................................................................................... 22 5.6 Cumulative Impacts ......................................................................................................................... 22
6.0 Mitigation ............................................................................................................................................. 23 6.1 Criteria and MSAT Emissions Mitigation ......................................................................................... 23 6.2 Global GHG Emissions Mitigation ................................................................................................... 23 6.3 Construction Emissions Mitigation ................................................................................................... 25 6.4 Mitigation Summary ......................................................................................................................... 25
7.0 References .......................................................................................................................................... 27
Appendix
Appendix A. CO Hot-Spot Analysis—Technical Backup
35th Avenue to In ters ta te 70
AIR QUALITY TECHNICAL REPORT April 2019
ENVIRONMENTAL ASSESSMENT Table of Contents ii
Figures
Figure 1. Regional Location Map of the City of Wheat Ridge, Colorado ..................................................... 1
Figure 2. Environmental Assessment Study Area ....................................................................................... 2
Figure 3. Proposed Action Typical Features ................................................................................................ 4
Figure 4. Proposed Action Typical Section .................................................................................................. 5
Figure 5. Displaced Left-turn Movements at a Continuous Flow Intersection ............................................. 6
Figure 6. Eight Proposed Retaining Wall Locations and Water Quality Pond ............................................. 9
Figure 7. Wind Rose for Broomfield ........................................................................................................... 13
Figure 8. National MSAT Emission Trends 2010-2050 for Vehicles Operating on Roadways Using EPA's MOVES2014a Model ....................................................................................................... 19
Tables
Table 1. Existing and Proposed Intersection and Pedestrian Crossing Features ...................................... 7
Table 2. NAAQS Criteria Pollutants .......................................................................................................... 10
Table 3. Representative Ambient Air Quality Data (2015-2017) .............................................................. 14
Table 4. Modeled CO Concentrations vs. NAAQS ................................................................................... 17
Table 5. Colorado Highway CO2 Emissions vs Global CO2 Emissions .................................................... 21
Table 6. Summary of Impacts and Mitigation ........................................................................................... 26
35th Avenue to In ters ta te 70
AIR QUALITY TECHNICAL REPORT April 2019
ENVIRONMENTAL ASSESSMENT Page 1
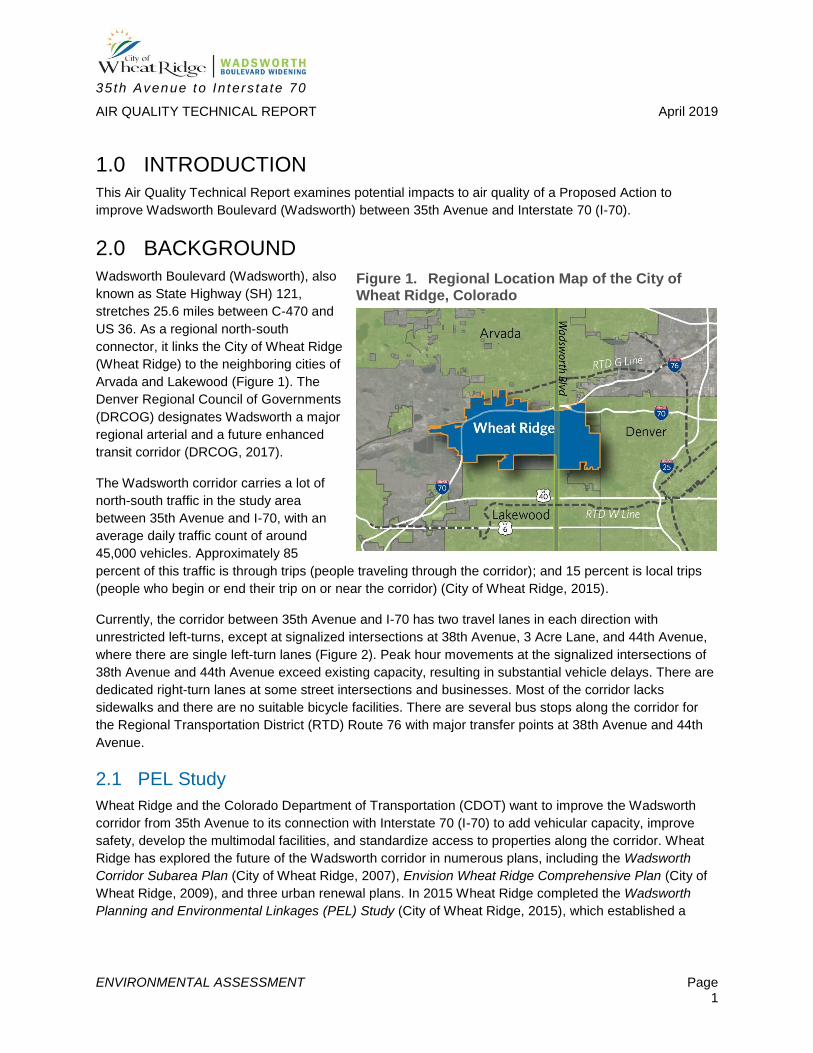
1.0 INTRODUCTION
This Air Quality Technical Report examines potential impacts to air quality of a Proposed Action to
improve Wadsworth Boulevard (Wadsworth) between 35th Avenue and Interstate 70 (I-70).
2.0 BACKGROUND
Wadsworth Boulevard (Wadsworth), also
known as State Highway (SH) 121,
stretches 25.6 miles between C-470 and
US 36. As a regional north-south
connector, it links the City of Wheat Ridge
(Wheat Ridge) to the neighboring cities of
Arvada and Lakewood (Figure 1). The
Denver Regional Council of Governments
(DRCOG) designates Wadsworth a major
regional arterial and a future enhanced
transit corridor (DRCOG, 2017).
The Wadsworth corridor carries a lot of
north-south traffic in the study area
between 35th Avenue and I-70, with an
average daily traffic count of around
45,000 vehicles. Approximately 85
percent of this traffic is through trips (people traveling through the corridor); and 15 percent is local trips
(people who begin or end their trip on or near the corridor) (City of Wheat Ridge, 2015).
Currently, the corridor between 35th Avenue and I-70 has two travel lanes in each direction with
unrestricted left-turns, except at signalized intersections at 38th Avenue, 3 Acre Lane, and 44th Avenue,
where there are single left-turn lanes (Figure 2). Peak hour movements at the signalized intersections of
38th Avenue and 44th Avenue exceed existing capacity, resulting in substantial vehicle delays. There are
dedicated right-turn lanes at some street intersections and businesses. Most of the corridor lacks
sidewalks and there are no suitable bicycle facilities. There are several bus stops along the corridor for
the Regional Transportation District (RTD) Route 76 with major transfer points at 38th Avenue and 44th
Avenue.
2.1 PEL Study
Wheat Ridge and the Colorado Department of Transportation (CDOT) want to improve the Wadsworth
corridor from 35th Avenue to its connection with Interstate 70 (I-70) to add vehicular capacity, improve
safety, develop the multimodal facilities, and standardize access to properties along the corridor. Wheat
Ridge has explored the future of the Wadsworth corridor in numerous plans, including the Wadsworth
Corridor Subarea Plan (City of Wheat Ridge, 2007), Envision Wheat Ridge Comprehensive Plan (City of
Wheat Ridge, 2009), and three urban renewal plans. In 2015 Wheat Ridge completed the Wadsworth
Planning and Environmental Linkages (PEL) Study (City of Wheat Ridge, 2015), which established a
Figure 1. Regional Location Map of the City of Wheat Ridge, Colorado
35th Avenue to In ters ta te 70
AIR QUALITY TECHNICAL REPORT April 2019
ENVIRONMENTAL ASSESSMENT Page 2
Purpose and Need for the
improvements, documented existing
conditions, and evaluated several
alternatives.
The PEL Study identified four primary
needs within the corridor to be
addressed:
Poor traffic operations.
Lack of access management.
Lack of multimodal access and
accommodations.
Safety concerns.
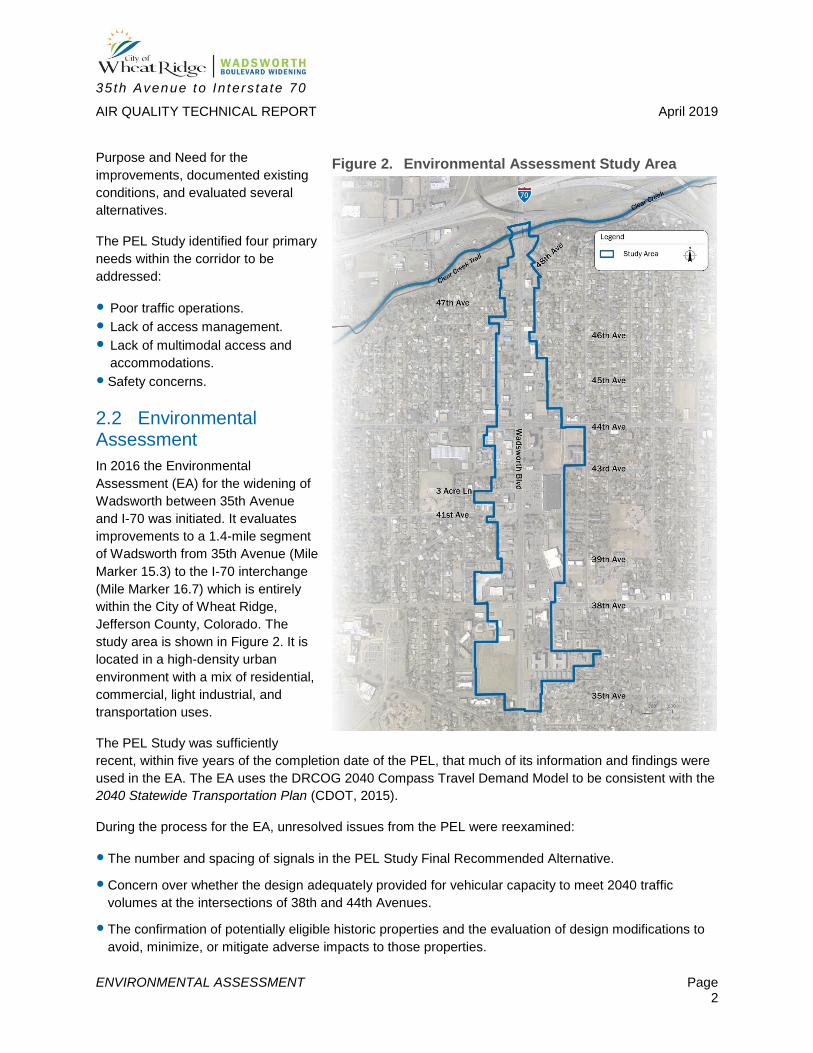
2.2 Environmental Assessment
In 2016 the Environmental
Assessment (EA) for the widening of
Wadsworth between 35th Avenue
and I-70 was initiated. It evaluates
improvements to a 1.4-mile segment
of Wadsworth from 35th Avenue (Mile
Marker 15.3) to the I-70 interchange
(Mile Marker 16.7) which is entirely
within the City of Wheat Ridge,
Jefferson County, Colorado. The
study area is shown in Figure 2. It is
located in a high-density urban
environment with a mix of residential,
commercial, light industrial, and
transportation uses.
The PEL Study was sufficiently
recent, within five years of the completion date of the PEL, that much of its information and findings were
used in the EA. The EA uses the DRCOG 2040 Compass Travel Demand Model to be consistent with the
2040 Statewide Transportation Plan (CDOT, 2015).
During the process for the EA, unresolved issues from the PEL were reexamined:
The number and spacing of signals in the PEL Study Final Recommended Alternative.
Concern over whether the design adequately provided for vehicular capacity to meet 2040 traffic
volumes at the intersections of 38th and 44th Avenues.
The confirmation of potentially eligible historic properties and the evaluation of design modifications to
avoid, minimize, or mitigate adverse impacts to those properties.
Figure 2. Environmental Assessment Study Area
35th Avenue to In ters ta te 70
AIR QUALITY TECHNICAL REPORT April 2019
ENVIRONMENTAL ASSESSMENT Page 3
The EA reconsidered some of the alternatives that were not advanced during the PEL Study process and
incorporated continuous flow intersection designs at 38th Avenue and 44th Avenue. When this type of
continuous flow intersection was compared to other intersection options, it had more corridor throughput,
better intersection Level of Service (LOS), reduced right-of-way impacts, and comparable crossing
features for pedestrians and bicycles. The process that addressed the three unresolved issues from the
PEL Study is documented in the Wadsworth Boulevard Widening Transition from PEL to NEPA Summary
Report (HDR, 2017) that is included as an appendix to the Wadsworth Boulevard Widening
Environmental Assessment and Section 4(f) Evaluation (CDOT, 2019).
The EA fully evaluates the environmental impacts associated with both of the alternatives, and specifies
mitigation. It also documents the public and agency involvement conducted for the NEPA process.
3.0 DESCRIPTION OF ALTERNATIVES
3.1 No-Action Alternative
The No-Action Alternative would not change the existing 1.4-mile corridor. It would include currently
programmed improvements, such as an asphalt overlay and traffic signal upgrades, but remain as
follows:
Four through lanes with a striped median for left-turning traffic and left-turn lanes at signalized
intersections at 38th Avenue, 3 Acre Lane, and 44th Avenue.
Continuous right-turn lane northbound between 38th Avenue and 44th Avenue.
Raised medians north and south of the intersections at 38th Avenue and 44th Avenue.
More than 80 unrestricted access points many of which are not designed to current standards.
Discontinuous and often very narrow sidewalks.
No suitable bicycle facilities and bus stops without full sidewalk access.
LOS F during both AM and PM peak periods in 2040 at the intersections of 38th Avenue and 44th
Avenue, and travel time during the PM peak period between 35th Avenue and 46th Avenue would be
approximately 8 minutes.
3.2 Proposed Action
The Proposed Action includes elements that add vehicular capacity, improve safety, develop the
multimodal facilities, and standardize access to properties along the corridor. The main elements of the
Proposed Action are illustrated in Figure 3. Details about specific improvements follow.

35th Avenue to In ters ta te 70
AIR QUALITY TECHNICAL REPORT April 2019
ENVIRONMENTAL ASSESSMENT Page 4
Figure 3. Proposed Action Typical Features
35th Avenue to In ters ta te 70
AIR QUALITY TECHNICAL REPORT April 2019
ENVIRONMENTAL ASSESSMENT Page 5
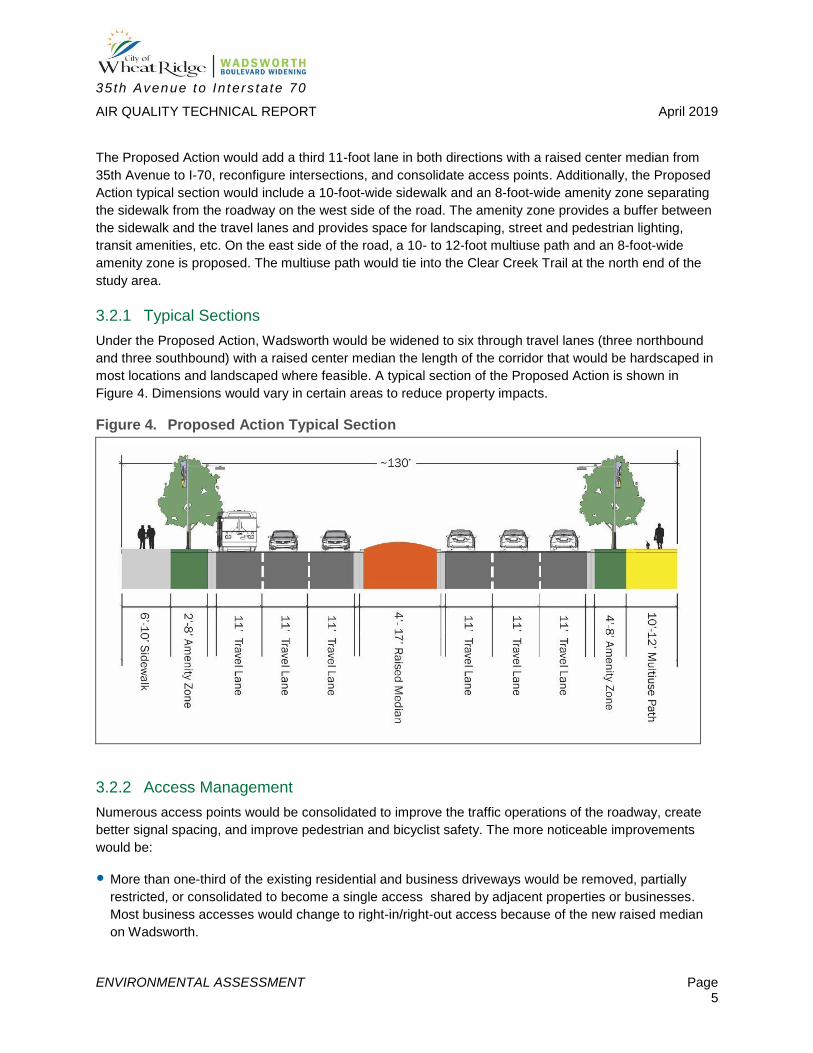
The Proposed Action would add a third 11-foot lane in both directions with a raised center median from
35th Avenue to I-70, reconfigure intersections, and consolidate access points. Additionally, the Proposed
Action typical section would include a 10-foot-wide sidewalk and an 8-foot-wide amenity zone separating
the sidewalk from the roadway on the west side of the road. The amenity zone provides a buffer between
the sidewalk and the travel lanes and provides space for landscaping, street and pedestrian lighting,
transit amenities, etc. On the east side of the road, a 10- to 12-foot multiuse path and an 8-foot-wide
amenity zone is proposed. The multiuse path would tie into the Clear Creek Trail at the north end of the
study area.
3.2.1 Typical Sections
Under the Proposed Action, Wadsworth would be widened to six through travel lanes (three northbound
and three southbound) with a raised center median the length of the corridor that would be hardscaped in
most locations and landscaped where feasible. A typical section of the Proposed Action is shown in
Figure 4. Dimensions would vary in certain areas to reduce property impacts.
Figure 4. Proposed Action Typical Section
3.2.2 Access Management
Numerous access points would be consolidated to improve the traffic operations of the roadway, create
better signal spacing, and improve pedestrian and bicyclist safety. The more noticeable improvements
would be:
More than one-third of the existing residential and business driveways would be removed, partially
restricted, or consolidated to become a single access shared by adjacent properties or businesses.
Most business accesses would change to right-in/right-out access because of the new raised median
on Wadsworth.
35th Avenue to In ters ta te 70
AIR QUALITY TECHNICAL REPORT April 2019
ENVIRONMENTAL ASSESSMENT Page 6
The traffic signal at 3 Acre Lane would be moved to 41st Avenue and would provide full access to
Wadsworth from properties east and west of the corridor in this area.
47th Avenue west of Wadsworth would become a 3/4 movement access allowing right-in, right-out, and
left-in turns from the south.
48th Avenue east of Wadsworth would be converted to a cul-de-sac with no direct access to Wadsworth; and a new driveway access for the 4800 Wadsworth office building would become a 3/4 movement allowing right-in/right-out access and left-in turns from the north.
3.2.3 Intersections
Continuous Flow Intersections
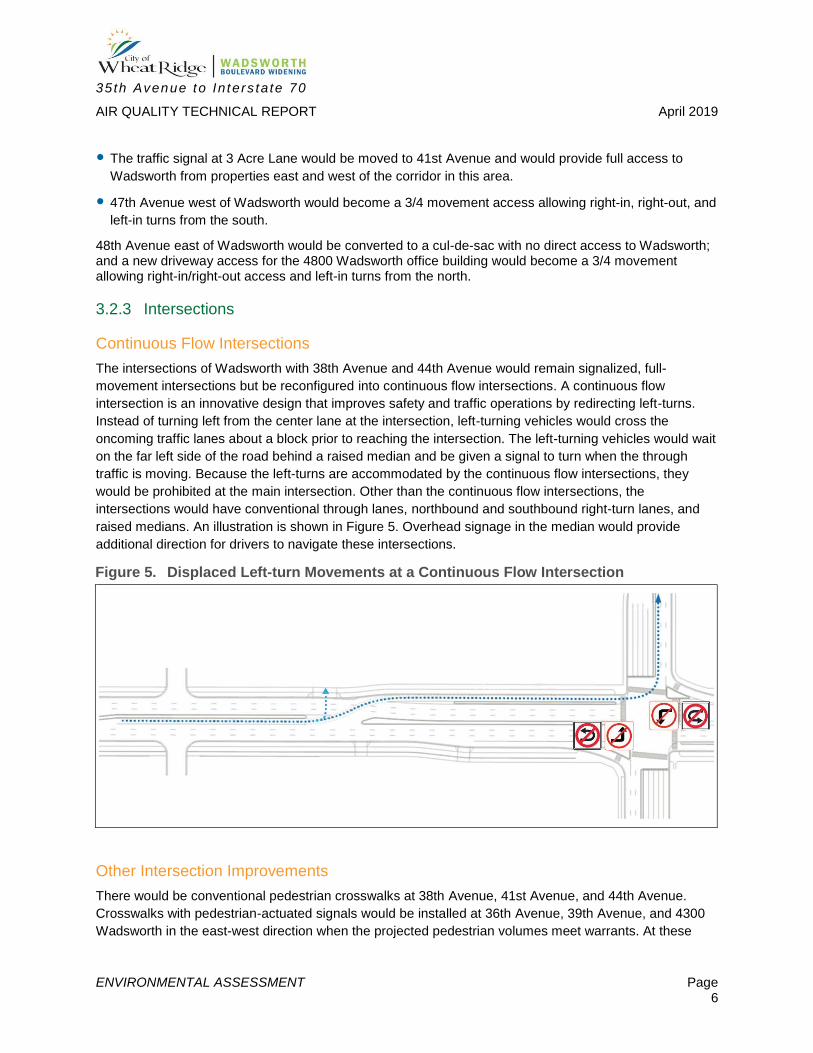
The intersections of Wadsworth with 38th Avenue and 44th Avenue would remain signalized, full-
movement intersections but be reconfigured into continuous flow intersections. A continuous flow
intersection is an innovative design that improves safety and traffic operations by redirecting left-turns.
Instead of turning left from the center lane at the intersection, left-turning vehicles would cross the
oncoming traffic lanes about a block prior to reaching the intersection. The left-turning vehicles would wait
on the far left side of the road behind a raised median and be given a signal to turn when the through
traffic is moving. Because the left-turns are accommodated by the continuous flow intersections, they
would be prohibited at the main intersection. Other than the continuous flow intersections, the
intersections would have conventional through lanes, northbound and southbound right-turn lanes, and
raised medians. An illustration is shown in Figure 5. Overhead signage in the median would provide
additional direction for drivers to navigate these intersections.
Other Intersection Improvements
There would be conventional pedestrian crosswalks at 38th Avenue, 41st Avenue, and 44th Avenue.
Crosswalks with pedestrian-actuated signals would be installed at 36th Avenue, 39th Avenue, and 4300
Wadsworth in the east-west direction when the projected pedestrian volumes meet warrants. At these
Figure 5. Displaced Left-turn Movements at a Continuous Flow Intersection
35th Avenue to In ters ta te 70
AIR QUALITY TECHNICAL REPORT April 2019
ENVIRONMENTAL ASSESSMENT Page 7
three locations, the center median would be wide enough to provide a refuge for pedestrians and
bicyclists.
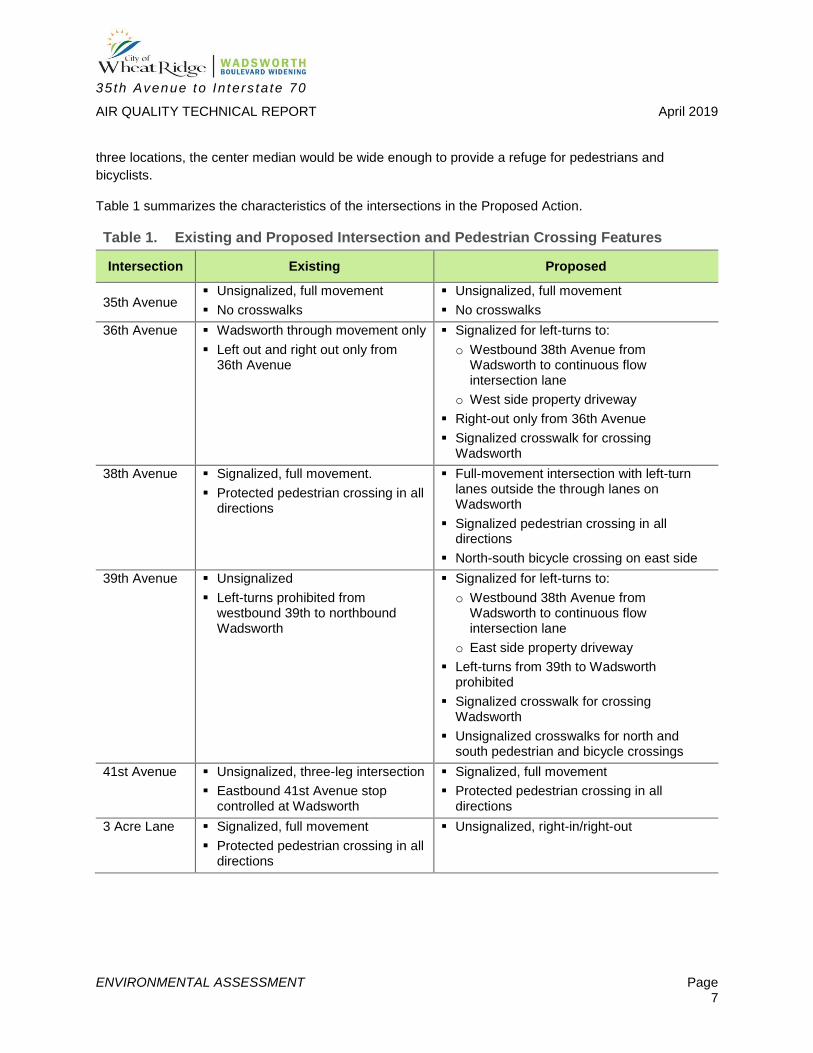
Table 1 summarizes the characteristics of the intersections in the Proposed Action.
Table 1. Existing and Proposed Intersection and Pedestrian Crossing Features
Intersection Existing Proposed
35th Avenue Unsignalized, full movement
No crosswalks
Unsignalized, full movement
No crosswalks
36th Avenue Wadsworth through movement only
Left out and right out only from 36th Avenue
Signalized for left-turns to:
o Westbound 38th Avenue from Wadsworth to continuous flow intersection lane
o West side property driveway
Right-out only from 36th Avenue
Signalized crosswalk for crossing Wadsworth
38th Avenue Signalized, full movement.
Protected pedestrian crossing in all directions
Full-movement intersection with left-turn lanes outside the through lanes on Wadsworth
Signalized pedestrian crossing in all directions
North-south bicycle crossing on east side
39th Avenue Unsignalized
Left-turns prohibited from westbound 39th to northbound Wadsworth
Signalized for left-turns to:
o Westbound 38th Avenue from Wadsworth to continuous flow intersection lane
o East side property driveway
Left-turns from 39th to Wadsworth prohibited
Signalized crosswalk for crossing Wadsworth
Unsignalized crosswalks for north and south pedestrian and bicycle crossings
41st Avenue Unsignalized, three-leg intersection
Eastbound 41st Avenue stop controlled at Wadsworth
Signalized, full movement
Protected pedestrian crossing in all directions
3 Acre Lane Signalized, full movement
Protected pedestrian crossing in all directions
Unsignalized, right-in/right-out
35th Avenue to In ters ta te 70
AIR QUALITY TECHNICAL REPORT April 2019
ENVIRONMENTAL ASSESSMENT Page 8
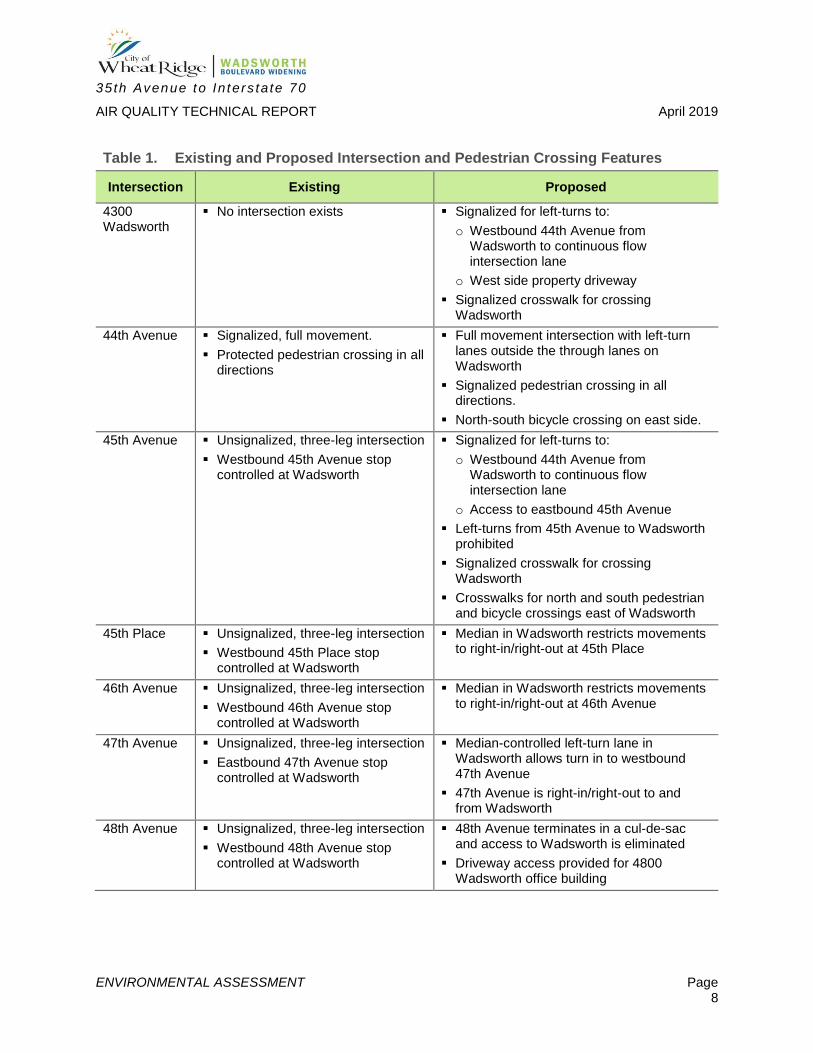
Table 1. Existing and Proposed Intersection and Pedestrian Crossing Features
Intersection Existing Proposed
4300 Wadsworth
No intersection exists Signalized for left-turns to:
o Westbound 44th Avenue from Wadsworth to continuous flow intersection lane
o West side property driveway
Signalized crosswalk for crossing Wadsworth
44th Avenue Signalized, full movement.
Protected pedestrian crossing in all directions
Full movement intersection with left-turn lanes outside the through lanes on Wadsworth
Signalized pedestrian crossing in all directions.
North-south bicycle crossing on east side.
45th Avenue Unsignalized, three-leg intersection
Westbound 45th Avenue stop controlled at Wadsworth
Signalized for left-turns to:
o Westbound 44th Avenue from Wadsworth to continuous flow intersection lane
o Access to eastbound 45th Avenue
Left-turns from 45th Avenue to Wadsworth prohibited
Signalized crosswalk for crossing Wadsworth
Crosswalks for north and south pedestrian and bicycle crossings east of Wadsworth
45th Place Unsignalized, three-leg intersection
Westbound 45th Place stop controlled at Wadsworth
Median in Wadsworth restricts movements to right-in/right-out at 45th Place
46th Avenue Unsignalized, three-leg intersection
Westbound 46th Avenue stop controlled at Wadsworth
Median in Wadsworth restricts movements to right-in/right-out at 46th Avenue
47th Avenue Unsignalized, three-leg intersection
Eastbound 47th Avenue stop controlled at Wadsworth
Median-controlled left-turn lane in Wadsworth allows turn in to westbound 47th Avenue
47th Avenue is right-in/right-out to and from Wadsworth
48th Avenue Unsignalized, three-leg intersection
Westbound 48th Avenue stop controlled at Wadsworth
48th Avenue terminates in a cul-de-sac and access to Wadsworth is eliminated
Driveway access provided for 4800 Wadsworth office building

35th Avenue to In ters ta te 70
AIR QUALITY TECHNICAL REPORT April 2019
ENVIRONMENTAL ASSESSMENT Page 9
3.2.4 Multimodal Facilities
The Proposed Action would upgrade Wadsworth with a continuous multiuse path on the east side and
continuous sidewalk on the west side, both separated from traffic by a landscaped amenity zone or buffer.
Americans with Disabilities Act of 1990 (ADA) compliant ramps would be provided at pedestrian
crossings.
On the east side at the south end, the multiuse path would connect to the proposed neighborhood
bikeway on 35th Avenue. At the north end, the Clear Creek Trail connection would be upgraded from the
existing stair access to both stair and ADA ramp access.
The continuous flow intersections would require relocation of the bus stops on Wadsworth at 38th Avenue
and 44th Avenue to the receiving lanes for right-turns. This would allow standard curbside boarding and
alighting and reduce walking distance for the high volume of transfers to and from RTD Routes 38, 44
and 76. The Proposed Action would have bus queue jump lanes adjacent to the pedestrian islands for
both directions on Wadsworth at 38th Avenue and 44th Avenue.
3.2.5 Structures
The Proposed Action would have several retaining walls ranging from 70 to 300 feet long to avoid or
minimize parking and property impacts. The current design estimates the need for six small fill walls, all
less than 4 feet tall with hand rails where necessary. The eight locations anticipated to have the largest
walls are shown in Figure 6.
Figure 6. Eight Proposed Retaining Wall Locations and Water Quality Pond
35th Avenue to In ters ta te 70
AIR QUALITY TECHNICAL REPORT April 2019
ENVIRONMENTAL ASSESSMENT Page 10
3.2.6 Drainage Structures
The Proposed Action would include a new storm drainage system within the study area to capture and
convey stormwater to Clear Creek. A new water quality pond would be constructed on the east side of
Wadsworth near the connection to the Clear Creek Trail in CDOT’s right-of-way.
4.0 AFFECTED ENVIRONMENT AND REGULATORY FRAMEWORK
4.1 Current Air Quality Standards and Guidelines
This resource analysis followed guidance contained in the CDOT NEPA Manual (CDOT, 2017) and in
these additional regulations. In accordance with the requirements of the Clean Air Act (CAA), the
Environmental Protection Agency (EPA) has promulgated National Ambient Air Quality Standards
(NAAQS) for pollutants considered harmful to public health and the environment. The CAA established
two types of NAAQS. Primary standards set limits to protect public health, including the health of sensitive
populations, such as asthmatics, children, and the elderly. Secondary standards set limits to protect
public welfare, including protection against decreased visibility, and damage to animals, crops,
vegetation, and buildings.
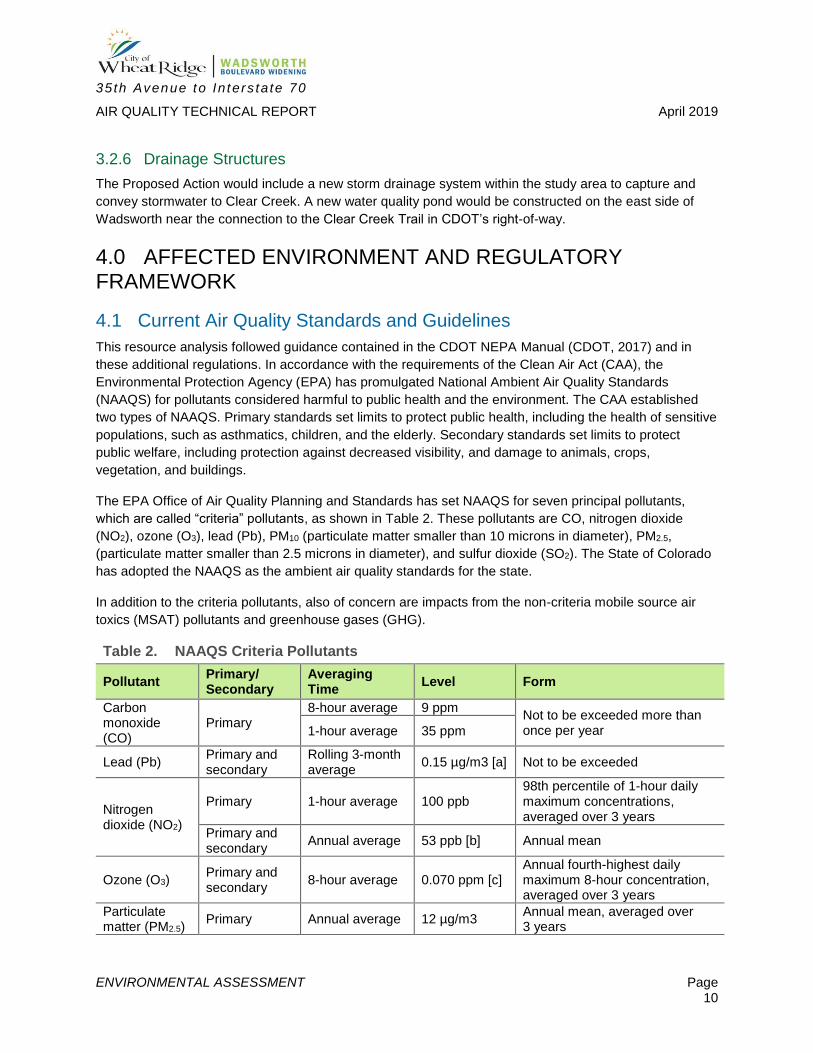
The EPA Office of Air Quality Planning and Standards has set NAAQS for seven principal pollutants,
which are called “criteria” pollutants, as shown in Table 2. These pollutants are CO, nitrogen dioxide
(NO2), ozone (O3), lead (Pb), PM10 (particulate matter smaller than 10 microns in diameter), PM2.5,
(particulate matter smaller than 2.5 microns in diameter), and sulfur dioxide (SO2). The State of Colorado
has adopted the NAAQS as the ambient air quality standards for the state.
In addition to the criteria pollutants, also of concern are impacts from the non-criteria mobile source air
toxics (MSAT) pollutants and greenhouse gases (GHG).
Table 2. NAAQS Criteria Pollutants
Pollutant Primary/ Secondary
Averaging Time
Level Form
Carbon monoxide (CO)
Primary 8-hour average 9 ppm
Not to be exceeded more than once per year 1-hour average 35 ppm
Lead (Pb) Primary and secondary
Rolling 3-month average
0.15 µg/m3 [a] Not to be exceeded
Nitrogen dioxide (NO2)
Primary 1-hour average 100 ppb 98th percentile of 1-hour daily maximum concentrations, averaged over 3 years
Primary and secondary
Annual average 53 ppb [b] Annual mean
Ozone (O3) Primary and secondary
8-hour average 0.070 ppm [c] Annual fourth-highest daily maximum 8-hour concentration, averaged over 3 years
Particulate matter (PM2.5)
Primary Annual average 12 µg/m3 Annual mean, averaged over 3 years
35th Avenue to In ters ta te 70
AIR QUALITY TECHNICAL REPORT April 2019
ENVIRONMENTAL ASSESSMENT Page 11
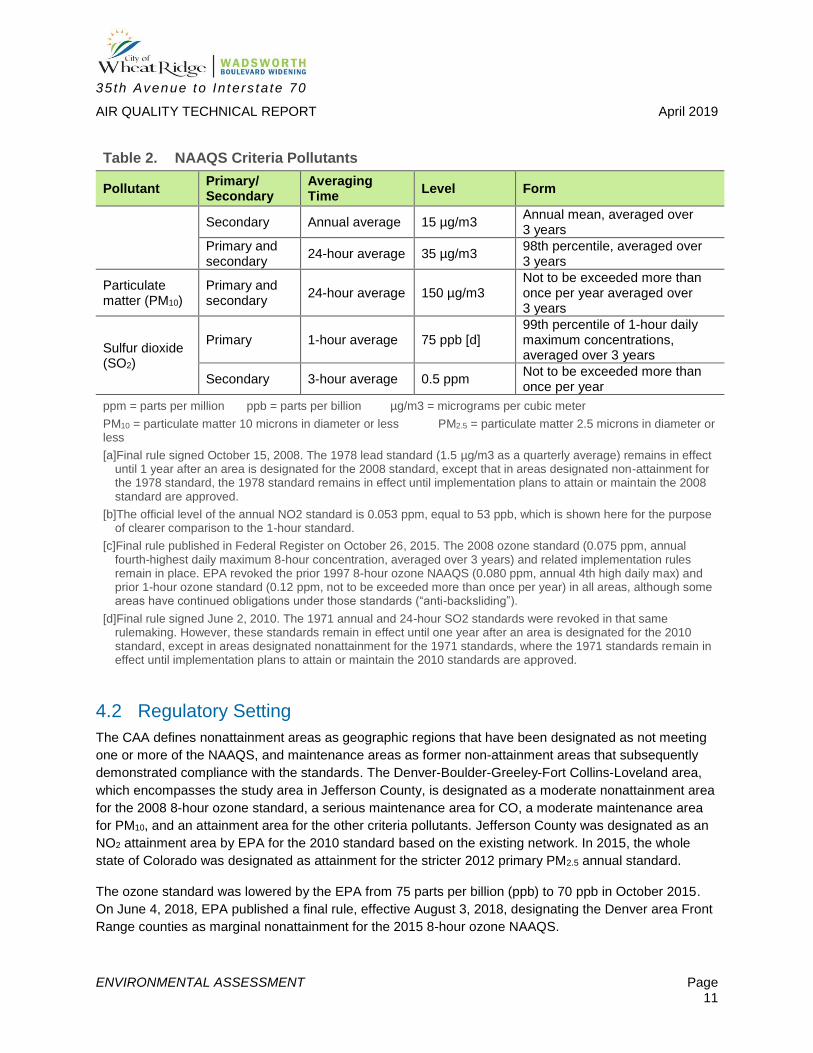
Table 2. NAAQS Criteria Pollutants
Pollutant Primary/ Secondary
Averaging Time
Level Form
Secondary Annual average 15 µg/m3 Annual mean, averaged over 3 years
Primary and secondary
24-hour average 35 µg/m3 98th percentile, averaged over 3 years
Particulate matter (PM10)
Primary and secondary
24-hour average 150 µg/m3 Not to be exceeded more than once per year averaged over 3 years
Sulfur dioxide (SO2)
Primary 1-hour average 75 ppb [d] 99th percentile of 1-hour daily maximum concentrations, averaged over 3 years
Secondary 3-hour average 0.5 ppm Not to be exceeded more than once per year
ppm = parts per million ppb = parts per billion µg/m3 = micrograms per cubic meter
PM10 = particulate matter 10 microns in diameter or less PM2.5 = particulate matter 2.5 microns in diameter or less
[a]Final rule signed October 15, 2008. The 1978 lead standard (1.5 µg/m3 as a quarterly average) remains in effect until 1 year after an area is designated for the 2008 standard, except that in areas designated non-attainment for the 1978 standard, the 1978 standard remains in effect until implementation plans to attain or maintain the 2008 standard are approved.
[b]The official level of the annual NO2 standard is 0.053 ppm, equal to 53 ppb, which is shown here for the purpose of clearer comparison to the 1-hour standard.
[c]Final rule published in Federal Register on October 26, 2015. The 2008 ozone standard (0.075 ppm, annual fourth-highest daily maximum 8-hour concentration, averaged over 3 years) and related implementation rules remain in place. EPA revoked the prior 1997 8-hour ozone NAAQS (0.080 ppm, annual 4th high daily max) and prior 1-hour ozone standard (0.12 ppm, not to be exceeded more than once per year) in all areas, although some areas have continued obligations under those standards (“anti-backsliding”).
[d]Final rule signed June 2, 2010. The 1971 annual and 24-hour SO2 standards were revoked in that same rulemaking. However, these standards remain in effect until one year after an area is designated for the 2010 standard, except in areas designated nonattainment for the 1971 standards, where the 1971 standards remain in effect until implementation plans to attain or maintain the 2010 standards are approved.
4.2 Regulatory Setting
The CAA defines nonattainment areas as geographic regions that have been designated as not meeting
one or more of the NAAQS, and maintenance areas as former non-attainment areas that subsequently
demonstrated compliance with the standards. The Denver-Boulder-Greeley-Fort Collins-Loveland area,
which encompasses the study area in Jefferson County, is designated as a moderate nonattainment area
for the 2008 8-hour ozone standard, a serious maintenance area for CO, a moderate maintenance area
for PM10, and an attainment area for the other criteria pollutants. Jefferson County was designated as an
NO2 attainment area by EPA for the 2010 standard based on the existing network. In 2015, the whole
state of Colorado was designated as attainment for the stricter 2012 primary PM2.5 annual standard.
The ozone standard was lowered by the EPA from 75 parts per billion (ppb) to 70 ppb in October 2015.
On June 4, 2018, EPA published a final rule, effective August 3, 2018, designating the Denver area Front
Range counties as marginal nonattainment for the 2015 8-hour ozone NAAQS.
35th Avenue to In ters ta te 70
AIR QUALITY TECHNICAL REPORT April 2019
ENVIRONMENTAL ASSESSMENT Page 12
4.2.1 Conformity Rules
The CAA Amendments of 1990 and the Final Transportation Conformity Rule (40 Code of Federal
Regulations [CFR] Parts 51 and 93) direct the EPA to implement environmental policies and regulations
that will ensure acceptable levels of air quality. The Transportation Conformity rules (40 CFR 93, Subpart
A) affect the funding and approval of proposed transportation projects. According to Title I, Section 176
(c) 2:
No federal agency may approve, accept or fund any transportation plan, program or project
unless such plan, program or project has been found to conform to any applicable State
Implementation Plan (SIP) in effect under this act.
Projects and approvals other than those for certain transportation (highway and transit) projects funded or
approved by the Federal Highway Administration (FHWA) or the Federal Transit Administration (FTA) are
subject to General Conformity rules (40 CFR 93, Subpart B).
Section 176(c)1(A) of the CAA defines conformity as follows:
Conformity to an implementation plan's purpose of eliminating or reducing the severity and
number of violations of the NAAQS and achieving expeditious attainment of such standards; and
that such activities will not:
Cause or contribute to any new violation of any NAAQS in any area;
Increase the frequency or severity of any existing violation of any NAAQS in any area; or
Delay timely attainment of any NAAQS or any required interim emission reductions or other
milestones in any area.
Under the Transportation Conformity rules, the FHWA, FTA, and state transportation agencies receiving
their funding and/or approval for roadway and transit projects must ensure that any emissions caused by
such funding or approval of proposed projects are in compliance with Transportation Conformity
requirements. The Transportation Conformity requirements for a given project are twofold:
1) Show that the proposed project will not cause emissions in excess of an applicable air quality
attainment or maintenance plan under the SIP for the area, or
2) Cause localized hot-spot concentrations of CO, PM10, or PM2.5 that would exceed the NAAQS of
exacerbate concentrations in any area with air quality levels worse than the NAAQS.
The Proposed Action is included in the current approved Long-Range Transportation Plan, known as the
DRCOG Fiscally Constrained Regional Transportation Plan (RTP) (DRCOG, 2015) as well as the 2040
Metro Vision Regional Transportation Plan (DRCOG, 2017). By virtue of the analyses conducted for these
plans, the Proposed Action is presumed to meet the SIP emissions budgets for the Denver area. The hot-
spot analysis described in this document demonstrates compliance with the second Transportation
Conformity requirement listed above. As described below, this analysis is quantitative for CO and
qualitative for PM10 and PM2.5.
35th Avenue to In ters ta te 70
AIR QUALITY TECHNICAL REPORT April 2019
ENVIRONMENTAL ASSESSMENT Page 13
4.2.2 State Implementation Plan
The CAA requires that a SIP be prepared for each nonattainment area, and a maintenance plan be
prepared for each former non-attainment area. The SIP outlines how the State will meet the NAAQS
under the deadlines established by the CAA. In addition, EPA’s Transportation Conformity Rule requires
Metropolitan Planning Organizations (which is the Denver Regional Council of Governments [DRCOG] for
this study area) and the FHWA to make conformity determinations on projects before they are approved.
Conformity for purposes of a SIP means that transportation activities would not cause new air quality
violations, worsen existing violations, or delay timely attainment of the NAAQS.
EPA proposes to work closely with the states and jurisdictions that have potential ozone nonattainment
areas to implement the revised stronger ozone standard that became effective on December 28, 2015.
Nonattainment areas will have until 2020 to late 2037 to meet the standard and reduce ozone-forming
pollution. According to EPA’s analysis, the existing and proposed federal rules, such as Tier 3 Vehicle
Emissions and Fuels Standards, Light-Duty Vehicle Tier 2 Rule, CAFÉ standards, Light and Heavy-Duty
Vehicle Greenhouse Gas Rule, and others, will help the vast majority of counties nationwide to meet the
updated standards by 2025 without additional action.
4.2.3 Existing Air Quality and Climate
Climate of the area is semi-arid, with
generally warm days and cool nights.
Average daytime high temperatures range
from the mid-40s in winter to the upper 80s in
summer. Winter typically has a few cold
spells, and snowstorms can happen at any
time from the fall through spring months,
although snow cover from such storms
usually does not persist for more than a few
days.
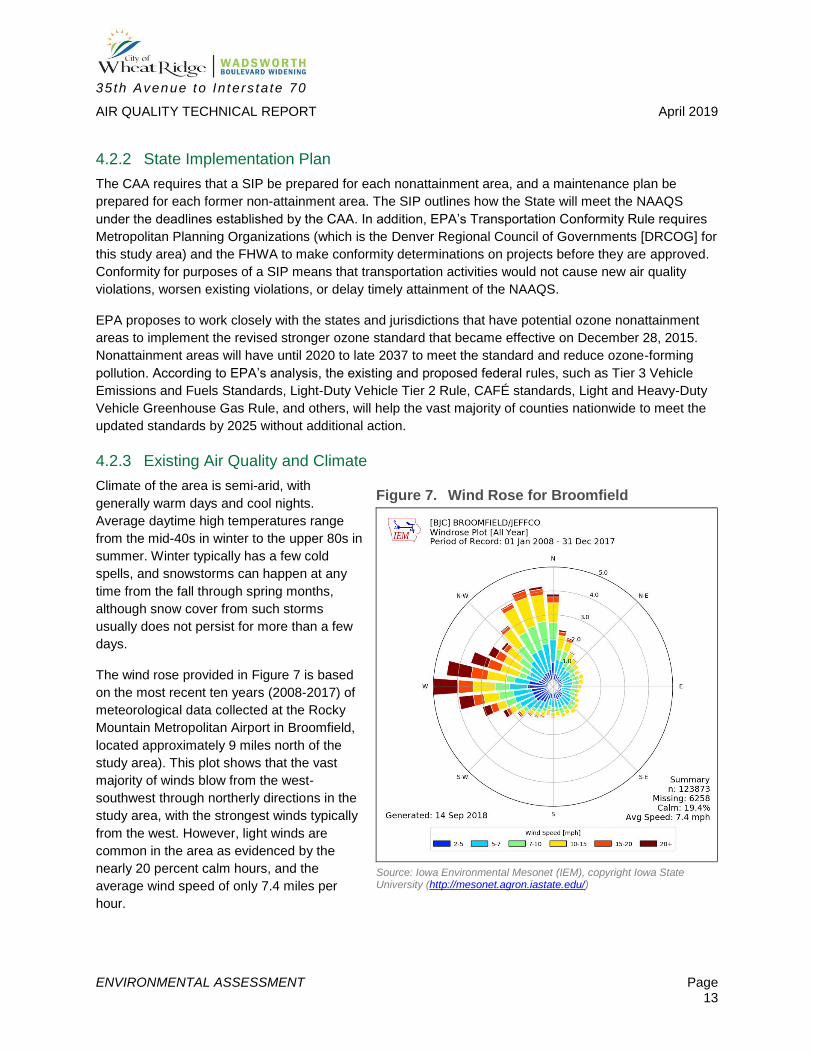
The wind rose provided in Figure 7 is based
on the most recent ten years (2008-2017) of
meteorological data collected at the Rocky
Mountain Metropolitan Airport in Broomfield,
located approximately 9 miles north of the
study area). This plot shows that the vast
majority of winds blow from the west-
southwest through northerly directions in the
study area, with the strongest winds typically
from the west. However, light winds are
common in the area as evidenced by the
nearly 20 percent calm hours, and the
average wind speed of only 7.4 miles per
hour.
Figure 7. Wind Rose for Broomfield
Source: Iowa Environmental Mesonet (IEM), copyright Iowa State University (http://mesonet.agron.iastate.edu/)
35th Avenue to In ters ta te 70
AIR QUALITY TECHNICAL REPORT April 2019
ENVIRONMENTAL ASSESSMENT Page 14
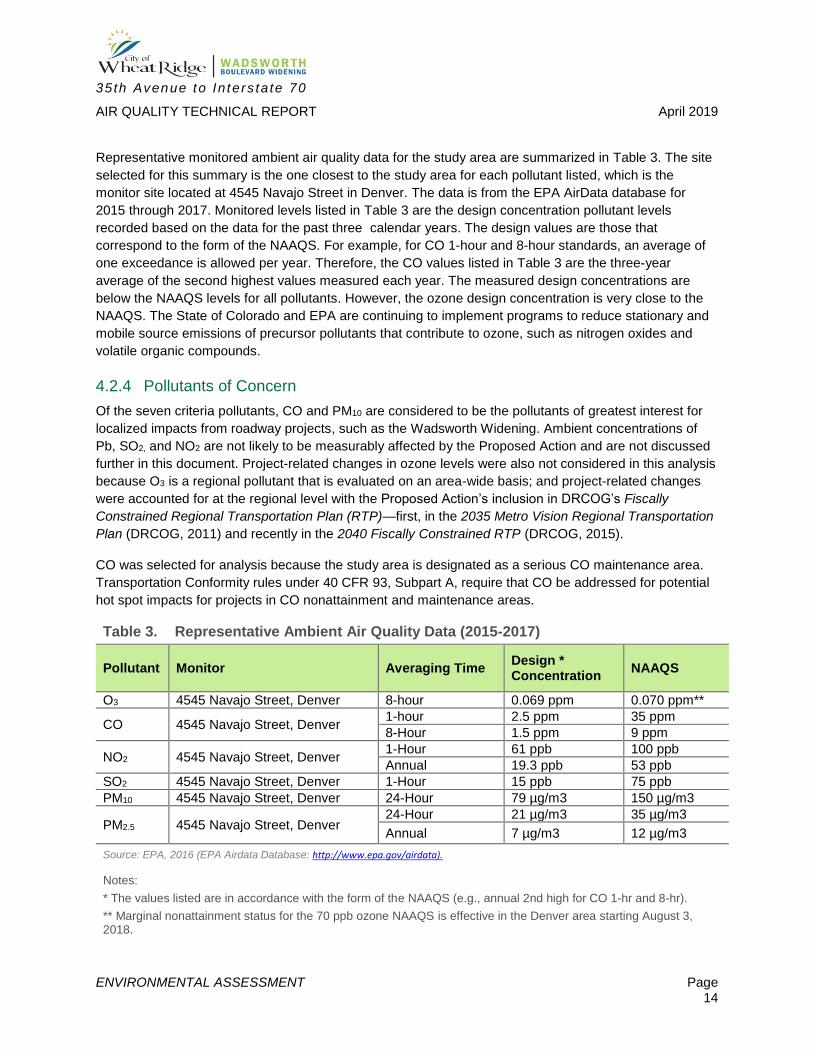
Representative monitored ambient air quality data for the study area are summarized in Table 3. The site
selected for this summary is the one closest to the study area for each pollutant listed, which is the
monitor site located at 4545 Navajo Street in Denver. The data is from the EPA AirData database for
2015 through 2017. Monitored levels listed in Table 3 are the design concentration pollutant levels
recorded based on the data for the past three calendar years. The design values are those that
correspond to the form of the NAAQS. For example, for CO 1-hour and 8-hour standards, an average of
one exceedance is allowed per year. Therefore, the CO values listed in Table 3 are the three-year
average of the second highest values measured each year. The measured design concentrations are
below the NAAQS levels for all pollutants. However, the ozone design concentration is very close to the
NAAQS. The State of Colorado and EPA are continuing to implement programs to reduce stationary and
mobile source emissions of precursor pollutants that contribute to ozone, such as nitrogen oxides and
volatile organic compounds.
4.2.4 Pollutants of Concern
Of the seven criteria pollutants, CO and PM10 are considered to be the pollutants of greatest interest for
localized impacts from roadway projects, such as the Wadsworth Widening. Ambient concentrations of
Pb, SO2, and NO2 are not likely to be measurably affected by the Proposed Action and are not discussed
further in this document. Project-related changes in ozone levels were also not considered in this analysis
because O3 is a regional pollutant that is evaluated on an area-wide basis; and project-related changes
were accounted for at the regional level with the Proposed Action’s inclusion in DRCOG’s Fiscally
Constrained Regional Transportation Plan (RTP)—first, in the 2035 Metro Vision Regional Transportation
Plan (DRCOG, 2011) and recently in the 2040 Fiscally Constrained RTP (DRCOG, 2015).
CO was selected for analysis because the study area is designated as a serious CO maintenance area.
Transportation Conformity rules under 40 CFR 93, Subpart A, require that CO be addressed for potential
hot spot impacts for projects in CO nonattainment and maintenance areas.
Table 3. Representative Ambient Air Quality Data (2015-2017)
Pollutant Monitor Averaging Time Design * Concentration
NAAQS
O3 4545 Navajo Street, Denver 8-hour 0.069 ppm 0.070 ppm**
CO 4545 Navajo Street, Denver 1-hour 2.5 ppm 35 ppm
8-Hour 1.5 ppm 9 ppm
NO2 4545 Navajo Street, Denver 1-Hour 61 ppb 100 ppb
Annual 19.3 ppb 53 ppb
SO2 4545 Navajo Street, Denver 1-Hour 15 ppb 75 ppb
PM10 4545 Navajo Street, Denver 24-Hour 79 µg/m3 150 µg/m3
PM2.5 4545 Navajo Street, Denver 24-Hour 21 µg/m3 35 µg/m3
Annual 7 µg/m3 12 µg/m3
Source: EPA, 2016 (EPA Airdata Database: http://www.epa.gov/airdata).
Notes:
* The values listed are in accordance with the form of the NAAQS (e.g., annual 2nd high for CO 1-hr and 8-hr).
** Marginal nonattainment status for the 70 ppb ozone NAAQS is effective in the Denver area starting August 3, 2018.

35th Avenue to In ters ta te 70
AIR QUALITY TECHNICAL REPORT April 2019
ENVIRONMENTAL ASSESSMENT Page 15
CO is generated in the urban environment primarily by the incomplete combustion of fossil fuels in motor
vehicles, and CO concentrations can vary greatly over relatively short distances. Relatively high
concentrations of CO are typically found near congested intersections and along heavily used roadways
carrying slow-moving traffic. The Proposed Action could affect traffic conditions at nearby congested
intersections, and concentrations at nearby (roadside) receptor. No sensitive receptors, such as schools,
hospitals or retirement homes, are adjacent to the intersections selected for analysis.
PM10 was selected for qualitative analysis because the study area is designated as a moderate PM10
maintenance area. Particulate matter pollution consists of very small liquid and solid particles floating in
the air, which can include smoke, soot, dust, salts, acids, and metals. Particulate matter also forms when
gases emitted from motor vehicles and industrial sources undergo chemical reactions in the atmosphere.
Major sources of PM10 include motor vehicles; wood-burning stoves and fireplaces; dust from
construction, landfills and agriculture; wildfires and brush/waste burning; industrial sources; windblown
dust from open lands; and atmospheric chemical and photochemical reactions.
Carcinogenic pollutants generated by diesel and gasoline-fueled vehicles are classified as MSAT, and
include, among others, formaldehyde, benzene, acrolein, 1,3 butadiene, acetaldehyde, and diesel
particulate matter.
In addition, GHG emissions were assessed in line with NEPA requirements for transportation projects.
GHG are of global concern because of their heat trapping quality that can affect climate. Anthropogenic
GHG emissions are mainly associated with the fossil fuel combustion by power plants, industrial facilities,
commercial and institutional facilities, residential heating, and engines used in the transportation of goods
and people. According to the EPA, GHG inventories for the last decade consistently demonstrate that
GHG emissions from transportation constitute about one-third of all GHG emissions in the United States.
The Proposed Action could contribute to GHG emissions. However, in the context of a No-Action
Alternative compared to the Proposed Action, the Proposed Action could actually help minimize GHG
emissions.
5.0 ENVIRONMENTAL CONSEQUENCES
5.1 Microscale CO Analysis
The CO microscale or “hot-spot” analysis is focused on signalized intersections, which represent the
greatest potential for impact on CO concentrations, because of relatively higher emissions from idling
cars as opposed to moving cars. Therefore, the intersections in the study area were evaluated to select a
representative worst-case intersection and traffic period (AM or PM peak) for microscale CO analysis.
Screening analysis was conducted based on the 40 CFR 93.123 (a) requirements for the CO hot-spot
analysis and following the air quality evaluation process in Chapter 9 Resources of the CDOT NEPA
Manual (CDOT, 2017) and EPA Guidelines for Modeling CO from Roadway Intersections (EPA, 1992).
According to the 40 CFR 93.123 (a)(1)(ii), if the level of service (LOS) at an intersection is D or worse, or
changes to D or worse as a result of a project, there is a potential for CO impacts at the intersection, and
a CO hot-spot analysis for the intersection would be required to determine whether the intersection is
causing an adverse CO impact at the nearby sensitive land uses. The other requirements of this
regulation are connected with the hot-spot sites or the highest volume and worst LOS top three

35th Avenue to In ters ta te 70
AIR QUALITY TECHNICAL REPORT April 2019
ENVIRONMENTAL ASSESSMENT Page 16
intersections identified in the SIP. If the LOS is C or better at an intersection and other CFR requirements
are met, the intersection impact on CO levels is not considered to be significant.
As described above under the Study Area section, the Wadsworth and 44th Avenue signalized
intersection was assessed in a single modeling analysis for the PM peak period, using EPA’s Motor
Vehicle Emissions Simulator (MOVES 2014a) emissions model and CAL3QHC (version 2.0, dated
95221) screening dispersion model, to estimate maximum CO concentrations at public receptor locations
near this intersection.
The MOVES emission factors for input to CAL3QHC were obtained from the Colorado Department of
Public Health and Environment, Air Pollution Control Division (APCD). The APCD provided these factors
for idling conditions (vehicles in queue), and for the various potential speeds for moving traffic. The APCD
provided emission factors for calendar year 2020, the earliest year of opening, and for a design year of
2040, as shown in Appendix A of this document. To be conservative in this analysis, the 2020 emission
factors were used with the projected 2040 traffic levels. Given that CO emission factors are dropping
dramatically with time, the analysis using 2020 emission factors will tend to over-predict the CO
concentrations in 2040. In addition, the analysis would conservatively predict 2020 impacts because while
the selected emission factors are appropriate for that year, the traffic volumes represent 2040 conditions
with assumed traffic growth above 2020 levels.
Existing measured average actual speeds for moving traffic approaching and departing the Wadsworth
and 44th Avenue intersection range from the upper 20s to low 30s in miles per hour. While the Proposed
Action is expected to improve traffic flow for future conditions, the MOVES emission factor for a
conservatively low speed of 25 miles/hour was used in this hot-spot analysis for all moving traffic
(exclusive of idling vehicles) on approach and departure links for this intersection.
A graphic depicting the layout of roadway free-flow links, queue links, and receptor locations input to
CAL3QHC, as well as the model input and output file listings from the CAL3QHC run, are included in
Appendix A of this document.
Background CO concentrations for the analysis were set to the design (second high) values as shown in
Table 3, which were obtained from the Navajo Street monitor. Given the monitor site is just north of
downtown Denver, near much higher traffic levels compared to the study area, it is expected to provide
conservatively high background concentrations.
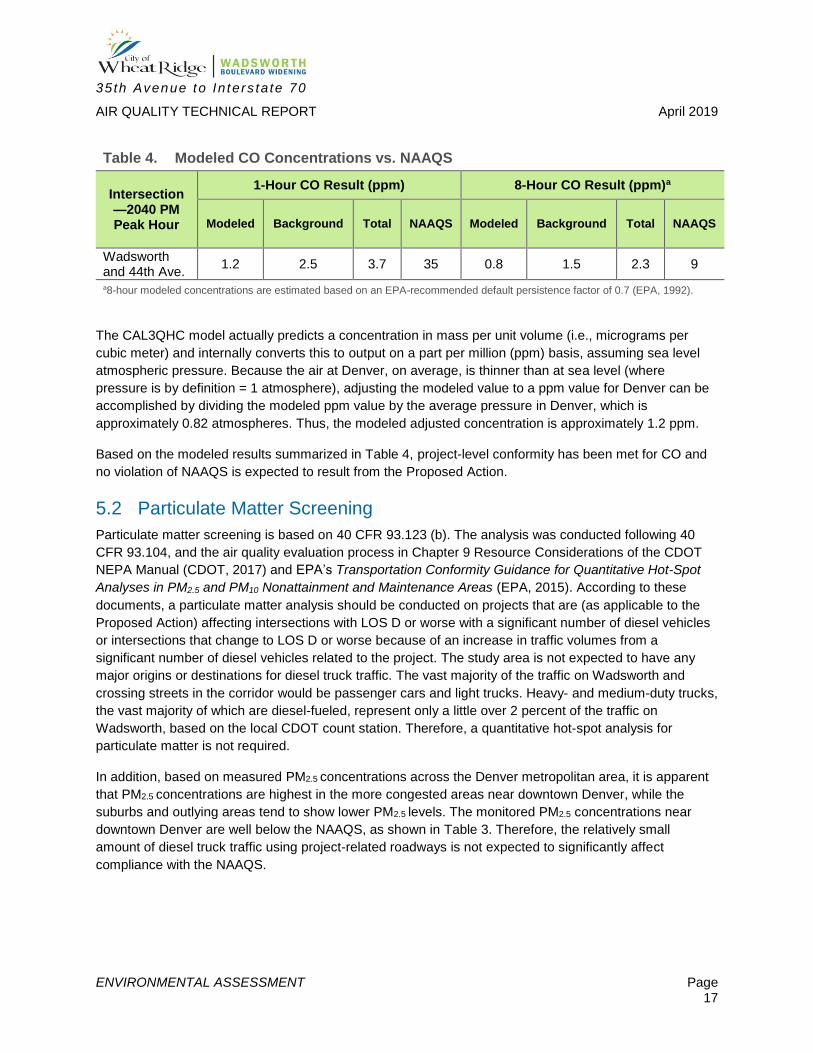
As shown in Table 4, the maximum modeled 1-hour and 8-hour CO concentrations, with the addition of
background concentrations, are well below the CO NAAQS. The maximum modeled 1-hour
concentration, not including background, was 1.0 parts per million at Receptor #52, located in the
southwest quadrant of the intersection near the modeled links for queuing vehicles approaching the
intersection on eastbound 44th Avenue (see Appendix A for receptor location).
35th Avenue to In ters ta te 70
AIR QUALITY TECHNICAL REPORT April 2019
ENVIRONMENTAL ASSESSMENT Page 17
Table 4. Modeled CO Concentrations vs. NAAQS
Intersection—2040 PM Peak Hour
1-Hour CO Result (ppm) 8-Hour CO Result (ppm)a
Modeled Background Total NAAQS Modeled Background Total NAAQS
Wadsworth and 44th Ave.
1.2 2.5 3.7 35 0.8 1.5 2.3 9
a8-hour modeled concentrations are estimated based on an EPA-recommended default persistence factor of 0.7 (EPA, 1992).
The CAL3QHC model actually predicts a concentration in mass per unit volume (i.e., micrograms per
cubic meter) and internally converts this to output on a part per million (ppm) basis, assuming sea level
atmospheric pressure. Because the air at Denver, on average, is thinner than at sea level (where
pressure is by definition = 1 atmosphere), adjusting the modeled value to a ppm value for Denver can be
accomplished by dividing the modeled ppm value by the average pressure in Denver, which is
approximately 0.82 atmospheres. Thus, the modeled adjusted concentration is approximately 1.2 ppm.
Based on the modeled results summarized in Table 4, project-level conformity has been met for CO and
no violation of NAAQS is expected to result from the Proposed Action.
5.2 Particulate Matter Screening
Particulate matter screening is based on 40 CFR 93.123 (b). The analysis was conducted following 40
CFR 93.104, and the air quality evaluation process in Chapter 9 Resource Considerations of the CDOT
NEPA Manual (CDOT, 2017) and EPA’s Transportation Conformity Guidance for Quantitative Hot-Spot
Analyses in PM2.5 and PM10 Nonattainment and Maintenance Areas (EPA, 2015). According to these
documents, a particulate matter analysis should be conducted on projects that are (as applicable to the
Proposed Action) affecting intersections with LOS D or worse with a significant number of diesel vehicles
or intersections that change to LOS D or worse because of an increase in traffic volumes from a
significant number of diesel vehicles related to the project. The study area is not expected to have any
major origins or destinations for diesel truck traffic. The vast majority of the traffic on Wadsworth and
crossing streets in the corridor would be passenger cars and light trucks. Heavy- and medium-duty trucks,
the vast majority of which are diesel-fueled, represent only a little over 2 percent of the traffic on
Wadsworth, based on the local CDOT count station. Therefore, a quantitative hot-spot analysis for
particulate matter is not required.
In addition, based on measured PM2.5 concentrations across the Denver metropolitan area, it is apparent
that PM2.5 concentrations are highest in the more congested areas near downtown Denver, while the
suburbs and outlying areas tend to show lower PM2.5 levels. The monitored PM2.5 concentrations near
downtown Denver are well below the NAAQS, as shown in Table 3. Therefore, the relatively small
amount of diesel truck traffic using project-related roadways is not expected to significantly affect
compliance with the NAAQS.
35th Avenue to In ters ta te 70
AIR QUALITY TECHNICAL REPORT April 2019
ENVIRONMENTAL ASSESSMENT Page 18
5.3 MSAT Analysis
In addition to the criteria pollutants for which there are NAAQS, EPA also regulates air toxics. Toxic air
pollutants are those pollutants known or suspected to cause cancer or other serious health effects. Most
air toxics originate from human-made sources, including on-road mobile sources, non-road mobile
sources (e.g., airplanes), area sources (e.g., dry cleaners), and stationary sources (e.g., factories or
refineries).
The CAA identified 188 air toxics. The EPA has assessed this expansive list in their final rule on the
Control of Hazardous Air Pollutants from Mobile Sources (Federal Register, Vol. 72, No. 37, page 8430,
February 26, 2007 (EPA, 2007) and identified a group of 93 compounds emitted from mobile sources that
are listed in their Integrated Risk Information System (http://www.epa.gov/ncea/iris/index.html).
In addition, EPA identified seven compounds with significant contributions from mobile sources that are
among the national and regional-scale cancer risk drivers from their 1999 National Air Toxic Assessment.
These are acrolein, benzene, 1,3-butadiene, diesel particulate matter plus diesel exhaust organic gases ,
formaldehyde, naphthalene, and polycyclic organic matter. While FHWA considers these the MSATs of
concern, the list is subject to change and may be adjusted in consideration of future EPA rules. The 2007
EPA rule mentioned above requires controls that will dramatically decrease MSAT emissions through
cleaner fuels and cleaner engines.
The effects of EPA’s 2007 rule for controlling MSAT emissions were included in the MOVES 2010b
emissions model. However, subsequent to 2010, EPA issued additional fuel and emissions standards to
further control emissions from on-road vehicles. The effects of these additional standards were
incorporated in the 2014 version of MOVES. According to EPA, MOVES2014 is a major revision to
MOVES2010 and improves upon it in many respects. MOVES2014 includes new data, new emissions
standards, and new functional improvements and features. It incorporates substantial new data for
emissions, fleet, and activity developed since the release of MOVES2010. These new emissions data are
for light- and heavy-duty vehicles, exhaust and evaporative emissions, and fuel effects. MOVES2014 also
adds updated vehicle sales, population, age distribution, and vehicle miles travelled (VMT) data.
MOVES2014 incorporates the effects of three new federal emissions standard rules not included in
MOVES2010. These new standards are all expected to impact MSAT emissions and include Tier 3
emissions and fuel standards starting in 2017 (79 FR 60344), heavy-duty greenhouse gas regulations
that phase in during model years 2014-2018 (79 FR 60344), and the second phase of light duty
greenhouse gas regulations that phase in during model years 2017-2025 (79 FR 60344) Since the
release of MOVES2014, EPA has released MOVES2014a, which adds new options requested by users
for the input of local VMT, includes minor updates to the default fuel tables, and corrects an error in
MOVES2014 brake wear emissions. The change in brake wear emissions results in small decreases in
PM emissions, while emissions for other criteria pollutants remain essentially the same as MOVES2014.
Based on an FHWA analysis using EPA's MOVES2014a model, as shown in Figure 8, even if vehicle
miles traveled (VMT) increases by 45 percent, as assumed from 2010 to 2050, a combined reduction of
91 percent in the total annual emissions for the priority MSAT is projected for the same time period.

35th Avenue to In ters ta te 70
AIR QUALITY TECHNICAL REPORT April 2019
ENVIRONMENTAL ASSESSMENT Page 19
The Proposed Action is considered to be of
low potential MSAT effect because it does not
create or significantly alter any intermodal
freight facilities or aggregate a significant
volume of diesel vehicles; and does not add
significant capacity to or create an urban
highway with average annual daily traffic
140,000 or higher in the vicinity of populated
areas (FHWA, 2016).
The increase in VMT in the study area would
probably result in slightly higher MSAT
emissions than the No-Action Alternative in
the study area. However, the magnitude of
EPA-projected reductions in MSATs is so
great (Figure 8) that even after accounting for
VMT growth, urban area MSAT emissions will
tend to be much lower in the future than they
are today.
Air toxics analysis is a continuing area of
research. While much work has been done to
assess the overall health risk of air toxics,
many questions remain unanswered. In
particular, the tools and techniques for
assessing project-specific health outcomes as
a result of lifetime MSAT exposure remain
limited. These limitations impede the ability to
evaluate how potential public health risks
posed by MSAT exposure should be factored
into project-level decision-making within the
context of NEPA.
Nonetheless, air toxics concerns continue to
be raised on highway projects during the
NEPA process. Even as the science emerges,
we are duly expected by the public and other
agencies to address MSAT impacts in our
environmental documents. The FHWA, EPA, the Health Effects Institute, and others have funded and
conducted research studies to try to more clearly define potential risks from MSAT emissions associated
with highway projects. The FHWA will continue to monitor the developing research in this field.
Figure 8. National MSAT Emission Trends 2010-2050 for Vehicles Operating on Roadways Using EPA's MOVES2014a Model
Source: EPA MOVES2014a model runs conducted by FHWA, September 2016.
Note: Trends for specific locations may be different, depending on locally derived information representing vehicle-miles travelled, vehicle speeds, vehicle mix, fuels, emission control programs, meteorology, and other factors.
35th Avenue to In ters ta te 70
AIR QUALITY TECHNICAL REPORT April 2019
ENVIRONMENTAL ASSESSMENT Page 20
5.4 GHG Analysis
The following is adapted from the 2017 CDOT NEPA Manual, Appendix F (CDOT, 2017).
Climate change is an important national and global concern. While the earth has gone through many
natural changes in climate in its history, there is general agreement that the earth’s climate is currently
changing at an accelerated rate and will continue to do so for the foreseeable future. Anthropogenic
(human-caused) GHG emissions contribute to this rapid change. CO2 makes up the largest component of
these GHG emissions. Other prominent transportation GHGs include methane and nitrous oxide.
Many GHGs occur naturally. Water vapor is the most abundant GHG and makes up approximately two
thirds of the natural greenhouse effect. However, the burning of fossil fuels and other human activities are
adding to the concentration of GHGs in the atmosphere. Many GHGs remain in the atmosphere for time
periods ranging from decades to centuries. GHGs trap heat in the earth’s atmosphere. Because
atmospheric concentration of GHGs continues to climb, our planet will continue to experience climate-
related phenomena. For example, warmer global temperatures can cause changes in precipitation and
sea levels.
To date, no national standards have been established regarding GHG emissions, nor has the EPA
established criteria or thresholds for ambient GHG emissions pursuant to its authority to establish motor
vehicle emission standards for CO2 under the CAA. However, there is a considerable body of scientific
literature addressing the sources of GHG emissions and their adverse effects on climate, including
reports from the Intergovernmental Panel on Climate Change, the U.S. National Academy of Sciences,
the EPA, and other federal agencies. GHG emissions are different from other air pollutants evaluated in
federal environmental reviews because their impacts are not localized or regional because of their rapid
dispersion into the global atmosphere, which is characteristic of these gases. The affected environment
for CO2 and other GHG emissions is the entire planet. In addition, from a quantitative perspective, global
climate change is the cumulative result of numerous and varied emissions sources (in terms of both
absolute numbers and types), each of which makes a relatively small addition to global atmospheric GHG
concentrations. In contrast to broad-scale actions, such as actions involving an entire industry sector or
very large geographic areas, it is difficult to isolate and understand the GHG emissions impacts for a
particular transportation project. Furthermore, presently there is no scientific methodology for attributing
specific climatological changes to a particular transportation project’s emissions.
Under NEPA, detailed environmental analysis should be focused on issues that are significant and
meaningful to decision-making1. In the case of the proposed Wadsworth improvements, the
implementation of the project would help to minimize highway emissions compared to a no-action
alternative. Under no action, the arterial traffic in this portion of the Denver metropolitan area would
continue to increase and become more congested, leading to increased idling-related emissions, and a
decrease in average fuel efficiency (miles/gallon). Therefore, it is apparent that project implementation
would not increase GHG emissions, and would tend to minimize them in the study area.
As shown in Table 5, GHG emissions from highways in Colorado are a relatively small portion of the
global CO2 emissions for both a 2010 baseline year and for projected 2040 emissions. In fact, while
Colorado highway emissions are expected to increase modestly between 2010 and 2040, they would
1 See 40 CFR 1500.1(b), 1500.2(b), 1500.4(g), and 1501.7.

35th Avenue to In ters ta te 70
AIR QUALITY TECHNICAL REPORT April 2019
ENVIRONMENTAL ASSESSMENT Page 21
increase at a much slow rate (~15%) compared to the projected global increase (~53%). The proposed
project would help to minimize Colorado’s contribution to the global increase.
Table 5. Colorado Highway CO2 Emissions vs Global CO2 Emissions
Global CO2 Emissions,
MMT2
Colorado Motor Vehicle CO2 Emissions,
MMT3
Colorado Motor Vehicle CO2 Emissions, % of
Global Total
Current Conditions (2010) 29,670 10.3 0.0348%
Future Projection (2040) 45,500 11.9 0.0261%
Note: MMT = million metric tons. Global emissions estimates are from International Energy Outlook 2010, data for Figure 104, projected to 2040. Colorado emissions and statewide VMT estimates are from MOVES2010b.
While project-area traffic operations are not expected to increase GHG emissions (vs. the no action
alternative), there would be an increment of GHG emissions associated with construction of the proposed
project. The construction-related GHG emissions from the project build alternative will be insignificant,
and will not play a meaningful role in a determination of whether or not to implement the project, which
would tend to minimize GHG emissions due to traffic. More detailed information on GHG emissions “is not
essential to a reasoned choice among reasonable alternatives” (40 CFR 1502.22[a]) or to making a
decision in the best overall public interest based on a balanced consideration of transportation, economic,
social, and environmental needs and impacts (23 CFR 771.105[b]). For these reasons, no alternatives-
level GHG analysis has been performed for this project.
The context in which the emissions from the Proposed Action will occur, together with the expected
minimal GHG emissions contribution from the project, illustrate why the project’s GHG emissions will not
be significant and will not be a substantial factor in the decision-making. The transportation sector is the
second largest source of total GHG emissions in the U.S., behind electricity generation. The
transportation sector was responsible for approximately 27 percent of all anthropogenic (human caused)
GHG emissions in the U.S. in 2010.4 The majority of transportation GHG emissions are the result of fossil
fuel combustion. CO2 makes up the largest component of these GHG emissions. U.S. CO2 emissions
from the consumption of energy accounted for about 18 percent of worldwide energy consumption CO2
emissions in 2010.5 U.S. transportation CO2 emissions accounted for about 6 percent of worldwide CO2
emissions.6
While the contribution of GHGs from transportation in the U.S. as a whole is a large component of U.S.
GHG emissions, as the scale of analysis is reduced the GHG contributions become quite small. Using
2 These estimates are from the EIA’s International Energy Outlook 2010, and are considered the best-available projections of emissions from fossil fuel combustion. These totals do not include other sources of emissions, such as cement production, deforestation, or natural sources; however, reliable future projections for these emissions sources are not available. 3 MOVES projections suggest that Colorado motor vehicle CO2 emissions may increase by 14.9 percent between 2010 and 2040; more stringent fuel economy/GHG emissions standards will not be sufficient to offset projected growth in VMT. 4 Calculated from data in U.S. Environmental Protection Agency, Inventory of Greenhouse Gas Emissions and Sinks, 1990-2010. 5 Calculated from data in U.S. Energy Information Administration International Energy Statistics, Total Carbon Dioxide Emissions from the Consumption of Energy, http://www.eia.gov/cfapps/ipdbproject/IEDIndex3.cfm?tid=90&pid=44&aid=8, accessed
2/25/13. 6 Calculated from data in EIA figure 104: http://www.eia.gov/forecasts/archive/ieo10/emissions.html and EPA table ES-3: http://epa.gov/climatechange/emissions/downloads11/US-GHG-Inventory-2011-Executive-Summary.pdf
35th Avenue to In ters ta te 70
AIR QUALITY TECHNICAL REPORT April 2019
ENVIRONMENTAL ASSESSMENT Page 22
CO2 because of its predominant role in GHG emissions, Table 5 presents the relationship between
current and projected Colorado highway CO2 emissions and total global CO2 emissions. Based on
emissions estimates from EPA’s MOVES model5, and global CO2 estimates and projections from the
Energy Information Administration, CO2 emissions from motor vehicles in the entire state of Colorado
contributed less than one-tenth of 1 percent of global emissions in 2010 (0.0348 percent). These
emissions are projected to contribute an even smaller fraction (0.0261 percent) in 2040. GHG emissions
from Colorado highway construction in any given year will represent only a small fraction of the emissions
from motor vehicle operation on the state’s highways.
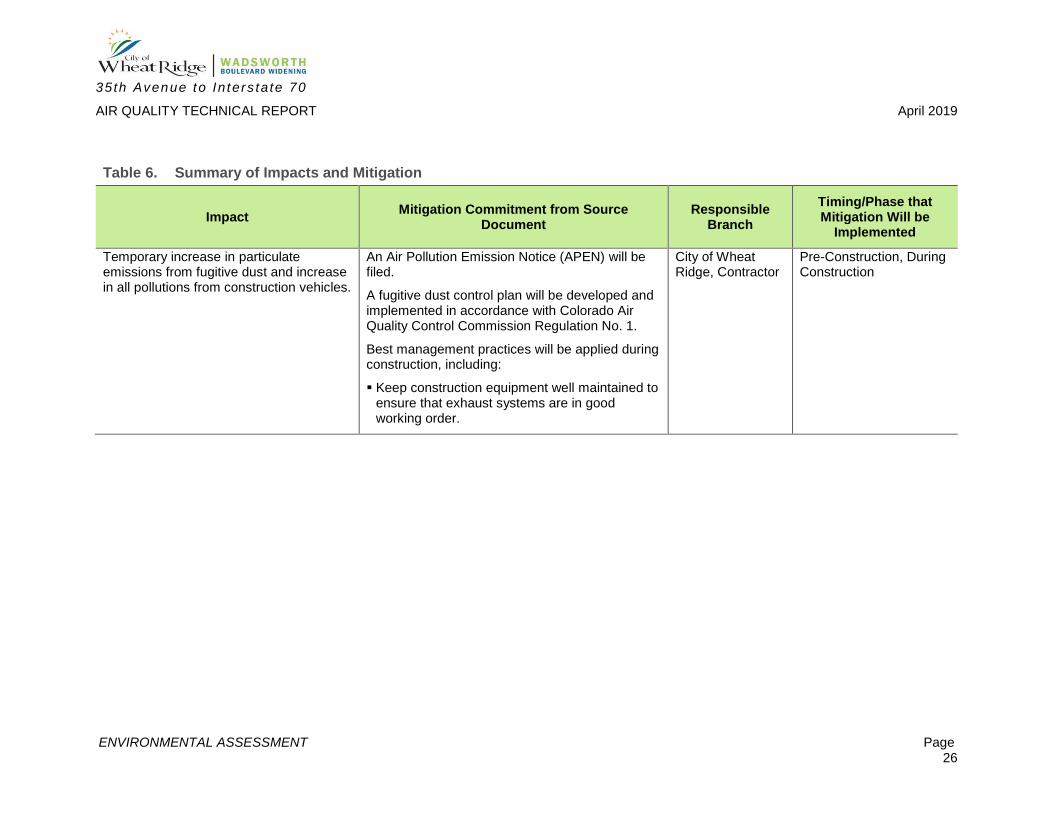
5.5 Construction Impacts
Emissions resulting from construction of a project are not required to be considered in the hot-spot
analysis if such emissions are considered temporary, according to 40 CFR 93.123(c)(5). Because the
Proposed Action would be completed in less than 5 years, meeting the criteria of Section 93.123(c)(5) for
a temporary impact, these emissions are not required to be analyzed. The project’s construction
contractor, however, will be required to obtain all necessary air permits for construction activities, and to
minimize release of fugitive dust due to earthmoving and other dust causing activities, through application
of water, soil stabilization, or other dust control measures.
5.6 Cumulative Impacts
Cumulative impacts are considered in accordance with the Council on Environmental Quality (CEQ)
regulation described in 40 CFR 1500 to 1508. The CEQ guidance calls to consider past, present, and
reasonably foreseeable future actions in the analysis to identify:
Whether the environment was previously degraded and to what extent.
Whether on-going activities are casing impacts.
What the trends are for activities and impacts in the area.
Whether the environment will be degraded in the foreseeable future and to what extent.
The cumulative impact of the proposed project and other transportation and land development projects on
air quality are accounted for cumulatively in the DRCOG 2040 Fiscally Constrained Regional
Transportation Plan (DRCOG, 2015) and 2018-2021 Transportation Improvement Program (TIP ID #:
2016-020) (DRCOG, 2017).
Under various court precedents and in accordance with recent practice for environmental documentation
for other proposed federal actions, the assessment of climate change in a NEPA context should include
two primary aspects:
1) Impact or contribution of the project to climate change, and
2) Impact of climate change on the project.
Cumulative impact contributions of project-related GHG emissions on climate change are expected to be
minimal from project construction. Operations of the proposed improved Wadsworth corridor would tend
to minimize GHG emissions vs the No-Action Alternative. Thus, the Proposed Action would not have a
material effect on climate change.
35th Avenue to In ters ta te 70
AIR QUALITY TECHNICAL REPORT April 2019
ENVIRONMENTAL ASSESSMENT Page 23
Regarding the impacts of climate change (due to all causes) on the Proposed Action, the Proposed
Action would be designed to accommodate expected or potential changes in rainfall, temperature and
other climatic variables during expected highway life. Therefore, climate change is not anticipated to
adversely affect functionality or resilience of the Proposed Action.
6.0 MITIGATION
6.1 Criteria and MSAT Emissions Mitigation
Given that no significant air quality impacts from criteria and MSAT air pollutants would result from the
Proposed Action, no mitigation is identified for these pollutants, other than reasonable measures to
control fugitive dust emissions during construction activities.
6.2 Global GHG Emissions Mitigation
[The following is taken from the 2017 CDOT NEPA Manual, Appendix F (CDOT, 2017).]
To help address the global issue of climate change, the United States Department of Transportation
(USDOT) is committed to reducing GHG emissions from vehicles traveling on our nation’s highways. The
USDOT and EPA are working together to reduce these emissions by substantially improving vehicle
efficiency and shifting toward lower carbon intensive fuels. The agencies have jointly established new,
more stringent fuel economy and first ever GHG emissions standards for model year 2012–2025 cars and
light trucks, with an ultimate fuel economy standard of 54.5 miles per gallon for cars and light trucks by
model year 2025. Further, on September 15, 2011, the agencies jointly published the first ever fuel
economy and GHG emissions standards for heavy-duty trucks and buses.7 Increasing use of
technological innovations that can improve fuel economy, such as gasoline- and diesel-electric hybrid
vehicles, will improve air quality and reduce CO2 emissions future years.
Consistent with its view that broad-scale efforts hold the greatest promise for meaningfully addressing the
global climate change problem, FHWA is engaged in developing strategies to reduce transportation’s
contribution to GHGs—particularly CO2 emissions—and to assess the risks to transportation systems and
services from climate change. In an effort to assist states and metropolitan planning organizations in
performing GHG analyses, FHWA has developed a Handbook for Estimating Transportation GHG
Emissions for Integration into the Planning Process. The Handbook presents methodologies reflecting
good practices for the evaluation of GHG emissions at the transportation program level, and will
demonstrate how such evaluation may be integrated into the transportation planning process. FHWA has
also developed a tool for use at the statewide level to model a large number of GHG reduction scenarios
and alternatives for use in transportation planning, climate action plans, scenario planning exercises, and
in meeting state GHG reduction targets and goals. To assist states and metropolitan planning
organizations in assessing climate change vulnerabilities to their transportation networks, FHWA has
developed a draft vulnerability and risk assessment conceptual model and has piloted it in several
locations.
7 For more information on fuel economy proposals and standards, see the National Highway Traffic Safety Administration’s Corporate Average Fuel Economy website: http://www.nhtsa.gov/fuel-economy/.
35th Avenue to In ters ta te 70
AIR QUALITY TECHNICAL REPORT April 2019
ENVIRONMENTAL ASSESSMENT Page 24
At the state level, there are also several programs underway in Colorado to address transportation GHGs.
The Governor’s Climate Action Plan, adopted in November 2007, includes measures to adopt vehicle
CO2 emissions standards and to reduce vehicle travel through transit, flex time, telecommuting,
ridesharing, and broadband communications. CDOT issued a Policy Directive on Air Quality in May 2009.
This Policy Directive was developed with input from a number of agencies, including the State of
Colorado's Department of Public Health and Environment, EPA, FHWA, the Federal Transit
Administration, the Denver Regional Transportation District, and the Denver Regional Air Quality Council.
This Policy Directive and implementation document, the CDOT Air Quality Action Plan address
unregulated MSATs and GHGs produced from Colorado’s state highways, interstates, and construction
activities.
As a part of CDOT’s commitment to addressing MSATs and GHGs, some of CDOT’s programwide
activities include:
Research pavement durability opportunities with the goal of reducing the frequency of resurfacing
and/or reconstruction projects.
Develop air quality educational materials, specific to transportation issues, for citizens, elected
officials, and schools.
Offer outreach to communities to integrate land use and transportation decisions to reduce growth in
VMT, such as smart growth techniques, buffer zones, transit-oriented development, walkable
communities, access management plans, etc.
Commit to research additional concrete additives that would reduce the demand for cement.
Expand Transportation Demand Management efforts statewide to better utilize the existing
transportation mobility network.
Continue to diversify the CDOT fleet by retrofitting diesel vehicles, specifying the types of vehicles and
equipment contractors may use, purchasing low-emission vehicles, such as hybrids, and purchasing
cleaner burning fuels through bidding incentives where feasible. Incentivizing is the likely vehicle for
this.
Explore congestion and/or right-lane only restrictions for motor carriers.
Fund truck parking electrification (note: mostly via exploring external grant opportunities).
Research additional ways to improve freight movement and efficiency statewide.
Committing to use ultra-low sulfur diesel for non-road equipment statewide.
Develop a low-volatile organic compound-emitting tree landscaping specification.
Even though project-level mitigation measures will not have a substantial impact on global GHG
emissions because of the exceedingly small amount of GHG emissions involved, the above-identified
activities are part of a program-wide effort by FHWA and CDOT to adopt practical means to avoid and
minimize environmental impacts in accordance with 40 CFR 1505.2(c).
35th Avenue to In ters ta te 70
AIR QUALITY TECHNICAL REPORT April 2019
ENVIRONMENTAL ASSESSMENT Page 25
6.3 Construction Emissions Mitigation
Construction mitigation measures will be included in the contractor’s construction-related permits.
Emissions resulting from construction of a project are not required to be considered in a hot-spot analysis
if such emissions are considered temporary according to 40 CFR 93.123(c)(5). Because the Proposed
Action would be completed in less than five years, meeting the criteria of Section 93.123(c)(5) for a
temporary impact, these emissions are not required to be analyzed. The construction contractor,
however, may be required to obtain all necessary air permits for construction activities from the Colorado
Department of Public Health and Environment APCD, including the fugitive dust control plan as part of the
Construction Permit.
The contractor will develop a fugitive dust control plan in accordance with Colorado Air Quality Control
Commission Regulation No. 1. In addition, traffic control measures and maintenance of traffic during
construction helps to avoid congestion and reduces air quality impacts. Traffic maintenance procedures
can be applied in coordination with CDOT, as shown in Table 6.
Construction sequencing, overall construction timeframe, and construction delivery methods have not yet
been determined. A detailed Maintenance of Traffic Plan will be prepared to maintain traffic operations for
every stage of construction.
6.4 Mitigation Summary
A summary of mitigation measures for air quality impacts of the Proposed Action is included in Table 6.
35th Avenue to In ters ta te 70
AIR QUALITY TECHNICAL REPORT April 2019
ENVIRONMENTAL ASSESSMENT Page 26
Table 6. Summary of Impacts and Mitigation
Impact Mitigation Commitment from Source
Document Responsible
Branch
Timing/Phase that Mitigation Will be
Implemented
Temporary increase in particulate emissions from fugitive dust and increase in all pollutions from construction vehicles.
An Air Pollution Emission Notice (APEN) will be filed.
A fugitive dust control plan will be developed and implemented in accordance with Colorado Air Quality Control Commission Regulation No. 1.
Best management practices will be applied during construction, including:
Keep construction equipment well maintained to ensure that exhaust systems are in good working order.
City of Wheat Ridge, Contractor
Pre-Construction, During Construction
35th Avenue to In ters ta te 70
AIR QUALITY TECHNICAL REPORT April 2019
ENVIRONMENTAL ASSESSMENT Page 27
7.0 REFERENCES
City of Wheat Ridge. 2007. Wadsworth Corridor Subarea Plan. http://www.ci.wheatridge.co.us/DocumentCenter/Home/View/564.
City of Wheat Ridge. 2009. Envision Wheat Ridge Comprehensive Plan. http://www.ci.wheatridge.co.us/DocumentCenter/Home/View/1749.
City of Wheat Ridge. 2015. Wadsworth Planning and Environmental Linkages (PEL) Study. http://www.ci.wheatridge.co.us/DocumentCenter/View/23520/Wadsworth-PEL-Study-FINAL?bidId=.
Colorado Department of Health and Environment (CDPHE). 2016. E-mail from Dale Wells of Air Pollution Control Division (APCD) to Ed Liebsch of HDR Engineering, dated 12/9/2016.
Colorado Department of Transportation (CDOT). 2017. CDOT NEPA Manual.
Colorado Department of Transportation (CDOT). 2019. Wadsworth Boulevard Widening Environmental Assessment and Section 4(f) Evaluation.
Denver Regional Council of Governments (DRCOG). 2017. Metro Vision 2040 Plan. https://drcog.org/sites/default/files/resources/FINAL%20-%202040%20MVRTP%20w%20APPENDICES%20-%20April%202017.pdf
Denver Regional Council of Governments (DRCOG). 2015. 2040 Fiscally Constrained Regional Transportation Plan.
Denver Regional Council of Governments (DRCOG). 2017. 2018-2021 Transportation Improvement Program (TIP ID #: 2016-042).
Environmental Protection Agency (EPA). 1992. EPA Guideline for Modeling CO from Roadway Intersections.
Environmental Protection Agency (EPA). 2007. Control of Hazardous Air Pollutants from Mobile Sources (Federal Register, Vol. 72, No. 37, page 8430, February 26, 2007.
Environmental Protection Agency (EPA). 2015. Transportation Conformity Guidance for Quantitative Hot-Spot Analyses in PM2.5 and PM10 Nonattainment and Maintenance Areas.
Environmental Protection Agency (EPA). 2016. EPA Airdata Database: http://www.epa.gov/airdata. Accessed December 23, 2016.
Federal Highway Administration (FHWA). 2016. Updated Interim Guidance on Mobile Source Air Toxic Analysis in NEPA Documents. Memorandum dated October 18, 2016. HDR. 2017. Wadsworth Boulevard Widening Transition from PEL to NEPA Summary Report.
35th Avenue to In ters ta te 70
AIR QUALITY TECHNICAL REPORT
ENVIRONMENTAL ASSESSMENT Appendix A
Appendix A. CO Hot-Spot Analysis—Technical Backup

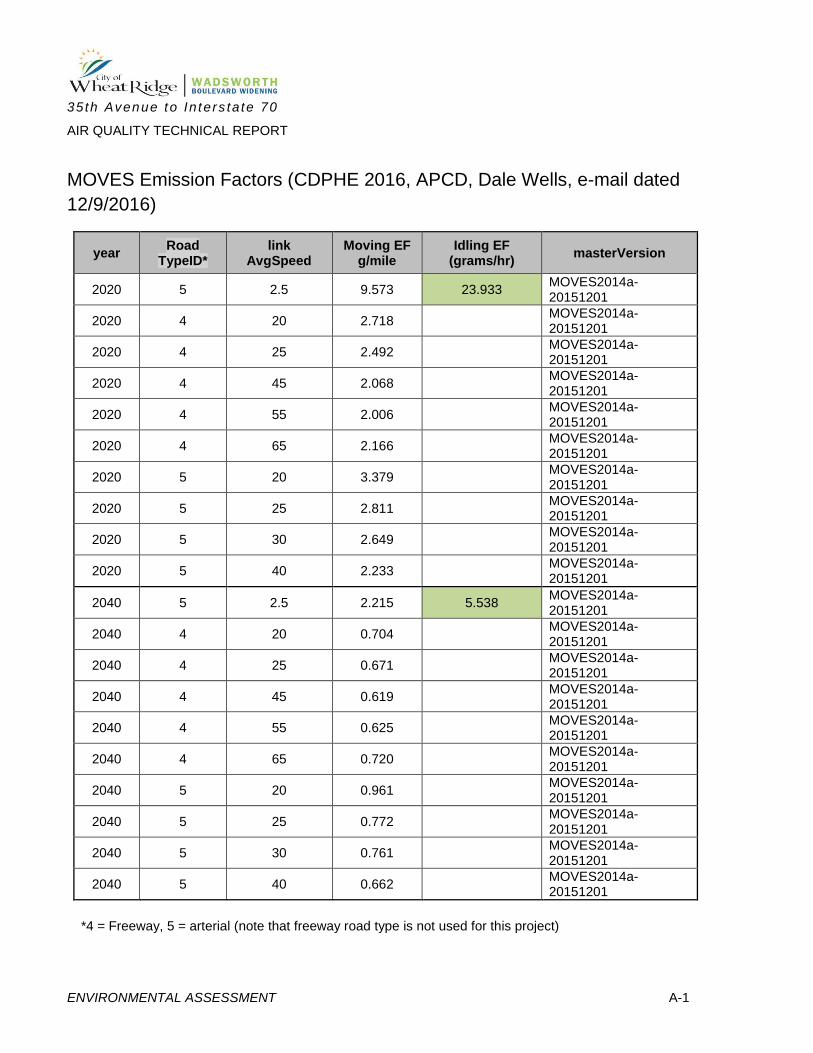
35th Avenue to In ters ta te 70
AIR QUALITY TECHNICAL REPORT
ENVIRONMENTAL ASSESSMENT A-1
MOVES Emission Factors (CDPHE 2016, APCD, Dale Wells, e-mail dated
12/9/2016)
year Road
TypeID* link
AvgSpeed Moving EF
g/mile Idling EF
(grams/hr) masterVersion
2020 5 2.5 9.573 23.933 MOVES2014a-20151201
2020 4 20 2.718 MOVES2014a-20151201
2020 4 25 2.492 MOVES2014a-20151201
2020 4 45 2.068 MOVES2014a-20151201
2020 4 55 2.006 MOVES2014a-20151201
2020 4 65 2.166 MOVES2014a-20151201
2020 5 20 3.379 MOVES2014a-20151201
2020 5 25 2.811 MOVES2014a-20151201
2020 5 30 2.649 MOVES2014a-20151201
2020 5 40 2.233 MOVES2014a-20151201
2040 5 2.5 2.215 5.538 MOVES2014a-20151201
2040 4 20 0.704 MOVES2014a-20151201
2040 4 25 0.671 MOVES2014a-20151201
2040 4 45 0.619 MOVES2014a-20151201
2040 4 55 0.625 MOVES2014a-20151201
2040 4 65 0.720 MOVES2014a-20151201
2040 5 20 0.961 MOVES2014a-20151201
2040 5 25 0.772 MOVES2014a-20151201
2040 5 30 0.761 MOVES2014a-20151201
2040 5 40 0.662 MOVES2014a-20151201
*4 = Freeway, 5 = arterial (note that freeway road type is not used for this project)

35th Avenue to In ters ta te 70
AIR QUALITY TECHNICAL REPORT
ENVIRONMENTAL ASSESSMENT A-2
CAL3QHC - Input Geometry
Free Flow Links (green) Queue Links (blue) Receptors (numbered dots) for Wadsworth and 44th Avenue Intersection
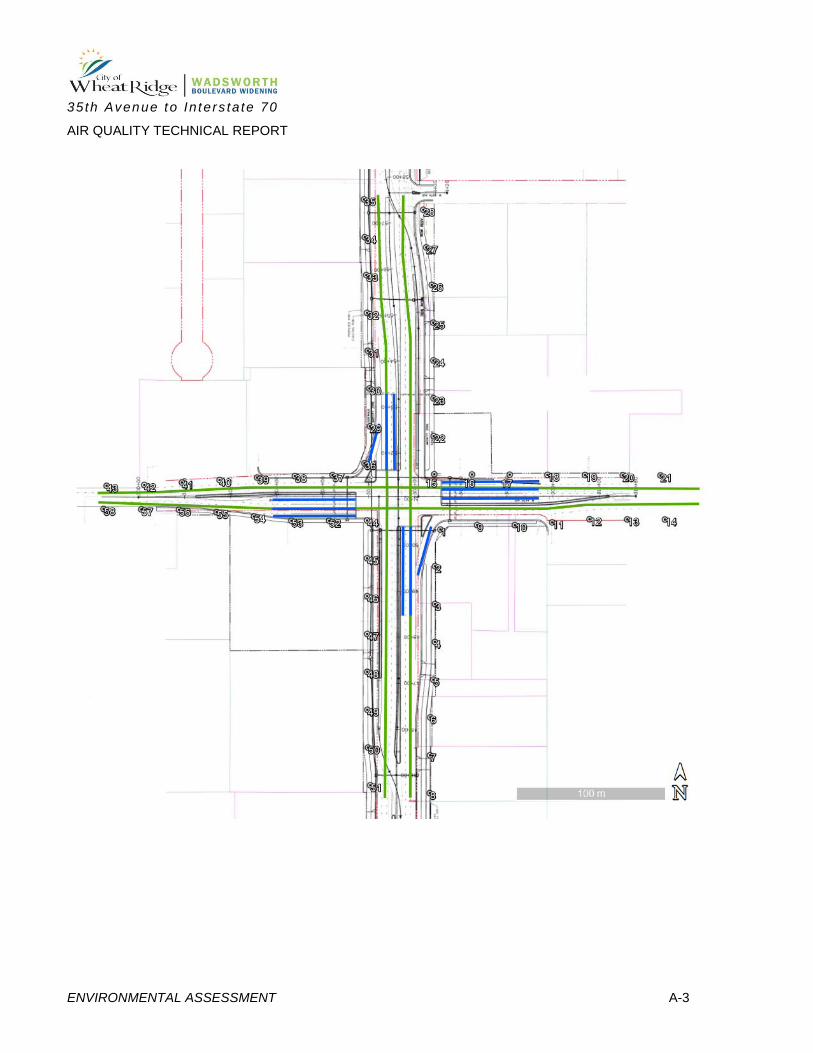
35th Avenue to In ters ta te 70
AIR QUALITY TECHNICAL REPORT
ENVIRONMENTAL ASSESSMENT A-3
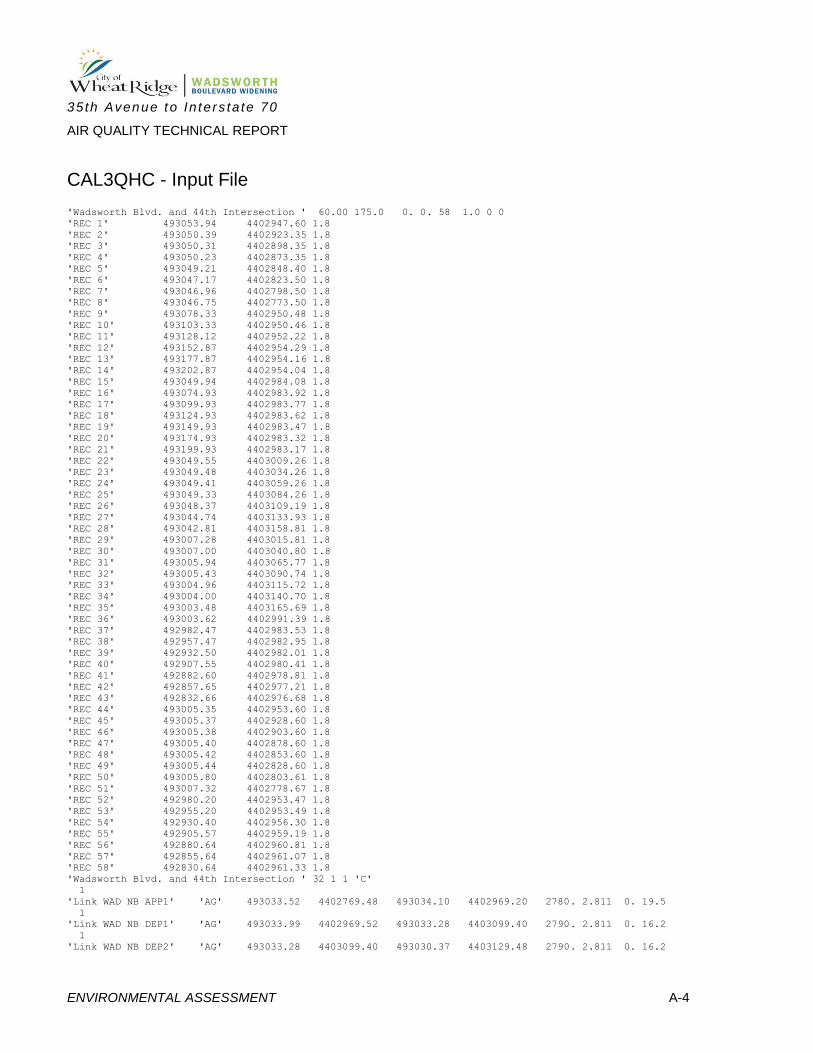
35th Avenue to In ters ta te 70
AIR QUALITY TECHNICAL REPORT
ENVIRONMENTAL ASSESSMENT A-4
CAL3QHC - Input File
'Wadsworth Blvd. and 44th Intersection ' 60.00 175.0 0. 0. 58 1.0 0 0
'REC 1' 493053.94 4402947.60 1.8
'REC 2' 493050.39 4402923.35 1.8
'REC 3' 493050.31 4402898.35 1.8
'REC 4' 493050.23 4402873.35 1.8
'REC 5' 493049.21 4402848.40 1.8
'REC 6' 493047.17 4402823.50 1.8
'REC 7' 493046.96 4402798.50 1.8
'REC 8' 493046.75 4402773.50 1.8
'REC 9' 493078.33 4402950.48 1.8
'REC 10' 493103.33 4402950.46 1.8
'REC 11' 493128.12 4402952.22 1.8
'REC 12' 493152.87 4402954.29 1.8
'REC 13' 493177.87 4402954.16 1.8
'REC 14' 493202.87 4402954.04 1.8
'REC 15' 493049.94 4402984.08 1.8
'REC 16' 493074.93 4402983.92 1.8
'REC 17' 493099.93 4402983.77 1.8
'REC 18' 493124.93 4402983.62 1.8
'REC 19' 493149.93 4402983.47 1.8
'REC 20' 493174.93 4402983.32 1.8
'REC 21' 493199.93 4402983.17 1.8
'REC 22' 493049.55 4403009.26 1.8
'REC 23' 493049.48 4403034.26 1.8
'REC 24' 493049.41 4403059.26 1.8
'REC 25' 493049.33 4403084.26 1.8
'REC 26' 493048.37 4403109.19 1.8
'REC 27' 493044.74 4403133.93 1.8
'REC 28' 493042.81 4403158.81 1.8
'REC 29' 493007.28 4403015.81 1.8
'REC 30' 493007.00 4403040.80 1.8
'REC 31' 493005.94 4403065.77 1.8
'REC 32' 493005.43 4403090.74 1.8
'REC 33' 493004.96 4403115.72 1.8
'REC 34' 493004.00 4403140.70 1.8
'REC 35' 493003.48 4403165.69 1.8
'REC 36' 493003.62 4402991.39 1.8
'REC 37' 492982.47 4402983.53 1.8
'REC 38' 492957.47 4402982.95 1.8
'REC 39' 492932.50 4402982.01 1.8
'REC 40' 492907.55 4402980.41 1.8
'REC 41' 492882.60 4402978.81 1.8
'REC 42' 492857.65 4402977.21 1.8
'REC 43' 492832.66 4402976.68 1.8
'REC 44' 493005.35 4402953.60 1.8
'REC 45' 493005.37 4402928.60 1.8
'REC 46' 493005.38 4402903.60 1.8
'REC 47' 493005.40 4402878.60 1.8
'REC 48' 493005.42 4402853.60 1.8
'REC 49' 493005.44 4402828.60 1.8
'REC 50' 493005.80 4402803.61 1.8
'REC 51' 493007.32 4402778.67 1.8
'REC 52' 492980.20 4402953.47 1.8
'REC 53' 492955.20 4402953.49 1.8
'REC 54' 492930.40 4402956.30 1.8
'REC 55' 492905.57 4402959.19 1.8
'REC 56' 492880.64 4402960.81 1.8
'REC 57' 492855.64 4402961.07 1.8
'REC 58' 492830.64 4402961.33 1.8
'Wadsworth Blvd. and 44th Intersection ' 32 1 1 'C'
1
'Link WAD NB APP1' 'AG' 493033.52 4402769.48 493034.10 4402969.20 2780. 2.811 0. 19.5
1
'Link WAD NB DEP1' 'AG' 493033.99 4402969.52 493033.28 4403099.40 2790. 2.811 0. 16.2
1
'Link WAD NB DEP2' 'AG' 493033.28 4403099.40 493030.37 4403129.48 2790. 2.811 0. 16.2
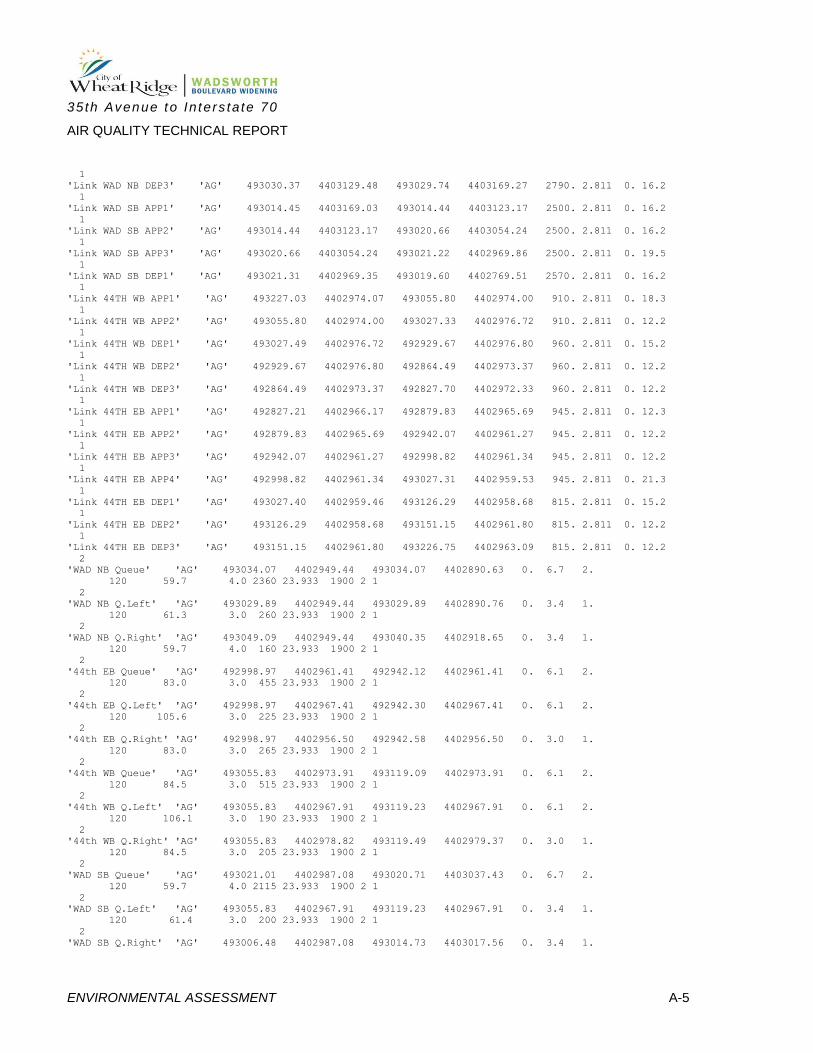
35th Avenue to In ters ta te 70
AIR QUALITY TECHNICAL REPORT
ENVIRONMENTAL ASSESSMENT A-5
1
'Link WAD NB DEP3' 'AG' 493030.37 4403129.48 493029.74 4403169.27 2790. 2.811 0. 16.2
1
'Link WAD SB APP1' 'AG' 493014.45 4403169.03 493014.44 4403123.17 2500. 2.811 0. 16.2
1
'Link WAD SB APP2' 'AG' 493014.44 4403123.17 493020.66 4403054.24 2500. 2.811 0. 16.2
1
'Link WAD SB APP3' 'AG' 493020.66 4403054.24 493021.22 4402969.86 2500. 2.811 0. 19.5
1
'Link WAD SB DEP1' 'AG' 493021.31 4402969.35 493019.60 4402769.51 2570. 2.811 0. 16.2
1
'Link 44TH WB APP1' 'AG' 493227.03 4402974.07 493055.80 4402974.00 910. 2.811 0. 18.3
1
'Link 44TH WB APP2' 'AG' 493055.80 4402974.00 493027.33 4402976.72 910. 2.811 0. 12.2
1
'Link 44TH WB DEP1' 'AG' 493027.49 4402976.72 492929.67 4402976.80 960. 2.811 0. 15.2
1
'Link 44TH WB DEP2' 'AG' 492929.67 4402976.80 492864.49 4402973.37 960. 2.811 0. 12.2
1
'Link 44TH WB DEP3' 'AG' 492864.49 4402973.37 492827.70 4402972.33 960. 2.811 0. 12.2
1
'Link 44TH EB APP1' 'AG' 492827.21 4402966.17 492879.83 4402965.69 945. 2.811 0. 12.3
1
'Link 44TH EB APP2' 'AG' 492879.83 4402965.69 492942.07 4402961.27 945. 2.811 0. 12.2
1
'Link 44TH EB APP3' 'AG' 492942.07 4402961.27 492998.82 4402961.34 945. 2.811 0. 12.2
1
'Link 44TH EB APP4' 'AG' 492998.82 4402961.34 493027.31 4402959.53 945. 2.811 0. 21.3
1
'Link 44TH EB DEP1' 'AG' 493027.40 4402959.46 493126.29 4402958.68 815. 2.811 0. 15.2
1
'Link 44TH EB DEP2' 'AG' 493126.29 4402958.68 493151.15 4402961.80 815. 2.811 0. 12.2
1
'Link 44TH EB DEP3' 'AG' 493151.15 4402961.80 493226.75 4402963.09 815. 2.811 0. 12.2
2
'WAD NB Queue' 'AG' 493034.07 4402949.44 493034.07 4402890.63 0. 6.7 2.
120 59.7 4.0 2360 23.933 1900 2 1
2
'WAD NB Q.Left' 'AG' 493029.89 4402949.44 493029.89 4402890.76 0. 3.4 1.
120 61.3 3.0 260 23.933 1900 2 1
2
'WAD NB Q.Right' 'AG' 493049.09 4402949.44 493040.35 4402918.65 0. 3.4 1.
120 59.7 4.0 160 23.933 1900 2 1
2
'44th EB Queue' 'AG' 492998.97 4402961.41 492942.12 4402961.41 0. 6.1 2.
120 83.0 3.0 455 23.933 1900 2 1
2
'44th EB Q.Left' 'AG' 492998.97 4402967.41 492942.30 4402967.41 0. 6.1 2.
120 105.6 3.0 225 23.933 1900 2 1
2
'44th EB Q.Right' 'AG' 492998.97 4402956.50 492942.58 4402956.50 0. 3.0 1.
120 83.0 3.0 265 23.933 1900 2 1
2
'44th WB Queue' 'AG' 493055.83 4402973.91 493119.09 4402973.91 0. 6.1 2.
120 84.5 3.0 515 23.933 1900 2 1
2
'44th WB Q.Left' 'AG' 493055.83 4402967.91 493119.23 4402967.91 0. 6.1 2.
120 106.1 3.0 190 23.933 1900 2 1
2
'44th WB Q.Right' 'AG' 493055.83 4402978.82 493119.49 4402979.37 0. 3.0 1.
120 84.5 3.0 205 23.933 1900 2 1
2
'WAD SB Queue' 'AG' 493021.01 4402987.08 493020.71 4403037.43 0. 6.7 2.
120 59.7 4.0 2115 23.933 1900 2 1
2
'WAD SB Q.Left' 'AG' 493055.83 4402967.91 493119.23 4402967.91 0. 3.4 1.
120 61.4 3.0 200 23.933 1900 2 1
2
'WAD SB Q.Right' 'AG' 493006.48 4402987.08 493014.73 4403017.56 0. 3.4 1.

35th Avenue to In ters ta te 70
AIR QUALITY TECHNICAL REPORT
ENVIRONMENTAL ASSESSMENT A-6
120 59.7 4.0 185 23.933 1900 2 1
1.00 0.00 4 1000. 0.00 'Y' 10 0 36
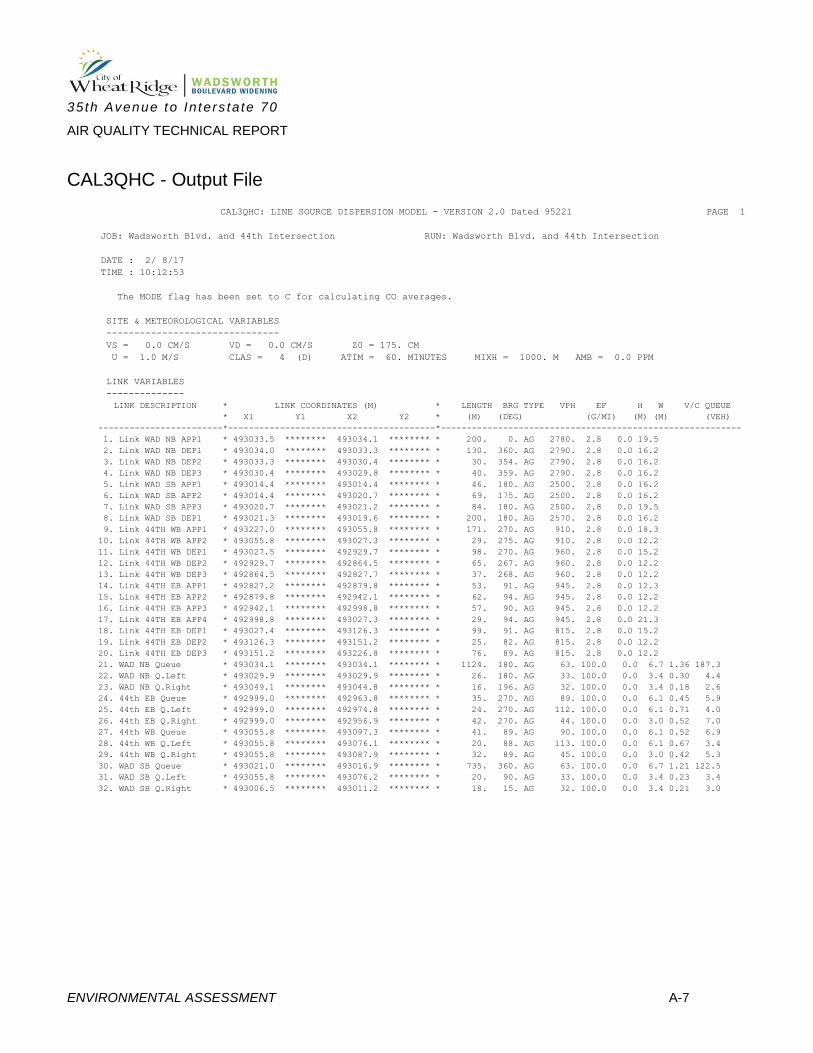
35th Avenue to In ters ta te 70
AIR QUALITY TECHNICAL REPORT
ENVIRONMENTAL ASSESSMENT A-7
CAL3QHC - Output File
CAL3QHC: LINE SOURCE DISPERSION MODEL - VERSION 2.0 Dated 95221 PAGE 1
JOB: Wadsworth Blvd. and 44th Intersection RUN: Wadsworth Blvd. and 44th Intersection
DATE : 2/ 8/17
TIME : 10:12:53
The MODE flag has been set to C for calculating CO averages.
SITE & METEOROLOGICAL VARIABLES
-------------------------------
VS = 0.0 CM/S VD = 0.0 CM/S Z0 = 175. CM
U = 1.0 M/S CLAS = 4 (D) ATIM = 60. MINUTES MIXH = 1000. M AMB = 0.0 PPM
LINK VARIABLES
--------------
LINK DESCRIPTION * LINK COORDINATES (M) * LENGTH BRG TYPE VPH EF H W V/C QUEUE
* X1 Y1 X2 Y2 * (M) (DEG) (G/MI) (M) (M) (VEH)
------------------------*----------------------------------------*----------------------------------------------------------
1. Link WAD NB APP1 * 493033.5 ******** 493034.1 ******** * 200. 0. AG 2780. 2.8 0.0 19.5
2. Link WAD NB DEP1 * 493034.0 ******** 493033.3 ******** * 130. 360. AG 2790. 2.8 0.0 16.2
3. Link WAD NB DEP2 * 493033.3 ******** 493030.4 ******** * 30. 354. AG 2790. 2.8 0.0 16.2
4. Link WAD NB DEP3 * 493030.4 ******** 493029.8 ******** * 40. 359. AG 2790. 2.8 0.0 16.2
5. Link WAD SB APP1 * 493014.4 ******** 493014.4 ******** * 46. 180. AG 2500. 2.8 0.0 16.2
6. Link WAD SB APP2 * 493014.4 ******** 493020.7 ******** * 69. 175. AG 2500. 2.8 0.0 16.2
7. Link WAD SB APP3 * 493020.7 ******** 493021.2 ******** * 84. 180. AG 2500. 2.8 0.0 19.5
8. Link WAD SB DEP1 * 493021.3 ******** 493019.6 ******** * 200. 180. AG 2570. 2.8 0.0 16.2
9. Link 44TH WB APP1 * 493227.0 ******** 493055.8 ******** * 171. 270. AG 910. 2.8 0.0 18.3
10. Link 44TH WB APP2 * 493055.8 ******** 493027.3 ******** * 29. 275. AG 910. 2.8 0.0 12.2
11. Link 44TH WB DEP1 * 493027.5 ******** 492929.7 ******** * 98. 270. AG 960. 2.8 0.0 15.2
12. Link 44TH WB DEP2 * 492929.7 ******** 492864.5 ******** * 65. 267. AG 960. 2.8 0.0 12.2
13. Link 44TH WB DEP3 * 492864.5 ******** 492827.7 ******** * 37. 268. AG 960. 2.8 0.0 12.2
14. Link 44TH EB APP1 * 492827.2 ******** 492879.8 ******** * 53. 91. AG 945. 2.8 0.0 12.3
15. Link 44TH EB APP2 * 492879.8 ******** 492942.1 ******** * 62. 94. AG 945. 2.8 0.0 12.2
16. Link 44TH EB APP3 * 492942.1 ******** 492998.8 ******** * 57. 90. AG 945. 2.8 0.0 12.2
17. Link 44TH EB APP4 * 492998.8 ******** 493027.3 ******** * 29. 94. AG 945. 2.8 0.0 21.3
18. Link 44TH EB DEP1 * 493027.4 ******** 493126.3 ******** * 99. 91. AG 815. 2.8 0.0 15.2
19. Link 44TH EB DEP2 * 493126.3 ******** 493151.2 ******** * 25. 82. AG 815. 2.8 0.0 12.2
20. Link 44TH EB DEP3 * 493151.2 ******** 493226.8 ******** * 76. 89. AG 815. 2.8 0.0 12.2
21. WAD NB Queue * 493034.1 ******** 493034.1 ******** * 1124. 180. AG 63. 100.0 0.0 6.7 1.36 187.3
22. WAD NB Q.Left * 493029.9 ******** 493029.9 ******** * 26. 180. AG 33. 100.0 0.0 3.4 0.30 4.4
23. WAD NB Q.Right * 493049.1 ******** 493044.8 ******** * 16. 196. AG 32. 100.0 0.0 3.4 0.18 2.6
24. 44th EB Queue * 492999.0 ******** 492963.8 ******** * 35. 270. AG 89. 100.0 0.0 6.1 0.45 5.9
25. 44th EB Q.Left * 492999.0 ******** 492974.8 ******** * 24. 270. AG 112. 100.0 0.0 6.1 0.71 4.0
26. 44th EB Q.Right * 492999.0 ******** 492956.9 ******** * 42. 270. AG 44. 100.0 0.0 3.0 0.52 7.0
27. 44th WB Queue * 493055.8 ******** 493097.3 ******** * 41. 89. AG 90. 100.0 0.0 6.1 0.52 6.9
28. 44th WB Q.Left * 493055.8 ******** 493076.1 ******** * 20. 88. AG 113. 100.0 0.0 6.1 0.67 3.4
29. 44th WB Q.Right * 493055.8 ******** 493087.9 ******** * 32. 89. AG 45. 100.0 0.0 3.0 0.42 5.3
30. WAD SB Queue * 493021.0 ******** 493016.9 ******** * 735. 360. AG 63. 100.0 0.0 6.7 1.21 122.5
31. WAD SB Q.Left * 493055.8 ******** 493076.2 ******** * 20. 90. AG 33. 100.0 0.0 3.4 0.23 3.4
32. WAD SB Q.Right * 493006.5 ******** 493011.2 ******** * 18. 15. AG 32. 100.0 0.0 3.4 0.21 3.0
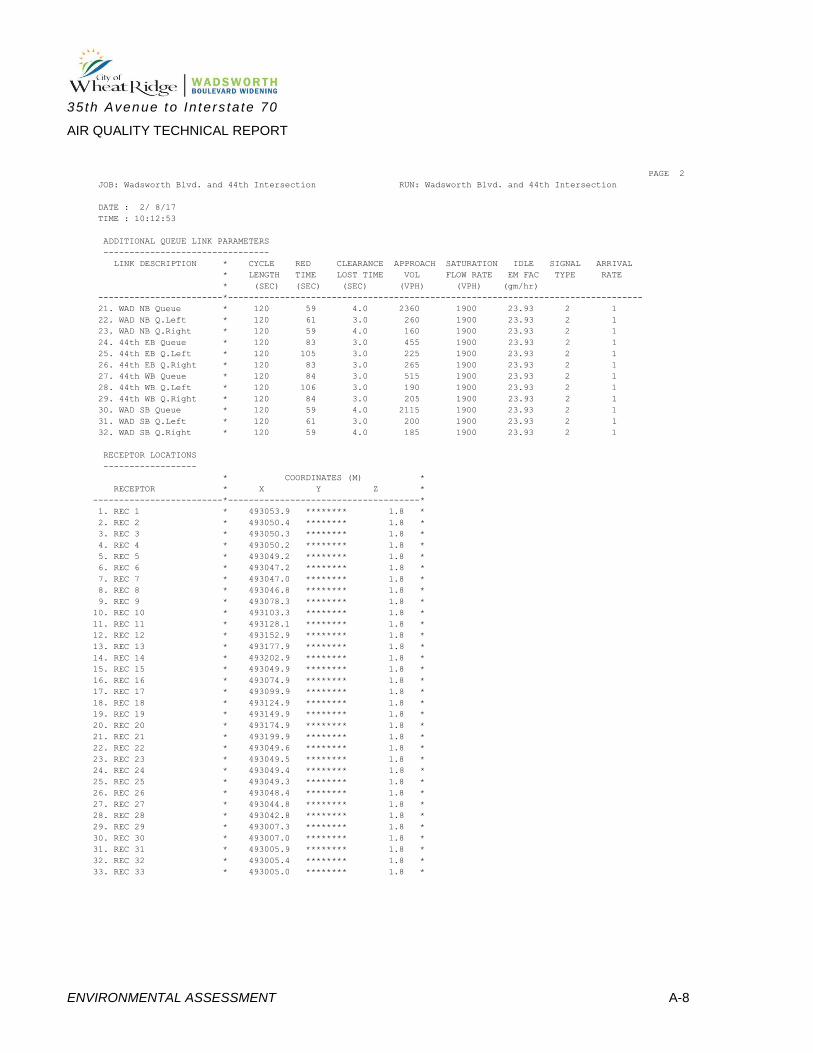
35th Avenue to In ters ta te 70
AIR QUALITY TECHNICAL REPORT
ENVIRONMENTAL ASSESSMENT A-8
PAGE 2
JOB: Wadsworth Blvd. and 44th Intersection RUN: Wadsworth Blvd. and 44th Intersection
DATE : 2/ 8/17
TIME : 10:12:53
ADDITIONAL QUEUE LINK PARAMETERS
--------------------------------
LINK DESCRIPTION * CYCLE RED CLEARANCE APPROACH SATURATION IDLE SIGNAL ARRIVAL
* LENGTH TIME LOST TIME VOL FLOW RATE EM FAC TYPE RATE
* (SEC) (SEC) (SEC) (VPH) (VPH) (gm/hr)
------------------------*--------------------------------------------------------------------------------
21. WAD NB Queue * 120 59 4.0 2360 1900 23.93 2 1
22. WAD NB Q.Left * 120 61 3.0 260 1900 23.93 2 1
23. WAD NB Q.Right * 120 59 4.0 160 1900 23.93 2 1
24. 44th EB Queue * 120 83 3.0 455 1900 23.93 2 1
25. 44th EB Q.Left * 120 105 3.0 225 1900 23.93 2 1
26. 44th EB Q.Right * 120 83 3.0 265 1900 23.93 2 1
27. 44th WB Queue * 120 84 3.0 515 1900 23.93 2 1
28. 44th WB Q.Left * 120 106 3.0 190 1900 23.93 2 1
29. 44th WB Q.Right * 120 84 3.0 205 1900 23.93 2 1
30. WAD SB Queue * 120 59 4.0 2115 1900 23.93 2 1
31. WAD SB Q.Left * 120 61 3.0 200 1900 23.93 2 1
32. WAD SB Q.Right * 120 59 4.0 185 1900 23.93 2 1
RECEPTOR LOCATIONS
------------------
* COORDINATES (M) *
RECEPTOR * X Y Z *
-------------------------*-------------------------------------*
1. REC 1 * 493053.9 ******** 1.8 *
2. REC 2 * 493050.4 ******** 1.8 *
3. REC 3 * 493050.3 ******** 1.8 *
4. REC 4 * 493050.2 ******** 1.8 *
5. REC 5 * 493049.2 ******** 1.8 *
6. REC 6 * 493047.2 ******** 1.8 *
7. REC 7 * 493047.0 ******** 1.8 *
8. REC 8 * 493046.8 ******** 1.8 *
9. REC 9 * 493078.3 ******** 1.8 *
10. REC 10 * 493103.3 ******** 1.8 *
11. REC 11 * 493128.1 ******** 1.8 *
12. REC 12 * 493152.9 ******** 1.8 *
13. REC 13 * 493177.9 ******** 1.8 *
14. REC 14 * 493202.9 ******** 1.8 *
15. REC 15 * 493049.9 ******** 1.8 *
16. REC 16 * 493074.9 ******** 1.8 *
17. REC 17 * 493099.9 ******** 1.8 *
18. REC 18 * 493124.9 ******** 1.8 *
19. REC 19 * 493149.9 ******** 1.8 *
20. REC 20 * 493174.9 ******** 1.8 *
21. REC 21 * 493199.9 ******** 1.8 *
22. REC 22 * 493049.6 ******** 1.8 *
23. REC 23 * 493049.5 ******** 1.8 *
24. REC 24 * 493049.4 ******** 1.8 *
25. REC 25 * 493049.3 ******** 1.8 *
26. REC 26 * 493048.4 ******** 1.8 *
27. REC 27 * 493044.8 ******** 1.8 *
28. REC 28 * 493042.8 ******** 1.8 *
29. REC 29 * 493007.3 ******** 1.8 *
30. REC 30 * 493007.0 ******** 1.8 *
31. REC 31 * 493005.9 ******** 1.8 *
32. REC 32 * 493005.4 ******** 1.8 *
33. REC 33 * 493005.0 ******** 1.8 *

35th Avenue to In ters ta te 70
AIR QUALITY TECHNICAL REPORT
ENVIRONMENTAL ASSESSMENT A-9
PAGE 3
JOB: Wadsworth Blvd. and 44th Intersection RUN: Wadsworth Blvd. and 44th Intersection
DATE : 2/ 8/17
TIME : 10:12:53
RECEPTOR LOCATIONS
* COORDINATES (M) *
RECEPTOR * X Y Z *
-------------------------*-------------------------------------*
34. REC 34 * 493004.0 ******** 1.8 *
35. REC 35 * 493003.5 ******** 1.8 *
36. REC 36 * 493003.6 ******** 1.8 *
37. REC 37 * 492982.5 ******** 1.8 *
38. REC 38 * 492957.5 ******** 1.8 *
39. REC 39 * 492932.5 ******** 1.8 *
40. REC 40 * 492907.6 ******** 1.8 *
41. REC 41 * 492882.6 ******** 1.8 *
42. REC 42 * 492857.7 ******** 1.8 *
43. REC 43 * 492832.7 ******** 1.8 *
44. REC 44 * 493005.3 ******** 1.8 *
45. REC 45 * 493005.4 ******** 1.8 *
46. REC 46 * 493005.4 ******** 1.8 *
47. REC 47 * 493005.4 ******** 1.8 *
48. REC 48 * 493005.4 ******** 1.8 *
49. REC 49 * 493005.4 ******** 1.8 *
50. REC 50 * 493005.8 ******** 1.8 *
51. REC 51 * 493007.3 ******** 1.8 *
52. REC 52 * 492980.2 ******** 1.8 *
53. REC 53 * 492955.2 ******** 1.8 *
54. REC 54 * 492930.4 ******** 1.8 *
55. REC 55 * 492905.6 ******** 1.8 *
56. REC 56 * 492880.6 ******** 1.8 *
57. REC 57 * 492855.6 ******** 1.8 *
58. REC 58 * 492830.6 ******** 1.8 *

35th Avenue to In ters ta te 70
AIR QUALITY TECHNICAL REPORT
ENVIRONMENTAL ASSESSMENT A-10
PAGE 4
JOB: Wadsworth Blvd. and 44th Intersection RUN: Wadsworth Blvd. and 44th Intersection
MODEL RESULTS
-------------
REMARKS : In search of the angle corresponding to
the maximum concentration, only the first
angle, of the angles with same maximum
concentrations, is indicated as maximum.
WIND ANGLE RANGE: 0.-360.
WIND * CONCENTRATION
ANGLE * (PPM)
(DEGR)* REC1 REC2 REC3 REC4 REC5 REC6 REC7 REC8 REC9 REC10 REC11 REC12 REC13 REC14 REC15 REC16 REC17 REC18 REC19 REC20
------*------------------------------------------------------------------------------------------------------------------------
0. * 0.4 0.2 0.3 0.3 0.3 0.3 0.3 0.4 0.2 0.1 0.1 0.2 0.2 0.2 0.2 0.0 0.0 0.0 0.0 0.0
10. * 0.3 0.1 0.0 0.0 0.0 0.1 0.1 0.1 0.2 0.1 0.1 0.2 0.2 0.2 0.0 0.0 0.0 0.0 0.0 0.0
20. * 0.3 0.2 0.0 0.0 0.0 0.0 0.0 0.0 0.2 0.1 0.1 0.2 0.2 0.2 0.0 0.0 0.0 0.0 0.0 0.0
30. * 0.3 0.1 0.0 0.0 0.0 0.0 0.0 0.0 0.2 0.1 0.2 0.2 0.2 0.1 0.0 0.0 0.0 0.0 0.0 0.0
40. * 0.3 0.0 0.0 0.0 0.0 0.0 0.0 0.0 0.2 0.1 0.2 0.2 0.2 0.1 0.0 0.0 0.0 0.0 0.0 0.0
50. * 0.3 0.0 0.0 0.0 0.0 0.0 0.0 0.0 0.2 0.2 0.2 0.2 0.2 0.1 0.0 0.0 0.0 0.0 0.0 0.0
60. * 0.3 0.0 0.0 0.0 0.0 0.0 0.0 0.0 0.2 0.2 0.2 0.2 0.1 0.1 0.0 0.0 0.0 0.0 0.0 0.0
70. * 0.1 0.0 0.0 0.0 0.0 0.0 0.0 0.0 0.2 0.2 0.1 0.2 0.1 0.1 0.0 0.0 0.0 0.0 0.0 0.0
80. * 0.1 0.0 0.0 0.0 0.0 0.0 0.0 0.0 0.1 0.1 0.1 0.1 0.1 0.0 0.0 0.0 0.0 0.0 0.0 0.0
90. * 0.0 0.0 0.0 0.0 0.0 0.0 0.0 0.0 0.1 0.0 0.0 0.1 0.0 0.0 0.3 0.1 0.1 0.1 0.1 0.1
100. * 0.0 0.0 0.0 0.0 0.0 0.0 0.0 0.0 0.0 0.0 0.0 0.0 0.0 0.0 0.4 0.3 0.1 0.1 0.1 0.1
110. * 0.0 0.0 0.0 0.0 0.0 0.0 0.0 0.0 0.0 0.0 0.0 0.0 0.0 0.0 0.5 0.3 0.1 0.1 0.1 0.1
120. * 0.0 0.0 0.0 0.0 0.0 0.0 0.0 0.0 0.0 0.0 0.0 0.0 0.0 0.0 0.5 0.4 0.1 0.1 0.1 0.1
130. * 0.0 0.0 0.0 0.0 0.0 0.0 0.0 0.0 0.0 0.0 0.0 0.0 0.0 0.0 0.6 0.4 0.1 0.1 0.1 0.1
140. * 0.0 0.0 0.0 0.0 0.0 0.0 0.0 0.0 0.0 0.0 0.0 0.0 0.0 0.0 0.4 0.4 0.1 0.1 0.1 0.1
150. * 0.0 0.0 0.0 0.0 0.0 0.0 0.0 0.0 0.0 0.0 0.0 0.0 0.0 0.0 0.2 0.4 0.1 0.1 0.1 0.1
160. * 0.0 0.0 0.0 0.0 0.0 0.0 0.0 0.0 0.0 0.0 0.0 0.0 0.0 0.0 0.2 0.4 0.1 0.1 0.1 0.1
170. * 0.0 0.0 0.0 0.1 0.1 0.1 0.1 0.1 0.0 0.0 0.0 0.0 0.0 0.0 0.2 0.5 0.1 0.1 0.1 0.1
180. * 0.2 0.2 0.2 0.2 0.2 0.2 0.2 0.2 0.1 0.0 0.0 0.0 0.0 0.0 0.3 0.6 0.1 0.1 0.1 0.1
190. * 0.4 0.5 0.5 0.5 0.4 0.4 0.3 0.2 0.2 0.1 0.0 0.0 0.0 0.0 0.5 0.8 0.3 0.1 0.1 0.1
200. * 0.4 0.4 0.4 0.5 0.5 0.4 0.4 0.2 0.3 0.1 0.0 0.0 0.0 0.0 0.5 0.9 0.4 0.1 0.1 0.1
210. * 0.4 0.4 0.4 0.4 0.4 0.5 0.4 0.2 0.3 0.2 0.0 0.0 0.0 0.0 0.6 0.9 0.6 0.2 0.1 0.1
220. * 0.5 0.4 0.4 0.4 0.4 0.4 0.4 0.2 0.3 0.2 0.1 0.0 0.0 0.0 0.4 0.8 0.5 0.2 0.1 0.1
230. * 0.5 0.4 0.4 0.4 0.4 0.4 0.4 0.1 0.3 0.2 0.1 0.0 0.0 0.0 0.4 0.7 0.6 0.2 0.1 0.1
240. * 0.5 0.4 0.4 0.4 0.4 0.4 0.4 0.2 0.3 0.2 0.1 0.0 0.0 0.0 0.3 0.6 0.6 0.3 0.1 0.1
250. * 0.5 0.4 0.4 0.4 0.4 0.4 0.4 0.2 0.3 0.2 0.1 0.0 0.0 0.0 0.4 0.3 0.6 0.2 0.1 0.1
260. * 0.5 0.4 0.4 0.4 0.4 0.4 0.4 0.3 0.2 0.2 0.2 0.0 0.0 0.0 0.4 0.2 0.3 0.2 0.2 0.1
270. * 0.5 0.4 0.4 0.4 0.4 0.4 0.4 0.4 0.3 0.2 0.1 0.1 0.0 0.0 0.4 0.2 0.4 0.2 0.1 0.1
280. * 0.4 0.4 0.4 0.4 0.4 0.4 0.4 0.4 0.3 0.2 0.2 0.1 0.1 0.1 0.3 0.2 0.2 0.1 0.0 0.0
290. * 0.3 0.4 0.4 0.4 0.4 0.4 0.4 0.4 0.2 0.3 0.2 0.2 0.2 0.2 0.4 0.2 0.2 0.1 0.0 0.0
300. * 0.3 0.4 0.4 0.4 0.4 0.4 0.4 0.4 0.4 0.4 0.4 0.2 0.2 0.2 0.4 0.2 0.1 0.1 0.0 0.0
310. * 0.4 0.4 0.4 0.4 0.4 0.4 0.4 0.4 0.4 0.3 0.3 0.2 0.2 0.2 0.4 0.3 0.1 0.0 0.0 0.0
320. * 0.4 0.4 0.4 0.4 0.4 0.4 0.4 0.5 0.6 0.3 0.2 0.2 0.2 0.2 0.4 0.2 0.1 0.0 0.0 0.0
330. * 0.5 0.5 0.4 0.4 0.4 0.6 0.6 0.6 0.6 0.3 0.2 0.2 0.2 0.2 0.4 0.2 0.0 0.0 0.0 0.0
340. * 0.5 0.5 0.6 0.4 0.4 0.6 0.6 0.6 0.5 0.2 0.0 0.1 0.2 0.2 0.5 0.2 0.1 0.0 0.0 0.0
350. * 0.3 0.4 0.4 0.5 0.5 0.5 0.5 0.6 0.4 0.1 0.0 0.1 0.2 0.2 0.3 0.1 0.0 0.0 0.0 0.0
360. * 0.4 0.2 0.3 0.3 0.3 0.3 0.3 0.4 0.2 0.1 0.1 0.2 0.2 0.2 0.2 0.0 0.0 0.0 0.0 0.0
------*------------------------------------------------------------------------------------------------------------------------
MAX * 0.5 0.5 0.6 0.5 0.5 0.6 0.6 0.6 0.6 0.4 0.4 0.2 0.2 0.2 0.6 0.9 0.6 0.3 0.2 0.1
DEGR. * 220 190 340 190 200 330 330 330 320 300 300 0 0 0 130 200 210 240 260 90
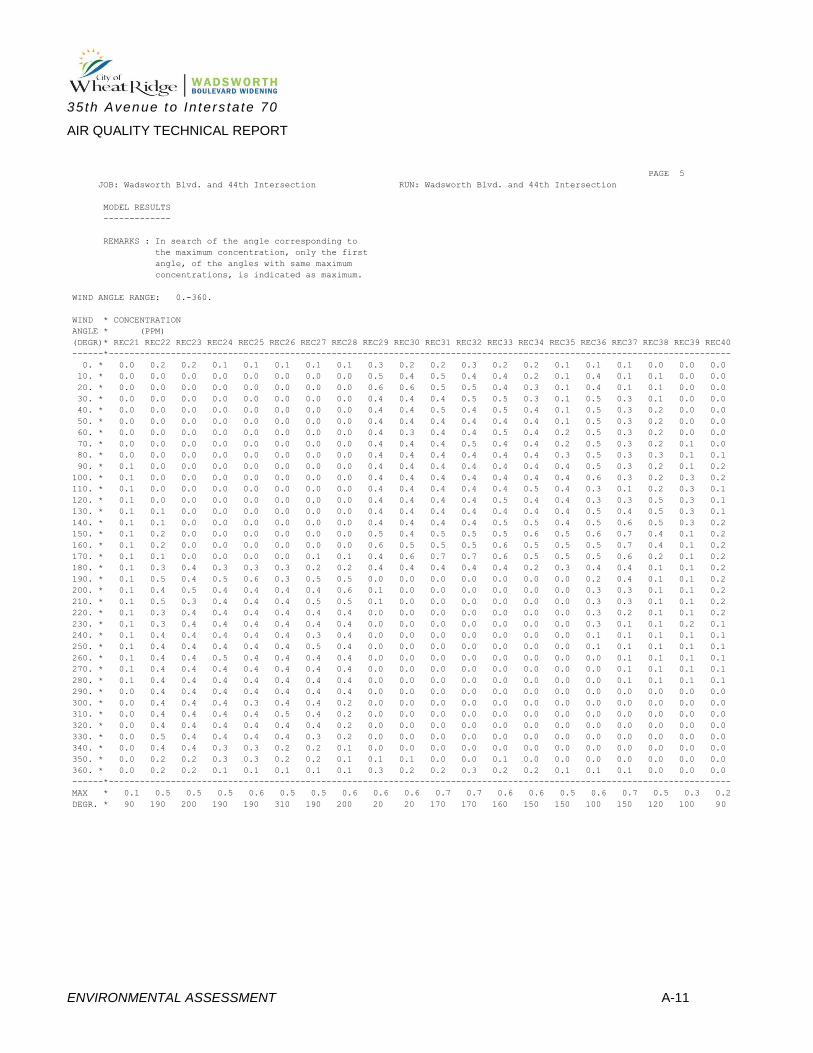
35th Avenue to In ters ta te 70
AIR QUALITY TECHNICAL REPORT
ENVIRONMENTAL ASSESSMENT A-11
PAGE 5
JOB: Wadsworth Blvd. and 44th Intersection RUN: Wadsworth Blvd. and 44th Intersection
MODEL RESULTS
-------------
REMARKS : In search of the angle corresponding to
the maximum concentration, only the first
angle, of the angles with same maximum
concentrations, is indicated as maximum.
WIND ANGLE RANGE: 0.-360.
WIND * CONCENTRATION
ANGLE * (PPM)
(DEGR)* REC21 REC22 REC23 REC24 REC25 REC26 REC27 REC28 REC29 REC30 REC31 REC32 REC33 REC34 REC35 REC36 REC37 REC38 REC39 REC40
------*------------------------------------------------------------------------------------------------------------------------
0. * 0.0 0.2 0.2 0.1 0.1 0.1 0.1 0.1 0.3 0.2 0.2 0.3 0.2 0.2 0.1 0.1 0.1 0.0 0.0 0.0
10. * 0.0 0.0 0.0 0.0 0.0 0.0 0.0 0.0 0.5 0.4 0.5 0.4 0.4 0.2 0.1 0.4 0.1 0.1 0.0 0.0
20. * 0.0 0.0 0.0 0.0 0.0 0.0 0.0 0.0 0.6 0.6 0.5 0.5 0.4 0.3 0.1 0.4 0.1 0.1 0.0 0.0
30. * 0.0 0.0 0.0 0.0 0.0 0.0 0.0 0.0 0.4 0.4 0.4 0.5 0.5 0.3 0.1 0.5 0.3 0.1 0.0 0.0
40. * 0.0 0.0 0.0 0.0 0.0 0.0 0.0 0.0 0.4 0.4 0.5 0.4 0.5 0.4 0.1 0.5 0.3 0.2 0.0 0.0
50. * 0.0 0.0 0.0 0.0 0.0 0.0 0.0 0.0 0.4 0.4 0.4 0.4 0.4 0.4 0.1 0.5 0.3 0.2 0.0 0.0
60. * 0.0 0.0 0.0 0.0 0.0 0.0 0.0 0.0 0.4 0.3 0.4 0.4 0.5 0.4 0.2 0.5 0.3 0.2 0.0 0.0
70. * 0.0 0.0 0.0 0.0 0.0 0.0 0.0 0.0 0.4 0.4 0.4 0.5 0.4 0.4 0.2 0.5 0.3 0.2 0.1 0.0
80. * 0.0 0.0 0.0 0.0 0.0 0.0 0.0 0.0 0.4 0.4 0.4 0.4 0.4 0.4 0.3 0.5 0.3 0.3 0.1 0.1
90. * 0.1 0.0 0.0 0.0 0.0 0.0 0.0 0.0 0.4 0.4 0.4 0.4 0.4 0.4 0.4 0.5 0.3 0.2 0.1 0.2
100. * 0.1 0.0 0.0 0.0 0.0 0.0 0.0 0.0 0.4 0.4 0.4 0.4 0.4 0.4 0.4 0.6 0.3 0.2 0.3 0.2
110. * 0.1 0.0 0.0 0.0 0.0 0.0 0.0 0.0 0.4 0.4 0.4 0.4 0.4 0.5 0.4 0.3 0.1 0.2 0.3 0.1
120. * 0.1 0.0 0.0 0.0 0.0 0.0 0.0 0.0 0.4 0.4 0.4 0.4 0.5 0.4 0.4 0.3 0.3 0.5 0.3 0.1
130. * 0.1 0.1 0.0 0.0 0.0 0.0 0.0 0.0 0.4 0.4 0.4 0.4 0.4 0.4 0.4 0.5 0.4 0.5 0.3 0.1
140. * 0.1 0.1 0.0 0.0 0.0 0.0 0.0 0.0 0.4 0.4 0.4 0.4 0.5 0.5 0.4 0.5 0.6 0.5 0.3 0.2
150. * 0.1 0.2 0.0 0.0 0.0 0.0 0.0 0.0 0.5 0.4 0.5 0.5 0.5 0.6 0.5 0.6 0.7 0.4 0.1 0.2
160. * 0.1 0.2 0.0 0.0 0.0 0.0 0.0 0.0 0.6 0.5 0.5 0.5 0.6 0.5 0.5 0.5 0.7 0.4 0.1 0.2
170. * 0.1 0.1 0.0 0.0 0.0 0.0 0.1 0.1 0.4 0.6 0.7 0.7 0.6 0.5 0.5 0.5 0.6 0.2 0.1 0.2
180. * 0.1 0.3 0.4 0.3 0.3 0.3 0.2 0.2 0.4 0.4 0.4 0.4 0.4 0.2 0.3 0.4 0.4 0.1 0.1 0.2
190. * 0.1 0.5 0.4 0.5 0.6 0.3 0.5 0.5 0.0 0.0 0.0 0.0 0.0 0.0 0.0 0.2 0.4 0.1 0.1 0.2
200. * 0.1 0.4 0.5 0.4 0.4 0.4 0.4 0.6 0.1 0.0 0.0 0.0 0.0 0.0 0.0 0.3 0.3 0.1 0.1 0.2
210. * 0.1 0.5 0.3 0.4 0.4 0.4 0.5 0.5 0.1 0.0 0.0 0.0 0.0 0.0 0.0 0.3 0.3 0.1 0.1 0.2
220. * 0.1 0.3 0.4 0.4 0.4 0.4 0.4 0.4 0.0 0.0 0.0 0.0 0.0 0.0 0.0 0.3 0.2 0.1 0.1 0.2
230. * 0.1 0.3 0.4 0.4 0.4 0.4 0.4 0.4 0.0 0.0 0.0 0.0 0.0 0.0 0.0 0.3 0.1 0.1 0.2 0.1
240. * 0.1 0.4 0.4 0.4 0.4 0.4 0.3 0.4 0.0 0.0 0.0 0.0 0.0 0.0 0.0 0.1 0.1 0.1 0.1 0.1
250. * 0.1 0.4 0.4 0.4 0.4 0.4 0.5 0.4 0.0 0.0 0.0 0.0 0.0 0.0 0.0 0.1 0.1 0.1 0.1 0.1
260. * 0.1 0.4 0.4 0.5 0.4 0.4 0.4 0.4 0.0 0.0 0.0 0.0 0.0 0.0 0.0 0.0 0.1 0.1 0.1 0.1
270. * 0.1 0.4 0.4 0.4 0.4 0.4 0.4 0.4 0.0 0.0 0.0 0.0 0.0 0.0 0.0 0.0 0.1 0.1 0.1 0.1
280. * 0.1 0.4 0.4 0.4 0.4 0.4 0.4 0.4 0.0 0.0 0.0 0.0 0.0 0.0 0.0 0.0 0.1 0.1 0.1 0.1
290. * 0.0 0.4 0.4 0.4 0.4 0.4 0.4 0.4 0.0 0.0 0.0 0.0 0.0 0.0 0.0 0.0 0.0 0.0 0.0 0.0
300. * 0.0 0.4 0.4 0.4 0.3 0.4 0.4 0.2 0.0 0.0 0.0 0.0 0.0 0.0 0.0 0.0 0.0 0.0 0.0 0.0
310. * 0.0 0.4 0.4 0.4 0.4 0.5 0.4 0.2 0.0 0.0 0.0 0.0 0.0 0.0 0.0 0.0 0.0 0.0 0.0 0.0
320. * 0.0 0.4 0.4 0.4 0.4 0.4 0.4 0.2 0.0 0.0 0.0 0.0 0.0 0.0 0.0 0.0 0.0 0.0 0.0 0.0
330. * 0.0 0.5 0.4 0.4 0.4 0.4 0.3 0.2 0.0 0.0 0.0 0.0 0.0 0.0 0.0 0.0 0.0 0.0 0.0 0.0
340. * 0.0 0.4 0.4 0.3 0.3 0.2 0.2 0.1 0.0 0.0 0.0 0.0 0.0 0.0 0.0 0.0 0.0 0.0 0.0 0.0
350. * 0.0 0.2 0.2 0.3 0.3 0.2 0.2 0.1 0.1 0.1 0.0 0.0 0.1 0.0 0.0 0.0 0.0 0.0 0.0 0.0
360. * 0.0 0.2 0.2 0.1 0.1 0.1 0.1 0.1 0.3 0.2 0.2 0.3 0.2 0.2 0.1 0.1 0.1 0.0 0.0 0.0
------*------------------------------------------------------------------------------------------------------------------------
MAX * 0.1 0.5 0.5 0.5 0.6 0.5 0.5 0.6 0.6 0.6 0.7 0.7 0.6 0.6 0.5 0.6 0.7 0.5 0.3 0.2
DEGR. * 90 190 200 190 190 310 190 200 20 20 170 170 160 150 150 100 150 120 100 90

35th Avenue to In ters ta te 70
AIR QUALITY TECHNICAL REPORT
ENVIRONMENTAL ASSESSMENT A-12
PAGE 6
JOB: Wadsworth Blvd. and 44th Intersection RUN: Wadsworth Blvd. and 44th Intersection
MODEL RESULTS
-------------
REMARKS : In search of the angle corresponding to
the maximum concentration, only the first
angle, of the angles with same maximum
concentrations, is indicated as maximum.
WIND ANGLE RANGE: 0.-360.
WIND * CONCENTRATION
ANGLE * (PPM)
(DEGR)* REC41 REC42 REC43 REC44 REC45 REC46 REC47 REC48 REC49 REC50 REC51 REC52 REC53 REC54 REC55 REC56 REC57 REC58
------*------------------------------------------------------------------------------------------------------------
0. * 0.0 0.0 0.0 0.3 0.2 0.3 0.2 0.2 0.2 0.1 0.3 0.6 0.1 0.1 0.2 0.2 0.2 0.2
10. * 0.0 0.0 0.0 0.4 0.4 0.4 0.4 0.3 0.3 0.4 0.5 0.7 0.2 0.1 0.2 0.2 0.2 0.2
20. * 0.0 0.0 0.0 0.5 0.4 0.4 0.3 0.4 0.4 0.4 0.6 0.9 0.3 0.1 0.2 0.2 0.2 0.2
30. * 0.0 0.0 0.0 0.5 0.4 0.3 0.4 0.4 0.4 0.5 0.6 0.9 0.3 0.2 0.2 0.2 0.1 0.2
40. * 0.0 0.0 0.0 0.4 0.3 0.4 0.4 0.4 0.4 0.4 0.5 1.0 0.5 0.2 0.1 0.2 0.1 0.2
50. * 0.0 0.0 0.0 0.4 0.3 0.4 0.4 0.4 0.4 0.4 0.4 0.8 0.7 0.2 0.1 0.2 0.2 0.2
60. * 0.0 0.0 0.0 0.4 0.4 0.4 0.4 0.4 0.4 0.4 0.4 0.8 0.8 0.2 0.1 0.2 0.2 0.2
70. * 0.1 0.0 0.1 0.5 0.4 0.4 0.4 0.4 0.4 0.4 0.4 0.4 0.6 0.4 0.2 0.2 0.2 0.2
80. * 0.1 0.2 0.1 0.5 0.4 0.4 0.4 0.4 0.4 0.4 0.4 0.4 0.6 0.4 0.1 0.2 0.2 0.1
90. * 0.1 0.2 0.1 0.5 0.4 0.4 0.4 0.4 0.4 0.4 0.4 0.3 0.5 0.3 0.1 0.1 0.2 0.1
100. * 0.1 0.2 0.2 0.4 0.4 0.4 0.4 0.4 0.4 0.4 0.4 0.2 0.3 0.0 0.1 0.1 0.1 0.1
110. * 0.2 0.2 0.2 0.4 0.4 0.4 0.4 0.4 0.4 0.4 0.4 0.2 0.2 0.0 0.1 0.1 0.0 0.1
120. * 0.2 0.3 0.2 0.4 0.4 0.4 0.4 0.4 0.4 0.4 0.2 0.2 0.2 0.2 0.0 0.0 0.0 0.0
130. * 0.2 0.2 0.2 0.4 0.4 0.4 0.4 0.4 0.4 0.4 0.2 0.3 0.2 0.2 0.0 0.0 0.0 0.0
140. * 0.2 0.2 0.2 0.4 0.4 0.4 0.4 0.4 0.4 0.4 0.2 0.3 0.2 0.1 0.0 0.0 0.0 0.0
150. * 0.2 0.2 0.2 0.5 0.4 0.4 0.4 0.4 0.4 0.3 0.1 0.3 0.2 0.0 0.0 0.0 0.0 0.0
160. * 0.2 0.2 0.2 0.4 0.4 0.4 0.4 0.4 0.4 0.2 0.1 0.3 0.1 0.0 0.0 0.0 0.0 0.0
170. * 0.2 0.2 0.2 0.4 0.4 0.4 0.4 0.4 0.2 0.2 0.1 0.2 0.0 0.0 0.0 0.0 0.0 0.0
180. * 0.1 0.2 0.2 0.3 0.2 0.2 0.2 0.2 0.2 0.1 0.1 0.0 0.0 0.0 0.0 0.0 0.0 0.0
190. * 0.1 0.2 0.2 0.0 0.0 0.0 0.0 0.0 0.0 0.0 0.0 0.0 0.0 0.0 0.0 0.0 0.0 0.0
200. * 0.1 0.2 0.1 0.0 0.0 0.0 0.0 0.0 0.0 0.0 0.0 0.0 0.0 0.0 0.0 0.0 0.0 0.0
210. * 0.2 0.2 0.1 0.0 0.0 0.0 0.0 0.0 0.0 0.0 0.0 0.0 0.0 0.0 0.0 0.0 0.0 0.0
220. * 0.2 0.2 0.1 0.0 0.0 0.0 0.0 0.0 0.0 0.0 0.0 0.0 0.0 0.0 0.0 0.0 0.0 0.0
230. * 0.2 0.2 0.1 0.0 0.0 0.0 0.0 0.0 0.0 0.0 0.0 0.0 0.0 0.0 0.0 0.0 0.0 0.0
240. * 0.2 0.2 0.1 0.0 0.0 0.0 0.0 0.0 0.0 0.0 0.0 0.0 0.0 0.0 0.0 0.0 0.0 0.0
250. * 0.2 0.2 0.0 0.0 0.0 0.0 0.0 0.0 0.0 0.0 0.0 0.0 0.0 0.0 0.0 0.0 0.0 0.0
260. * 0.2 0.1 0.0 0.1 0.0 0.0 0.0 0.0 0.0 0.0 0.0 0.0 0.0 0.1 0.1 0.1 0.1 0.0
270. * 0.1 0.1 0.0 0.3 0.0 0.0 0.0 0.0 0.0 0.0 0.0 0.1 0.0 0.1 0.1 0.1 0.1 0.0
280. * 0.1 0.1 0.0 0.4 0.0 0.0 0.0 0.0 0.0 0.0 0.0 0.3 0.1 0.1 0.1 0.1 0.1 0.0
290. * 0.0 0.1 0.0 0.5 0.0 0.0 0.0 0.0 0.0 0.0 0.0 0.4 0.1 0.1 0.1 0.1 0.1 0.0
300. * 0.0 0.0 0.0 0.6 0.0 0.0 0.0 0.0 0.0 0.0 0.0 0.5 0.2 0.2 0.2 0.1 0.2 0.0
310. * 0.0 0.0 0.0 0.6 0.1 0.0 0.0 0.0 0.0 0.0 0.0 0.5 0.1 0.2 0.2 0.1 0.2 0.0
320. * 0.0 0.0 0.0 0.5 0.1 0.0 0.0 0.0 0.0 0.0 0.0 0.5 0.1 0.1 0.2 0.2 0.2 0.1
330. * 0.0 0.0 0.0 0.3 0.2 0.0 0.0 0.0 0.0 0.0 0.0 0.5 0.1 0.1 0.2 0.2 0.2 0.1
340. * 0.0 0.0 0.0 0.2 0.2 0.0 0.0 0.0 0.0 0.0 0.0 0.5 0.1 0.1 0.2 0.2 0.2 0.1
350. * 0.0 0.0 0.0 0.1 0.1 0.0 0.0 0.0 0.0 0.0 0.1 0.5 0.1 0.1 0.2 0.1 0.2 0.1
360. * 0.0 0.0 0.0 0.3 0.2 0.3 0.2 0.2 0.2 0.1 0.3 0.6 0.1 0.1 0.2 0.2 0.2 0.2
------*------------------------------------------------------------------------------------------------------------
MAX * 0.2 0.3 0.2 0.6 0.4 0.4 0.4 0.4 0.4 0.5 0.6 1.0 0.8 0.4 0.2 0.2 0.2 0.2
DEGR. * 110 120 100 300 10 10 10 20 20 30 20 40 60 70 0 0 0 0
THE HIGHEST CONCENTRATION OF 1.00 PPM OCCURRED AT RECEPTOR REC52.

35th Avenue to In ters ta te 70
AIR QUALITY TECHNICAL REPORT
ENVIRONMENTAL ASSESSMENT A-13
PAGE 7
JOB: Wadsworth Blvd. and 44th Intersection RUN: Wadsworth Blvd. and 44th Intersection
DATE : 2/ 8/17
TIME : 10:12:53
RECEPTOR - LINK MATRIX FOR THE ANGLE PRODUCING
THE MAXIMUM CONCENTRATION FOR EACH RECEPTOR
* CO/LINK (PPM)
* ANGLE (DEGREES)
* REC1 REC2 REC3 REC4 REC5 REC6 REC7 REC8 REC9 REC10 REC11 REC12 REC13 REC14 REC15 REC16 REC17 REC18 REC19 REC20
LINK # * 220 190 340 190 200 330 330 330 320 300 300 0 0 0 130 200 210 240 260 90
-------*------------------------------------------------------------------------------------------------------------------------
1 * 0.2 0.2 0.2 0.2 0.2 0.3 0.3 0.3 0.0 0.0 0.0 0.0 0.0 0.0 0.0 0.1 0.1 0.1 0.0 0.0
2 * 0.0 0.0 0.1 0.0 0.0 0.0 0.0 0.0 0.1 0.1 0.1 0.0 0.0 0.0 0.0 0.0 0.0 0.0 0.0 0.0
3 * 0.0 0.0 0.0 0.0 0.0 0.0 0.0 0.0 0.0 0.0 0.0 0.0 0.0 0.0 0.0 0.0 0.0 0.0 0.0 0.0
4 * 0.0 0.0 0.0 0.0 0.0 0.0 0.0 0.0 0.0 0.0 0.0 0.0 0.0 0.0 0.0 0.0 0.0 0.0 0.0 0.0
5 * 0.0 0.0 0.0 0.0 0.0 0.0 0.0 0.0 0.0 0.0 0.0 0.0 0.0 0.0 0.0 0.0 0.0 0.0 0.0 0.0
6 * 0.0 0.0 0.0 0.0 0.0 0.0 0.0 0.0 0.0 0.0 0.0 0.0 0.0 0.0 0.0 0.0 0.0 0.0 0.0 0.0
7 * 0.0 0.0 0.1 0.0 0.0 0.0 0.0 0.0 0.1 0.0 0.0 0.0 0.0 0.0 0.0 0.0 0.0 0.0 0.0 0.0
8 * 0.1 0.1 0.1 0.1 0.1 0.1 0.1 0.1 0.0 0.0 0.0 0.0 0.0 0.0 0.0 0.1 0.1 0.0 0.0 0.0
9 * 0.0 0.0 0.0 0.0 0.0 0.0 0.0 0.0 0.0 0.0 0.1 0.1 0.1 0.1 0.1 0.1 0.1 0.1 0.1 0.1
10 * 0.0 0.0 0.0 0.0 0.0 0.0 0.0 0.0 0.0 0.0 0.0 0.0 0.0 0.0 0.0 0.0 0.0 0.0 0.0 0.0
11 * 0.0 0.0 0.0 0.0 0.0 0.0 0.0 0.0 0.0 0.0 0.0 0.0 0.0 0.0 0.0 0.0 0.0 0.0 0.0 0.0
12 * 0.0 0.0 0.0 0.0 0.0 0.0 0.0 0.0 0.0 0.0 0.0 0.0 0.0 0.0 0.0 0.0 0.0 0.0 0.0 0.0
13 * 0.0 0.0 0.0 0.0 0.0 0.0 0.0 0.0 0.0 0.0 0.0 0.0 0.0 0.0 0.0 0.0 0.0 0.0 0.0 0.0
14 * 0.0 0.0 0.0 0.0 0.0 0.0 0.0 0.0 0.0 0.0 0.0 0.0 0.0 0.0 0.0 0.0 0.0 0.0 0.0 0.0
15 * 0.0 0.0 0.0 0.0 0.0 0.0 0.0 0.0 0.0 0.0 0.0 0.0 0.0 0.0 0.0 0.0 0.0 0.0 0.0 0.0
16 * 0.0 0.0 0.0 0.0 0.0 0.0 0.0 0.0 0.0 0.0 0.0 0.0 0.0 0.0 0.0 0.0 0.0 0.0 0.0 0.0
17 * 0.0 0.0 0.0 0.0 0.0 0.0 0.0 0.0 0.0 0.0 0.0 0.0 0.0 0.0 0.0 0.0 0.0 0.0 0.0 0.0
18 * 0.0 0.0 0.0 0.0 0.0 0.0 0.0 0.0 0.1 0.1 0.1 0.0 0.0 0.0 0.0 0.0 0.0 0.0 0.0 0.0
19 * 0.0 0.0 0.0 0.0 0.0 0.0 0.0 0.0 0.0 0.0 0.0 0.0 0.0 0.0 0.0 0.0 0.0 0.0 0.0 0.0
20 * 0.0 0.0 0.0 0.0 0.0 0.0 0.0 0.0 0.0 0.0 0.0 0.1 0.1 0.1 0.0 0.0 0.0 0.0 0.0 0.0
21 * 0.1 0.2 0.1 0.2 0.2 0.2 0.2 0.2 0.0 0.0 0.0 0.0 0.0 0.0 0.0 0.1 0.1 0.0 0.0 0.0
22 * 0.0 0.0 0.0 0.0 0.0 0.0 0.0 0.0 0.0 0.0 0.0 0.0 0.0 0.0 0.0 0.0 0.0 0.0 0.0 0.0
23 * 0.1 0.0 0.0 0.0 0.0 0.0 0.0 0.0 0.0 0.0 0.0 0.0 0.0 0.0 0.0 0.0 0.0 0.0 0.0 0.0
24 * 0.0 0.0 0.0 0.0 0.0 0.0 0.0 0.0 0.0 0.0 0.0 0.0 0.0 0.0 0.0 0.0 0.0 0.0 0.0 0.0
25 * 0.0 0.0 0.0 0.0 0.0 0.0 0.0 0.0 0.0 0.0 0.0 0.0 0.0 0.0 0.0 0.0 0.0 0.0 0.0 0.0
26 * 0.0 0.0 0.0 0.0 0.0 0.0 0.0 0.0 0.0 0.0 0.0 0.0 0.0 0.0 0.0 0.0 0.0 0.0 0.0 0.0
27 * 0.0 0.0 0.0 0.0 0.0 0.0 0.0 0.0 0.1 0.1 0.1 0.0 0.0 0.0 0.2 0.2 0.2 0.1 0.1 0.0
28 * 0.0 0.0 0.0 0.0 0.0 0.0 0.0 0.0 0.2 0.1 0.0 0.0 0.0 0.0 0.2 0.2 0.0 0.0 0.0 0.0
29 * 0.0 0.0 0.0 0.0 0.0 0.0 0.0 0.0 0.0 0.0 0.0 0.0 0.0 0.0 0.1 0.1 0.0 0.0 0.0 0.0
30 * 0.0 0.0 0.0 0.0 0.0 0.0 0.0 0.0 0.0 0.0 0.0 0.0 0.0 0.0 0.0 0.0 0.0 0.0 0.0 0.0
31 * 0.0 0.0 0.0 0.0 0.0 0.0 0.0 0.0 0.0 0.0 0.0 0.0 0.0 0.0 0.0 0.0 0.0 0.0 0.0 0.0
32 * 0.0 0.0 0.0 0.0 0.0 0.0 0.0 0.0 0.0 0.0 0.0 0.0 0.0 0.0 0.0 0.0 0.0 0.0 0.0 0.0
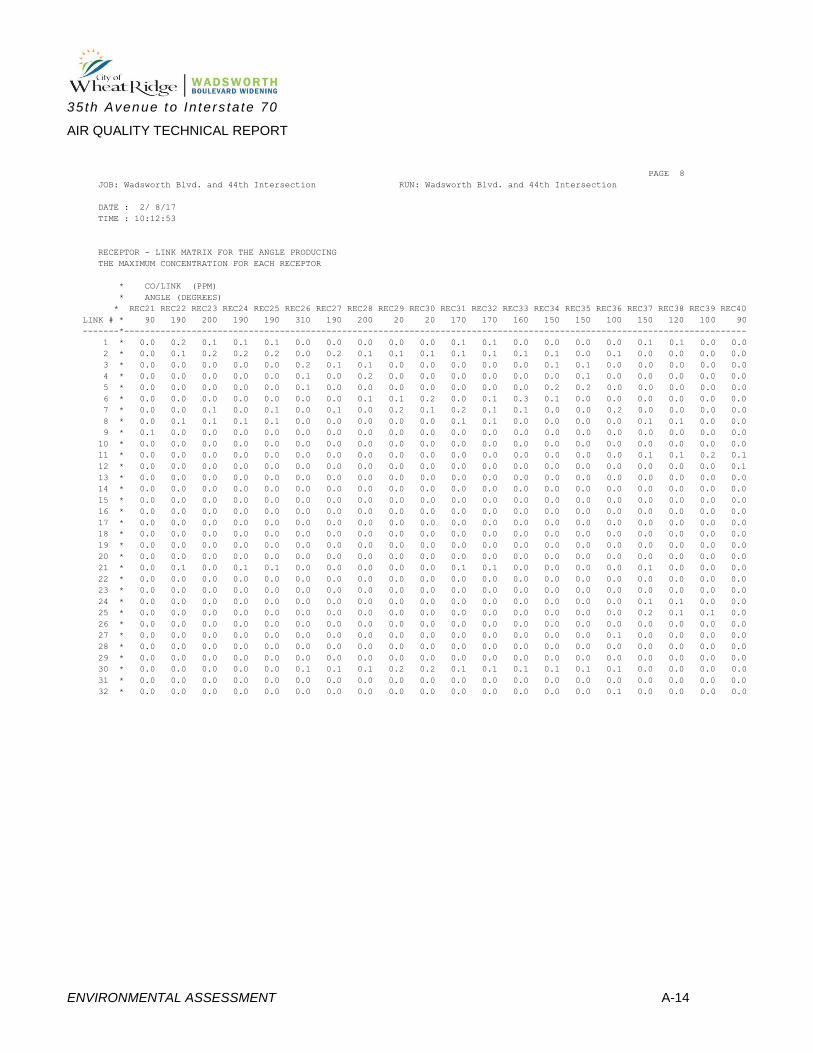
35th Avenue to In ters ta te 70
AIR QUALITY TECHNICAL REPORT
ENVIRONMENTAL ASSESSMENT A-14
PAGE 8
JOB: Wadsworth Blvd. and 44th Intersection RUN: Wadsworth Blvd. and 44th Intersection
DATE : 2/ 8/17
TIME : 10:12:53
RECEPTOR - LINK MATRIX FOR THE ANGLE PRODUCING
THE MAXIMUM CONCENTRATION FOR EACH RECEPTOR
* CO/LINK (PPM)
* ANGLE (DEGREES)
* REC21 REC22 REC23 REC24 REC25 REC26 REC27 REC28 REC29 REC30 REC31 REC32 REC33 REC34 REC35 REC36 REC37 REC38 REC39 REC40
LINK # * 90 190 200 190 190 310 190 200 20 20 170 170 160 150 150 100 150 120 100 90
-------*------------------------------------------------------------------------------------------------------------------------
1 * 0.0 0.2 0.1 0.1 0.1 0.0 0.0 0.0 0.0 0.0 0.1 0.1 0.0 0.0 0.0 0.0 0.1 0.1 0.0 0.0
2 * 0.0 0.1 0.2 0.2 0.2 0.0 0.2 0.1 0.1 0.1 0.1 0.1 0.1 0.1 0.0 0.1 0.0 0.0 0.0 0.0
3 * 0.0 0.0 0.0 0.0 0.0 0.2 0.1 0.1 0.0 0.0 0.0 0.0 0.0 0.1 0.1 0.0 0.0 0.0 0.0 0.0
4 * 0.0 0.0 0.0 0.0 0.0 0.1 0.0 0.2 0.0 0.0 0.0 0.0 0.0 0.0 0.1 0.0 0.0 0.0 0.0 0.0
5 * 0.0 0.0 0.0 0.0 0.0 0.1 0.0 0.0 0.0 0.0 0.0 0.0 0.0 0.2 0.2 0.0 0.0 0.0 0.0 0.0
6 * 0.0 0.0 0.0 0.0 0.0 0.0 0.0 0.1 0.1 0.2 0.0 0.1 0.3 0.1 0.0 0.0 0.0 0.0 0.0 0.0
7 * 0.0 0.0 0.1 0.0 0.1 0.0 0.1 0.0 0.2 0.1 0.2 0.1 0.1 0.0 0.0 0.2 0.0 0.0 0.0 0.0
8 * 0.0 0.1 0.1 0.1 0.1 0.0 0.0 0.0 0.0 0.0 0.1 0.1 0.0 0.0 0.0 0.0 0.1 0.1 0.0 0.0
9 * 0.1 0.0 0.0 0.0 0.0 0.0 0.0 0.0 0.0 0.0 0.0 0.0 0.0 0.0 0.0 0.0 0.0 0.0 0.0 0.0
10 * 0.0 0.0 0.0 0.0 0.0 0.0 0.0 0.0 0.0 0.0 0.0 0.0 0.0 0.0 0.0 0.0 0.0 0.0 0.0 0.0
11 * 0.0 0.0 0.0 0.0 0.0 0.0 0.0 0.0 0.0 0.0 0.0 0.0 0.0 0.0 0.0 0.0 0.1 0.1 0.2 0.1
12 * 0.0 0.0 0.0 0.0 0.0 0.0 0.0 0.0 0.0 0.0 0.0 0.0 0.0 0.0 0.0 0.0 0.0 0.0 0.0 0.1
13 * 0.0 0.0 0.0 0.0 0.0 0.0 0.0 0.0 0.0 0.0 0.0 0.0 0.0 0.0 0.0 0.0 0.0 0.0 0.0 0.0
14 * 0.0 0.0 0.0 0.0 0.0 0.0 0.0 0.0 0.0 0.0 0.0 0.0 0.0 0.0 0.0 0.0 0.0 0.0 0.0 0.0
15 * 0.0 0.0 0.0 0.0 0.0 0.0 0.0 0.0 0.0 0.0 0.0 0.0 0.0 0.0 0.0 0.0 0.0 0.0 0.0 0.0
16 * 0.0 0.0 0.0 0.0 0.0 0.0 0.0 0.0 0.0 0.0 0.0 0.0 0.0 0.0 0.0 0.0 0.0 0.0 0.0 0.0
17 * 0.0 0.0 0.0 0.0 0.0 0.0 0.0 0.0 0.0 0.0 0.0 0.0 0.0 0.0 0.0 0.0 0.0 0.0 0.0 0.0
18 * 0.0 0.0 0.0 0.0 0.0 0.0 0.0 0.0 0.0 0.0 0.0 0.0 0.0 0.0 0.0 0.0 0.0 0.0 0.0 0.0
19 * 0.0 0.0 0.0 0.0 0.0 0.0 0.0 0.0 0.0 0.0 0.0 0.0 0.0 0.0 0.0 0.0 0.0 0.0 0.0 0.0
20 * 0.0 0.0 0.0 0.0 0.0 0.0 0.0 0.0 0.0 0.0 0.0 0.0 0.0 0.0 0.0 0.0 0.0 0.0 0.0 0.0
21 * 0.0 0.1 0.0 0.1 0.1 0.0 0.0 0.0 0.0 0.0 0.1 0.1 0.0 0.0 0.0 0.0 0.1 0.0 0.0 0.0
22 * 0.0 0.0 0.0 0.0 0.0 0.0 0.0 0.0 0.0 0.0 0.0 0.0 0.0 0.0 0.0 0.0 0.0 0.0 0.0 0.0
23 * 0.0 0.0 0.0 0.0 0.0 0.0 0.0 0.0 0.0 0.0 0.0 0.0 0.0 0.0 0.0 0.0 0.0 0.0 0.0 0.0
24 * 0.0 0.0 0.0 0.0 0.0 0.0 0.0 0.0 0.0 0.0 0.0 0.0 0.0 0.0 0.0 0.0 0.1 0.1 0.0 0.0
25 * 0.0 0.0 0.0 0.0 0.0 0.0 0.0 0.0 0.0 0.0 0.0 0.0 0.0 0.0 0.0 0.0 0.2 0.1 0.1 0.0
26 * 0.0 0.0 0.0 0.0 0.0 0.0 0.0 0.0 0.0 0.0 0.0 0.0 0.0 0.0 0.0 0.0 0.0 0.0 0.0 0.0
27 * 0.0 0.0 0.0 0.0 0.0 0.0 0.0 0.0 0.0 0.0 0.0 0.0 0.0 0.0 0.0 0.1 0.0 0.0 0.0 0.0
28 * 0.0 0.0 0.0 0.0 0.0 0.0 0.0 0.0 0.0 0.0 0.0 0.0 0.0 0.0 0.0 0.0 0.0 0.0 0.0 0.0
29 * 0.0 0.0 0.0 0.0 0.0 0.0 0.0 0.0 0.0 0.0 0.0 0.0 0.0 0.0 0.0 0.0 0.0 0.0 0.0 0.0
30 * 0.0 0.0 0.0 0.0 0.0 0.1 0.1 0.1 0.2 0.2 0.1 0.1 0.1 0.1 0.1 0.1 0.0 0.0 0.0 0.0
31 * 0.0 0.0 0.0 0.0 0.0 0.0 0.0 0.0 0.0 0.0 0.0 0.0 0.0 0.0 0.0 0.0 0.0 0.0 0.0 0.0
32 * 0.0 0.0 0.0 0.0 0.0 0.0 0.0 0.0 0.0 0.0 0.0 0.0 0.0 0.0 0.0 0.1 0.0 0.0 0.0 0.0
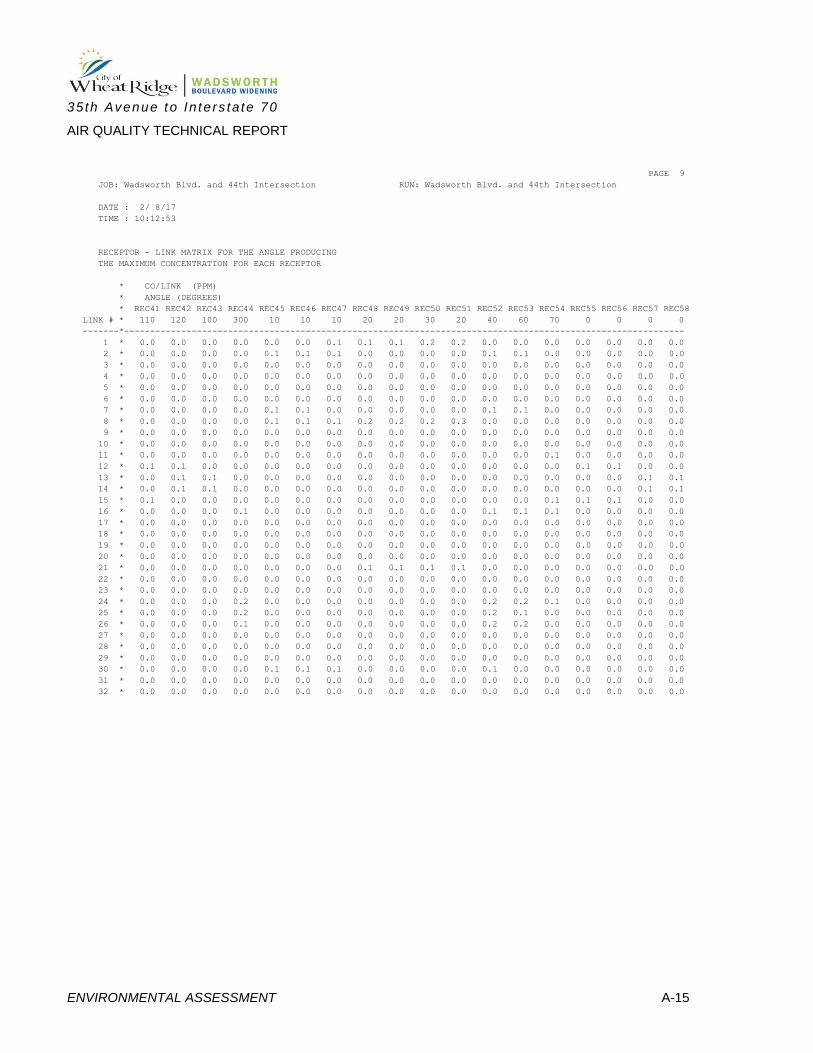
35th Avenue to In ters ta te 70
AIR QUALITY TECHNICAL REPORT
ENVIRONMENTAL ASSESSMENT A-15
PAGE 9
JOB: Wadsworth Blvd. and 44th Intersection RUN: Wadsworth Blvd. and 44th Intersection
DATE : 2/ 8/17
TIME : 10:12:53
RECEPTOR - LINK MATRIX FOR THE ANGLE PRODUCING
THE MAXIMUM CONCENTRATION FOR EACH RECEPTOR
* CO/LINK (PPM)
* ANGLE (DEGREES)
* REC41 REC42 REC43 REC44 REC45 REC46 REC47 REC48 REC49 REC50 REC51 REC52 REC53 REC54 REC55 REC56 REC57 REC58
LINK # * 110 120 100 300 10 10 10 20 20 30 20 40 60 70 0 0 0 0
-------*------------------------------------------------------------------------------------------------------------
1 * 0.0 0.0 0.0 0.0 0.0 0.0 0.1 0.1 0.1 0.2 0.2 0.0 0.0 0.0 0.0 0.0 0.0 0.0
2 * 0.0 0.0 0.0 0.0 0.1 0.1 0.1 0.0 0.0 0.0 0.0 0.1 0.1 0.0 0.0 0.0 0.0 0.0
3 * 0.0 0.0 0.0 0.0 0.0 0.0 0.0 0.0 0.0 0.0 0.0 0.0 0.0 0.0 0.0 0.0 0.0 0.0
4 * 0.0 0.0 0.0 0.0 0.0 0.0 0.0 0.0 0.0 0.0 0.0 0.0 0.0 0.0 0.0 0.0 0.0 0.0
5 * 0.0 0.0 0.0 0.0 0.0 0.0 0.0 0.0 0.0 0.0 0.0 0.0 0.0 0.0 0.0 0.0 0.0 0.0
6 * 0.0 0.0 0.0 0.0 0.0 0.0 0.0 0.0 0.0 0.0 0.0 0.0 0.0 0.0 0.0 0.0 0.0 0.0
7 * 0.0 0.0 0.0 0.0 0.1 0.1 0.0 0.0 0.0 0.0 0.0 0.1 0.1 0.0 0.0 0.0 0.0 0.0
8 * 0.0 0.0 0.0 0.0 0.1 0.1 0.1 0.2 0.2 0.2 0.3 0.0 0.0 0.0 0.0 0.0 0.0 0.0
9 * 0.0 0.0 0.0 0.0 0.0 0.0 0.0 0.0 0.0 0.0 0.0 0.0 0.0 0.0 0.0 0.0 0.0 0.0
10 * 0.0 0.0 0.0 0.0 0.0 0.0 0.0 0.0 0.0 0.0 0.0 0.0 0.0 0.0 0.0 0.0 0.0 0.0
11 * 0.0 0.0 0.0 0.0 0.0 0.0 0.0 0.0 0.0 0.0 0.0 0.0 0.0 0.1 0.0 0.0 0.0 0.0
12 * 0.1 0.1 0.0 0.0 0.0 0.0 0.0 0.0 0.0 0.0 0.0 0.0 0.0 0.0 0.1 0.1 0.0 0.0
13 * 0.0 0.1 0.1 0.0 0.0 0.0 0.0 0.0 0.0 0.0 0.0 0.0 0.0 0.0 0.0 0.0 0.1 0.1
14 * 0.0 0.1 0.1 0.0 0.0 0.0 0.0 0.0 0.0 0.0 0.0 0.0 0.0 0.0 0.0 0.0 0.1 0.1
15 * 0.1 0.0 0.0 0.0 0.0 0.0 0.0 0.0 0.0 0.0 0.0 0.0 0.0 0.1 0.1 0.1 0.0 0.0
16 * 0.0 0.0 0.0 0.1 0.0 0.0 0.0 0.0 0.0 0.0 0.0 0.1 0.1 0.1 0.0 0.0 0.0 0.0
17 * 0.0 0.0 0.0 0.0 0.0 0.0 0.0 0.0 0.0 0.0 0.0 0.0 0.0 0.0 0.0 0.0 0.0 0.0
18 * 0.0 0.0 0.0 0.0 0.0 0.0 0.0 0.0 0.0 0.0 0.0 0.0 0.0 0.0 0.0 0.0 0.0 0.0
19 * 0.0 0.0 0.0 0.0 0.0 0.0 0.0 0.0 0.0 0.0 0.0 0.0 0.0 0.0 0.0 0.0 0.0 0.0
20 * 0.0 0.0 0.0 0.0 0.0 0.0 0.0 0.0 0.0 0.0 0.0 0.0 0.0 0.0 0.0 0.0 0.0 0.0
21 * 0.0 0.0 0.0 0.0 0.0 0.0 0.0 0.1 0.1 0.1 0.1 0.0 0.0 0.0 0.0 0.0 0.0 0.0
22 * 0.0 0.0 0.0 0.0 0.0 0.0 0.0 0.0 0.0 0.0 0.0 0.0 0.0 0.0 0.0 0.0 0.0 0.0
23 * 0.0 0.0 0.0 0.0 0.0 0.0 0.0 0.0 0.0 0.0 0.0 0.0 0.0 0.0 0.0 0.0 0.0 0.0
24 * 0.0 0.0 0.0 0.2 0.0 0.0 0.0 0.0 0.0 0.0 0.0 0.2 0.2 0.1 0.0 0.0 0.0 0.0
25 * 0.0 0.0 0.0 0.2 0.0 0.0 0.0 0.0 0.0 0.0 0.0 0.2 0.1 0.0 0.0 0.0 0.0 0.0
26 * 0.0 0.0 0.0 0.1 0.0 0.0 0.0 0.0 0.0 0.0 0.0 0.2 0.2 0.0 0.0 0.0 0.0 0.0
27 * 0.0 0.0 0.0 0.0 0.0 0.0 0.0 0.0 0.0 0.0 0.0 0.0 0.0 0.0 0.0 0.0 0.0 0.0
28 * 0.0 0.0 0.0 0.0 0.0 0.0 0.0 0.0 0.0 0.0 0.0 0.0 0.0 0.0 0.0 0.0 0.0 0.0
29 * 0.0 0.0 0.0 0.0 0.0 0.0 0.0 0.0 0.0 0.0 0.0 0.0 0.0 0.0 0.0 0.0 0.0 0.0
30 * 0.0 0.0 0.0 0.0 0.1 0.1 0.1 0.0 0.0 0.0 0.0 0.1 0.0 0.0 0.0 0.0 0.0 0.0
31 * 0.0 0.0 0.0 0.0 0.0 0.0 0.0 0.0 0.0 0.0 0.0 0.0 0.0 0.0 0.0 0.0 0.0 0.0
32 * 0.0 0.0 0.0 0.0 0.0 0.0 0.0 0.0 0.0 0.0 0.0 0.0 0.0 0.0 0.0 0.0 0.0 0.0