April 14, 2006 - C-Store Value and...
19
C - S T O R E E V A L U A T I O N S LLC A SPECIALIZED FINANCIAL SERVICES PROVIDER OF C-STORE VALUATIONS Evaluation Report S S A A M M P P L L E E S S T T O O R R E E Anywhere , , U U S S July 4, 2011
Transcript of April 14, 2006 - C-Store Value and...

1 EVALUATION REPORT
© Copyright 2007-2011 C-Store Evaluations LLC. All Rights Reserved.
C - S T O R E E V A L U A T I O N S LLC A SPECIALIZED FINANCIAL SERVICES PROVIDER OF C-STORE VALUATIONS
Evaluation Report
SSAAMMPPLLEE SSTTOORREE AAnnyywwhheerree,, UUSS JJuullyy 44,, 22001111

2 EVALUATION REPORT
© Copyright 2007-2011 C-Store Evaluations LLC. All Rights Reserved.
C - S T O R E E V A L U A T I O N S L L C
A SPECIALIZED FINANCIALSERVICES PROVIDER OF C-STORE VALUATIONS
(541) 823-0029 VOICE ● (541) 823-0079 FAX ● [email protected] 151 S.W. First Street, Ontario, OR 97914
FOR CURRENT INDUSTRY INFORMATION, PLEASE VISIT US AT: w w w . c s t o r e v a l u e . c o m

3 EVALUATION REPORT
© Copyright 2007-2011 C-Store Evaluations LLC. All Rights Reserved.
SitusStore Number Tax Lots 081.000-011, 082.000-011Brand ShellStreet Address 28205 State Road 1City West HarrisonCounty DearbornState INZip Code 47060
Owner KJMD
Physical CharacteristicsSite Size (Sq. Ft.) 190,357Store Size (Sq. Ft.) 4,414Fueling Positions 8Car Wash Yes
FAIRMARKET VALUE
Real Property Value $1,540,000TANGIBLE ASSETS, REALTY
(Site, Store Building, Canopy, Fuel Dispensers, USTs, Electronics)
FF&E Value $50,000TANGIBLE ASSETS, NON-REALTY
(Moveable Personal Property)
Business Enterprise Value $140,000INTANGIBLE ASSETS
(Capitalized Accounting and Economic Profit)
Going Concern Value $1,730,000TOTAL ASSESTS OF THE BUSINESS
RECOMMENDED FAIR MARKET VALUESFAIR MARKET VALUE OF THE FEE SIMPLE INTEREST UNDER TYPICAL OWNERSHIPBASED ON EARNINGS CAPITALIZATION AND ASSUMING 100% FAIR MARKET VALUE
Property Identification
Assessed value is lower than 100% of Fair Market Value.
1 High Street Any City Any County Any State
Any Owner

4 EVALUATION REPORT
© Copyright 2007-2011 C-Store Evaluations LLC. All Rights Reserved.
Method of Valuation: Earnings Capitalization Convenience stores and gas stations are special-built properties that are designed to generate earnings from the retail sale of specific products. According to Convenience Stores and Retail Fuel Properties: Essential Appraisal Issues, published by the Appraisal Institute, the most appropriate and accurate method for appraising the fair market value of these properties is an earnings capitalization. This method is more accurate than the cost approach or sales comparison approach. An earnings capitalization approach best reflects the actions of actual buyers and sellers of convenience stores and gas stations. Stores and locations with poor earnings have lower real estate values than those with better physical features and locations. The fee simple value is based on typical management and ownership of a particular store and location. The fair market value of the fee simple interest of the real property of a convenience store does not consider nor include any specific brand. EARNINGS CAPITALIZATION Step 1 An earnings capitalization approach begins with a supply and demand analysis of the trade area. A typical convenience store will draw 70% to 80% of its customers from the primary trade area. A successful location requires at least 2,500 people per store within a 2-3 mile radius of the store. Hypermarket competition is a significant competitive disadvantage for a traditional convenience store. Step 2 is a projection of gallonage and sales The physical features of the subject, such as the accessibility of the site, the size and age of the store, and the number of fuel positions, along with the supply and demand characteristics of the trade area, determine the earnings capacity of any convenience store. Step 3 is the calculation of Adjusted EBIDTA, which is the gross economic return to all the assets of the business. After allocating the earnings to FF&E and the business enterprise, the residual earnings is the amount earned by the real estate. Step 4 A capitalization of the net earnings to real estate is the final step in estimating this evaluation process. A graphic of this process is shown in the Appendix.
Key Point An earnings capitalization is the most appropriate method of appraising convenience stores and gas stations.
5 EVALUATION REPORT
© Copyright 2007-2011 C-Store Evaluations LLC. All Rights Reserved.
Trade Area Characteristics
Primary Market Population 1,664Secondary Market Population N/APrimary Market Competition 3
Location Quotient 0.27ESRI® Retail Spending Potential Index 1
Hypermarket Competition No
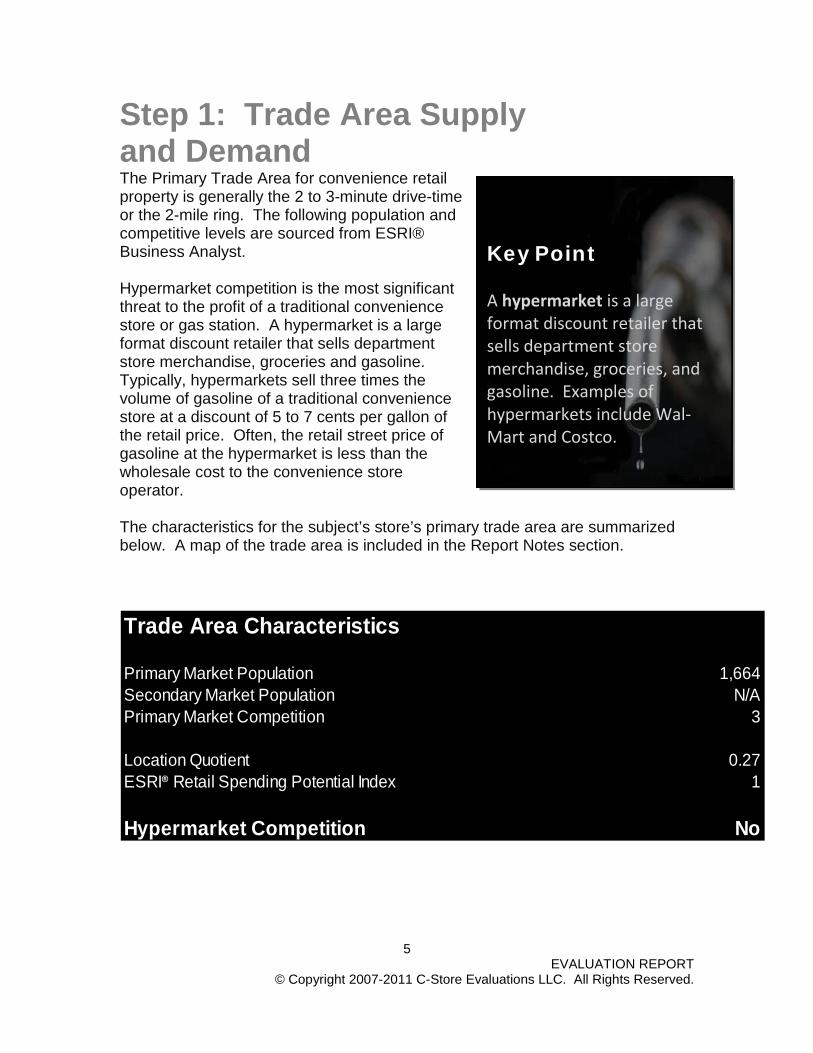
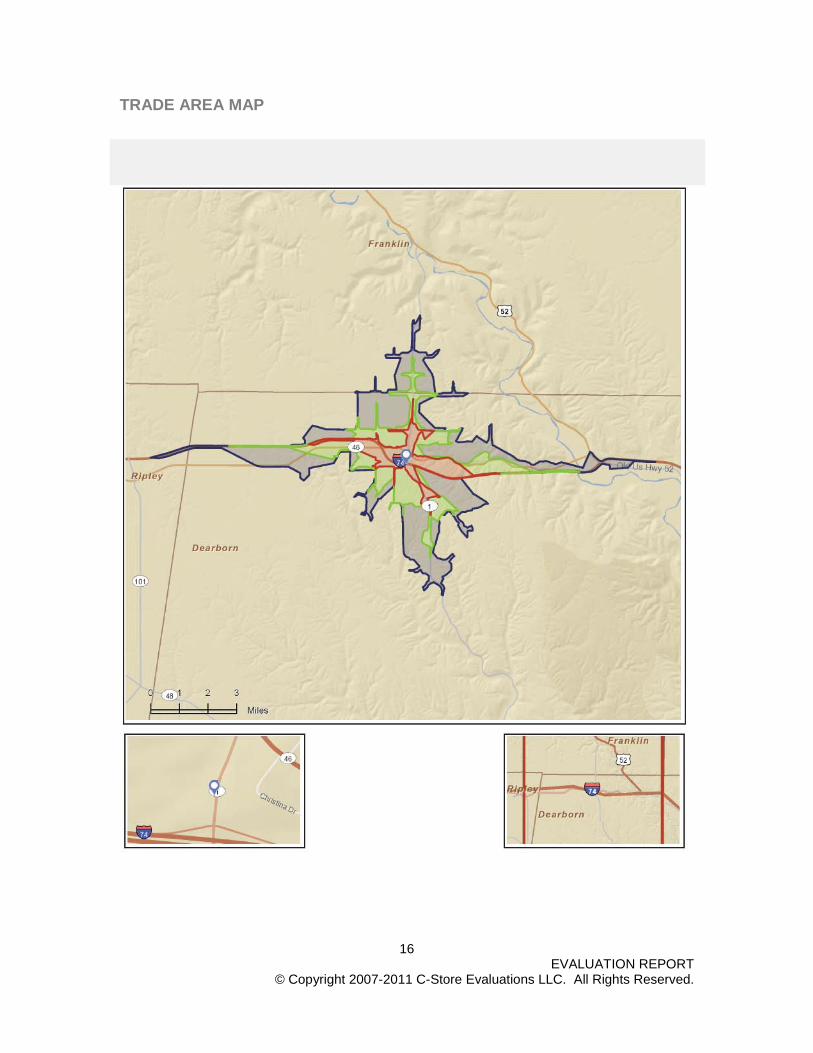
Step 1: Trade Area Supply and Demand The Primary Trade Area for convenience retail property is generally the 2 to 3-minute drive-time or the 2-mile ring. The following population and competitive levels are sourced from ESRI® Business Analyst. Hypermarket competition is the most significant threat to the profit of a traditional convenience store or gas station. A hypermarket is a large format discount retailer that sells department store merchandise, groceries and gasoline. Typically, hypermarkets sell three times the volume of gasoline of a traditional convenience store at a discount of 5 to 7 cents per gallon of the retail price. Often, the retail street price of gasoline at the hypermarket is less than the wholesale cost to the convenience store operator. The characteristics for the subject’s store’s primary trade area are summarized below. A map of the trade area is included in the Report Notes section.
Key Point A hypermarket is a large format discount retailer that sells department store merchandise, groceries, and gasoline. Examples of hypermarkets include Wal-Mart and Costco.

6 EVALUATION REPORT
© Copyright 2007-2011 C-Store Evaluations LLC. All Rights Reserved.
PetroMARK®
Fuel Positions 8Store Size 4,414Access 3Traffic Count 3Day Parts 2
Location Quotient 0.27ESRI Supply/Demand 1ESRI Spending Potential Index 1
FEE SIMPLE GALLONAGE 1,452,000FEE SIMPLE FUEL MARGIN $0.13FEE SIMPLE MERCHANDISE SALES $333
$0.13$398
PHYSICAL FACTORS
ECONOMIC FACTORS
Gallonage and Sales CalculatorFEE SIMPLE INTEREST UNDER TYPCIAL OWNERSHIP AND MANAGEMENT
1,297,000
INDUSTRY AVERAGE
Step 2: Gallonage and Sales Projection Using the subject’s physical features, such as site size, store size, age, fueling positions, and trade area characteristics which measure supply and demand, the subject’s gallonage and sales potential can be estimated. Our PetroMARK® Software uses this data along with operating statistics published by The National Association of Convenience Stores and the Oil Pricing Information Service to project the gallons of fuel sold (gallonage) and sales potential of the subject store assuming fee simple ownership and typical management. These projections of gallonage and sales are not based on the actual ownership or existing branding agreements. The existing branding and management do not represent fee simple ownership, and therefore should not be the basis for a fair market value projection of gallonage and sales. The following page summarizes our Adjusted EBIDTA calculations based on the gallonage and sales projections in the table below.
7 EVALUATION REPORT
© Copyright 2007-2011 C-Store Evaluations LLC. All Rights Reserved.
PetroMARK®
COST OF GROSSGROSS SALES GOODS SOLD PROFIT
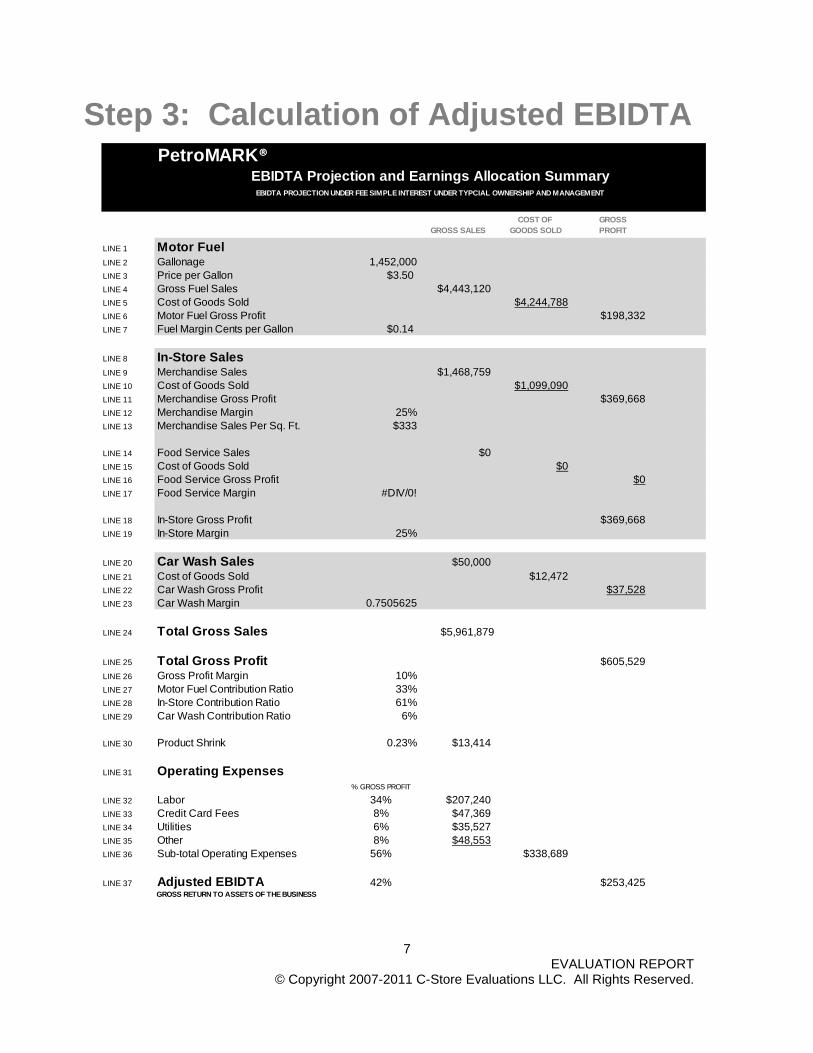
LINE 1 Motor FuelLINE 2 Gallonage 1,452,000LINE 3 Price per Gallon $3.50LINE 4 Gross Fuel Sales $4,443,120LINE 5 Cost of Goods Sold $4,244,788LINE 6 Motor Fuel Gross Profit $198,332LINE 7 Fuel Margin Cents per Gallon $0.14
LINE 8 In-Store SalesLINE 9 Merchandise Sales $1,468,759LINE 10 Cost of Goods Sold $1,099,090LINE 11 Merchandise Gross Profit $369,668LINE 12 Merchandise Margin 25%LINE 13 Merchandise Sales Per Sq. Ft. $333
LINE 14 Food Service Sales $0LINE 15 Cost of Goods Sold $0LINE 16 Food Service Gross Profit $0LINE 17 Food Service Margin #DIV/0!
LINE 18 In-Store Gross Profit $369,668LINE 19 In-Store Margin 25%
LINE 20 Car Wash Sales $50,000LINE 21 Cost of Goods Sold $12,472LINE 22 Car Wash Gross Profit $37,528LINE 23 Car Wash Margin 0.7505625
LINE 24 Total Gross Sales $5,961,879
LINE 25 Total Gross Profit $605,529LINE 26 Gross Profit Margin 10%LINE 27 Motor Fuel Contribution Ratio 33%LINE 28 In-Store Contribution Ratio 61%LINE 29 Car Wash Contribution Ratio 6%
LINE 30 Product Shrink 0.23% $13,414
LINE 31 Operating Expenses% GROSS PROFIT
LINE 32 Labor 34% $207,240LINE 33 Credit Card Fees 8% $47,369LINE 34 Utilities 6% $35,527LINE 35 Other 8% $48,553LINE 36 Sub-total Operating Expenses 56% $338,689
LINE 37 Adjusted EBIDTA 42% $253,425GROSS RETURN TO ASSETS OF THE BUSINESS
EBIDTA PROJECTION UNDER FEE SIMPLE INTEREST UNDER TYPCIAL OWNERSHIP AND MANAGEMENT
EBIDTA Projection and Earnings Allocation Summary
Step 3: Calculation of Adjusted EBIDTA
8 EVALUATION REPORT
© Copyright 2007-2011 C-Store Evaluations LLC. All Rights Reserved.
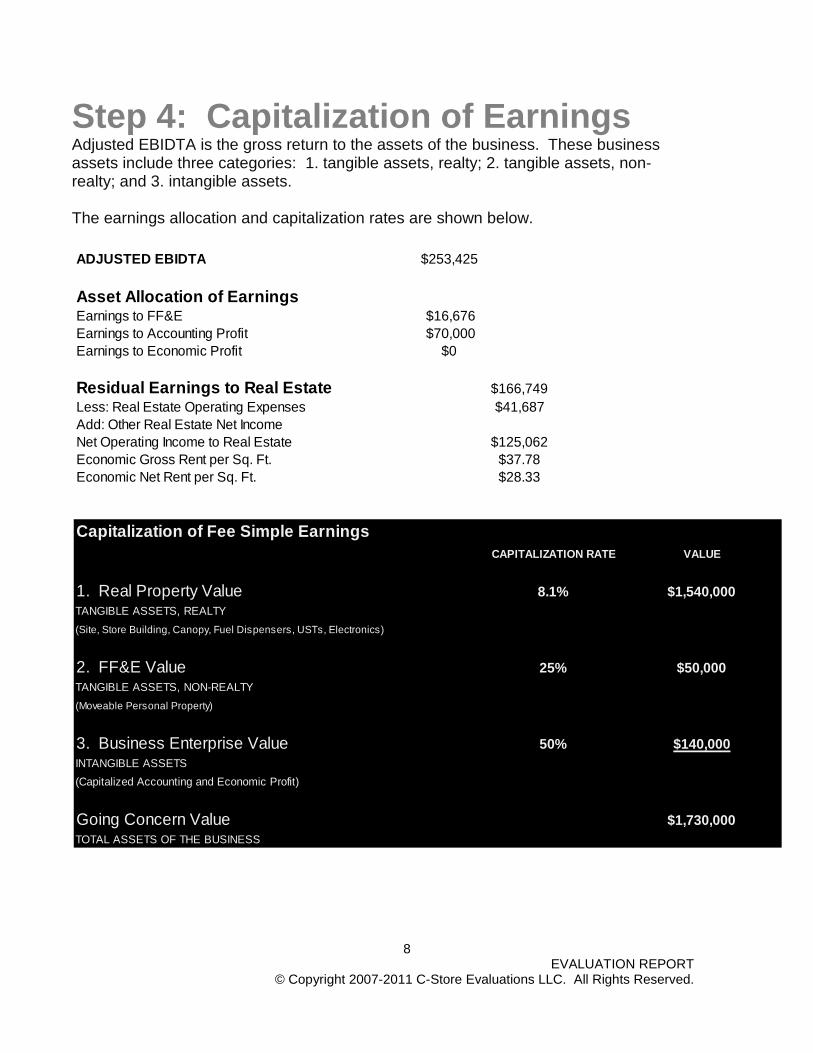
ADJUSTED EBIDTA $253,425
Asset Allocation of EarningsEarnings to FF&E $16,676Earnings to Accounting Profit $70,000Earnings to Economic Profit $0
Residual Earnings to Real Estate $166,749Less: Real Estate Operating Expenses $41,687Add: Other Real Estate Net IncomeNet Operating Income to Real Estate $125,062Economic Gross Rent per Sq. Ft. $37.78Economic Net Rent per Sq. Ft. $28.33
Capitalization of Fee Simple Earnings
1. Real Property ValueTANGIBLE ASSETS, REALTY(Site, Store Building, Canopy, Fuel Dispensers, USTs, Electronics)
2. FF&E ValueTANGIBLE ASSETS, NON-REALTY(Moveable Personal Property)
3. Business Enterprise ValueINTANGIBLE ASSETS(Capitalized Accounting and Economic Profit)
Going Concern ValueTOTAL ASSETS OF THE BUSINESS
$50,000
$140,000
$1,730,000
CAPITALIZATION RATE VALUE
8.1%
25%
50%
$1,540,000
Step 4: Capitalization of Earnings Adjusted EBIDTA is the gross return to the assets of the business. These business assets include three categories: 1. tangible assets, realty; 2. tangible assets, non-realty; and 3. intangible assets. The earnings allocation and capitalization rates are shown below.

9 EVALUATION REPORT
© Copyright 2007-2011 C-Store Evaluations LLC. All Rights Reserved.
Price Range Check: Peer Group Real Estate Sale Prices Peer group sales of convenience stores with gas stations (NAICS 4471) located near the subject property are summarized below. PEER GROUP TRANSACTION SUMMARY
SALE STORE YR BLT SITE PRICE/SALE DATE LOCATION PRICE SIZE RENOV SIZE SQ. FT.
1 2008 Hammond $1,875,000 2,385 2000 1.01 $786.162 2008 Whiting $1,625,000 1,800 1.36 $902.783 2011 Linden $1,200,000 2,000 $600.004 2010 Crown Point $950,000 3,446 1965 0.13 $275.685 2009 Merillville $937,811 6,696 1968 0.74 $140.066 2008 Highland $937,125 2,376 1988 0.12 $394.417 2009 Indianapolis $906,250 2,325 0.87 $389.788 2008 Indianapolis $895,900 2,200 1990 1.05 $407.239 2008 Munster $875,000 1,265 1980 0.38 $691.70
10 2009 Indianapolis $862,500 880 0.96 $980.1111 2008 Rising Sun $850,000 2,400 1996 0.95 $354.1712 2009 Indianapolis $824,500 1,648 1971 0.19 $500.3013 2009 Carmel $800,000 6,132 1.59 $130.4614 2009 Indianapolis $800,000 2,250 1967 0.6 $355.5615 2010 Edinburgh $710,000 4,520 1.25 $157.08
MEDIAN $895,900 $394AVERAGE $1,003,272 $471
INDIANA C-STORE REAL ESTATE SALES
The average price per square foot of store area from this peer group is $471 and the median price is $394. We have estimated the value of the subject’s real property at $1,540,000 or $348.89 per square foot of store area under typical ownership and operations.

10 EVALUATION REPORT
© Copyright 2007-2011 C-Store Evaluations LLC. All Rights Reserved.
Recent Sales and Value Trends Convenience store real estate prices peaked in 2006 at just under $1.4 million, according to CoStar. This median price reflects convenience stores with fuel service. Convenience store sales prices declined in 2009 and 2010. The real estate price movement for convenience stores has fared slightly worse than retail commercial property in the U.S. as a whole. Moody’s National Commercial Properties Index shows retail commercial real estate prices down 39% from their peak in 2007. The national median price of convenience stores is down 44% over the same period to $780,000 in 2010. (Source: CoStar)
Key Point The median price of a convenience store with fuel service declined 44% from 2007 to $780,000 in 2010.

11 EVALUATION REPORT
© Copyright 2007-2011 C-Store Evaluations LLC. All Rights Reserved.
Technical Summary:Insurable Replacement Cost $3,505,779Exposure Time 3 to 12 moMarketing Time 3 to 12 moRemaining Economic Life 50 yrs
NOI to Real Estate and Debt Service Analysis:Estimated Value of Real Estate $1,540,000Adjusted EBIDTA $253,425Less: Return to Tangible Assets, Non-Realty $16,676Less: Real Estate Operating Expenses (Property Taxes, Maintenance.etc) $41,687Less: Return to Intangible Assets (Accounting and Economic Profit) $70,000Add: Other Income to Real Estate $0Equals: NOI to Real Estate $125,062
Targeted Debt Coverage RatiosLow 1.01High 2.25Dollars Available for Debt Service (Low) $55,583Dollars Available for Debt Service (High) $123,823Mortgage Constant 0.0758482Total Possible Mortgage, Real Estate Only (Low) $732,819Total Possible Mortgage, Real Estate Only (High) $1,632,517Calculated Loan-to-Value RatiosLow 48%High 106%
Mortgage Loan Metrics BASED ON FEE SIMPLE OWNERSHIP UNDER TYPICAL MANAGEMENT Mortgage terms provided by Realty Rates.com

12 EVALUATION REPORT
© Copyright 2007-2011 C-Store Evaluations LLC. All Rights Reserved.
Report End Notes
Sources consulted in preparing this report:
1. State of the Industry Report, National Association of Convenience Stores, published annually
2. Retail Fuel Watch, Oil Pricing and Information Service, published annually.
3. ESRI® Business Analyst
4. Claritas Retail Market Report
5. CoStar
6. PetroMARK® Valuation Software

13 EVALUATION REPORT
© Copyright 2007-2011 C-Store Evaluations LLC. All Rights Reserved.
Our Products and Services This Evaluation Analysis and report was prepared by C-Store Evaluations LLC using PetroMARK® valuation software. C-Store Evaluations LLC is a specialized financial services provider of C-Store Valuations. This Evaluation Analysis is a reliable and credible opinion of value using the most appropriate methodology and industry-recognized data for estimating the fair market value of convenience stores and gas stations, This Evaluation Analysis and report has been prepared at the request of the client, but it is not an appraisal as defined by the Uniform Standards of Professional Appraisal Practice (USPAP) published by the Appraisal Foundation. This is not a federally-related transaction. This evaluation was not prepared by a state-licensed or certified appraiser. This financial service provided to the client does not require a state-licensed or certified appraiser. This evaluation is a cost-effective and less time-consuming alternative to a state-certified appraisal. The client has requested this Evaluation Analysis for internal corporate decision making. If the client so desires, C-Store Valuations can provide a state-certified appraisal meeting USPAP requirements. Please go to our website at www.cstorevalue.com for these and other products and services.

14 EVALUATION REPORT
© Copyright 2007-2011 C-Store Evaluations LLC. All Rights Reserved.
APPENDIX
How Retail Property Value is Created
Trade Area Maps
Hypermarket Competition
FF&E Valuation

15 EVALUATION REPORT
© Copyright 2007-2011 C-Store Evaluations LLC. All Rights Reserved.
16 EVALUATION REPORT
© Copyright 2007-2011 C-Store Evaluations LLC. All Rights Reserved.
TRADE AREA MAP

17 EVALUATION REPORT
© Copyright 2007-2011 C-Store Evaluations LLC. All Rights Reserved.
TRAFFIC VOLUME MAP

18 EVALUATION REPORT
© Copyright 2007-2011 C-Store Evaluations LLC. All Rights Reserved.
HYPERMARKT COMPETITIVE LOCATIONS
SUBJECT STORE
NO HYPERMARKET COMPETITION

19 EVALUATION REPORT
© Copyright 2007-2011 C-Store Evaluations LLC. All Rights Reserved.
WORKSHEET NO. 15
STORE NO. 11-05 4001 KJMD
Equipment ListDESCRIPTION QTY EACH % GOOD TOTALCO2 TANK W. VALVE CONNECTED W/ SODA M 1 $500 80% $400DRINK DISPENSER W/ REMOTE TANK SYSTEM 1 $2,650 80% $2,120COFFEE MAKER 1 $1,575 80% $1,260HOT CHOCOLATE 1 $605 80% $484CUP DISPENSERS 2 $170 80% $272CASH REGISTER 1 $3,000 80% $2,400TELEPHONE BOARD 1 $1,750 80% $1,400PORTABLE FIRE EXTINGUISHER 2 $175 80% $280STAINLESS STEEL SINK 2 $2,025 80% $3,240ICE MACHINE 1 $2,700 80% $2,160TIME RECORDER 1 $7,000 80% $5,600CORNER CAP 1 $750 80% $600BAG IN BOX 1 $250 80% $200MICROWAVE 1 $375 80% $300OVEN 1 $3,500 80% $2,800POPCORN MACHINE 1 $995 80% $796SLUSH PUPPY 1 $2,960 80% $2,368PASTRY CASE 1 $2,000 80% $1,600HOT DOG MACHINE 0 $670 80% $0GONDOLAS W/ END CAP 3 $250 80% $6002FT WIDE SHELVING/72 IN HIGH 12 $150 80% $1,440GRILL COOKER 0 $2,000 80% $0PAY PHONE 1 $750 80% $600COMPUTER 1 $5,000 80% $4,000SHELVES 3 $150 80% $360UNDERCOUNTER SAFE 2 $1,500 80% $2,400LOTTO MACHINE 1 $1,000 80% $800RECEIPT MACHINE 1 $500 80% $400CREDIT CARD MACHINE 1 $300 80% $240CONDIMENT TRAY 1 $1,025 80% $820ATM MACHINE 1 $4,500 80% $3,600ICE CREAM COOLER 2 $705 80% $1,1282-DOOR FREEZER 1 $3,000 80% $2,400PRINTER 1 $500 80% $400DISPLAY CASE 2 $475 80% $760OVERHEAD CIGARETTE DISPENSER 1 $1,500 80% $1,200DEEP SHELF WITH MOP HOLDERS 1 $750 80% $600FOOD/REST EQUIPMENT 0 $150,000 80% $0
TOTAL ADJUSTED BOOK VALUE: Tangible Assets, Non-Realty $50,028STORE BLDG SIZE 4,414
EQUIPMENT VALUE/SF $11.33