Apresentação do PowerPoint - Fibria Presentation UBS.pdf · UBS LatAm Fixed Income Trip ......
78
UBS LatAm Fixed Income Trip February, 2017
Transcript of Apresentação do PowerPoint - Fibria Presentation UBS.pdf · UBS LatAm Fixed Income Trip ......
UBS LatAm Fixed Income TripFebruary, 2017
2
The information contained in this presentation may include statements whichconstitute forward-looking statements, within the meaning of Section 27A of the U.S.Securities Act of 1933, as amended, and Section 21E of the U.S. Securities ExchangeAct of 1934, as amended. Such forward-looking statements involve a certain degree ofrisk and uncertainty with respect to business, financial, trend, strategy and otherforecasts, and are based on assumptions, data or methods that, although consideredreasonable by the company at the time, may turn out to be incorrect or imprecise, ormay not be possible to realize. The company gives no assurance that expectationsdisclosed in this presentation will be confirmed. Prospective investors are cautionedthat any such forward-looking statements are not guarantees of future performanceand involve risks and uncertainties, and that actual results may differ materially fromthose in the forward-looking statements, due to a variety of factors, including, but notlimited to, the risks of international business and other risks referred to in thecompany’s filings with the CVM and SEC. The company does not undertake, andspecifically disclaims any obligation to update any forward-looking statements, whichspeak only for the date on which they are made.
Disclaimer

3
Pulp and Paper Market2Financial and Operational Highlights3
Agenda
Company Overview1
2017 Outlook – CAPEX and Cash Cost4Expansion Project – Horizonte 2
Back up65

4
Company Overview
5
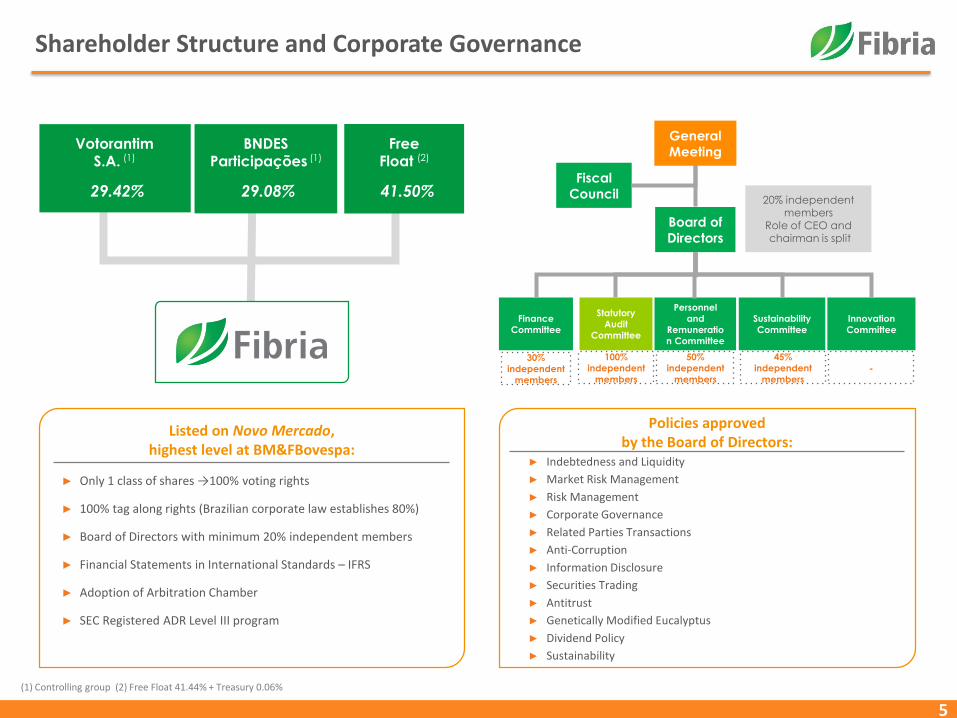
Shareholder Structure and Corporate Governance
(1) Controlling group (2) Free Float 41.44% + Treasury 0.06%
Votorantim S.A. (1)
29.42%
BNDESParticipações (1)
29.08%
FreeFloat (2)
41.50%
► Only 1 class of shares →100% voting rights
► 100% tag along rights (Brazilian corporate law establishes 80%)
► Board of Directors with minimum 20% independent members
► Financial Statements in International Standards – IFRS
► Adoption of Arbitration Chamber
► SEC Registered ADR Level III program
Listed on Novo Mercado, highest level at BM&FBovespa:
Policies approved by the Board of Directors:
Fiscal
Council
Board of
Directors
20% independent members
Role of CEO andchairman is split
Personnel
and
Remuneratio
n Committee
Statutory
Audit
Committee
Finance
Committee
Sustainability
Committee
Innovation
Committee
30%
independent
members
100%
independent
members
50%
independent
members
45%
independent
members-
General
Meeting
► Indebtedness and Liquidity
► Market Risk Management
► Risk Management
► Corporate Governance
► Related Parties Transactions
► Anti-Corruption
► Information Disclosure
► Securities Trading
► Antitrust
► Genetically Modified Eucalyptus
► Dividend Policy
► Sustainability

6
A Winning Player
Port Terminal Pulp Unit
Três Lagoas Unit and Horizonte 2 Project
Santos
AracruzPortocel
Caravelas
BelmonteVeracel
Jacareí
Superior Asset Combination Main Figures – 2016
Pulp capacity(1) million tons 5.300
Net revenues US$ billion 2.758
Total Forest Base(2) thousand hectares 969
Planted area(2) thousand hectares 568
Net Debt US$ billion 3.509
Net Debt/EBITDA (in Dollars)(3) X 3.30
Source: Fibria(1) Volume does not include Horizonte 2 project pulp capacity(2) Including 50% of Veracel, excluding forest partnership areas and forest bases linked to the sales of Losango and forest assets in Southern Bahia State; As of December 31, 2016. (3) For covenants purposes, the Net Debt/EBITDA ratio is calculated in Dollars.
7
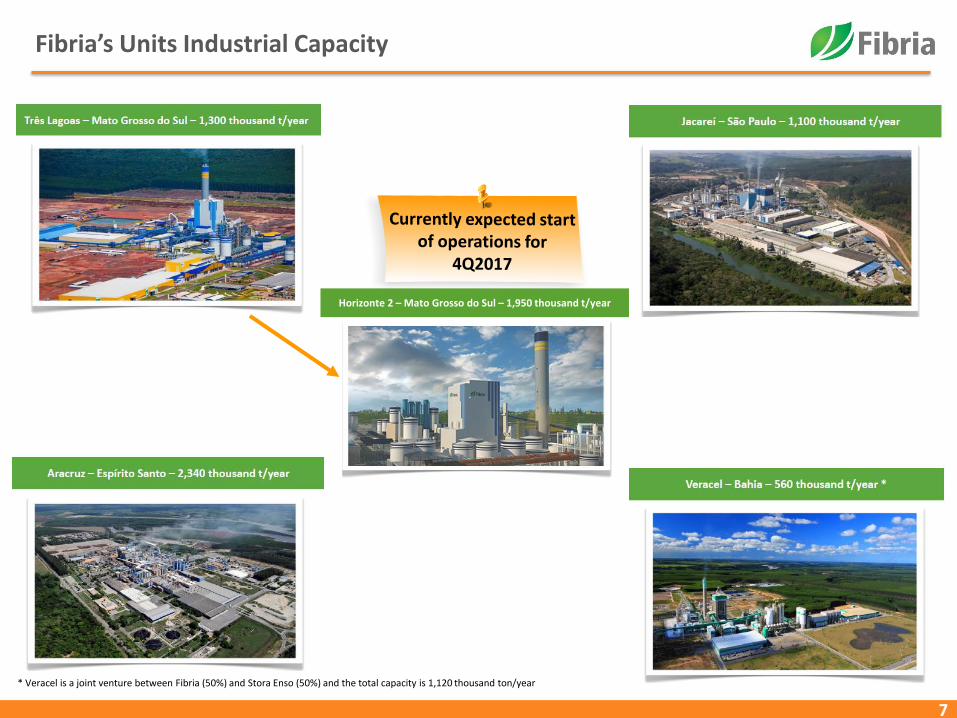
Fibria’s Units Industrial Capacity
* Veracel is a joint venture between Fibria (50%) and Stora Enso (50%) and the total capacity is 1,120 thousand ton/year
Horizonte 2 – Mato Grosso do Sul – 1,950 thousand t/year

8
Worldwide presence
Strong global customer base
Long-term relationships
Focus on customers with stable business
Customized pulp products and services
Sound forestry and industrial R&D
Focus on less volatile end-use markets such as tissue
Lower dependence on volatile markets such as China
Efficient logistics set up
Low counterparty credit risk
100% certified pulp (FSC and PEFC/Cerflor)
Sales Mix by Region and by End Use - Fibria Highlights
Fibria’s Commercial Strategy
Net Revenues by Region - Fibria
Region – 2016 End Use – 2016
39% 41% 43%36%
28% 24% 24%
22%
24% 25% 24%32%
9% 10% 9% 10%
2013 2014 2015 2016
Europe North America Asia LatAm
48% 34%
18%
Printing & Writing
Specialties
Tissue
Europe36%
N. America
22%
Asia32%
LatAm10%

9
Leadership Position
(1) Fiber Consumption, Recycled Fiber and Pulp: RISI | Market Pulp, Hardwood and Eucalyptus: PPPC Global 100 Report December 2015
Recycled Fiber 242 million t
46% 54%
59%
18% 82%
59% 41%
41%
30% 70%
25%75%
Fiber Consumption412 million t
Pulp 169 million t
Chemical140 million t
Mechanical30 million t
Integrated Mills 83 million t
Market Pulp 57 million t
Hardwood31 million t
Other Eucalyptus Pulp producers:
16 million t
Softwood/Other 26 million t
Acacia/Other 9 million t
Eucalyptus21 million t
Industry Outlook(1)
10
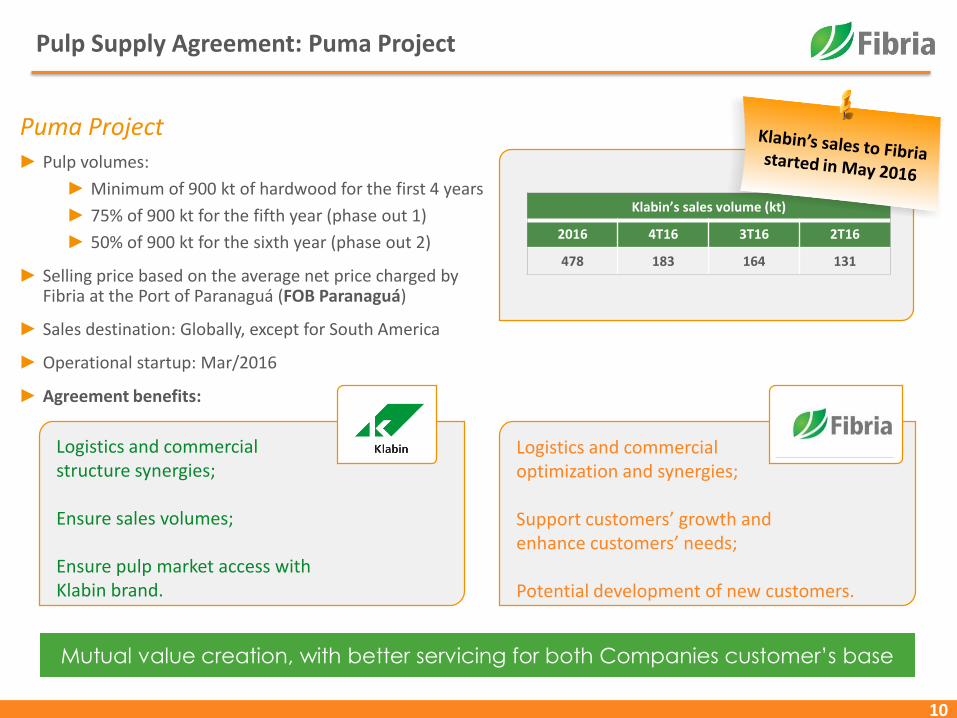
Pulp Supply Agreement: Puma Project
► Pulp volumes:
► Minimum of 900 kt of hardwood for the first 4 years
► 75% of 900 kt for the fifth year (phase out 1)
► 50% of 900 kt for the sixth year (phase out 2)
► Selling price based on the average net price charged by Fibria at the Port of Paranaguá (FOB Paranaguá)
► Sales destination: Globally, except for South America
► Operational startup: Mar/2016
► Agreement benefits:
Puma Project
Mutual value creation, with better servicing for both Companies customer’s base
Logistics and commercial structure synergies;
Ensure sales volumes;
Ensure pulp market access with Klabin brand.
Logistics and commercial optimization and synergies;
Support customers’ growth and enhance customers’ needs;
Potential development of new customers.
Klabin’s sales volume (kt)
2016 4T16 3T16 2T16
478 183 164 131

11
Pulp and Paper Market
12
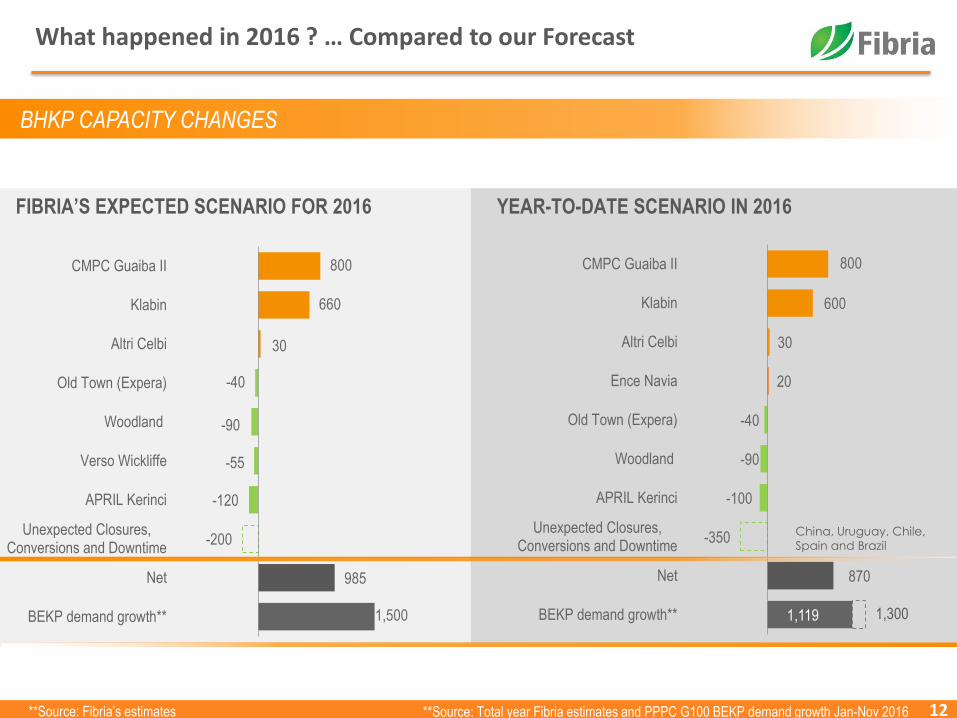
What happened in 2016 ? … Compared to our Forecast
BHKP CAPACITY CHANGES
**Source: Fibria’s estimates **Source: Total year Fibria estimates and PPPC G100 BEKP demand growth Jan-Nov 2016
FIBRIA’S EXPECTED SCENARIO FOR 2016 YEAR-TO-DATE SCENARIO IN 2016
1,119
870
-350
-100
-90
-40
20
30
600
800
BEKP demand growth**
Net
Unexpected Closures,Conversions and Downtime
APRIL Kerinci
Woodland
Old Town (Expera)
Ence Navia
Altri Celbi
Klabin
CMPC Guaiba II
1,3001,500
985
-200
-120
-55
-90
-40
30
660
800
BEKP demand growth**
Net
Unexpected Closures,Conversions and Downtime
APRIL Kerinci
Verso Wickliffe
Woodland
Old Town (Expera)
Altri Celbi
Klabin
CMPC Guaiba II
China, Uruguay, Chile,
Spain and Brazil

Actually... 2016 has been even more “balanced” than previous 2 years !
13
Ratio: Demand Growth /
Net Capacity Increase
2012 2013 2014 2015 2016
Eucalyptus Demand Growth
(Kt)
Hardwood Net Capacity
Increase (Kt)
370
1,305 1,619
1,088
1,300
30
605
1,770
1,450
870
Source: PPPC - Global 100 (historical demand), Outlook for Eucalyptus Market Pulp Oct 2016 and Fibria’s estimates
12.33 2.16 0.91 0.75 1.50
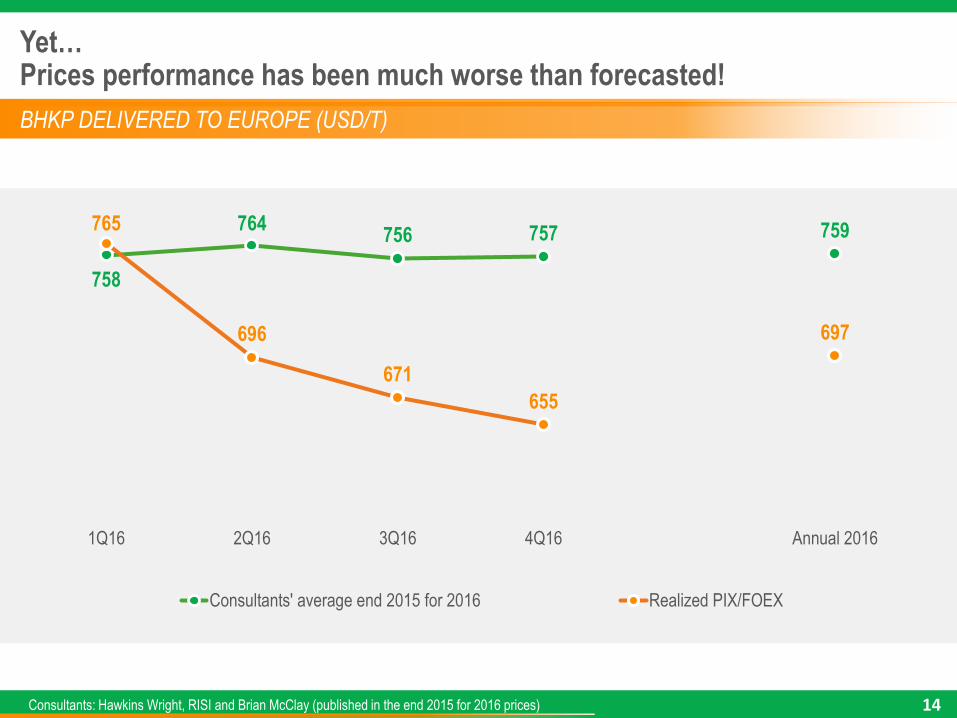
Yet…Prices performance has been much worse than forecasted!
14
BHKP DELIVERED TO EUROPE (USD/T)
Consultants: Hawkins Wright, RISI and Brian McClay (published in the end 2015 for 2016 prices)
758
764756 757 759765
696
671
655
697
1Q16 2Q16 3Q16 4Q16 Annual 2016
Consultants' average end 2015 for 2016 Realized PIX/FOEX

In our view, there is one major reason for this “lousy” market price scenario: 2016 Global growth has “ONLY” been relying on China
BHKP DEMAND (KT AND % CHANGE, Y-O-Y)
15Source: PPPC Global 100
2013 2014
2015 2016
5.3%
5.5%
-0.2%
19.0%
-300
0
300
600
900
1200
1500
Global NA WE China
3.3%
5.2% 2.0%5.2%
-300
0
300
600
900
1200
1500
Global NA WE China
3.3%
-3.5%
3.7%6.2%
-300
0
300
600
900
1200
1500
Global NA WE China
4.3%
-4.4% -2.6%
20,2%
-300
0
300
600
900
1200
1500
Global NA WE China

SO WHAT CAN WE EXPECT IN 2017 ? …SAME AS 2016 ?
BHKP CAPACITY CHANGES
16** Fibria’s estimates | Source: PPPC - Global 100 (historical demand), Outlook for Eucalyptus Market Pulp Oct 2016 and Fibria’s estimates
FIBRIA EXPECTED SCENARIO FOR 2017 IN THE END 2016 SCENARIO IN 2017
Ratio: Demand
Growth / Net
Capacity
Increase
2012 2013 2014 2015
Eucalyptus
Demand Growth
(Kt)
Hardwood Net
Capacity Increase
(Kt)
2016
370
1,305 1,619
1,088
1,300 1,350
30
605
1,770
1,450
870 770
2017
12.33 2.16 0.91 0.75 1.50 1.751,350
770
-550
-60
-40
-80
-300
-100
100
300
1,000
500
BEKP demand growth**
Net
Unexpected Closures,Conversions and Downtime
Navigator Cacia
Resolute Calhoun
Taiwan P&P
APRIL Rizhao
APRIL Kerinci
Metsa
Fibria TLS II
APP OKI
Klabin
17
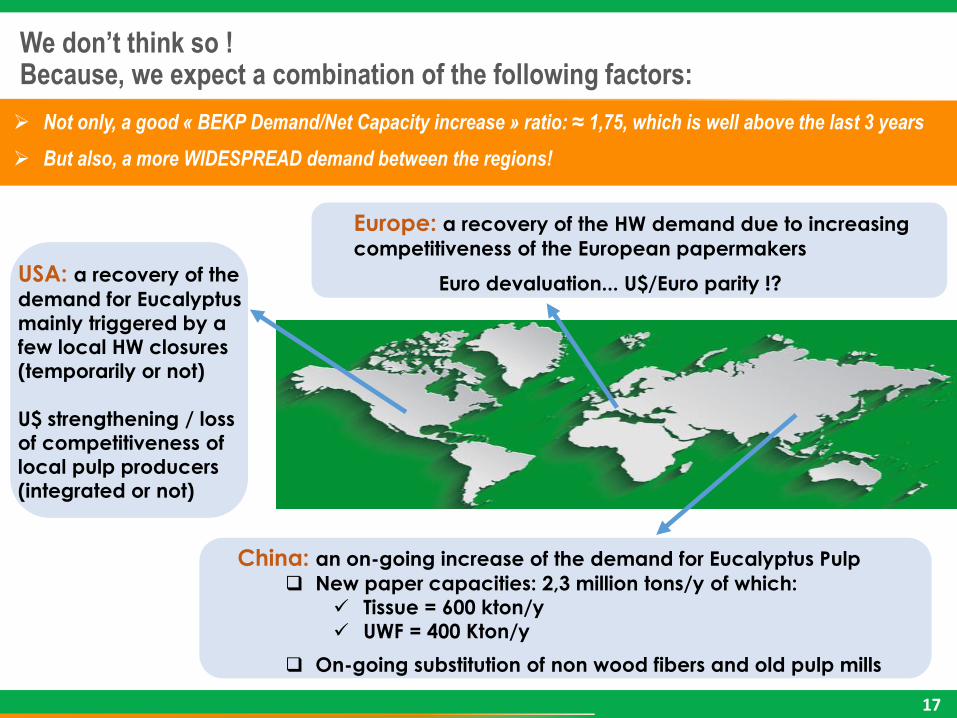
We don’t think so !Because, we expect a combination of the following factors:
USA: a recovery of the
demand for Eucalyptus
mainly triggered by a
few local HW closures
(temporarily or not)
U$ strengthening / loss
of competitiveness of
local pulp producers
(integrated or not)
Europe: a recovery of the HW demand due to increasing
competitiveness of the European papermakers
Euro devaluation... U$/Euro parity !?
China: an on-going increase of the demand for Eucalyptus Pulp
New paper capacities: 2,3 million tons/y of which:
Tissue = 600 kton/y
UWF = 400 Kton/y
On-going substitution of non wood fibers and old pulp mills
Not only, a good « BEKP Demand/Net Capacity increase » ratio: ≈ 1,75, which is well above the last 3 years
But also, a more WIDESPREAD demand between the regions!

18
100%
70%
75%
80%
85%
90%
95%
100%
105%
Feb
-13
Ap
r-1
3
Jun
-13
Au
g-1
3
Oct
-13
De
c-1
3
Feb
-14
Ap
r-1
4
Jun
-14
Au
g-1
4
Oct
-14
De
c-1
4
Feb
-15
Ap
r-1
5
Jun
-15
Au
g-1
5
Oct
-15
De
c-1
5
Feb
-16
Ap
r-1
6
Jun
-16
Au
g-1
6
Oct
-16
De
c-1
6
Min.
Shipments of Hardwood and Eucalyptus Pulp
Global Market BEKP Demand
2016 vs. 2015(1)
(1) Source: PPPC Global 100– December/2016
1,247kt
-158 kt
1,350kt
325 kt
42 kt
303kt
Total NorthAmerica
WesternEurope
China Others
BHKP BEKP
1,655kt
1,543kt
-270 kt
-233kt
8%
2% -3% -3%
15%
24%
4% 6%
(2) Source: PPPC Global 100– December/2016
4%
-5%
Operating Rate (shipments to capacity) - Hardwood (2)
(3) Source: PPPC Global 100– December/2016
CAGR BEKP 2012-2016(3)
2,763 kt
145 kt467 kt
1,700 kt
451 kt
16%
8%7%
40%
10%
Total NorthAmerica
WesternEurope
China Others
36
Days of Supply - Hardwood (2)
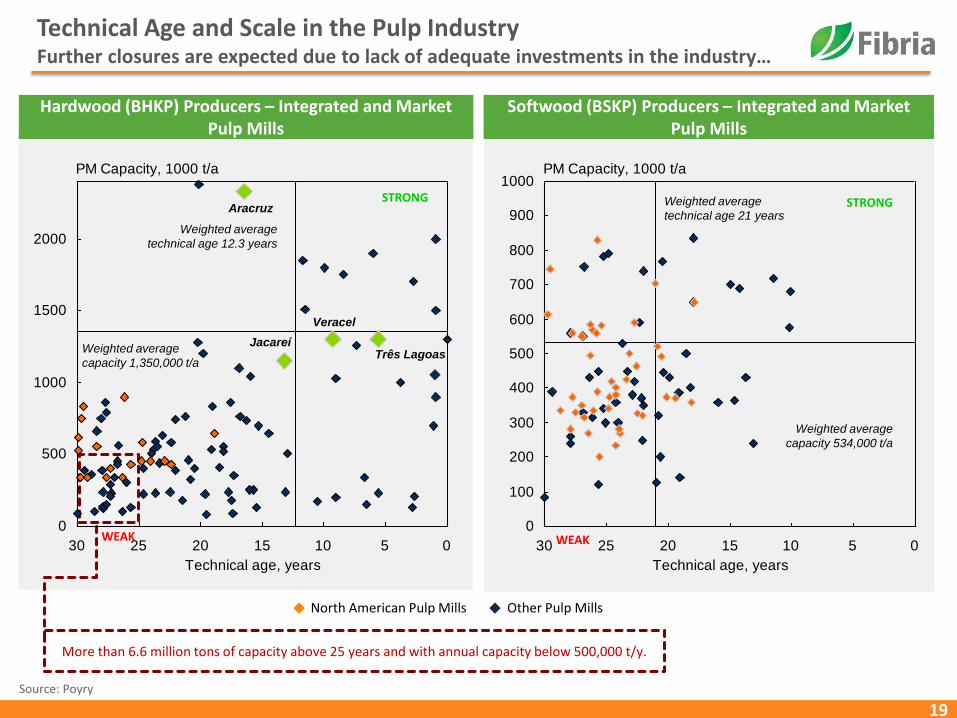
19
Technical Age and Scale in the Pulp IndustryFurther closures are expected due to lack of adequate investments in the industry…
Hardwood (BHKP) Producers – Integrated and Market Pulp Mills
Softwood (BSKP) Producers – Integrated and Market Pulp Mills
STRONG
Weighted average
technical age 12.3 years
Weighted average
capacity 1,350,000 t/a
Aracruz
Três Lagoas
Veracel
Jacareí
WEAK
STRONGWeighted average
technical age 21 years
Weighted average
capacity 534,000 t/a
North American Pulp Mills Other Pulp Mills
WEAK
More than 6.6 million tons of capacity above 25 years and with annual capacity below 500,000 t/y.
PM Capacity, 1000 t/a
0
500
1000
1500
2000
051015202530
Technical age, years
PM Capacity, 1000 t/a
0
100
200
300
400
500
600
700
800
900
1000
051015202530
Technical age, years
Source: Poyry

20
Source: PPPC. RISI and Public information as of November, 1st
Closures of Hardwood Market Pulp Capacity Worldwide(000 ton)
Capacity closures DO happen
-910
-85
-1,260-1,180
-540-500
-105
-1,085
-445
-315
-985
2006 2007 2008 2009 2010 2011 2012 2013 2014 2015 2016-2018 (1)
(1) Realized closures: as of September 2016 | 2016: -90kt Woodland (USA), -100kt April Kerinci (Indonesia), -40kt Old Town (Expera) | 2017: Resolute Calhoun: -40kt, -400kt April Kerinci and Rizhao (Indonesia), -80kt Taiwan P&P, -60kt Navigator Cacia | 2017/2018: -275kt Arauco Valdivia (Chile)
Closures do not include temporary movements. Unexpected downtimes/closure in 2016 totaled 350kt (not included in the chart above).
Potential Additional
Conversions
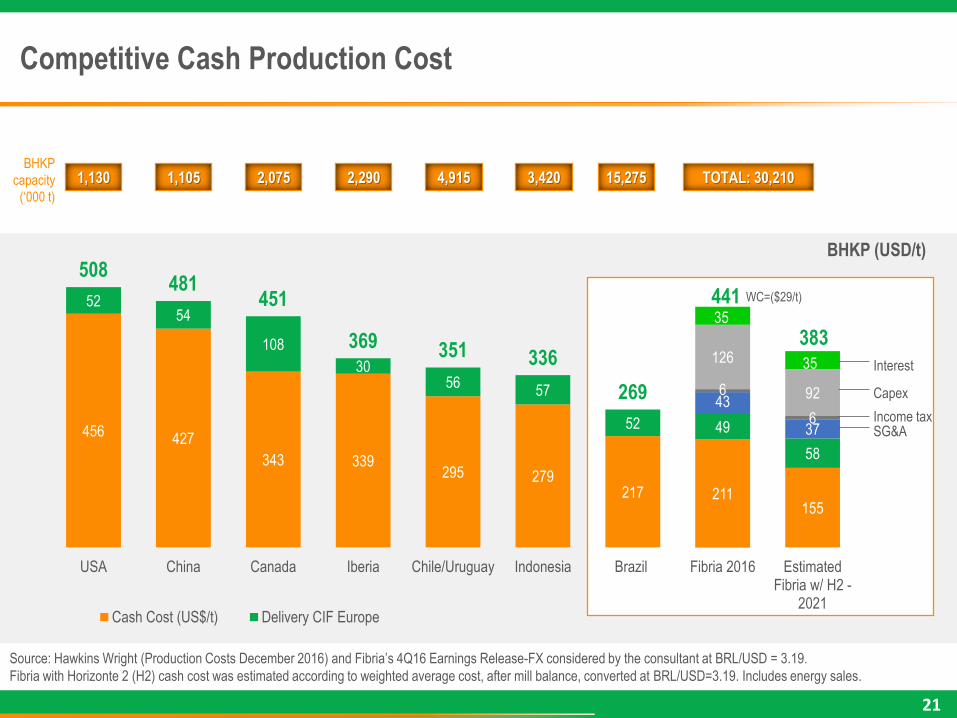
Competitive Cash Production Cost
21
Source: Hawkins Wright (Production Costs December 2016) and Fibria’s 4Q16 Earnings Release-FX considered by the consultant at BRL/USD = 3.19.
Fibria with Horizonte 2 (H2) cash cost was estimated according to weighted average cost, after mill balance, converted at BRL/USD=3.19. Includes energy sales.
456 427
343 339295 279
217 211155
5254
108
3056
57
52 49
58
508481
451
369 351 336
26943
37
6
6
126
92
35
35
441
383
USA China Canada Iberia Chile/Uruguay Indonesia Brazil Fibria 2016 EstimatedFibria w/ H2 -
2021Cash Cost (US$/t) Delivery CIF Europe
Capex
SG&AIncome tax
Interest
WC=($29/t)
BHKP (USD/t)
BHKP
capacity
(‘000 t)
1,130 1,105 2,075 2,290 4,915 3,420 15,275 TOTAL: 30,210

22
Gross capacity addition should not be counted as the only factorinfluencing pulp price volatility….(1)
Cap
acit
y A
dd
itio
ns
(00
0 t
on
)
0
0,5
1
1,5
2
2,5
0
200
400
600
800
1000
1200
2002 2003 2004 2005 2006 2007 2008 2009 2010 2011 2012 2013 2014 2015 2016 2017 2018
BHKP BSKP
Valdivia
APP Hainan
VeracelNueva Aldea
Santa Fé
Mucuri
FrayBentos
KerinciPL3
Três Lagoas
Rizhao
APP Guangxi
ChenmingZhanjiang
Eldorado
Montes del Plata
Maranhão
Guaíba II
APP South Sumatra(2)
Klabin
OjiNantong
Horizonte 2
Pu
lp p
rice
s -
CIF
Eu
rop
e (U
S$/t
on
)
(1) Source: Hawkins Wright , Poyry and Fibria Analysis. Pulp price estimates according to Hawkins Wright (Apr/16), Brian McClay (Jun/16) and RISI (Apr/16)(2) Partially integrated production.(3) Source: Bloomberg
Spread Europe Price @Jan 31st, 2017: US$151/t(3)
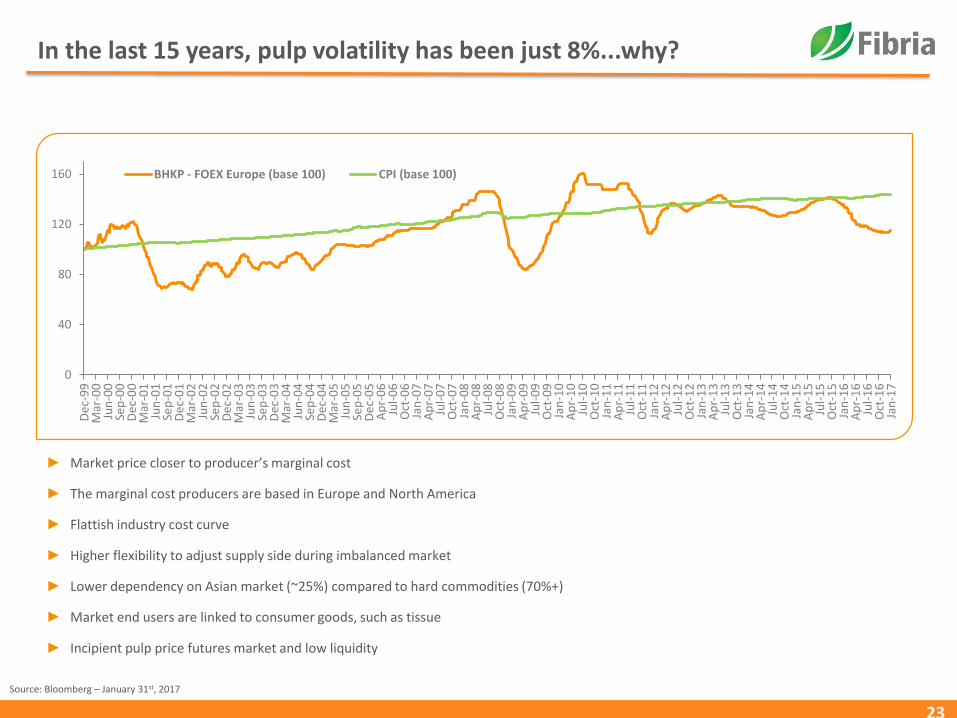
In the last 15 years, pulp volatility has been just 8%...why?
23
► Market price closer to producer’s marginal cost
► The marginal cost producers are based in Europe and North America
► Flattish industry cost curve
► Higher flexibility to adjust supply side during imbalanced market
► Lower dependency on Asian market (~25%) compared to hard commodities (70%+)
► Market end users are linked to consumer goods, such as tissue
► Incipient pulp price futures market and low liquidity
Source: Bloomberg – January 31st, 2017
0
40
80
120
160
De
c-9
9M
ar-0
0Ju
n-0
0Se
p-0
0D
ec-
00
Mar
-01
Jun
-01
Sep
-01
De
c-0
1M
ar-0
2Ju
n-0
2Se
p-0
2D
ec-
02
Mar
-03
Jun
-03
Sep
-03
De
c-0
3M
ar-0
4Ju
n-0
4Se
p-0
4D
ec-
04
Mar
-05
Jun
-05
Sep
-05
De
c-0
5A
pr-
06
Jul-
06
Oct
-06
Jan
-07
Ap
r-0
7Ju
l-0
7O
ct-0
7Ja
n-0
8A
pr-
08
Jul-
08
Oct
-08
Jan
-09
Ap
r-0
9Ju
l-0
9O
ct-0
9Ja
n-1
0A
pr-
10
Jul-
10
Oct
-10
Jan
-11
Ap
r-1
1Ju
l-1
1O
ct-1
1Ja
n-1
2A
pr-
12
Jul-
12
Oct
-12
Jan
-13
Ap
r-1
3Ju
l-1
3O
ct-1
3Ja
n-1
4A
pr-
14
Jul-
14
Oct
-14
Jan
-15
Ap
r-1
5Ju
l-1
5O
ct-1
5Ja
n-1
6A
pr-
16
Jul-
16
Oct
-16
Jan
-17
BHKP - FOEX Europe (base 100) CPI (base 100)

24
Lowest volatility among commodities
Source: Bloomberg – January 31st, 2017
Low volatility of hardwood pulp price, even though
new capacities have come on stream during the period.
20
50
80
110
140
170
200
230
Jan
-12
Feb
-12
Ma
r-1
2A
pr-
12
Ma
y-1
2Ju
n-1
2Ju
l-1
2A
ug
-12
Se
p-1
2O
ct-
12
No
v-1
2D
ec
-12
Jan
-13
Feb
-13
Ma
r-1
3A
pr-
13
Ma
y-1
3Ju
n-1
3Ju
l-1
3A
ug
-13
Se
p-1
3O
ct-
13
No
v-1
3D
ec
-13
Jan
-14
Feb
-14
Ma
r-1
4A
pr-
14
Ma
y-1
4Ju
n-1
4Ju
l-1
4A
ug
-14
Se
p-1
4O
ct-
14
No
v-1
4D
ec
-14
Jan
-15
Feb
-15
Ma
r-1
5A
pr-
15
Ma
y-1
5Ju
n-1
5Ju
l-1
5A
ug
-15
Se
p-1
5O
ct-
15
No
v-1
5D
ec
-15
Jan
-16
Feb
-16
Ma
r-1
6A
pr-
16
Ma
y-1
6Ju
n-1
6Ju
l-1
6A
ug
-16
Se
p-1
6O
ct-
16
No
v-1
6D
ec
-16
Jan
-17
Iron Ore Soy Bean Crude Oil Sugar BHKP - FOEX Europe Exchange Rate (R$/US$)
101
168
87
6054
100 = January 1, 2012
37% 34% 34%28% 26% 25% 24% 23%
17%14%
6%
WTI Crude Oil Sugar Nickel Iron Ore Copper Soy Ibovespa LME Metals Cattle FX BHKP
2Since January 1, 2009 up to January 31st, 2017
Historical Volatility of Commodities (US$) 2 – Lower than FX
86

25
Financial and Operational Highlights

26
Each 5% depreciation of the Real increases EBITDA by aroundR$420m and FCF by R$550m
815,0
1,488
1,173 1,1531,295 1,185
1,560
1,073
2009 2010 2011 2012 2013 2014 2015 2016 2017 (e)
Exchange Rate Average (R$/US$)
EBITDA Margin
EBITDA (US$ million)
Fibria net pulp price(US$/t)
Fibria net pulp price(R$/t)
2.00 1.76 1.67 1.95 2.16 2.35 3.33 3.49 3.40(1)
456,0
670,0 639,0 581,0 610,0 572,0 582
496 490(2)
29%
40%34% 36%
40% 39%
53%
43%
912 1,179 1,067 1,133 1,311 1,3441,951 1,731 1,666
(1) According to Focus Report (Brazilian Central Bank – January 31th, 2017) I (2) 2017 market consensus

27
Cash Production Cost (R$/t) – 4Q16
618680
581
649
2015 2016
With downtimes Without downtimes
620 624 648
4Q15 3Q16 4Q16
Cash Production Cost (R$/t)Cash Production Cost Ex-downtimes (R$/t)
+4.5%
658
737 727 42
35
(12)
10 4
(10)
4Q15 Highermaintenancedowntimes
impact
Inflation FX Lower energyprice
Wood Total Managementgains
4Q16
External factors
28
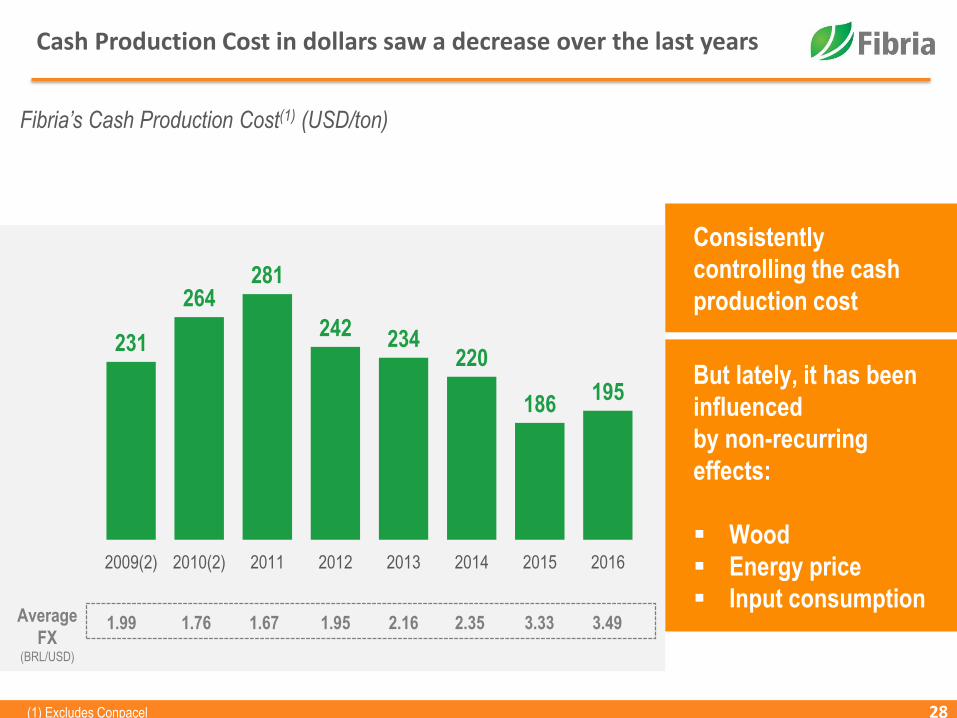
Cash Production Cost in dollars saw a decrease over the last years
But lately, it has been
influenced
by non-recurring
effects:
Wood
Energy price
Input consumption
Consistently
controlling the cash
production cost
Fibria’s Cash Production Cost(1) (USD/ton)
231
264281
242 234220
186195
2009(2) 2010(2) 2011 2012 2013 2014 2015 2016
1.99 1.76 1.67 1.95 2.16 2.35 3.33 3.49Average
FX (BRL/USD)
(1) Excludes Conpacel

Net Results (US$ million) –2016
29
1,073
477
488
201(118)
(569)
(396)
(202)
AdjustedEBITDA
FX Debt MtMhedge
Net interest Deprec., amortiz. and
depletion
Income Taxes Others Net income∆∆
deferred
current
Non-recurring effects
(1) Includes other Exchange rate/monetary variations, other financial income/expense and other operating income/expenses
(1)
Minimum proposed dividend of R$393 million(2)
(2) Equivalent to minimum annual dividend of 25% of net income, adjusted by the changes in reserves
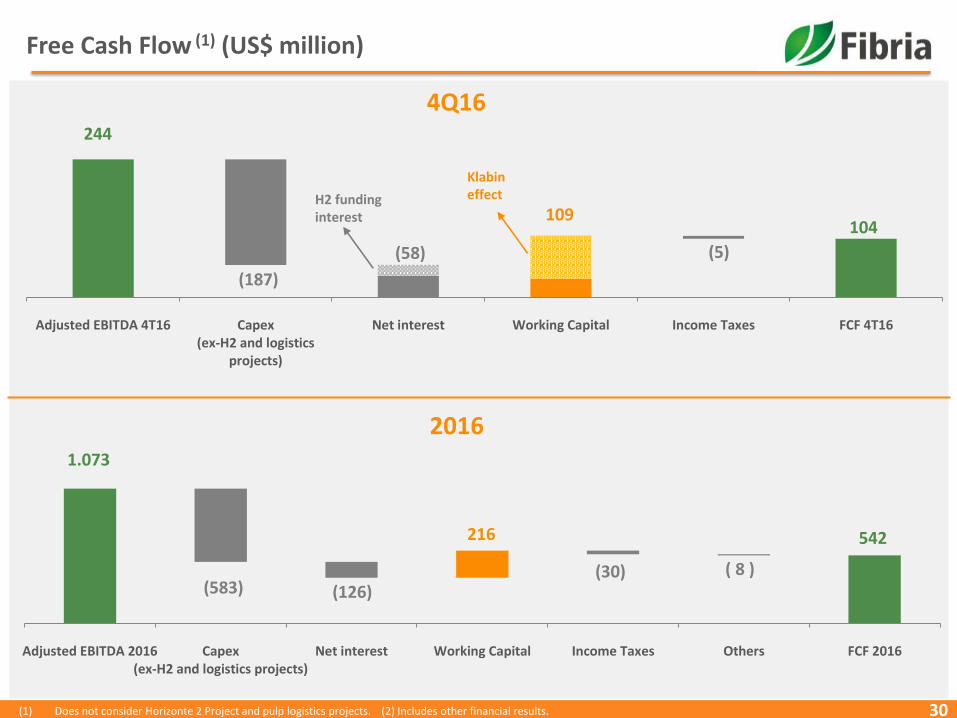
30(1) Does not consider Horizonte 2 Project and pulp logistics projects. (2) Includes other financial results.
Free Cash Flow (1) (US$ million)
1.073
542
(583) (126)(30) ( 8 )
Adjusted EBITDA 2016 Capex(ex-H2 and logistics projects)
Net interest Working Capital Income Taxes Others FCF 2016
216
Klabin effectH2 funding
interest
244
104
(187)
(58) (5)
109
Adjusted EBITDA 4T16 Capex(ex-H2 and logistics
projects)
Net interest Working Capital Income Taxes FCF 4T16
4Q16
2016

31
ROE and ROIC (R$)
ROE = Adjusted EBIT(1)/ Equity before IAS 41(2) ROIC = Adjusted EBIT(3)/ Invested Capital before IAS 41(2)
(1) Adjusted EBITDA – CAPEX – Net Interest – Taxes (2) International accounting standards for biological assets.(3) Adjusted EBITDA – CAPEX – Taxes
AverageFX
(R$/US$)1.95 2.16 2.35 3.33 3.49 1.95 2.16 2.35 3.33 3.49
AverageNet Pulp
Price(US$)
581 610 561 586 496 581 610 561 586 496
AverageFX
(R$/US$)
AverageNet Pulp
Price(US$)
3.4%5.7% 6.2%
25.1%
8.9%
2012 2013 2014 2015 2016
6.9%9.2%
8.0%
22.8%
9.0%
2012 2013 2014 2015 2016
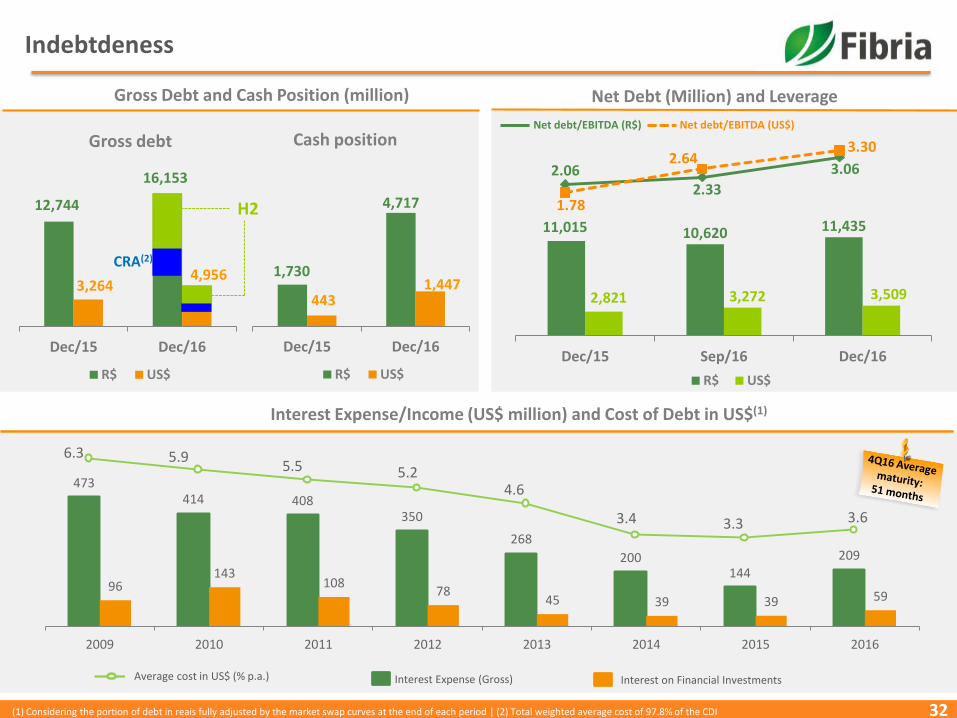
32
Indebtdeness
Gross Debt and Cash Position (million) Net Debt (Million) and Leverage
Interest Expense/Income (US$ million) and Cost of Debt in US$(1)
473414 408
350
268
200144
209
96143
10878
45 39 39 59
2009 2010 2011 2012 2013 2014 2015 2016
6.3 5.95.5 5.2
4.6
3.4 3.3 3.6
Interest Expense (Gross)Average cost in US$ (% p.a.) Interest on Financial Investments
6.3 5.95.5
5.24.6
3.4 3.3(1)
Cost of debt
(1) Considering the portion of debt in reais fully adjusted by the market swap curves at the end of each period | (2) Total weighted average cost of 97.8% of the CDI
2.062.33
3.06
1.78
2.643.30
11,015 10,620 11,435
2,821 3,272 3,509
Dec/15 Sep/16 Dec/16
R$ US$
Net debt/EBITDA (R$) Net debt/EBITDA (US$)
1,730
4,717
443 1,447
Dec/15 Dec/16
Cash position
R$ US$
12,744
16,153
3,2644,956
Dec/15 Dec/16
Gross debt
R$ US$
H2
CRA(2)

33
0.4
1.6
0.20.3
0.1
0.1
0.2
0.8
Export Prepayment CRA BNDES FDCO ECA Working capitalrelease (2)
Total
0,3 - 20170,1 - 2018
0.3
0.1
0,2 - 2017
3Q153Q15
0,1 - 2017
0.3
2.4
0,1 – 2017
Robust Liquidity – USD million(@December 31, 2016)
1,442
541
349559
919786
629356
534691
8928
714
Liquidity 2017 2018 2019 2020 2021 2022 2023 2024 2025 2026 2027
Pré-pagto. BNDES
NCE ACC/ACE
Voto IV Bonds
Finnvera CRA e Outros
Cash on hand(1)
Revolver
2,683
Capex H2 (2):
(1) Capex to be executed on Horizonte 2 Project | (2) Related to the agreement with Klabin
Horizonte 2 Funding (US$ billion)
(1) Not including US$18 million related to MtM of hedging transactions. | (2) Financial execution of US$1,248 million capex until December, 2016.
Funds withdrawn until Dec 31, 2016. Contracted funds to be withdraw
886 61
Bond 2027 on Jan 11th, 2017: US$700 million |
coupon of 5.5% p.a.
0.4
Horizonte 2 Project
US$2.2 bn
Excess of US$0.2 bn

34
Initiatives for Leverage Management
Amount
Net
Debt/EBITDA
reduction
(USD
million)(x)
Working Capital Release 95 0.09x
Accounts receivable (customers) 40 0.04x
Accounts payable (suppliers) 55 0.05x
Capex 96 0.10x
Forestry 31 0.03x
Capex H2 65 0.07x
Total 191 0.19x
Initiatives expected to be implemented
in the short term
Initiatives under analysis
Amount
Net
Debt/EBITDA
reduction
(USD
million)(x)
Accounts payable (suppliers) 420 0.37x
Others 110 0.12x
Total 530 0.49x
Total: USD 721 million (0.68x)

35
Waiver on 4.5x Covenant was Fully NegotiatedHorizonte 2 start up in 4Q17 boosts EBITDA and FCF generation
Leverage guidelines:
Range of 2.0x to 2.5x net debt/EBITDA
Maximum 3.5x net debt/EBITDA during expansion
cycles
Highlights:
Covenants only triggered if Fibria loses the
Investment Grade by 2 of the 3 rating agencies
During the most critical periods of expansion, 4.5x
covenant was waived
NET DEBT/EBITDA (USD)
1.86 2.10
2.64
4.5 4.5
1Q16 2Q16 3Q16 4Q16 1Q17 2Q17 3Q17 4Q17 2018 2019
Actual (in US$)
Covenant level Waiver
3.5x
2.0x – 2.5x
Indebtness and
Liquidity limits (1)
(1) As stated on the Liquidity and Indebtedness Policy and Shareholders Agreement
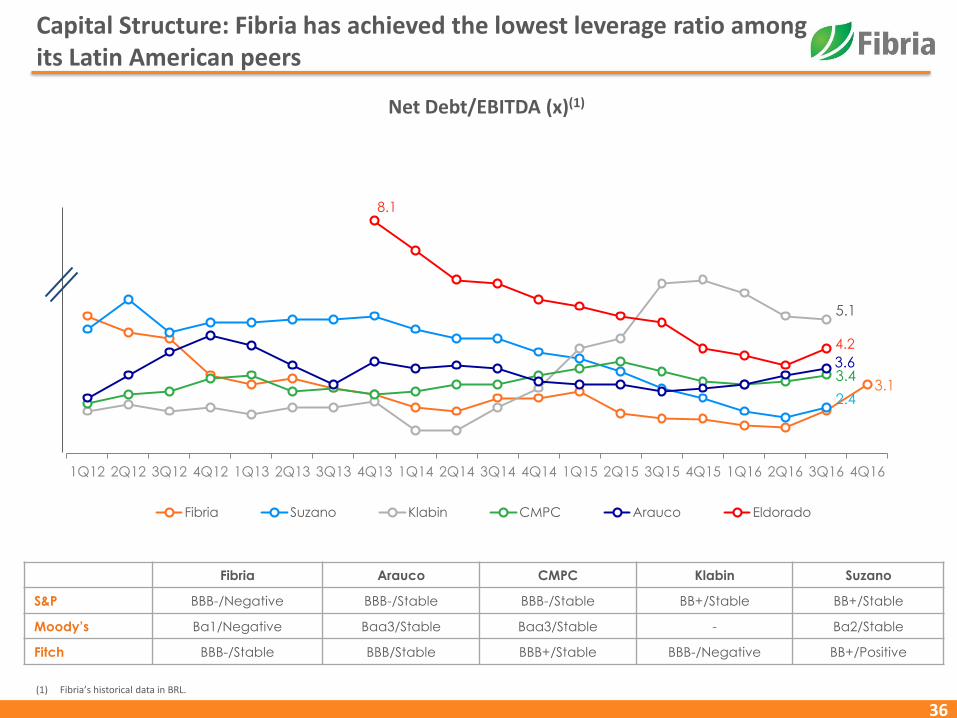
36
Capital Structure: Fibria has achieved the lowest leverage ratio among its Latin American peers
Net Debt/EBITDA (x)(1)
Fibria Arauco CMPC Klabin Suzano
S&P BBB-/Negative BBB-/Stable BBB-/Stable BB+/Stable BB+/Stable
Moody’s Ba1/Negative Baa3/Stable Baa3/Stable - Ba2/Stable
Fitch BBB-/Stable BBB/Stable BBB+/Stable BBB-/Negative BB+/Positive
(1) Fibria’s historical data in BRL.
3.12.4
5.1
3.43.6
8.1
4.2
1Q12 2Q12 3Q12 4Q12 1Q13 2Q13 3Q13 4Q13 1Q14 2Q14 3Q14 4Q14 1Q15 2Q15 3Q15 4Q15 1Q16 2Q16 3Q16 4Q16
Fibria Suzano Klabin CMPC Arauco Eldorado
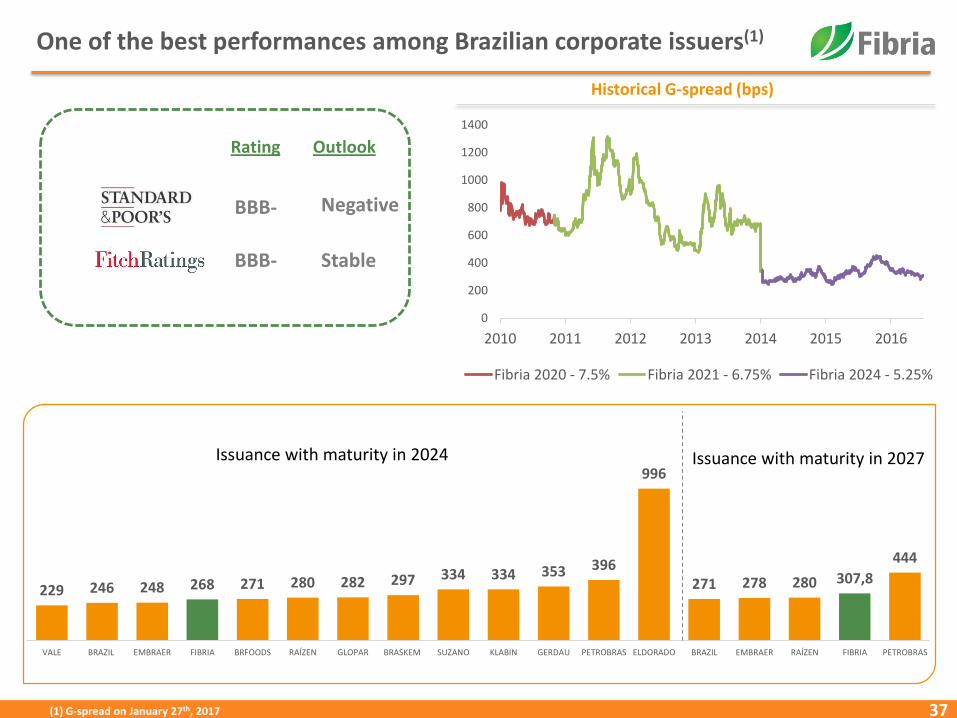
37
One of the best performances among Brazilian corporate issuers(1)
(1) G-spread on January 27th, 2017
Historical G-spread (bps)
BBB-
BBB-
Rating Outlook
Negative
Stable
0
200
400
600
800
1000
1200
1400
2010 2011 2012 2013 2014 2015 2016
Fibria 2020 - 7.5% Fibria 2021 - 6.75% Fibria 2024 - 5.25%
229 246 248 268 271 280 282 297 334 334 353 396
996
271 278 280 307,8
444
VALE BRAZIL EMBRAER FIBRIA BRFOODS RAÍZEN GLOPAR BRASKEM SUZANO KLABIN GERDAU PETROBRAS ELDORADO BRAZIL EMBRAER RAÍZEN FIBRIA PETROBRAS
Issuance with maturity in 2024 Issuance with maturity in 2027

38
2017 OUTLOOK – CAPEX AND CASH COST

Fibria CAPEX 2017– BRL million
39
(1) Converted at 2017 average FX - BRL/USD 3.40, according to Focus Report (Brazilian Central Bank – Jan 31th, 2017)
2,145 57
3,011
2017 CAPEX MaintenanceGuidance (including
modernization)
Logistics Projects H2 2017 CAPEX Total Guidance
5,213
USD630 mn(1)
USD1,533 mn(1)
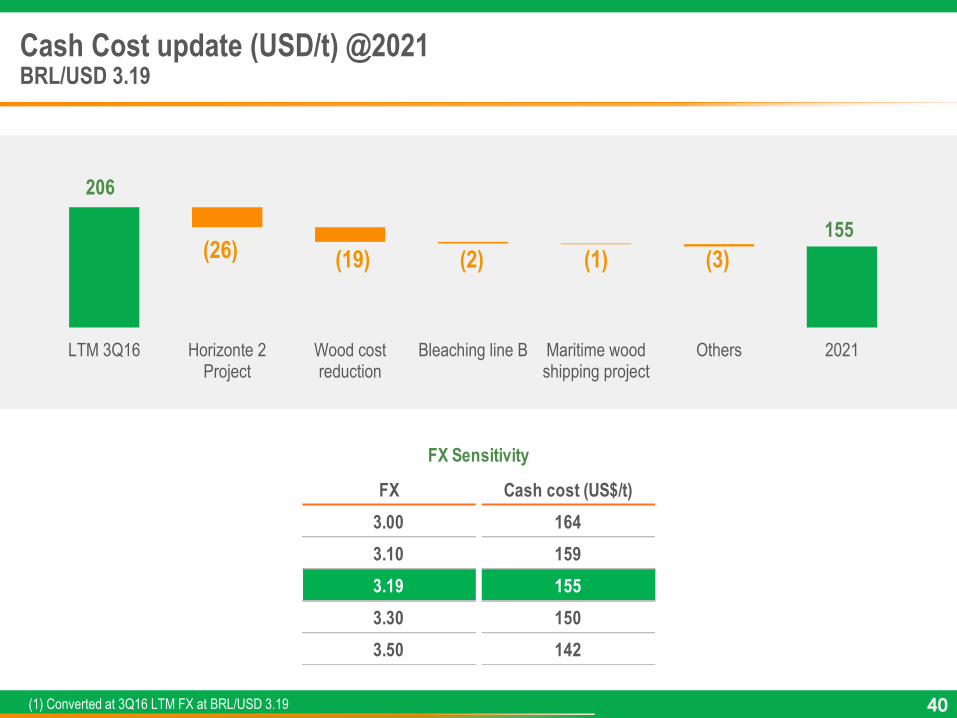
Cash Cost update (USD/t) @2021BRL/USD 3.19
40(1) Converted at 3Q16 LTM FX at BRL/USD 3.19
206
155 (26) (19) (2) (1) (3)
LTM 3Q16 Horizonte 2Project
Wood costreduction
Bleaching line B Maritime woodshipping project
Others 2021
FX Cash cost (US$/t)
3.00 164
3.10 159
3.19 155
3.30 150
3.50 142
FX Sensitivity

41
Expansion Project – Horizonte 2

42
• Follow the growth of strategic customers
• Developing new customers
• Distribution to new geographic markets
• Efficiency and competitiveness gains in logistics
• Higher quality in customer service
• Greater ability to capture new expansion market windows
• Strong M&A position
Competitiveness
Commercial
positioning
Long-term growth
potential
What is the importance of growth for Fibria?
• Wider fixed costs dilution
• Cost curve position improvement
• Greater bargaining power with suppliers
43
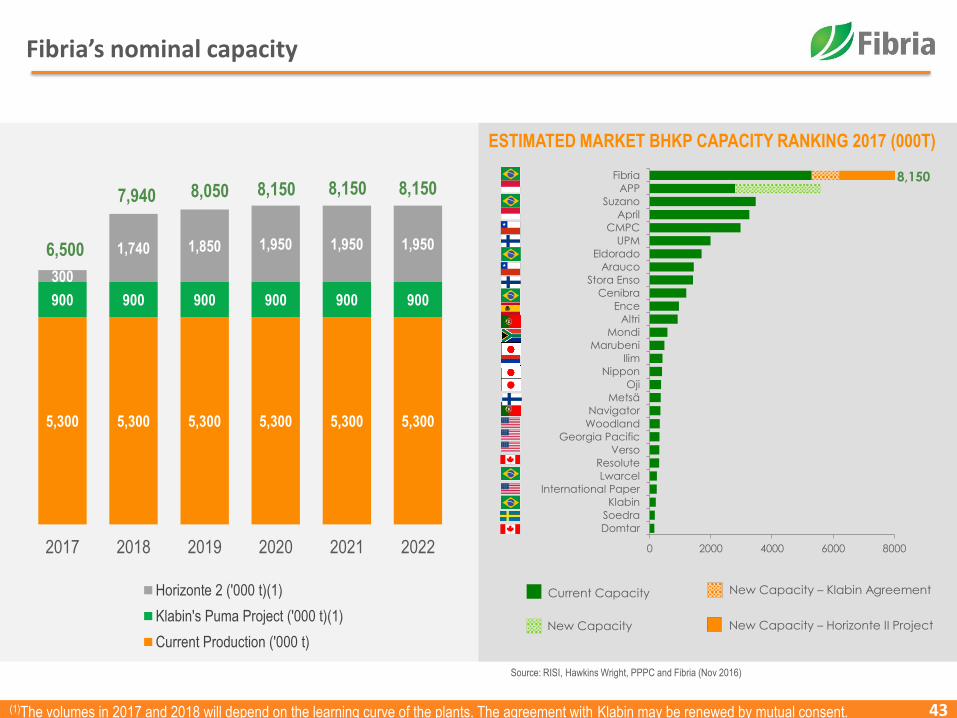
Fibria’s nominal capacity
5,300 5,300 5,300 5,300 5,300 5,300
900 900 900 900 900 900
300
1,740 1,850 1,950 1,950 1,950
2017 2018 2019 2020 2021 2022
Horizonte 2 ('000 t)(1)
Klabin's Puma Project ('000 t)(1)
Current Production ('000 t)
ESTIMATED MARKET BHKP CAPACITY RANKING 2017 (000T)
6,500
7,940 8,050 8,150 8,150 8,150
Source: RISI, Hawkins Wright, PPPC and Fibria (Nov 2016)
0 2000 4000 6000 8000
Domtar
Soedra
Klabin
International Paper
Lwarcel
Resolute
Verso
Georgia Pacific
Woodland
Navigator
Metsä
Oji
Nippon
Ilim
Marubeni
Mondi
Altri
Ence
Cenibra
Stora Enso
Arauco
Eldorado
UPM
CMPC
April
Suzano
APP
Fibria 8,150
Current Capacity
New Capacity
New Capacity – Klabin Agreement
New Capacity – Horizonte II Project
(1)The volumes in 2017 and 2018 will depend on the learning curve of the plants. The agreement with Klabin may be renewed by mutual consent.
44
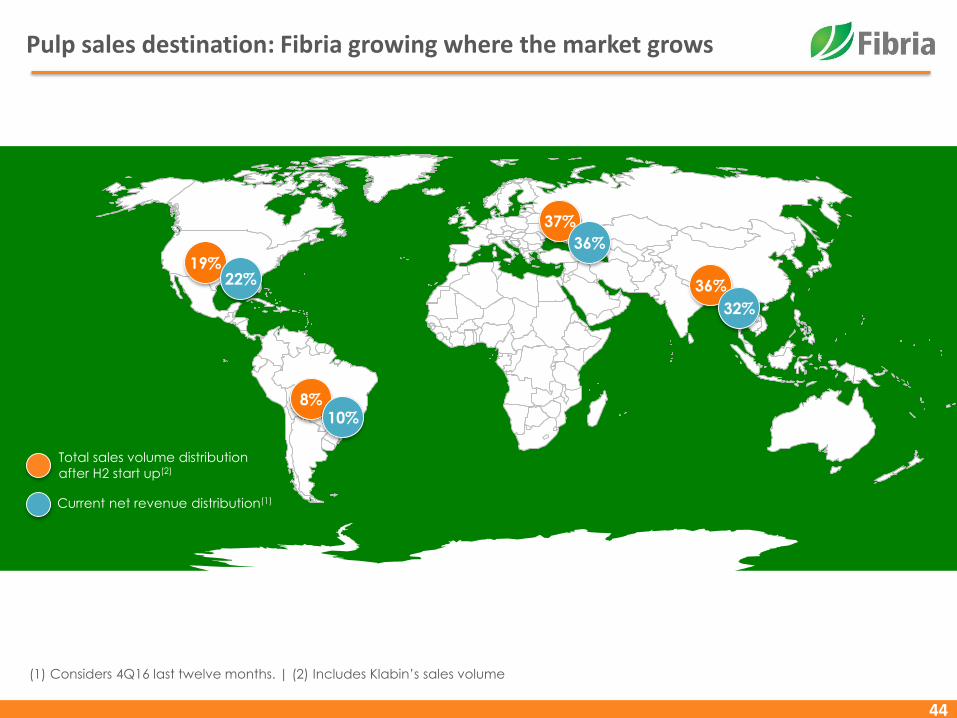
Pulp sales destination: Fibria growing where the market grows
(1) Considers 4Q16 last twelve months. | (2) Includes Klabin’s sales volume
37%
36%
36%
32%
19%22%
8%10%
Total sales volume distribution
after H2 start up(2)
Current net revenue distribution(1)
45
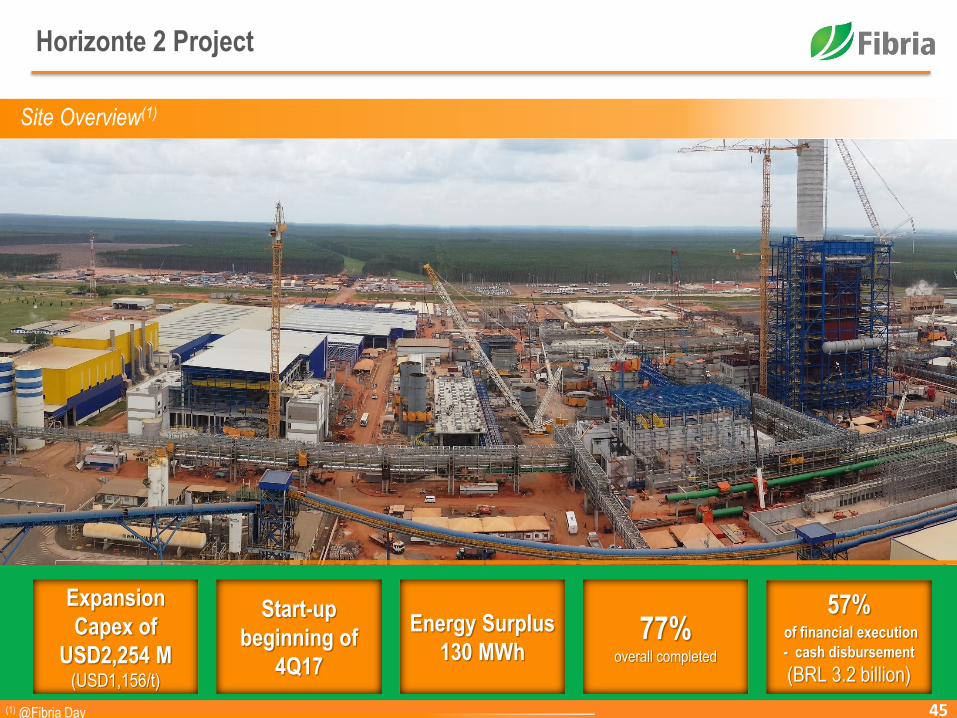
Horizonte 2 Project
Site Overview(1)
57%of financial execution
- cash disbursement
(BRL 3.2 billion)
77%overall completed
Energy Surplus
130 MWh
Start-up
beginning of
4Q17
Expansion
Capex of
USD2,254 M (USD1,156/t)
(1) @Fibria Day

46
Already planted since project approval
125,000 ha
To be planted
62,000 ha
Total
187,000 ha
Wood purchased
5.0 million m3
7,000 ha to be planted in 2016
55,000 ha to be planted in 2017 and 2018
Average distance from forest to mill H1 + H2 up to 100 km
Horizonte 2 Forestry BaseForestry base secured as planned

47
Logistics
Mato Grosso
Mato Grosso do
Sul
Goiás
Brasilia
Port Terminal 32

48
CapexFlexibility in the Timetable, without changing the startup date
TOTAL CAPEX (BRL BILLION) CAPEX EXECUTION TIMETABLE (BRL MILLION)
292
4,0263,011
200
2015 2016 2017 2018
8.745 7.529
Nov. 2015Forecast
CurrentForecast
3%
50%
39%
- BRL 1,216 mn
USD 2.396 bn(1) USD 80 mn USD 886 mn USD 61 mn
(1) FX = 3.65 BRL/USD on previous forecast. FX = 3.40 BRL/USD on current forecast. (2) Average FX according to capex execution.
USD 2.213 bn(1)
3.33FX(2) 3.40 3.28
8%
3.49
USD 1,168 mn

49
8.7
4.3
3.2
7.5
November, 2015 Savings,Contingencies
and indirect costs
FX Inflation Others December, 2016
To be
disbursed
Executed
USD 2,214 USD 2,213
BRL/USD 3.95 BRL/USD 3.40
BRL/
USD
3.39
BRL/
USD
3.46
Historical Horizonte 2 Project Capex (USD billion)

50
FundingCost and maturity
Amortization Schedule (2) – 4Q16 Proforma with TLS II + Bond 2027 (700 MM) – US$ million
Average Cost (US$ p.a)(1)
Average Maturity (years)
(1) Swap Bloomberg | (2) FX considering new funding for the TLS II Project: 3.2591
2,147
541
2,688
349569
1,001869
712
438616
773
17268
728
Caixa 2017 2018 2019 2020 2021 2022 2023 2024 2025 2026 2027
BNDES Bond EPP ECN ACC/ACE CRA BNB Finnvera Finame Development Agencies (FCO, Finep & FDCO)
Revolver
Cash on
hand
4T16 4T16 + H2
3,6%
4,3
3,5%
4,5
4T16 + H2 + Bond
3,7%
5,1
H2
2,9%
6,2

51
Horizonte 2 project assumptions
(1) Includes chemical leasing and to increase capacity to 1,950 kt/year (FX BRL/USD @3.32)
(2) Estimated sustaining capex in perpetuity (FX BRL/USD @ 3.30)
(3) Estimated weighted average cost, after mill balance. Includes energy sales (FX BRL/USD @3.30)
UNIT R$ US$
Pulp production/year k tons 1,950 1,950
Expansion capex(1) $ billion 7,492 2,254
Expansion capex(1) $/t 3,854 1,156
Sustaining capex(2) $/t 208 63
Cash production cost(3) $/t 340 103
Energy surplus MWh 130 130
Project approval FX BRL/USD 2.80 -
All in cash cost (estimated range)(4) $/t - 270-320
Net pulp price(5) $/t - 490
Free Cash Flow (estimated) $/t - 170-220
Payback period (estimated) years - 5.3-6.8
(4) Cash cost + freight + SG&A + Sustaining Capex + Interest + taxes (FX BRL/USD @3.30)
(5) 2017 market consensus.

52
Final Remarks
• Economies of scale
• Synergies with current operations
• Wood availability and low distance from forest to mill
• Fibria’s total energy surplus to be increased by 130 MWh
• Cash cost competitiveness
• Meet customers’ demand growth
• Attractive returns even in adverse scenarios of pulp price and BRL
• Solid financial profile

53
BACK UP

54
Green Bond 2027
55
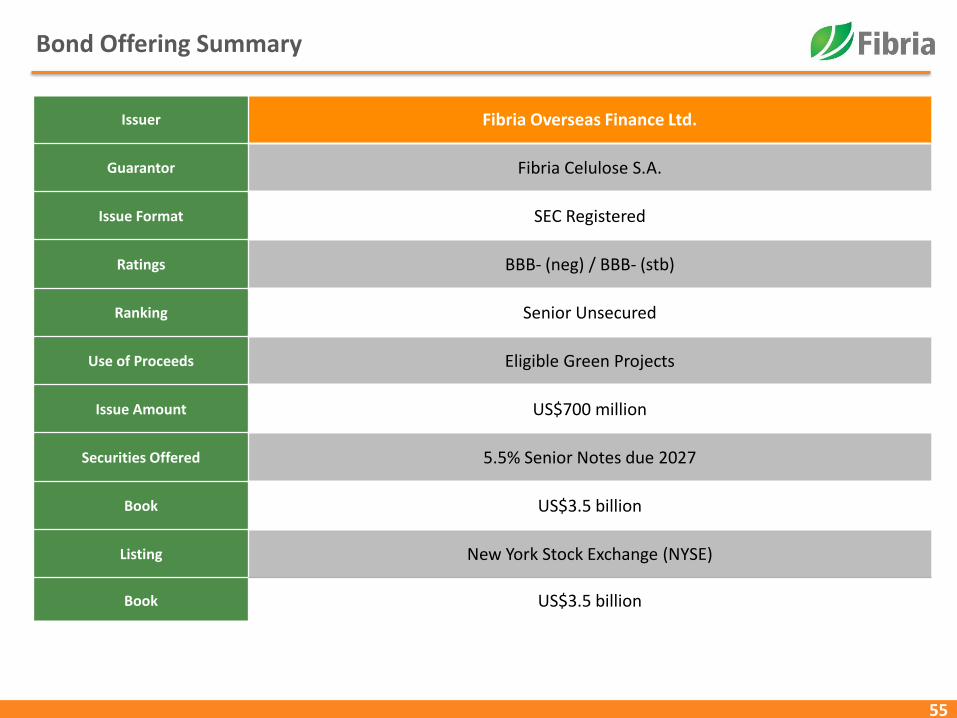
Bond Offering Summary
Issuer Fibria Overseas Finance Ltd.
Guarantor Fibria Celulose S.A.
Issue Format SEC Registered
Ratings BBB- (neg) / BBB- (stb)
Ranking Senior Unsecured
Use of Proceeds Eligible Green Projects
Issue Amount US$700 million
Securities Offered 5.5% Senior Notes due 2027
Book US$3.5 billion
Listing New York Stock Exchange (NYSE)
Book US$3.5 billion

56
– Fibria sustainably manages forested areas toFSC® and PEFC standards, to include:
• Production and acquisition of eucalyptusseedlings
• Preparation of soil for the plantation of seedlingsincluding subsoiling and harrowing activity
• Plantation of seedlings
• Protection and maintenance of planted seedlingsup to harvest
– Environmental Benefit / Impact: Withmanagement to these standards, Fibria is contributingto:
• Carbon sequestration;
• Water quality and cycle regulation;
• Erosion control, soil protection and nutrientcycling;
• Natural areas protection
Pro
du
ctiv
ity
ind
ex /
ye
ar
Note: Fibria has long-term targets (1) to reduce by one third the
amount of land required for pulp production and (2) double carbon
sequestration from the atmosphere. These projects will help to
contribute to this end.
Fibria’s Forest Management
Neighboringareas
FSC License Codes FSC-C100042, FSC-C100704, FSC-C110130
Sustainable Forest Management
Source: Information previously disclosed in public Fibria reports

57
– Fibria invests in projects to restore natural vegetationcover in degraded land, to include:• Acquisition of new native Brazilian seedlings
• Planting native Brazilian seedlings in degraded land
• Creation of ecological corridors and mosaics ineucalyptus plantations so they can serve as wildlife andflora habitat conservation
• Studies that evaluate and monitor the conservation ofHCV areas
– Environmental Benefit / impact: Fibria’s effort to restorenative forest areas has increased forest coverage andbiodiversity, led to improvements in ecosystem services,including:• Carbon sequestration
• Availability and quality of water
• Erosion control, soil protection and nutrientcycling
• Habitat provision
Note: This category contributes to Fibria’s long-term targets to (1) double
carbon sequestration and (2) to promote the environmental restoration of 40
thousand hectares between 2012 and 2025. Since 2012, 13.9 thousand
hectares of environmental restoration has occurred, 35% of the target. 2,402
hectares were restored in 2015 alone. The goal for 2016 will be to restore
2,603 hectares.
Before (2012)
After (2016)
Restoration of Native Trees and Conservation of Biodiversity
Source: Information previously disclosed in public Fibria reports

58
– Conversion of Production Plant Waste to Soil AcidityCorrective
• At Fibria’s Jacarei and Três Lagoas mills, there is asystem in place to collect byproducts of the industrialprocess and convert this material into a soil aciditycorrective, to be used in Fibria’s forest areas
• The process collects ash, grits, dregs and lime mud fromthe production process and the transformed productreplaces the use of calcium carbonate
– Environmental Benefit & Impact: Fibria’s process totransform the mill byproducts in soil acidity corrective hasresulted in:
• ~30% reduction in waste sent to external landfills fromthe mill sites
Note: Fibria has a long-term target to increase eco-efficiency, by reducing in 91% the quantity of industrial waste
disposed in own or third-party landfills. This project will contribute to meeting the company’s long term goal to reduce
the amount of solid waste sent to landfill to 5kg/adt, by 2025.
Waste Management
Source: Information previously disclosed in public Fibria reports

59
– Water Recycling and Re-use at Aracruz Mill
Fibria has a range of projects at the Aracruz Millthat reduce water usage
• Reduce the consumption of sealing water ofvacuum pumps of the dryer;
• Reuse water in the hydraulic units of the pressesand baling units;
• Reuse of the cooling water of furnaces in theWater Treatment Plant currently released aseffluent;
• Connect the cooling tower to the causticizingtower, so that water expelled from the coolingtower is then used in the causticizing tower
– Environmental Benefit & Impact: The various water efficiency projects are designed to achieve:
• 310 m3/h reduction in the water withdrawn from the total intake water to the industrial operation.
• This reduction is equivalent to 3.9% in industrial water intake at the mill
Water Efficiency
Source: Information previously disclosed in public Fibria reports

60
Cost reduction initiatives and industry statistics
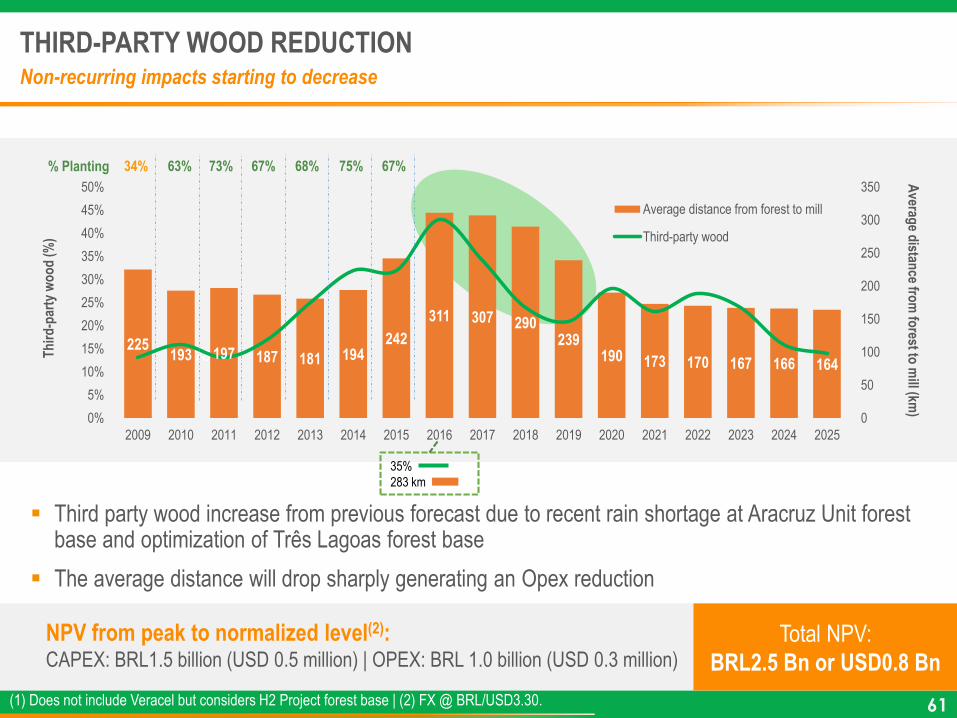
THIRD-PARTY WOOD REDUCTIONNon-recurring impacts starting to decrease
Third party wood increase from previous forecast due to recent rain shortage at Aracruz Unit forest base and optimization of Três Lagoas forest base
The average distance will drop sharply generating an Opex reduction
61(1) Does not include Veracel but considers H2 Project forest base | (2) FX @ BRL/USD3.30.
NPV from peak to normalized level(2):CAPEX: BRL1.5 billion (USD 0.5 million) | OPEX: BRL 1.0 billion (USD 0.3 million)
Total NPV:
BRL2.5 Bn or USD0.8 Bn
788Th
ird
-par
ty w
oo
d (
%)
225193 197 187 181 194
242
311 307 290239
190 173 170 167 166 164
0
50
100
150
200
250
300
350
0%
5%
10%
15%
20%
25%
30%
35%
40%
45%
50%
2009 2010 2011 2012 2013 2014 2015 2016 2017 2018 2019 2020 2021 2022 2023 2024 2025
Average distance from forest to mill
Third-party wood
Averag
e distan
ce from
forest to
mill (km
)
68%34% 63% 73% 67% 75% 67%% Planting
35%
283 km

► Most part of the standing wood was already paid
► Despite the higher forest to mill distance, the wood from Losango is less expensive than the
available wood from around Espírito Santo and Bahia States
► Positive impact over industrial costs due to better productivity
Third-party wood reduction
Losango
68

Industrial: maintenance downtimes schedule change
► Regulatory Standard 13 (Boiler and Pressure Vessel Inspection) extended the maximum period between recovery boiler inspections from 12 to 15 months.
► Fibria was the first company to use the extended period benefit
► NPV: R$385 million
76
64
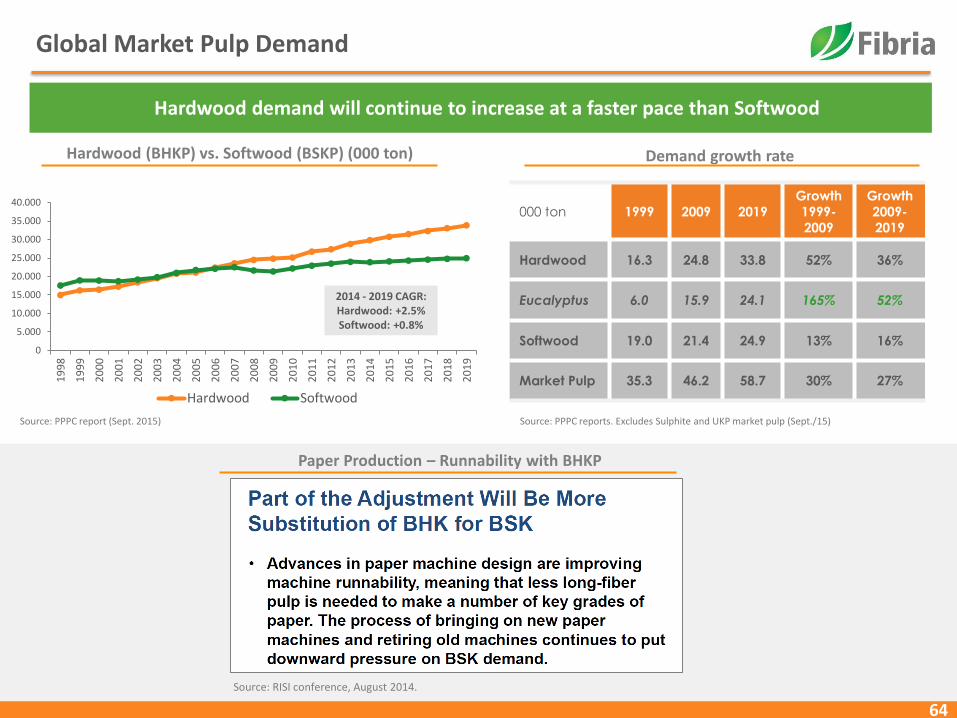
Global Market Pulp Demand
Demand growth rateHardwood (BHKP) vs. Softwood (BSKP) (000 ton)
Hardwood demand will continue to increase at a faster pace than Softwood
Source: PPPC report (Sept. 2015) Source: PPPC reports. Excludes Sulphite and UKP market pulp (Sept./15)
0
5.000
10.000
15.000
20.000
25.000
30.000
35.000
40.000
19
98
19
99
20
00
20
01
20
02
20
03
20
04
20
05
20
06
20
07
20
08
20
09
20
10
20
11
20
12
20
13
20
14
20
15
20
16
20
17
20
18
20
19
Hardwood Softwood
2014 - 2019 CAGR:Hardwood: +2.5%Softwood: +0.8%
000 ton 1999 2009 2019
Growth
1999-
2009
Growth
2009-
2019
Hardwood 16.3 24.8 33.8 52% 36%
Eucalyptus 6.0 15.9 24.1 165% 52%
Softwood 19.0 21.4 24.9 13% 16%
Market Pulp 35.3 46.2 58.7 30% 27%
Paper Production – Runnability with BHKP
Source: RISI conference, August 2014.
65
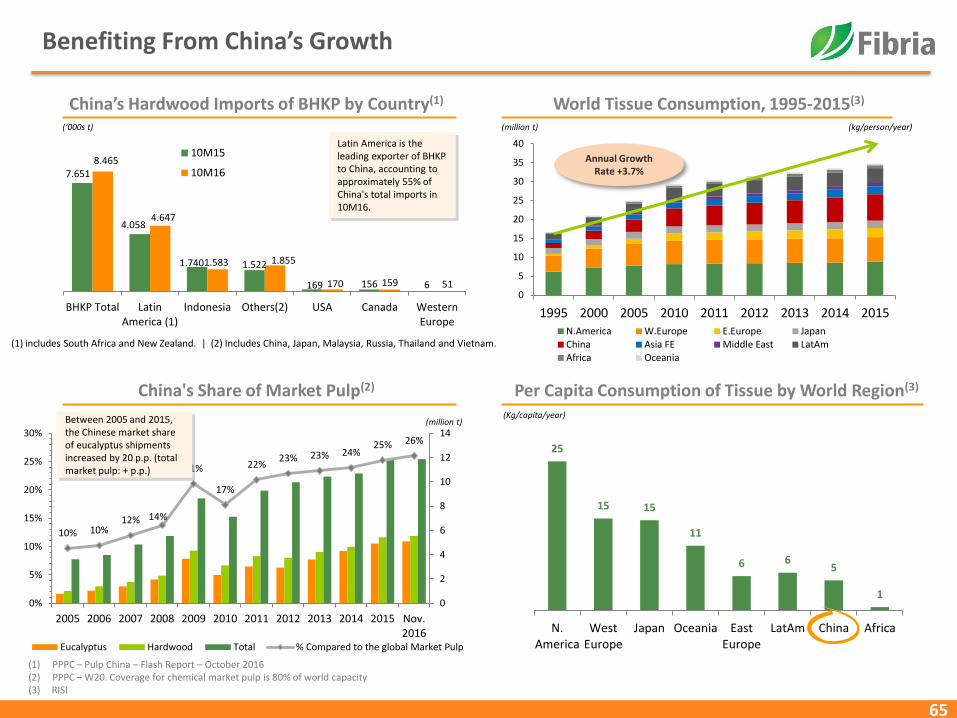
World Tissue Consumption, 1995-2015(3)
Per Capita Consumption of Tissue by World Region(3)China's Share of Market Pulp(2)
10% 10%12% 14%
21%
17%
22%23% 23% 24%
25% 26%
0
2
4
6
8
10
12
14
0%
5%
10%
15%
20%
25%
30%
2005 2006 2007 2008 2009 2010 2011 2012 2013 2014 2015 Nov.2016
Eucalyptus Hardwood Total % Compared to the global Market Pulp
(Kg/capita/year)
(million t) (kg/person/year)
Between 2005 and 2015, the Chinese market share of eucalyptus shipments increased by 20 p.p. (total market pulp: + p.p.)
0
5
10
15
20
25
30
35
40
1995 2000 2005 2010 2011 2012 2013 2014 2015N.America W.Europe E.Europe JapanChina Asia FE Middle East LatAmAfrica Oceania
Annual Growth Rate +3.7%
Benefiting From China’s Growth
(1) PPPC – Pulp China – Flash Report – October 2016(2) PPPC – W20. Coverage for chemical market pulp is 80% of world capacity (3) RISI
(million t)
Latin America is the leading exporter of BHKP to China, accounting to approximately 55% of China's total imports in 10M16.
(‘000s t)
(1) includes South Africa and New Zealand. | (2) Includes China, Japan, Malaysia, Russia, Thailand and Vietnam.
China’s Hardwood Imports of BHKP by Country(1)
7.651
4.058
1.740 1.522
169 156 6
8.465
4.647
1.583 1.855
170 159 51
BHKP Total LatinAmerica (1)
Indonesia Others(2) USA Canada WesternEurope
10M15
10M16
25
15 15
11
6 65
1
N.America
WestEurope
Japan Oceania EastEurope
LatAm China Africa

66
Growth rate Chinese GDP vs. Eucalyptus Shipments to China (Sept-09 = base 100)
Source: Bloomberg and PPPC – W20 report (dez/2016)
75
273
-
50
100
150
200
250
300
China GDP Eucalyptus Shipments

67
Commodities Differentiation
China GDP breakdown
China commodity demand - basis 100
49% 49% 48% 49% 49% 50% 50% 52% 51% 53% 53%
44% 47% 48% 48% 48% 48% 48% 46% 47% 45% 45%
8% 4% 4% 3% 3% 2% 2% 2% 2% 2% 2%
2008A 2009A 2010A 2011A 2012A 2013A 2014A 2015E 2016E 2017E 2018E
Consumption Investment Net Exports
2008A 2009A 2010A 2011A 2012A 2013A 2014A 2015E 2016E 2017E 2018E
Corn Soybeans Wheat Crude oil Iron ore Sugar BHKP
100
248
201194172
152
124115
Source: Itaú Macroeconomic Department and PPPC – Oct/15

68
Global Paper Consumption
CAGR 2000 – 2010Developed Markets: - 2.1%Emerging Markets : + 5.6%
P&W Consumption (000 tons)(1)
Tissue Consumption (000 tons)(1)
CAGR 2010 – 2020Developed Markets: - 3.1%Emerging Markets : + 0.9%
CAGR 2000 – 2010Developed Markets: + 1.5%Emerging Markets : + 6.6%
CAGR 2010 – 2020Developed Markets: + 1.4%Emerging Markets : + 5.9%
Source: RISI
20
00
20
01
20
02
20
03
20
04
20
05
20
06
20
07
20
08
20
09
20
10
20
11
20
12
20
13
20
14
20
15
E
20
16
E
20
17
E
20
18
E
20
19
E
20
20
E
Developed Markets Emerging Markets
99,977103,286117,611 109,758
20
00
20
01
20
02
20
03
20
04
20
05
20
06
20
07
20
08
20
09
20
10
20
11
20
12
20
13
20
14
20
15
E
20
16
E
20
17
E
20
18
E
20
19
E
20
20
E
Developed Markets Emerging Markets
20,979
30,357
41,712

69
Benefiting From China’s Growth
Ship
men
ts (
00
0 t
on
)
BH
KP
pri
ces
-C
IF C
hin
a (U
S$/t
on
)
(‘000s t)
China: Eucalyptus pulp shipments
2010
average:
250 ktons
2011
Average
379 ktons
2012
Average
370 ktons
2013
Average
439 ktons
2014
Average
504 ktons
2015
Average
531 ktons
2016
Average
612 ktons
Source: PPPC Global 100
0
100
200
300
400
500
600
700
800
900
0
100
200
300
400
500
600
700
800
900
mai
-10
jun
-10
jul-
10
ago
-10
set-
10
ou
t-1
0o
ut-
10
no
v-1
0d
ez-1
0ja
n-1
1fe
v-1
1m
ar-1
1ab
r-1
1m
ai-1
1ju
n-1
1ju
l-1
1ag
o-1
1se
t-1
1o
ut-
11
no
v-1
1d
ez-1
1ja
n-1
2fe
v-1
2m
ar-1
2ab
r-1
2m
ai-1
2ju
n-1
2ju
l-1
2ag
o-1
2se
t-1
2o
ut-
12
no
v-1
2d
ez-1
2ja
n-1
3fe
v-1
3m
ar-1
3ab
r-1
3m
ai-1
3ju
n-1
3ju
l-1
3ag
o-1
3se
t-1
3o
ut-
13
no
v-1
3d
ez-1
3ja
n-1
4fe
v-1
4m
ar-1
4ab
r-1
4m
ai-1
4ju
n-1
4ju
l-1
4ag
o-1
4se
t-1
4o
ut-
14
no
v-1
4d
ez-1
4ja
n-1
5fe
v-1
5m
ar-1
5ab
r-1
5m
ai-1
5ju
n-1
5ju
l-1
5ag
o-1
5se
t-1
5o
ut-
15
no
v-1
5d
ez-1
5ja
n-1
6fe
v-1
6m
ar-1
6ab
r-1
6m
ai-1
6ju
n-1
6ju
l-1
6ju
l-1
6ag
o-1
6se
t-1
6o
ut-
16
no
v-1
6d
ez-1
6ja
n-1
7
BHKP Price
Shipments
70
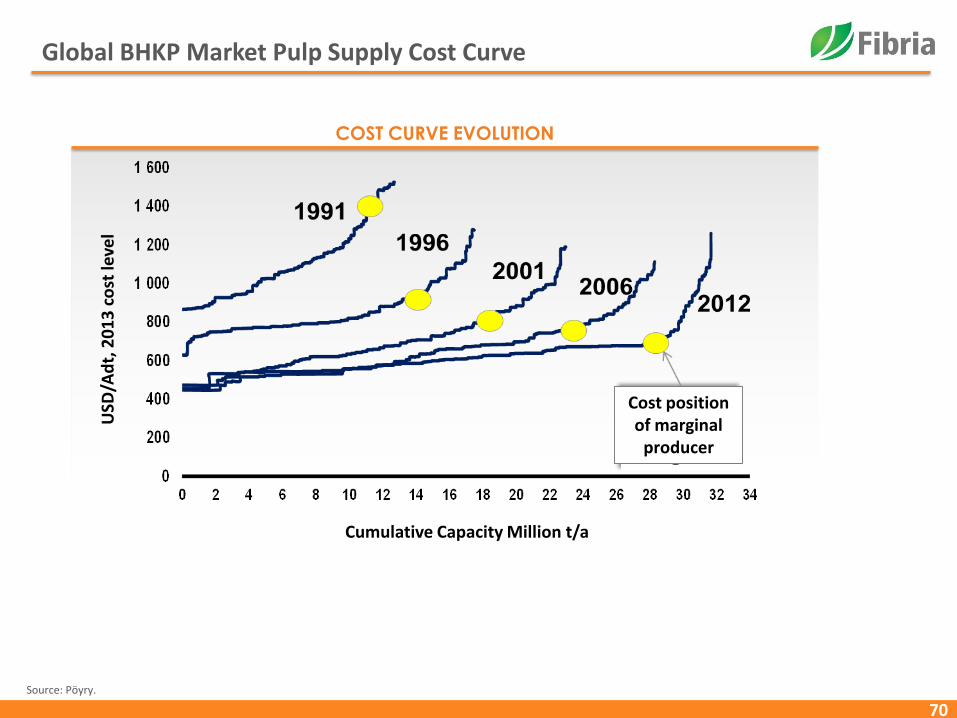
Global BHKP Market Pulp Supply Cost Curve
Source: Pöyry.
COST CURVE EVOLUTION
USD
/Ad
t, 2
01
3 c
ost
leve
l
Cumulative Capacity Million t/a
Cost position of marginal
producer
71
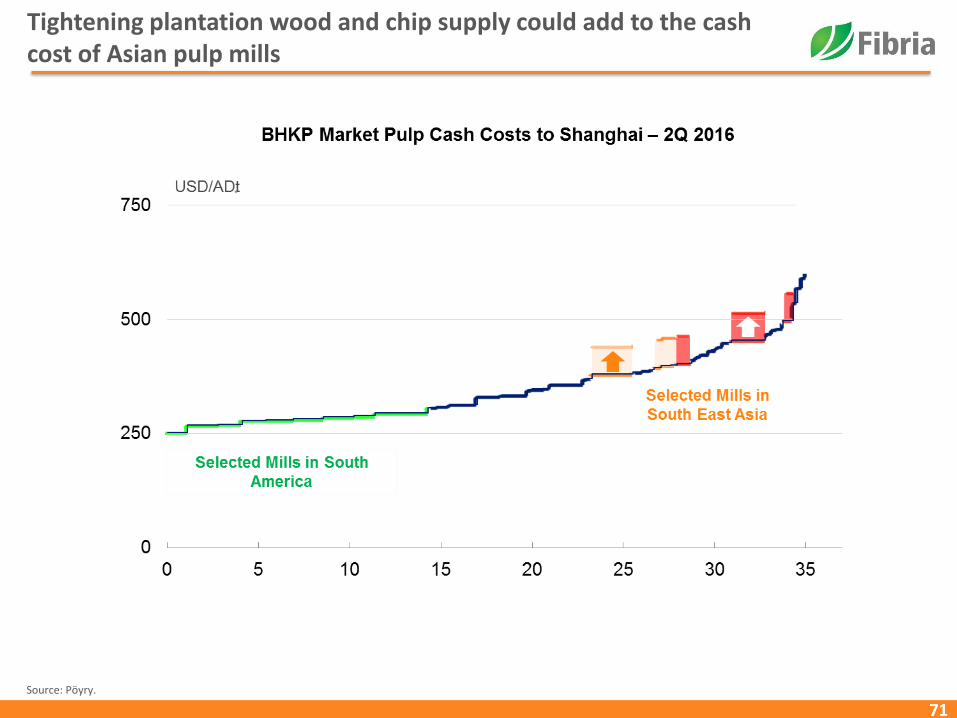
Tightening plantation wood and chip supply could add to the cash cost of Asian pulp mills
Source: Pöyry.

72
Current Zero Cost Collars
Notional (Total):
USD 1,760
Million
*forward curve Dec/2016.
ZCC Position 1Q17 2Q17 3Q17 4Q17 1Q18 2Q18 3Q18 4Q18 Total
Notional (USD MM) 391 334 395 330 215 55 40 - 1,760
Strike médio put (avg.) 3.29 3.34 3.3 3.46 3.43 3.48 3.49 - 3.36
Strike médio call (avg.) 5.04 5.26 5.35 6.03 5.04 5.38 5.35 - 5.36
FWD (BRL/USD)EoP 3.31 3.38 3.46 3.52 3.58 3.64 3.71 3.77 3.55

FREE CASH FLOW(1)
Positive quarterly FCF in the last 5 years, even during appreciated FX
73
USD million
EBITDA Margin
Average FX
-77
-7
125
29
77
194
84113
53
329
4
111
51
103130
112
317
225
158118 124
105
3Q11 4Q11 1Q12 2Q12 3Q12 4Q12 1Q13 2Q13 3Q13 4Q13 1Q14 2Q14 3Q14 4Q14 1Q15 2Q15 3Q15 4Q15 1Q16 2Q16 3Q16 4Q16
(1) Excluding H2 Project, dividends, pulp logistics and land purchase effects.
1.63 1.80 1.77 1.96 2.03 2.06 2.00 2.07 2.29 2.27 2.37 2.23 2.27 2.55 2.87 3.07 3.45 3.84 3.90 3.51 3.25 3.26
33% 28% 30% 37% 37% 41% 39% 39% 41% 42% 41% 35% 35% 45% 50% 50% 56% 54% 52% 43% 43% 36%

74
Fibria’s tax structure
(1) Considering FX 3.2591 | (2) Considering average FX for the period
Description and Amount Maturity
(a) Operating income As stated in the income statement
(-)(b) Goodwill (Aracruzacquisition)
- Annual tax deduction: US$ 27 million (tax)
- Remaining Balance Dec/16: US$ 0.175 billion (base)2018
(-)(c) Forestry Capex in MS state (net)
2016 tax deduction related to depletion: US$ 31 million Undefined
(+/-)(d) Exchange variation(cash)
---------- ----------
(+/-)(e) Other ---------- ----------
Tax base beforecompensations
(a) + (b) + (c) + (d) + (e)
(f) (-) Tax loss carryforward- Up to 30% of tax base before compensations
- Balance up to Dec/16: US$ 245 million (base)Undefined
(g) Tax base Tax base before compensations – tax loss carryforward (f) ----------
(h) Income tax Tax base (g) * 34% ----------
(i) (-) Federal tax credits
Balance Dec/2016:- PIS/COFINS: US$ 234 million
- Withholding tax (IR and CSLL): US$ 303 million- Reintegra: US$ 27 million
Undefined
Cash Tax Income Tax (h) – tax credits (i)
2010 2011 2012 2013 2014 2015 2016
US$ 9 million US$ 2 million US$ 8 million US$ 14 million US$ 12 million US$ 23 million US$ 36 million
TAX PAYMENT(2) (cash basis)
75
Dividends
76
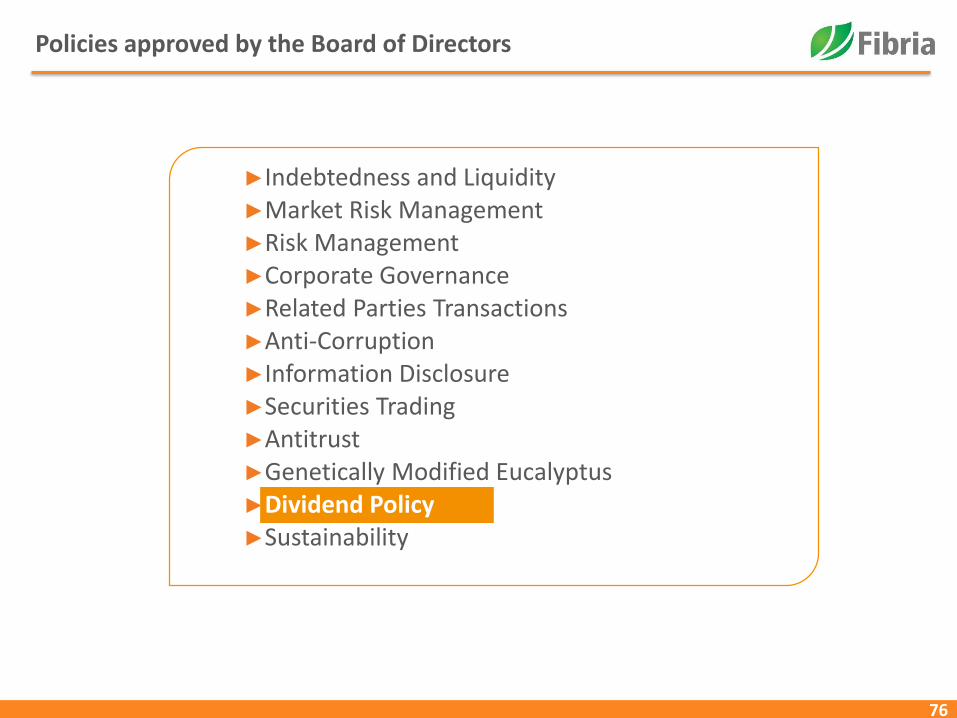
►Indebtedness and Liquidity ►Market Risk Management►Risk Management►Corporate Governance►Related Parties Transactions►Anti-Corruption►Information Disclosure►Securities Trading►Antitrust►Genetically Modified Eucalyptus►Dividend Policy►Sustainability
Policies approved by the Board of Directors
77
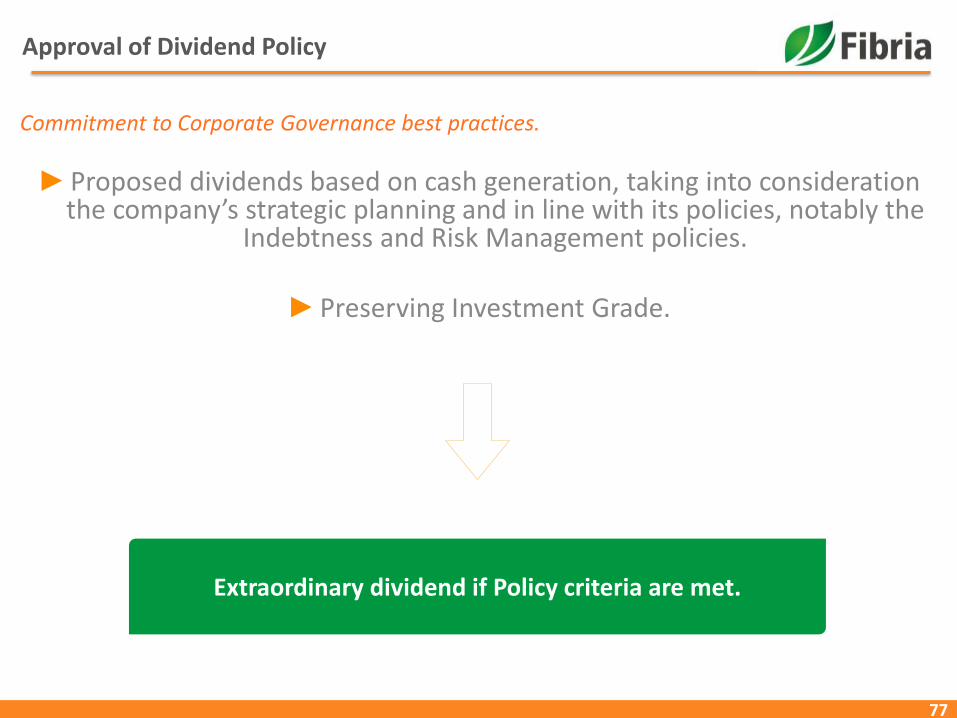
Approval of Dividend Policy
►Proposed dividends based on cash generation, taking into considerationthe company’s strategic planning and in line with its policies, notably the
Indebtness and Risk Management policies.
►Preserving Investment Grade.
Commitment to Corporate Governance best practices.
Extraordinary dividend if Policy criteria are met.

78
Dividends
(1) Considering March 7, 2016 FX – R$/US$3.7714
2016
April 27, 2016 Mid-May, 2016 Mid-November, 2016
GSM approved dividend
distribution of USD80 million(1)
(1.1% of dividend yield as at
Dec. 31, 2015).
Dividend payment
of USD 80 million.
Extraordinary
dividend
appraisal
(not approved)
2017
April, 2017 Mid-May, 2017 Mid-November, 2017 Mid-December, 2017
OGM to approved
dividend
distribution
Dividend payment
to occur from May
onwards
Extraordinary
dividend
appraisal
Extraordinary
dividend
payment
(if approved)