APR-DRG Update-Mississippi Medicaid-Provider Training
26
9/9/2013 1 ©2013 Xerox Corporation. All rights reserved. Xerox® and Xerox Design® are trademarks of Xerox Corporation in the United States and/or other countries. DRG Update for 10/1/2013 Mississippi Medicaid Provider Training Hattiesburg 9/10/13 Jackson 9/11/13 Webinar 9/13/13 • DRG Year 1: Experience since 10/1/12 • DRG Year 2: Changes for 10/1/13 • Appendix: Pricing examples Information Sources • www.medicaid.ms.gov/HospitalInpatientAPR-DRGPayment.aspx • msmedicaid.acs-inc.com/msenvision • Xerox Provider and Beneficiary Services 1-800-884-3222 2 Our Topics Today September 10, 2013
Transcript of APR-DRG Update-Mississippi Medicaid-Provider Training

9/9/2013
1
©2013 Xerox Corporation. All rights reserved. Xerox® and Xerox Design® are trademarks of Xerox Corporation in the United States and/or other countries.
DRG Update for 10/1/2013
Mississippi Medicaid Provider TrainingHattiesburg 9/10/13Jackson 9/11/13Webinar 9/13/13
• DRG Year 1: Experience since 10/1/12
• DRG Year 2: Changes for 10/1/13
• Appendix: Pricing examples
Information Sources• www.medicaid.ms.gov/HospitalInpatientAPR-DRGPayment.aspx
• msmedicaid.acs-inc.com/msenvision
• Xerox Provider and Beneficiary Services 1-800-884-3222
2
Our Topics Today
September 10, 2013

9/9/2013
2
DRG Webpagehttp://www.medicaid.ms.gov/HospitalInpatientAPR-DRGPayment.aspx
September 10, 20133
Helpful Documents
September 10, 20134
9/9/2013
3
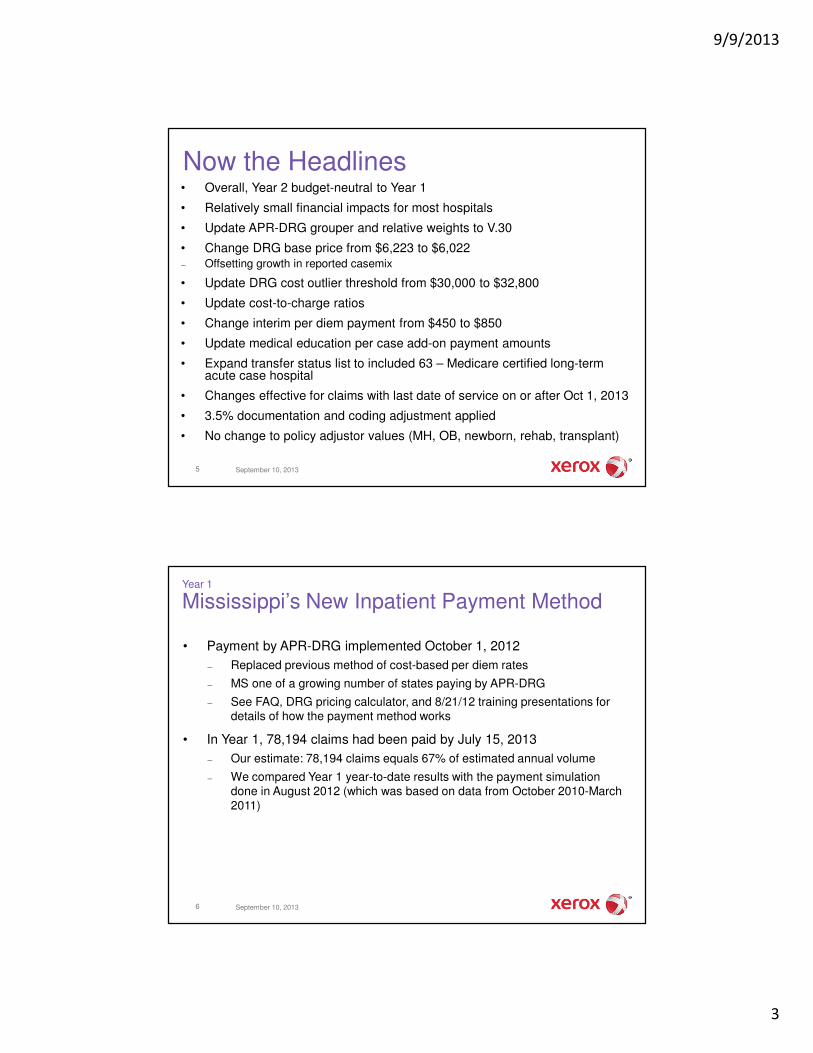
• Overall, Year 2 budget-neutral to Year 1
• Relatively small financial impacts for most hospitals
• Update APR-DRG grouper and relative weights to V.30
• Change DRG base price from $6,223 to $6,022– Offsetting growth in reported casemix
• Update DRG cost outlier threshold from $30,000 to $32,800
• Update cost-to-charge ratios
• Change interim per diem payment from $450 to $850
• Update medical education per case add-on payment amounts
• Expand transfer status list to included 63 – Medicare certified long-term acute case hospital
• Changes effective for claims with last date of service on or after Oct 1, 2013
• 3.5% documentation and coding adjustment applied
• No change to policy adjustor values (MH, OB, newborn, rehab, transplant)
5 September 10, 2013
Now the Headlines
Year 1
Mississippi’s New Inpatient Payment Method
• Payment by APR-DRG implemented October 1, 2012
– Replaced previous method of cost-based per diem rates
– MS one of a growing number of states paying by APR-DRG
– See FAQ, DRG pricing calculator, and 8/21/12 training presentations for details of how the payment method works
• In Year 1, 78,194 claims had been paid by July 15, 2013
– Our estimate: 78,194 claims equals 67% of estimated annual volume
– We compared Year 1 year-to-date results with the payment simulation done in August 2012 (which was based on data from October 2010-March 2011)
6 September 10, 2013

9/9/2013
4
7
Important: Payment data shown here exclude supplemental and medical education payments
Year 1
Full Year Estimates of Stays
September 10, 2013
Average Completion Factors
Stays Payments
At 30 days 60% 61%
At 60 days 78% 78%
At 90 days 86% 85%
At 120 days 90% 90%
At 150 days 94% 94%
At 180 days 97% 97%
Note:
Factors based on October-December 2012, assuming essentially all stays in this period have been paid.
Year 1
How Averages Changed as Data Came In
8
Metric Simulation 1st Analysis 2nd Analysis 3rd Analysis 4th Analysis
Date range10/1/10 -
3/31/11 10/1/12 -
12/2/12 10/1/12 -
2/18/13 10/1/12 -
4/15/13 10/1/12 -
7/15/13
Number of stays55,568 10,130 31,381 49,563 78,194
Number of covered days 249,434 38,907 128,809 210,136 343,038
Average charge / stay $17,867 $18,233 $19,510 $20,359 $21,373
Average payment / stay $5,548 $4,726 $5,113 $5,303 $5,555
Average casemix (w/out doc & coding growth) 0.63 0.62 0.66 0.68 0.71
Average casemix (with doc & coding growth) 0.65
Average casemix adjusted payment / stay $8,780 $7,584 $7,712 $7,757 $7,824
Average length of stay4.5 3.8 4.1 4.2 4.4
Outlier as percent of DRG payment 6% 1% 2% 4% 4%
September 10, 2013
9/9/2013
5
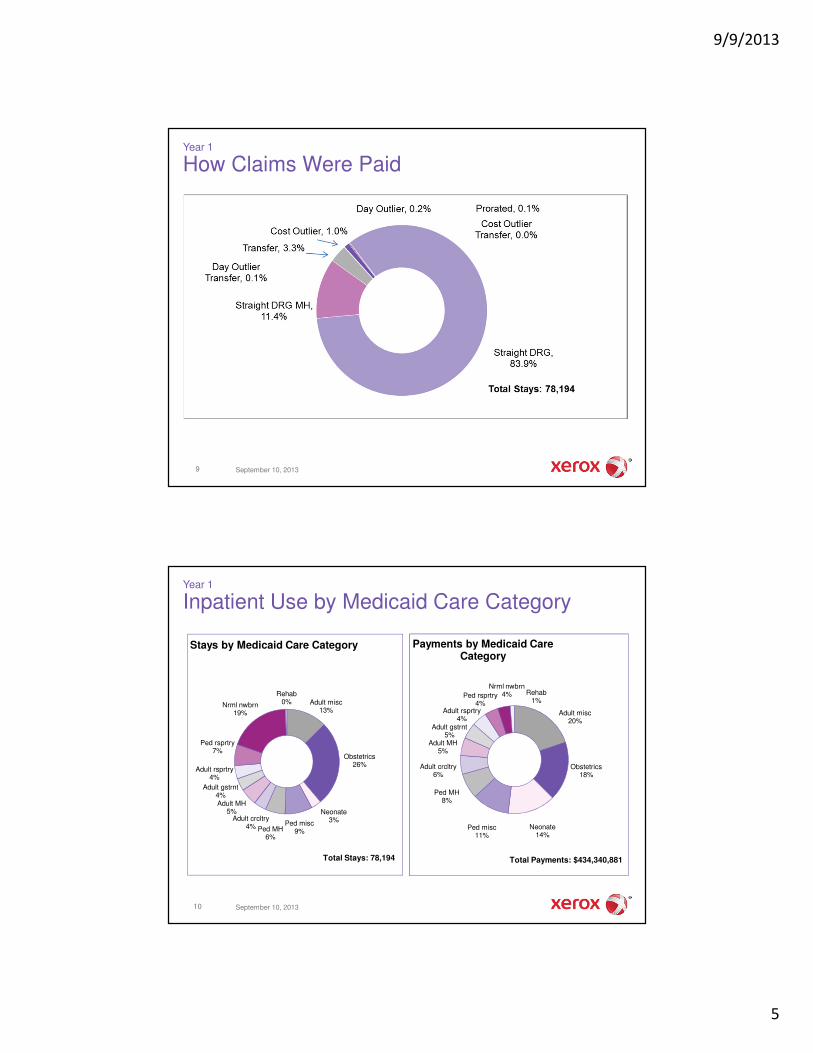
Year 1
How Claims Were Paid
September 10, 20139
Year 1
Inpatient Use by Medicaid Care Category
Adult misc13%
Obstetrics26%
Neonate3%Ped misc
9%Ped MH6%
Adult crcltry4%
Adult MH5%
Adult gstrnt4%
Adult rsprtry4%
Ped rsprtry7%
Nrml nwbrn19%
Rehab0%
Stays by Medicaid Care Category
Total Stays: 78,194
Adult misc20%
Obstetrics18%
Neonate14%
Ped misc11%
Ped MH8%
Adult crcltry6%
Adult MH5%
Adult gstrnt5%
Adult rsprtry4%
Ped rsprtry4%
Nrml nwbrn4% Rehab
1%
Payments by Medicaid Care Category
Total Payments: $434,340,881
September 10, 201310

9/9/2013
6
APR-DRG Code APR-DRG Description Stays
Covered Days Charges DRG Pmt
Total Payment
Avg Case Mix
Avg LOS
Avg Charges
Avg DRG Pmt
640-1Neonate Birthwt >2499g, Normal Newborn Or Neonate W Other Problem 11,306 24,854 $36,211,884 $9,548,032 $11,138,222 0.10 2.20 $3,203 $845
560-1 Vaginal Delivery 6,277 14,074 $67,694,604 $16,788,646 $17,278,268 0.31 2.24 $10,785 $2,675
540-1 Cesarean Delivery 4,518 12,675 $88,230,840 $20,611,124 $21,115,588 0.52 2.81 $19,529 $4,562
560-2 Vaginal Delivery 3,812 9,469 $46,453,435 $11,544,718 $12,264,082 0.35 2.48 $12,186 $3,029
640-2Neonate Birthwt >2499g, Normal Newborn Or Neonate W Other Problem 2,653 6,342 $10,521,504 $3,242,590 $3,620,904 0.14 2.39 $3,966 $1,222
753-2 Bipolar Disorders 1,691 16,984 $28,462,527 $10,893,192 $11,006,576 0.52 10.04 $16,832 $6,442
540-2 Cesarean Delivery 1,587 5,703 $38,481,060 $8,687,755 $9,066,737 0.63 3.59 $24,248 $5,474
751-2Major Depressive Disorders & Other/Unspecified Psychoses 1,229 10,021 $18,554,822 $6,819,635 $6,874,952 0.47 8.15 $15,097 $5,549
139-2 Other Pneumonia 954 3,081 $13,351,411 $3,377,157 $3,576,618 0.58 3.23 $13,995 $3,540
758-2 Childhood Behavioral Disorders 926 9,545 $15,559,993 $7,136,865 $7,259,658 0.60 10.31 $16,803 $7,707
750-2 Schizophrenia 922 7,204 $16,554,587 $6,778,843 $6,847,104 0.69 7.81 $17,955 $7,352
138-1 Bronchiolitis & Rsv Pneumonia 883 2,169 $7,231,212 $1,608,658 $1,812,383 0.29 2.46 $8,189 $1,822
139-1 Other Pneumonia 791 1,991 $7,370,131 $1,907,723 $2,020,996 0.39 2.52 $9,317 $2,412
141-1 Asthma 772 1,715 $7,405,142 $1,682,112 $1,950,380 0.35 2.22 $9,592 $2,179
566-2 Other Antepartum Diagnoses 762 1,823 $7,417,460 $2,205,781 $2,416,319 0.34 2.39 $9,734 $2,895
Total Top 15 39,083 127,650 $409,500,612 $112,832,832 $118,248,784 0.32 3.27 $10,478 $2,887
Total All Claims 78,194 343,038 $1,671,222,481 $434,340,882 $454,554,838 0.71 4.39 $21,373 $5,555
Year 1
Top 15 APR-DRGs by Count of Stays
September 10, 201311
Year 1
Top 15 APR-DRGs by Medicaid Payments
September 10, 201312
APR-DRG Code APR-DRG Description Stays
Covered Days Charges DRG Pmt Total Payment
Avg Case Mix
Avg LOS
Avg Charges
Avg DRG Pmt
540-1 Cesarean Delivery 4,518 12,675 $88,230,840 $20,611,124 $21,115,588 0.52 2.81 $19,529 $4,562
560-1 Vaginal Delivery 6,277 14,074 $67,694,604 $16,788,646 $17,278,268 0.31 2.24 $10,785 $2,675
560-2 Vaginal Delivery 3,812 9,469 $46,453,435 $11,544,718 $12,264,082 0.35 2.48 $12,186 $3,029
640-1Neonate Birthwt >2499g, Normal Newborn Or Neonate W Other Problem 11,306 24,854 $36,211,884 $9,548,032 $11,138,222 0.10 2.20 $3,203 $845
753-2 Bipolar Disorders 1,691 16,984 $28,462,527 $10,893,192 $11,006,576 0.52 10.04 $16,832 $6,442
540-2 Cesarean Delivery 1,587 5,703 $38,481,060 $8,687,755 $9,066,737 0.63 3.59 $24,248 $5,474
758-2 Childhood Behavioral Disorders 926 9,545 $15,559,993 $7,136,865 $7,259,658 0.60 10.31 $16,803 $7,707
751-2Major Depressive Disorders & Other/Unspecified Psychoses 1,229 10,021 $18,554,822 $6,819,635 $6,874,952 0.47 8.15 $15,097 $5,549
750-2 Schizophrenia 922 7,204 $16,554,587 $6,778,843 $6,847,104 0.69 7.81 $17,955 $7,352
720-4 Septicemia & Disseminated Infections 343 3,323 $28,211,988 $6,647,373 $6,789,143 2.73 9.69 $82,251 $19,380
004-4Tracheostomy W Mv 96+ Hours W Extensive Procedure Or Ecmo 41 1,877 $24,694,902 $5,895,067 $5,943,812 16.48 45.78 $602,315 $143,782
593-4Neonate Birthwt 750-999g W/O Major Procedure 36 2,519 $10,477,182 $5,006,099 $5,040,256 16.22 69.97 $291,033 $139,058
540-3 Cesarean Delivery 548 2,632 $16,842,998 $4,448,894 $4,730,798 0.93 4.80 $30,735 $8,118
005-4Tracheostomy W Mv 96+ Hours W/O Extensive Procedure 46 2,038 $19,962,962 $4,638,551 $4,671,982 11.47 44.30 $433,977 $100,838
591-4Neonate Birthwt 500-749g W/O Major Procedure 28 1,665 $8,172,993 $4,269,136 $4,297,531 21.50 59.46 $291,893 $152,469
Total Top 15 33,310 124,583 $464,566,776 $129,713,929 $134,324,707 0.43 3.74 $13,947 $3,894
Total All Claims 78,194 343,038 $1,671,222,481 $434,340,882 $454,554,838 0.71 4.39 $21,373 $5,555

9/9/2013
7
Year 1
The Impact of Birthweight on Hospital Cost
September 10, 201313
$-
$25,000
$50,000
$75,000
$100,000
Under 500 500-749 750-999 1000-1249 1250-1499 1500-1999 2000-2499 Over 2499
Avg
Ho
sp
ital
Co
st
per
Sta
y
Birthweight in Grams
Average Hospital Cost per Newborn Stay by Birthweight
The economic argument for
prenatal care
Year 1
Comparison with Simulation: Percent of Stays
11%
27%
2%
10%
5%
4% 4%
4% 4%
8%
21%
0%
13%
26%
3%
8%
6%
4% 5
%
4% 4%
7%
19%
0%
0%
10%
20%
30%
Perc
en
t o
f A
ll S
tays
Medicaid Care CategoryCare categories sorted in declining order of actual DRG payment in 7/15/2013 dataset.
Percent of Stays
Simulation Actual
September 10, 201314

9/9/2013
8
Year 1
Comparison with Simulation: Length of Stay
4.4
2.7
25.5
4.1
12.5
3.8
6.4
4.5
4.5
3.6
2.7
11.4
4.5
5.3
2.7
15.4
3.8
10.3
4.2
6.1
4.7
4.9
3.1
2.3
14.0
4.4
-
10.0
20.0
30.0
Nu
mb
er
of
Days
Medicaid Care CategoryCare categories sorted in declining order of actual DRG payment in 7/15/2013 dataset.
Average Length of Stay
Simulation Actual
September 10, 201315
Year 1
Comparison with Simulation: Average Charge
$29,0
08
$12,9
32
$100,0
46
$23,3
78
$20,6
17
$31,5
99
$14,1
37
$26,4
47
$23,8
02
$14,3
24
$2,9
59
$33,1
66
$17,8
67
$40,6
77
$15,2
80
$60,1
83
$29,9
35
$17,3
21
$40,6
89
$14,8
03 $
32,5
05
$31,6
56
$13,9
84
$3,7
18
$45,2
05
$21,3
73
$0
$50,000
$100,000
Avera
ge C
harg
e p
er
Sta
y
Medicaid Care CategoryCare categories sorted in declining order of actual DRG payment in 7/15/2013 dataset.
Average Charge per Stay
Simulation Actual
September 10, 201316

9/9/2013
9
Year 1
Comparison with Simulation: Casemix
1.1
2
0.4
2
3.7
8
0.8
3
0.4
9
1.1
7
0.5
2
0.9
7
0.8
5
0.5
0
0.1
1
1.3
3
0.6
3
1.2
9
0.4
3
2.8
9
1.0
3
0.5
4
1.2
4
0.5
3
1.0
7
0.9
7
0.5
4
0.1
2
1.4
7
0.7
1
0.00
2.00
4.00
Avera
ge D
RG
Paym
en
t
Medicaid Care CategoryCare categories sorted in declining order of actual DRG payment in 7/15/2013 dataset.
Average Casemix
Simulation Actual
September 10, 201317
Year 1
Comparison with Simulation: Payment per Stay
$7,7
13
$4,1
45
$39,5
19
$6,5
23
$7,1
98
$7,8
93
$5,9
55
$6,6
45
$5,9
04
$3,9
92
$1,2
80
$16,8
48
$5,5
48
$8,6
97
$3,7
40
$25,2
66
$7,2
82
$6,9
87
$8,0
61
$5,6
25
$6,8
96
$6,1
77
$3,4
64
$1,0
74
$17,1
87
$5,5
55
$0
$20,000
$40,000
Avera
ge D
RG
Paym
en
t
Medicaid Care CategoryCare categories sorted in declining order of actual DRG payment in 7/15/2013 dataset.
Average DRG Payment per Stay
Simulation Actual
September 10, 201318

9/9/2013
10
Year 1
Comparison with Simulation: Outlier Payment
2%
0%
16%
12%
5%
1%
0% 1
% 1%
13%
1%
3%
6%
8%
0%
3%
11%
2%
5%
1%
4% 4% 4%
0% 1
%
4%
0%
10%
20%
Perc
en
t o
f D
RG
Paym
en
t
Medicaid Care CategoryCare categories sorted in declining order of actual DRG payment in 7/15/2013 dataset.
Outlier as Percent of DRG Payment
Simulation Actual
September 10, 201319
Year 1
Medicaid Care Category
Medicaid Care Category Stays Charges DRG Payment Total Outlier
% Outlier to Pmt
Avg Casemix
Avg Charge
Avg DRG Pmt
Adult misc 9,881 $401,931,718 $85,934,013 $6,870,179 8% 1.29 $40,677 $8,697
Obstetrics 20,570 $314,304,860 $76,936,382 $41,944 0% 0.43 $15,280 $3,740
Neonate 2,470 $148,652,134 $62,407,130 $2,106,024 3% 2.89 $60,183 $25,266
Pediatric misc 6,632 $198,526,703 $48,294,794 $5,470,165 11% 1.03 $29,935 $7,282
Pediatric Mental Health 4,761 $82,463,433 $33,262,881 $577,350 2% 0.54 $17,321 $6,987
Adult circulatory 3,031 $123,327,427 $24,431,617 $1,326,313 5% 1.24 $40,689 $8,061
Adult mental health 4,132 $61,164,189 $23,243,171 $117,450 1% 0.53 $14,803 $5,625
Adult gastroent 3,023 $98,262,523 $20,847,825 $767,740 4% 1.07 $32,505 $6,896
Adult respiratory 3,187 $100,887,859 $19,686,443 $756,015 4% 0.97 $31,656 $6,177
Pediatric respiratory 5,107 $71,415,308 $17,690,424 $696,001 4% 0.54 $13,984 $3,464
Normal newborn 15,086 $56,092,018 $16,209,368 $33,617 0% 0.12 $3,718 $1,074
Rehab 314 $14,194,309 $5,396,833 $48,980 1% 1.47 $45,205 $17,187
Total Stays 78,194 $1,671,222,481 $434,340,882 $18,811,779 4% 0.71 $21,373 $5,555
September 10, 201320

9/9/2013
11
Year 1
Top 15 Hospitals by DRG Payment
Rank Provider Name Total DRG PmtAvg DRG Pmt/Stay
SimRank Stays Cov Days
Avg Casemix
1 University of Miss Med Center $84,395,027 $11,083 1 7,615 46,660 1.44
2 Forrest General Hospital $28,425,339 $6,003 2 4,735 20,268 0.79
3 North Mississippi Medical Center $18,552,573 $5,910 3 3,139 14,547 0.78
4 ST DominicJackson Memorial Hospital $16,383,571 $5,263 5 3,113 13,441 0.68
5 Memorial Hospital At Gulfport $14,938,054 $5,911 4 2,527 11,645 0.69
6 Singing River Health System $12,036,871 $4,553 8 2,644 8,628 0.62
7 Central Mississippi Medical Center $11,700,565 $5,778 7 2,025 9,137 0.74
8 Methodist Hospitals of Memphis $11,452,345 $9,118 6 1,256 7,043 1.26
9 Baptist Memorial Hospital Desoto $11,295,846 $4,027 9 2,805 9,170 0.51
10 Mississippi Baptist Medical Center $9,923,220 $6,550 12 1,515 7,747 0.90
11 Delta Regional Medical Center $9,574,890 $4,544 11 2,107 7,848 0.63
12 River Region Health System $9,542,159 $4,574 10 2,086 9,705 0.56
13 Wesley Medical Center $9,465,142 $4,279 14 2,212 7,476 0.56
14 Brentwood Behavioral Healthcare $9,412,302 $7,201 15 1,307 14,094 0.56
15 Anderson Regional Medical Center $8,163,959 $4,814 16 1,696 6,244 0.65
Total Top Hospitals $265,261,862 $6,504 40,782 193,653 0.84
Total All Hospitals $434,340,882 $5,555 78,194 343,038 0.71
Note: Sim rank refers to the ranking of hospitals by total DRG payments in the August 2012 simulated based on Oct 2010-March 2011 data
September 10, 201321
Year 2
APR-DRG Grouper Update V.29 to V.30
• Important to update APR-DRG version to keep pace with changes in medicine and practice
• V.30 the most significant APR-DRG version change in at least 10 years…
– … nevertheless, not a major change
• Still 314 base DRGs, each with 4 levels of severity
• We compared APR-DRG assignments on 78,194 stays that had been grouped to V.29
• 60 stays changed base APR-DRG
• 6,004 stays changed severity of illness within the same base APR-DRG
– 808 increased severity
– 5,196 decreased severity
• Relative weights calculated by 3M from 15 million stays from the Nationwide Inpatient Sample (HSRV methodology)
22 September 10, 2013
9/9/2013
12
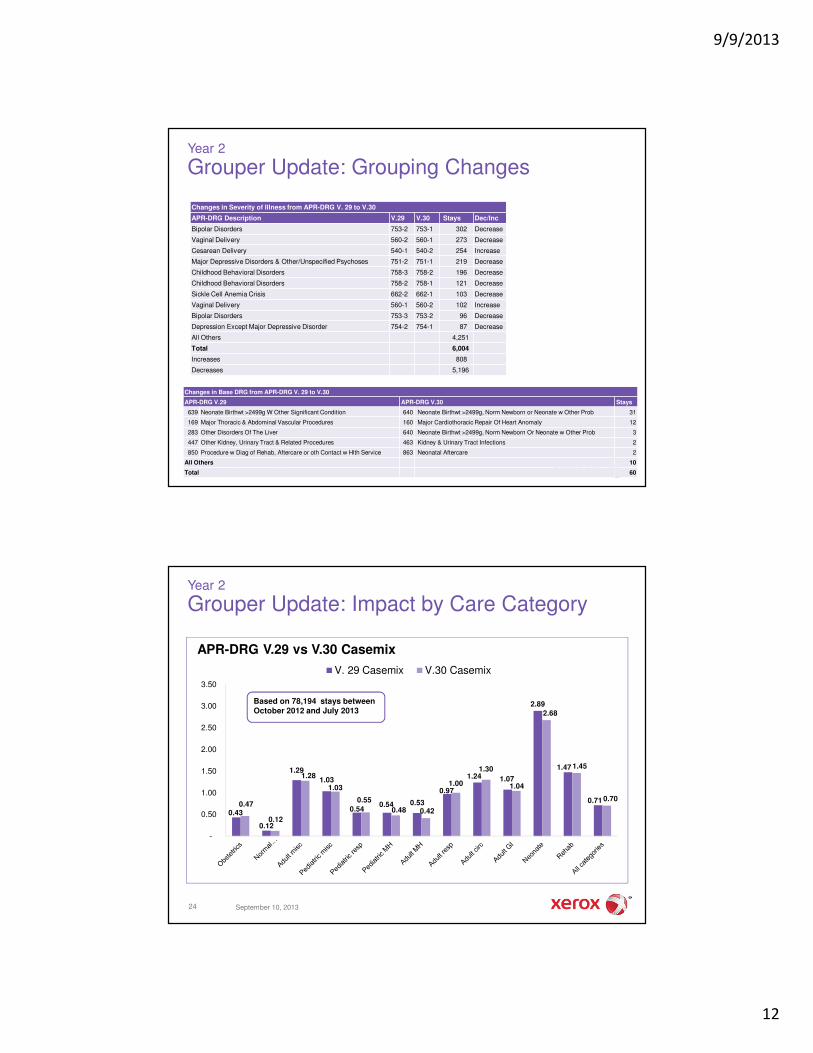
Year 2
Grouper Update: Grouping Changes
23 August 14, 2013
Changes in Severity of Illness from APR-DRG V. 29 to V.30
APR-DRG Description V.29 V.30 Stays Dec/Inc
Bipolar Disorders 753-2 753-1 302 Decrease
Vaginal Delivery 560-2 560-1 273 Decrease
Cesarean Delivery 540-1 540-2 254 Increase
Major Depressive Disorders & Other/Unspecified Psychoses 751-2 751-1 219 Decrease
Childhood Behavioral Disorders 758-3 758-2 196 Decrease
Childhood Behavioral Disorders 758-2 758-1 121 Decrease
Sickle Cell Anemia Crisis 662-2 662-1 103 Decrease
Vaginal Delivery 560-1 560-2 102 Increase
Bipolar Disorders 753-3 753-2 96 Decrease
Depression Except Major Depressive Disorder 754-2 754-1 87 Decrease
All Others 4,251
Total 6,004
Increases 808
Decreases 5,196
Changes in Base DRG from APR-DRG V. 29 to V.30
APR-DRG V.29 APR-DRG V.30 Stays
639 Neonate Birthwt >2499g W Other Significant Condition 640 Neonate Birthwt >2499g, Norm Newborn or Neonate w Other Prob 31
169 Major Thoracic & Abdominal Vascular Procedures 160 Major Cardiothoracic Repair Of Heart Anomaly 12
283 Other Disorders Of The Liver 640 Neonate Birthwt >2499g, Norm Newborn Or Neonate w Other Prob 3
447 Other Kidney, Urinary Tract & Related Procedures 463 Kidney & Urinary Tract Infections 2
850 Procedure w Diag of Rehab, Aftercare or oth Contact w Hlth Service 863 Neonatal Aftercare 2
All Others 10
Total 60
Year 2
Grouper Update: Impact by Care Category
24
0.43
0.12
1.29
1.03
0.540.54 0.53
0.97
1.24 1.07
2.89
1.47
0.710.47
0.12
1.28
1.03
0.55
0.48 0.42
1.00
1.30
1.04
2.68
1.45
0.70
-
0.50
1.00
1.50
2.00
2.50
3.00
3.50
APR-DRG V.29 vs V.30 Casemix
V. 29 Casemix V.30 Casemix
Based on 78,194 stays between October 2012 and July 2013
September 10, 2013

9/9/2013
13
Year 2
Grouper Update: Impact by Peer Group
25
0.510.43
0.52
0.80
0.55
1.41
0.71
0.520.44
0.53
0.79
0.51
1.35
0.70
-
0.25
0.50
0.75
1.00
1.25
1.50
Under 50 beds 51 to 100 beds 101 to 200 beds Over 200 beds Freestanding MH OOS All hospitals
APR-DRG V.29 vs V.30 Casemix
V. 29 Casemix V.30 Casemix
Based on 78,194 stays between October 2012 and July 2013
September 10, 2013
Year 2
Grouper Update: Casemix Data
Stays
V. 29 Casemix V.30 Casemix
Total Average Total Average
By Care Category
Obstetrics 20,570 8,854 0.430 9,569 0.465
Normal newborn 15,086 1,857 0.123 1,842 0.122
Adult misc 9,881 12,758 1.291 12,639 1.279
Pediatric misc 6,632 6,858 1.034 6,817 1.028
Pediatric resp 5,107 2,758 0.540 2,801 0.549
Pediatric MH 4,761 2,549 0.535 2,286 0.480
Adult MH 4,132 2,201 0.533 1,719 0.416
Adult resp 3,187 3,099 0.972 3,193 1.002
Adult circ 3,031 3,745 1.236 3,934 1.298
Adult GI 3,023 3,233 1.070 3,149 1.042
Neonate 2,470 7,136 2.889 6,611 2.676
Rehab 314 463 1.473 457 1.454
All categories 78,194 55,511 0.710 55,017 0.704
By Hospital Peer Group
Under 50 beds 2,504 1,271 0.507 1,303 0.521
51 to 100 beds 5,840 2,494 0.427 2,592 0.444
101 to 200 beds 20,136 10,524 0.523 10,709 0.532
Over 200 beds 43,682 35,160 0.805 34,658 0.793
Freestanding MH 2,830 1,560 0.551 1,440 0.509
OOS 3,202 4,502 1.406 4,316 1.348
All hospitals 78,194 55,511 0.710 55,017 0.704
September 10, 201326

9/9/2013
14
Year 2
Payment Policy Decisions
Item Decision / Result
Budget targetBudget neutral (on a volume-adjusted basis) with the period since October 1, 2012, not including medical education.
Documentation and coding adj. Yes – 3.5%, included in RY 2014 DRG base price
DRG base price Change--$6,022, 3.2% decrease from $6,223
APR-DRG version Change—from V.29 to V.30
APR-DRG relative weights Change—from V.29 to V.30, using the V.30 HSRV weights
Average casemix Slight decrease from 0.710 under V.29 to 0.704 under V.30
Policy adjustor—pediatric MH No change—2.08
Policy adjustor—adult MH No change—1.75
Policy adjustor—obstetric No change—1.40
Policy adjustor—normal newborn No change—1.40
Policy adjustor—neonate No change—1.40
Policy adjustor—rehab No change—2.11
Policy adjustor—transplant No change—1.50
Policy adjustor—other No new policy adjustors
September 10, 201327
Year 2
Payment Policy Decisions (Continued)
Item Decision / Result
Cost outlier pool No change—target 5%
Cost outlier thresholdChange—to $32,800 from $30,000, reflecting 9.3% annual charge inflation since 2010-11
Marginal cost percentage No change—60%
Day outlier threshold No change—after 19 days
Day outlier per diem payment No change—$450
Interim claim per diem amount Change—to $850 from $450
Cost-to-charge ratios Change—update list to latest available
Charge levels used for simulating RY 2014 Change—expect charge inflation of 9.37%
Transfer adj discharge values Add value 63 to list—02, 05, 07, 63, 65, 66
Pediatric age cutoff No change—under age 21
Pricing logic No change
Allowed chg source logic No change
Medicaid Care Category definitions No change
Medical education add-on payments Change—update list, reflecting market basket increase
Per diem treatment auth threshold No change—after 19 days
Other aspects of payment method No change
September 10, 201328

9/9/2013
15
Policy adjustors will not change:
29 September 10, 2013
Year 2
Policy Adjustors
• Cost outlier threshold– Important to review annually because of continuing growth in charges
– Area of focus by OIG
– Charges per stay increased at annual rate of 9.3% between 2010-11 and 2012-13
– Cost outlier threshold therefore increased from $30,000 to $32,800
– Simulation results show outlier pool close to 5%
• Interim per diem increased from $450 to $850– Interim stays unusual; mostly NICU babies at UMC and Methodist (Memphis)
– Final payment will continue to be made by DRG
– $850 about 50% of average final payment for NICU care on a per diem basis
• Discharge status 63 (transfer to Medicare-designated long-term acute care hospital) now will count as an acute care transfer– DOM recognizes LTACs as acute care hospitals
– Affects payment in 18 stays out of 78,194 stays in simulation
Year 2
Payment Policy Updates
September 10, 201330

9/9/2013
16
Year 2
Expected Impacts by Medicaid Care Category
$0
$15,000,000
$30,000,000
$45,000,000
$60,000,000
$75,000,000
$90,000,000
Medicaid Care Categories are listed in declining order of total stays
Total Payments, Actual vs RY 2014 Simulation
RY 2013 Actual RY 2014 Simulated
Based on 78,194 stays between October 2012 and July 2013
September 10, 201331
Year 2
Expected Impacts by Hospital Peer Group
$0
$40,000,000
$80,000,000
$120,000,000
$160,000,000
$200,000,000
$240,000,000
$280,000,000
Under 50 beds 51 to 100 beds 101 to 200 beds Over 200 beds FreestandingMH
OOS
Total Payments, Actual vs RY 2014 Simulation
RY 2013 Actual RY 2014 Simulated
Based on 78,194 stays between October 2012 and July 2013
September 10, 201332

9/9/2013
17
Year 2
Expected Impacts by Medicaid Care Category
Adult MH and pediatric MH will continue to have the highest estimated pay-to-cost ratios,
despite the declines in average payment shown here
Stays
MCD Covered Days
Actual Payment Oct 2012-Jul 2013
DRG Simulation for October 1, 2013 Actual to Simulation
DRG Outlier Pay
RY 2013 Actual
DRG Outlier Pay
RY 2014 Simulated Change Pct
By Care Category
Adult circ 3,031 12,786 $1,326,313 $24,431,617 $1,248,282 $25,576,138 $1,144,520 5%
Adult GI 3,023 14,262 $767,740 $20,847,825 $854,587 $20,480,793 -$367,032 -2%
Adult MH 4,132 25,293 $117,450 $23,243,171 $117,450 $18,148,274 -$5,094,897 -22%
Adult misc 9,881 52,415 $6,870,179 $85,934,013 $8,022,350 $88,397,407 $2,463,394 3%
Adult resp 3,187 15,503 $756,015 $19,686,443 $789,432 $20,318,754 $632,312 3%
Neonate 2,470 37,920 $2,106,024 $62,407,130 $2,768,816 $58,395,584 -$4,011,545 -6%
Normal newborn 15,086 35,410 $33,617 $16,209,368 $31,607 $16,106,438 -$102,931 -1%
Obstetrics 20,570 54,912 $41,944 $76,936,382 $34,893 $83,296,840 $6,360,458 8%
Pediatric MH 4,761 48,809 $577,350 $33,262,881 $577,350 $29,990,465 -$3,272,416 -10%
Pediatric misc 6,632 25,816 $5,470,165 $48,294,794 $6,720,247 $50,065,099 $1,770,305 4%
Pediatric resp 5,107 16,174 $696,001 $17,690,424 $850,954 $18,160,770 $470,347 3%
Rehab 314 4,401 $48,980 $5,396,833 $72,569 $5,408,882 $12,050 0%
All categories 78,194 343,701 $18,811,779 $434,340,882 $22,088,535 $434,345,446 $4,565 0%
Outlier percentage 4.3% 5.1%
September 10, 201333
Year 2
Expected Impacts by Hospital Peer Group
Stays
MCD Covered Days
Actual Payment Oct 2012-Jul 2013
DRG Simulation for October 1, 2013 Actual to Simulation
DRG Outlier Pay
RY 2013 Actual
DRG Outlier Pay
RY 2014 Simulated Change Pct
By Peer Group
Under 50 beds 2,504 7,587 $10,675 $8,132,717 $9,779 $8,361,266 $228,548 3%
51 to 100 beds 5,840 16,745 $377,128 $18,557,862 $404,470 $19,386,841 $828,978 4%
101 to 200 beds 20,136 71,977 $2,215,589 $83,031,427 $2,032,731 $84,520,502 $1,489,075 2%
Over 200 beds 43,682 192,196 $11,174,979 $268,159,898 $13,973,554 $267,713,843 -$446,054 0%
Freestanding MH 2,830 32,759 $470,250 $20,480,159 $470,250 $19,013,935 -$1,466,223 -7%
OOS 3,202 22,437 $4,563,157 $35,978,818 $5,197,752 $35,349,060 -$629,759 -2%
All hospitals 78,194 343,701 $18,811,779 $434,340,882 $22,088,535 $434,345,446 $4,565 0%
Outlier percentage 4.3% 5.1%
Notes:
1. RY 2014 simulation includes 3.5% documentation and coding impact spread uniformly across all care categories and hospitals.
September 10, 201334

9/9/2013
18
Year 2
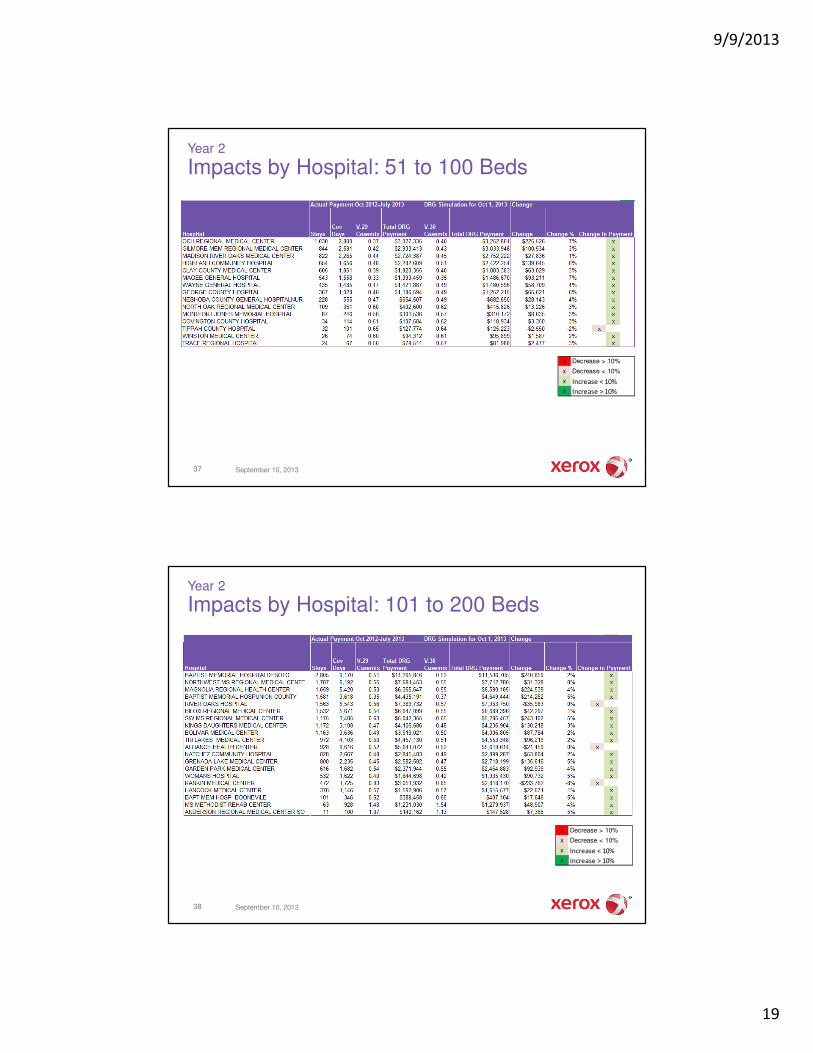
Impacts by Hospital: 50 Beds and Under (1)
x Decrease > 10%
x Decrease < 10%
x Increase < 10%
x Increase > 10%
September 10, 201335
Year 2
Impacts by Hospital: 50 Beds and Under (2)
x Decrease > 10%
x Decrease < 10%
x Increase < 10%
x Increase > 10%
September 10, 201336
9/9/2013
19
Year 2
Impacts by Hospital: 51 to 100 Beds
x Decrease > 10%
x Decrease < 10%
x Increase < 10%
x Increase > 10%
September 10, 201337
Year 2
Impacts by Hospital: 101 to 200 Beds
x Decrease > 10%
x Decrease < 10%
x Increase < 10%
x Increase > 10%
September 10, 201338
9/9/2013
20
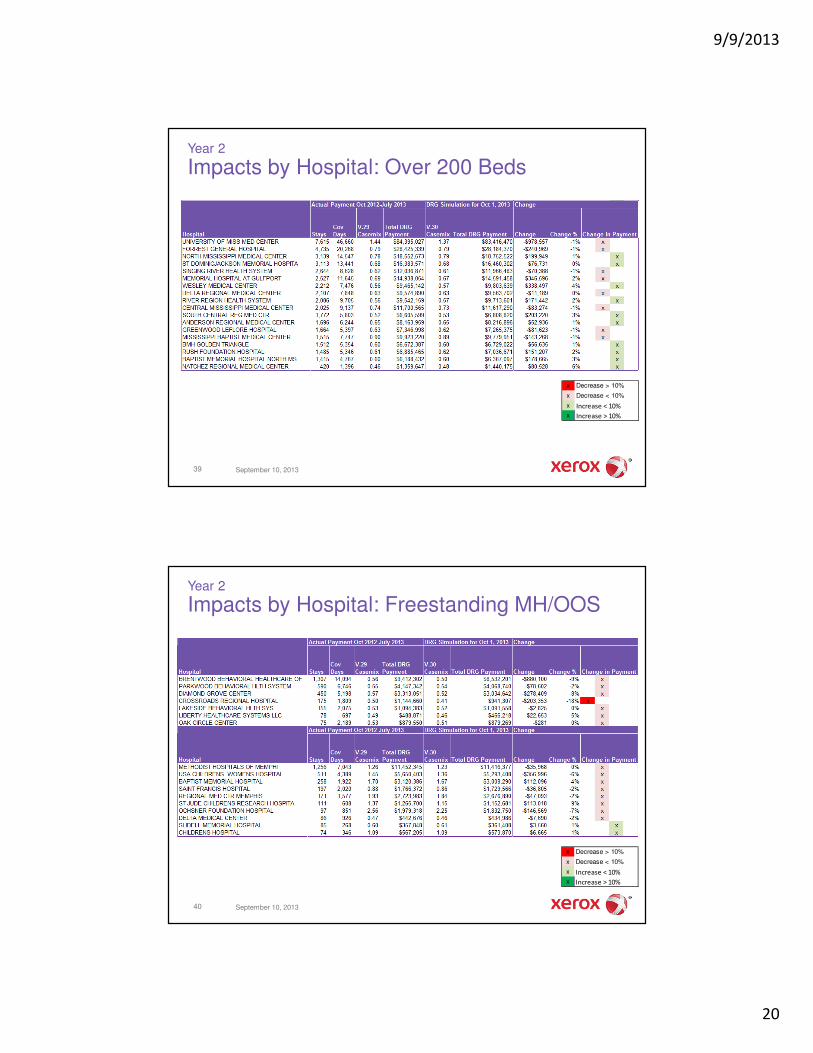
Year 2
Impacts by Hospital: Over 200 Beds
x Decrease > 10%
x Decrease < 10%
x Increase < 10%
x Increase > 10%
September 10, 201339
x Decrease > 10%
x Decrease < 10%
x Increase < 10%
x Increase > 10%
Year 2
Impacts by Hospital: Freestanding MH/OOS
September 10, 201340

9/9/2013
21
• Code diagnoses and procedures completely, accurately and defensibly
• For neonates, important that diagnosis codes reflect birthweight and gestational age– Claims processing system does not read diagnosis from value code
• Newborns should be billed on their own claims– Treatment authorization needed once length of stay exceeds 5 days
• MS Medicaid uses the same 72-hour window definition as Medicare– Use modifier 51 on outpatient claims for separately payable services
• Date of admission on the claim should equal first authorized date on the TAN
• All stays that exceed 19 days require continued stay TAN review
Year 2
Billing Pearls
September 10, 201341
• MSCAN beneficiaries - providers do not need to submit inpatient claims to the Coordinated Care Organizations (CCOs) for denial prior to submitting to the Mississippi Division of Medicaid– This is currently the second most common denial edit for hospital
inpatient claims
• Use the DRG pricing calculator to understand payment calculations and to predict payment
Year 2
Billing Pearls (Continued)
September 10, 201342

9/9/2013
22
• APR-DRG V.31 to be released by 3M 10/1/13 and implemented by MS Medicaid either 7/1/14 or 10/1/14
– Only very minor changes expected from V.30 to V.31
– No grouper or relative weight changes
• Mississippi Medicaid and other payers will accept only ICD-10 diagnosis and procedure codes on inpatient hospital claims effective October 1, 2014
– Impact on DRG payments expected to be negligible
• Medicaid will annually review DRG base price, cost and day outlier thresholds, applicability of policy adjustors, acute care discharge list, changes in reported casemix, etc.
• Annual update planned to hospital-specific cost-to-charge ratios
Year 2
Looking Ahead to Year 3
September 10, 201343
Appendix: Pricing Examples
1. Straight DRG—Physical Health
• Other DRGs applicable for heart attack include cardiac catheterization with AMI, chest pain without diagnosis of heart attack, etc.
Example: 47-Year-Old Male with Heart-attack
APR-DRG Severity DRG Base Price Payment Rel Wt DRG Base Rate
190-1 Minor $6,022 0.88349 $5,320
190-2 Moderate $6,022 0.97371 $5,864
190-3 Major $6,022 1.31065 $7,893
190-4 Severe $6,022 2.27653 $13,709
September 10, 201344

9/9/2013
23
Appendix: Pricing Examples
2. Straight DRG—Mental Health
• Same rates for general and freestanding hospitals.
• “Policy adjustor” boosts relative weight and therefore base payment for 72 mental health DRGs
• Different policy adjustors for pediatric (< 21) and adult
Example: Schizophrenia, Moderate Severity
APR-DRG Age DRG Base Price Payment Rel Wt DRG Base Rate
750-2 Pediatric $6,022 1.40115 $8,438
750-2 Adult $6,022 1.17885 $7,099
September 10, 201345
Appendix: Pricing Examples
3. Cost Outlier Case
• Cost outlier payments supplement base payments in exceptional cases (physical health DRGs only)
• Same calculation model as Medicare, intended to make about 5% of payments as outliers
• TAN on days required if stay exceeds 19 days
Example: DRG 720-4,Septicemia with Charges of $150,000
Step Explanation Amount
DRG base payment $6,022 x 2.66569 $16,053
Estimated cost $150,000 x 39% $58,500
Estimated loss $58,500 - $16,053 $42,447
Cost outlier case $42,447 > $32,800 Yes
Est. loss - cost outlier thresh $42,447 - $32,800 $9,647
Cost outlier payment $9,647 x 60% $5,788
DRG payment $16,053 + $5,788 $21,841
September 10, 201346

9/9/2013
24
Appendix: Pricing Examples
4. Day Outlier Case
• Day outlier payments supplement base payments in exceptional cases (mental health DRGs only)
• TAN on days required if stay exceeds 19 days
Example: DRG 751-4, Major Depression (Adult)
Step Explanation Amount
DRG base payment $6,022 x 2.70414 $16,284
Length of stay 25 days
Day outlier case? 25 > 19 Yes
Day outlier payment (25 - 19) x $450 $2,700
DRG payment $16,284 + $2,700 $18,984
September 10, 201347
Appendix: Pricing Examples
5. Transfer Cases
• Transfer = discharge status 02, 05, 07, 63, 65, 66
• Transfer adjustment made only if LOS less than national ALOS minus 1 day
• Payment adjustment follows Medicare model
Example: DRG 190-3, Heart-attackLOS = 3 days; Transferred to Another General Hospital
Step Explanation Amount
DRG base payment $6,022 x 1.31065 $7,893
Transfer case Discharge status = 02 Yes
National ALOS Look up from DRG table 5.94
Transfer adjustment ($7,893 / 5.94) * (3 + 1) $5,315
DRG payment $5,315 < $7,893 $5,315
September 10, 201348

9/9/2013
25
Appendix: Pricing Examples
6. Prorated Payment
• Occurs when patient has some days ineligible for Medicaid
• Hospitals may submit claim for entire stay
Example: DRG 190-3, Heart-attackLOS = 10 Days but Covered Days = 3 Days
Step Explanation Amount
DRG base payment $6,022 x 1.31065 $7,893
Prorated case LOS > covered days Yes
National ALOS Look up from DRG table 5.94
Prorated adjustment ($7,893 / 5.94) * (3 + 1) $5,315
DRG payment $5,315 < $7,893 $5,315
September 10, 201349
Appendix: Pricing Examples
7. Interim Claims
• No longer required under any circumstances
• Hospitals can choose to submit interim claims if a stay exceeds 30 days
• Interim payment of $850/day intended to provide cash flow
Example: Neonate 1200g with Respiratory Distress Syndrome (APR-DRG 602-4)
Claim Type of Bill Days Interim Per Diem Payment
1st interim claim 112 31 $850 $26,350
2nd interim claim 113 35 $850 $29,750
Void 1st interim claim 118 -31 $850 ($26,350)
Replace 2nd interim claim 117 80 $79,435
Net payment $109,185
Notes:
APR-DRG 602-4 base rate is $6,022 x 18.13105 = $109,185
Net payment may be higher if stay qualifies for outlier payment
September 10, 201350

9/9/2013
26
DRG Payment Policy Contacts
Some results in this analysis were produced using data obtained through the use of proprietary computer software created, owned and licensed by the 3M Company. All copyrights in and to the 3MTM Software are owned by 3M. All rights reserved.
Policy aspects:
Karen Thomas, CPMAccounting Director, Hospital ProgramBureau of ReimbursementOffice of the Governor, Division of [email protected]
Technical aspects:
Kevin QuinnVice President, Payment Method DevelopmentGovernment Healthcare SolutionsXerox [email protected]
For more information on Medicaid payment methods, please go to www.xerox.com/Medicaid