apps.fas.usda.gov · Web viewUK Per Capita Consumption of Alcoholic Beverages 5 Wine Color...
36
Required Report - public distribution Date: 1/22/2007 GAIN Report Number: UK7001 UK7000 United Kingdom Wine Marketing Annual Report 2007 Approved by: Besa L. Kotati U.S. Embassy Prepared by: Jennifer Wilson Report Highlights: The outlook for US wine exports to the UK market is extremely bright due to several factors. These factors include declining sales of French wine in the UK, and an increase in UK consumers’ appetites for wines from non-EU suppliers. According to UK Customs trade data, the UK imported almost $3.6 billion of still light wine in 2005, and 10 percent of that total was US wine. ACNielsen retail expenditure data for 2006 shows a 16 percent retail market share for the US. It also predicts that sales of US wine will surpass those of French wine in UK retail outlets by mid-2007. This would put the US at number two in the UK retail market, Australia is currently the largest supplier. Includes PSD Changes: No Includes Trade Matrix: Yes Annual Report London [UK1] [UK] USDA Foreign Agricultural Service GAIN Report Global Agriculture Information Network Template Version 2.09
Transcript of apps.fas.usda.gov · Web viewUK Per Capita Consumption of Alcoholic Beverages 5 Wine Color...
Required Report - public distributionDate: 1/22/2007
GAIN Report Number: UK7001UK7000United KingdomWineMarketing Annual Report2007
Approved by:Besa L. KotatiU.S. EmbassyPrepared by:Jennifer Wilson
Report Highlights:The outlook for US wine exports to the UK market is extremely bright due to several factors. These factors include declining sales of French wine in the UK, and an increase in UK consumers’ appetites for wines from non-EU suppliers. According to UK Customs trade data, the UK imported almost $3.6 billion of still light wine in 2005, and 10 percent of that total was US wine. ACNielsen retail expenditure data for 2006 shows a 16 percent retail market share for the US. It also predicts that sales of US wine will surpass those of French wine in UK retail outlets by mid-2007. This would put the US at number two in the UK retail market, Australia is currently the largest supplier.
Includes PSD Changes: NoIncludes Trade Matrix: Yes
Annual ReportLondon [UK1]
[UK]
USDA Foreign Agricultural Service
GAIN ReportGlobal Agriculture Information Network
Template Version 2.09
GAIN Report - UK7001 Page 2 of 25
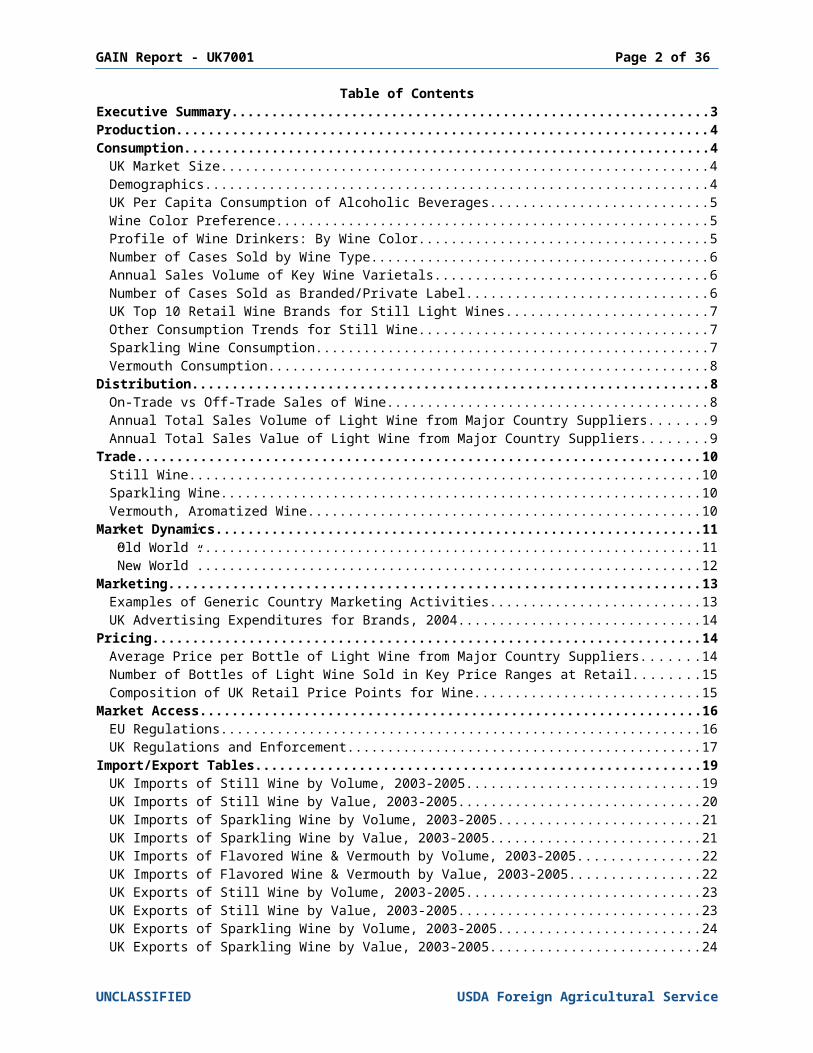
Table of ContentsExecutive Summary............................................................................................3Production.........................................................................................................4Consumption.....................................................................................................4
UK Market Size.....................................................................................................................4Demographics......................................................................................................................4UK Per Capita Consumption of Alcoholic Beverages..............................................................5Wine Color Preference..........................................................................................................5Profile of Wine Drinkers: By Wine Color.................................................................................5Number of Cases Sold by Wine Type.....................................................................................6Annual Sales Volume of Key Wine Varietals..........................................................................6Number of Cases Sold as Branded/Private Label...................................................................6UK Top 10 Retail Wine Brands for Still Light Wines................................................................7Other Consumption Trends for Still Wine..............................................................................7Sparkling Wine Consumption................................................................................................7Vermouth Consumption........................................................................................................8
Distribution.......................................................................................................8On-Trade vs Off-Trade Sales of Wine......................................................................................8Annual Total Sales Volume of Light Wine from Major Country Suppliers................................9Annual Total Sales Value of Light Wine from Major Country Suppliers...................................9
Trade...............................................................................................................10Still Wine............................................................................................................................10Sparkling Wine...................................................................................................................10Vermouth, Aromatized Wine...............................................................................................10
Market Dynamics.............................................................................................11”Old World”........................................................................................................................11”New World”.......................................................................................................................12
Marketing........................................................................................................13Examples of Generic Country Marketing Activities..............................................................13UK Advertising Expenditures for Brands, 2004....................................................................14
Pricing.............................................................................................................14Average Price per Bottle of Light Wine from Major Country Suppliers.................................14Number of Bottles of Light Wine Sold in Key Price Ranges at Retail....................................15Composition of UK Retail Price Points for Wine...................................................................15
Market Access..................................................................................................16EU Regulations...................................................................................................................16UK Regulations and Enforcement.......................................................................................17
Import/Export Tables........................................................................................19UK Imports of Still Wine by Volume, 2003-2005..................................................................19UK Imports of Still Wine by Value, 2003-2005.....................................................................20UK Imports of Sparkling Wine by Volume, 2003-2005.........................................................21UK Imports of Sparkling Wine by Value, 2003-2005............................................................21UK Imports of Flavored Wine & Vermouth by Volume, 2003-2005.......................................22UK Imports of Flavored Wine & Vermouth by Value, 2003-2005..........................................22UK Exports of Still Wine by Volume, 2003-2005..................................................................23UK Exports of Still Wine by Value, 2003-2005.....................................................................23UK Exports of Sparkling Wine by Volume, 2003-2005.........................................................24UK Exports of Sparkling Wine by Value, 2003-2005............................................................24UK Exports of Flavored Wine & Vermouth by Volume, 2003-2005.......................................25UK Exports of Flavored Wine & Vermouth by Value, 2003-2005..........................................25
UNCLASSIFIED USDA Foreign Agricultural Service
GAIN Report - UK7001 Page 3 of 25
Executive Summary
According to research commissioned by VINEXPO, and conducted by IWSR, the retail sales value of the UK wine market grew by 25 percent between 2001 and 2005, to reach more than $9 billion. Looking ahead, this research predicts that the retail sales value of the UK wine market will be the largest in Europe by 2010. The UK is already the world’s largest importer of wine, since UK domestic production is negligible.
The UK wine market value has been growing steadily through a rise in the volume of wine being consumed, and also a slight movement by consumers towards more expensive wines. However, ACNielsen data shows that UK market growth has currently slowed. For the year-to-October 2006, ACNielsen records UK sales value growth at 1.8 percent and sales volume growth just 0.2 percent.
The UK enjoys a wide variety of wine imports from around the globe. Since 2003, total sales of “New World” wines have surpassed those of traditional “Old World” suppliers such as France, Italy, Germany and Spain. The New World suppliers include Australia, USA, South Africa, and Chile. Currently, Australia is the number one supplier to the UK market, with France second and the USA third. The outlook for US wine in the UK market is extremely bright. As French wine sales to the UK are declining in volume, and (to a lesser extent) in value, the USA is expected to take the number two position in the UK market in 2007. ACNielsen data shows that the USA grew by 8.7 percent in volume terms, and 10.4 percent in value, in the year-to-October 2006.
The retail sector (or off-trade as it is termed in the UK) now accounts for at least 70 percent of UK wine sales. There is trade industry concern that such a significant percentage of UK wine sales volume is through the supermarket chains, since supermarkets sell around 80 percent of their wine volume on discount. Smaller producers are finding it difficult to compete in this retail environment, which may lead to a decrease in choice of wine for the UK consumer over time.
Wine sales in the foodservice (or on-trade) sector have had a mixed performance in recent years, with a slowing of alcoholic drink sales generally in hotels and restaurants. However, healthy sales activity has been noted for wine in UK pub/bar chains. Consumption of wine in the UK is increasing at the expense of beer sales, as the British become more “continental” in their social habits, and as they drink wine more often with meals at home.
Branded wines are driving the UK market, providing many consumers with comfort because they lack the experience to choose by grape and region (since few have knowledge of European appellations). However, there is a small, but growing, group of UK consumers who are “wine connoisseurs”. They have an interest in wine, and are capable of making choices by grape variety, regional characteristic and individual production method.
Sales of rosé wine jumped 32 percent in the year-to-October 2006, mainly as a result of the current fashion among young female consumers for White Zinfandel.
Sparkling wine sales are also doing well, since they are increasingly perceived as informal and suitable for drinking on any occasion.
The market for vermouth and other aromatized wines is essentially static, with the category unable to attract younger consumers.
UNCLASSIFIED USDA Foreign Agricultural Service

GAIN Report - UK7001 Page 4 of 25
Production
Wine production in the UK is minimal due to the variable climate. Historically, it has been a cottage industry for wine enthusiasts and a hobby of larger land-owners. Today, it is slowly becoming a profitable enterprise. It has limited potential for large-scale production, however, as most vineyards have less than 2 hectares under vine. According to the Wine Standards Branch, there are around 353 vineyards (91 wine producers) in England and Wales, covering about 761 hectares. This production represents only 0.01 percent of UK wine consumption. Production volume in 2005 was considerably reduced from the relatively high level of the 2004 harvest. The 2005 harvest totaled 12,806 hectoliters, comprised of 10,427 hectoliters white wine and 2,379 hectoliters red wine.
The UK also produces a small quantity of “British wine”, which is made from imported concentrated grape concentrate, mainly from Italy.
The lack of any significant production volume in the UK means that it has negligible affect on market figures. UK production figures are, therefore, not represented in the following analyses.
Consumption
UK Market Size
According to HM Customs the UK imported 12,230 hectoliters of still wine in 2005, worth $3.6 billion at entry to the market.
ACNielsen figures show the value of the UK retail market to be:
Year toOctober 2004
Year toOctober 2005
Year toOctober 2006
Change ‘06/’05
Sales Value inMillions
₤3,963$6,341
₤4,198$7,137
₤4,274$7,907
1.8%
Sales Volume in000’s 9 liter cases
86,594 91,176 91,352 0.2%
Average Exchange Rates: 2004: 1 BPS = 1.60 USD2005: 1 BPS = 1.70 USD2006: 1 BPS = 1.85 USD
Demographics
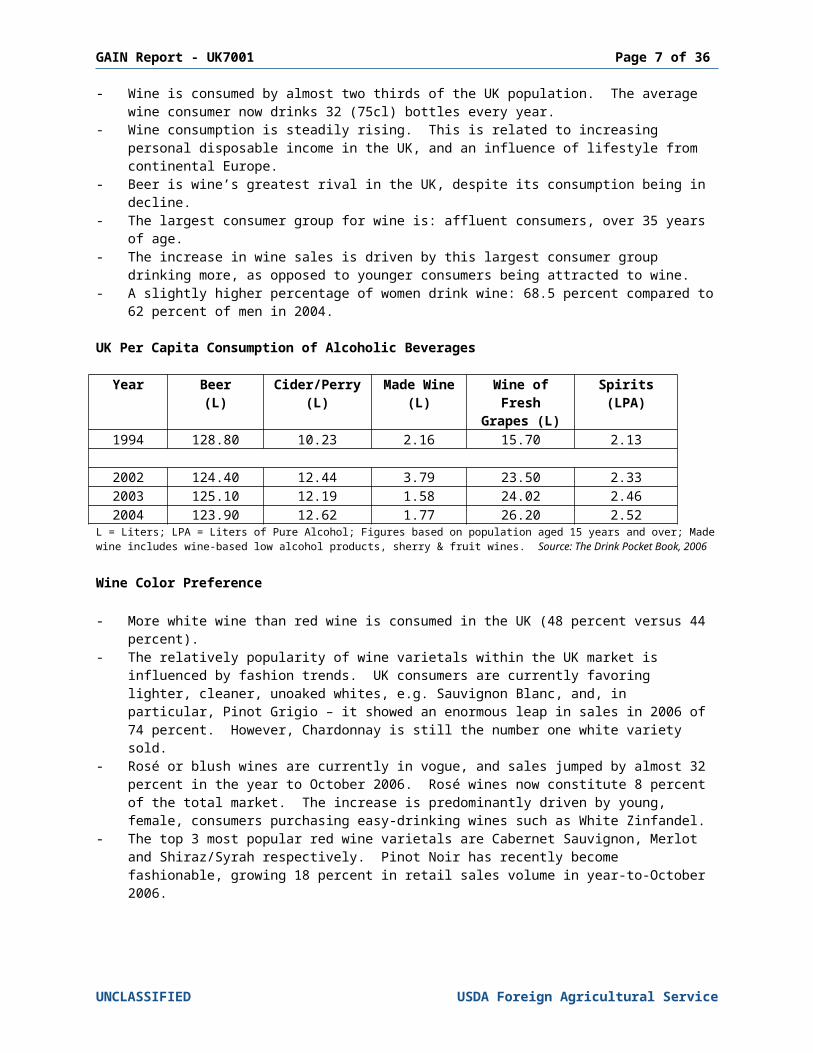
- Wine is consumed by almost two thirds of the UK population. The average wine consumer now drinks 32 (75cl) bottles every year.
- Wine consumption is steadily rising. This is related to increasing personal disposable income in the UK, and an influence of lifestyle from continental Europe.
- Beer is wine’s greatest rival in the UK, despite its consumption being in decline.- The largest consumer group for wine is: affluent consumers, over 35 years of age.- The increase in wine sales is driven by this largest consumer group drinking more, as
opposed to younger consumers being attracted to wine.- A slightly higher percentage of women drink wine: 68.5 percent compared to 62 percent
of men in 2004.
UK Per Capita Consumption of Alcoholic Beverages
UNCLASSIFIED USDA Foreign Agricultural Service
GAIN Report - UK7001 Page 5 of 25
Year Beer(L)
Cider/Perry(L)
Made Wine(L)
Wine of Fresh
Grapes (L)
Spirits(LPA)
1994 128.80 10.23 2.16 15.70 2.13
2002 124.40 12.44 3.79 23.50 2.332003 125.10 12.19 1.58 24.02 2.462004 123.90 12.62 1.77 26.20 2.52
L = Liters; LPA = Liters of Pure Alcohol; Figures based on population aged 15 years and over; Made wine includes wine-based low alcohol products, sherry & fruit wines. Source: The Drink Pocket Book, 2006
Wine Color Preference
- More white wine than red wine is consumed in the UK (48 percent versus 44 percent).- The relatively popularity of wine varietals within the UK market is influenced by fashion
trends. UK consumers are currently favoring lighter, cleaner, unoaked whites, e.g. Sauvignon Blanc, and, in particular, Pinot Grigio – it showed an enormous leap in sales in 2006 of 74 percent. However, Chardonnay is still the number one white variety sold.
- Rosé or blush wines are currently in vogue, and sales jumped by almost 32 percent in the year to October 2006. Rosé wines now constitute 8 percent of the total market. The increase is predominantly driven by young, female, consumers purchasing easy-drinking wines such as White Zinfandel.
- The top 3 most popular red wine varietals are Cabernet Sauvignon, Merlot and Shiraz/Syrah respectively. Pinot Noir has recently become fashionable, growing 18 percent in retail sales volume in year-to-October 2006.
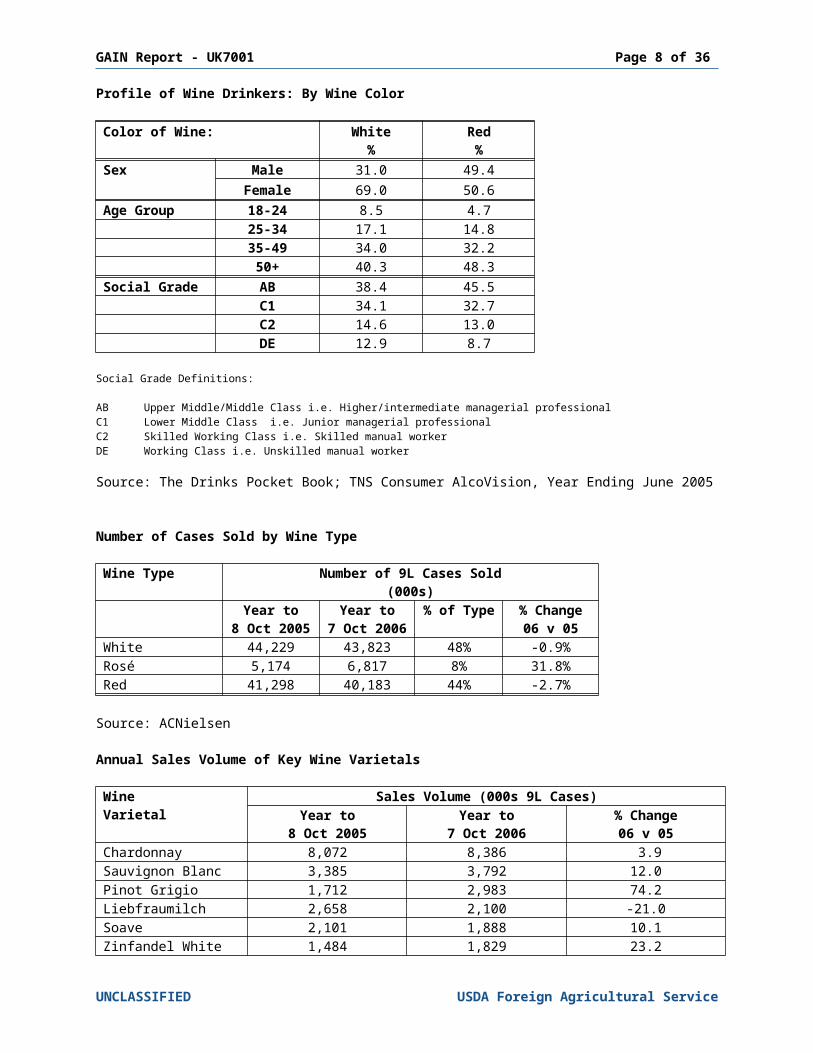
Profile of Wine Drinkers: By Wine Color
Color of Wine: White%
Red%
Sex Male 31.0 49.4Female 69.0 50.6
Age Group 18-24 8.5 4.725-34 17.1 14.835-49 34.0 32.250+ 40.3 48.3
Social Grade AB 38.4 45.5C1 34.1 32.7C2 14.6 13.0DE 12.9 8.7
Social Grade Definitions:
AB Upper Middle/Middle Class i.e. Higher/intermediate managerial professionalC1 Lower Middle Class i.e. Junior managerial professionalC2 Skilled Working Class i.e. Skilled manual workerDE Working Class i.e. Unskilled manual worker
Source: The Drinks Pocket Book; TNS Consumer AlcoVision, Year Ending June 2005
Number of Cases Sold by Wine Type
Wine Type Number of 9L Cases Sold(000s)
Year to Year to % of Type % Change
UNCLASSIFIED USDA Foreign Agricultural Service

GAIN Report - UK7001 Page 6 of 25
8 Oct 2005 7 Oct 2006 06 v 05White 44,229 43,823 48% -0.9%Rosé 5,174 6,817 8% 31.8%Red 41,298 40,183 44% -2.7%
Source: ACNielsen
Annual Sales Volume of Key Wine Varietals
Wine Varietal
Sales Volume (000s 9L Cases)Year to
8 Oct 2005Year to
7 Oct 2006% Change
06 v 05Chardonnay 8,072 8,386 3.9Sauvignon Blanc 3,385 3,792 12.0Pinot Grigio 1,712 2,983 74.2Liebfraumilch 2,658 2,100 -21.0Soave 2,101 1,888 10.1Zinfandel White 1,484 1,829 23.2Viognier 153 127 17.0Muscadet 522 496 -5.0Muscat 117 81 -30.8Cabernet Sauvignon 4,472 4,642 3.8Merlot 3,834 3,798 -0.9Shiraz 2,664 2,983 12.0Syrah 360 327 -9.2Shiraz Cabernet 2,908 2,500 -14.0Tempranillo 2,221 2,142 -3.6Cabernet Shiraz 1,588 1,958 23.3Pinot Noir 262 310 18.3Zinfandel 257 270 5.1Malbec 179 177 -1.1
Source: ACNielsen
Number of Cases Sold as Branded/Private Label
Wine Type Number of 9L Cases Sold(000s)
Year to8 Oct 2005
Year to7 Oct 2006
% of Type % Change06 v 05
Branded 68,147 69,421 76% 1.9%Own (Private) Label
23,093 21,985 24% -4.8%
Source: ACNielsen
Some consumers are “brand dependent”, they will trust a name, and pay for security. Others are “experimental enthusiasts” and will respond to more detailed messages on provenance.
Brands are driving the growth in the UK wine market. The most popular wine brands in the UK are:
UK Top 10 Retail Wine Brands for Still Light Wines
1 Hardy’s 6 Kumala
UNCLASSIFIED USDA Foreign Agricultural Service
GAIN Report - UK7001 Page 7 of 25
2 Blossom Hill 7 Banrock Station3 E & J Gallo 8 Wolf Blass4 Jacob’s Creek 9 Lindemans5 Stowells 10 Echo Falls
Source: ACNielsen, Year-to-October 2006
Other Consumption Trends for Still Wine
- The most popular style of wine consumed in the UK is relatively young and ready to drink.
- Most wine is purchased in 75cl bottles, however, bag-in-box wine now accounts for 10 percent of the UK’s still wine retail market, and there is a growing market for 250ml bottles.
- Following years of debate, UK consumers have ultimately shown little resistance to the introduction of screw caps on their wine bottles.
- Consumers generally do not consider alcoholic content specifically when choosing wine. High alcohol contents are apparently not a barrier to sales since many “New World” reds are of a relatively high alcoholic content, and their sales are increasing.
Sparkling Wine Consumption
- Sparkling wine has a younger audience than still wine generally, 20-24 year olds are more likely to choose sparkling wine, while 25-44 year olds are more likely to choose champagne.
- Personal disposable incomes are growing at 3 percent per annum, and there are aspirational lifestyle trends exhibited by those in the 20–40 year age range.
- There is a documented increase in the entertaining of friends at home.- Sparkling wine is increasingly perceived as informal and suitable for drinking on any
occasion.- Women consume more sparkling wine than men, while men tend to favor champagne.- Sparkling wine purchasers are generally not loyal to any one brand or style (although
Cava is popular). Champagne drinkers tend to know the different properties of brands and are much more brand-loyal.
- Consumption of sparkling wine (non-champagne) is evenly distributed nationally across Great Britain, whereas champagne consumption is particularly high in the London area.
UNCLASSIFIED USDA Foreign Agricultural Service
GAIN Report - UK7001 Page 8 of 25
Vermouth Consumption
Vermouth, aromatized wines and other aperitifs include brands such as Martini, Cinzano, Noilly Prat, and Dubonnet.
- Consumption is fairly static, with the vermouth category a victim of fashion trends in the alcoholic drinks sector.
- Vermouths and other aromatized wines are generally drunk neat in their in their country of origin, however, in the UK these products are considered as “mixables” i.e. they will be served with lemonade, fruit juice or tonic water.
- The weather influences consumer drinking habits in the UK and many “mixables” are perceived as being either summer drinks or Christmas drinks.
- The British Market Research Bureau (BMRB) reports that vermouth drinkers are predominantly women, aged 45-64 and relatively more affluent.
- Consumption is notably higher than average in Greater London and the Midlands, with consumers in the South East and East Anglia showing an average level of consumption.
Distribution
The retail sector (or off-trade as it is termed in the UK) accounted for 79 percent of the volume of UK wine sales, and 54 percent of the value in 2005. Sales are being driven predominantly by promotions and discounting. Many UK consumers appear content with the variety offered by their local supermarket, and are likely to pick up a bottle of whatever wine is on promotion at the time. Supermarkets are not concerned about the amount of wine sold on discount, since sales promotions are funded by wine suppliers.
Specialist wine chains previously saw some of their market share eroded by supermarket chains, but, with growing consumer interest in wine, they are starting to experience something of turnaround in fortune. Volume share for the specialist wine trade is expected to rise slightly in 2006 over the previous year, and sales of premium wines continue to drive value.
In 2005, the foodservice (or on-trade) sector accounted for 21 percent of total wine volume sales, but 46 percent of total value sales. Sales in the on-trade sector are closely linked to the UK’s economic climate. Restaurants and hotels have experienced tougher trading conditions than pubs and bars. The practice by restaurants and hotels of adding a 300-400 percent mark-up on wine frustrates many consumers and discourages them from choosing better wines in such outlets. Pubs/bars have become a good value alternative, and many display their wine lists prominently. Wine is also more likely to be sold by the glass in pubs and bars. This encourages people to experiment and trade up to higher-value wines.
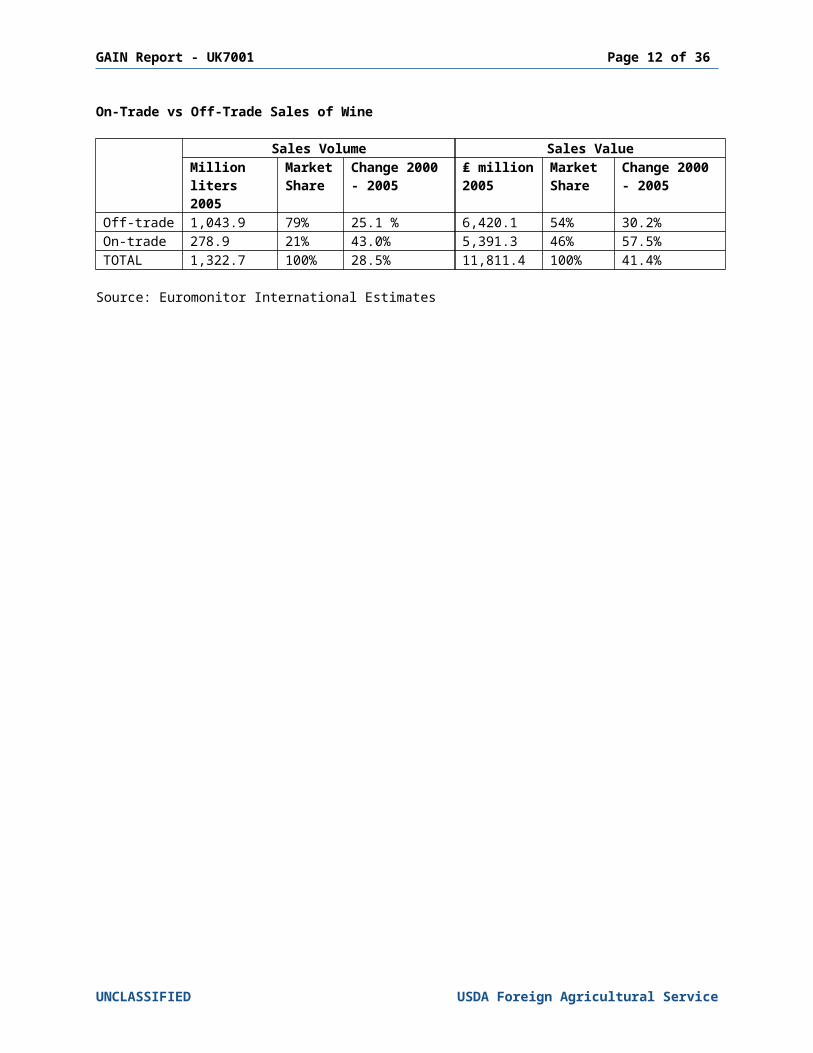
On-Trade vs Off-Trade Sales of Wine
Sales Volume Sales ValueMillion liters 2005
Market Share
Change 2000 - 2005
₤ million2005
Market Share
Change 2000 - 2005
Off-trade 1,043.9 79% 25.1 % 6,420.1 54% 30.2%On-trade 278.9 21% 43.0% 5,391.3 46% 57.5%TOTAL 1,322.7 100% 28.5% 11,811.4 100% 41.4%
Source: Euromonitor International Estimates
UNCLASSIFIED USDA Foreign Agricultural Service

GAIN Report - UK7001 Page 9 of 25
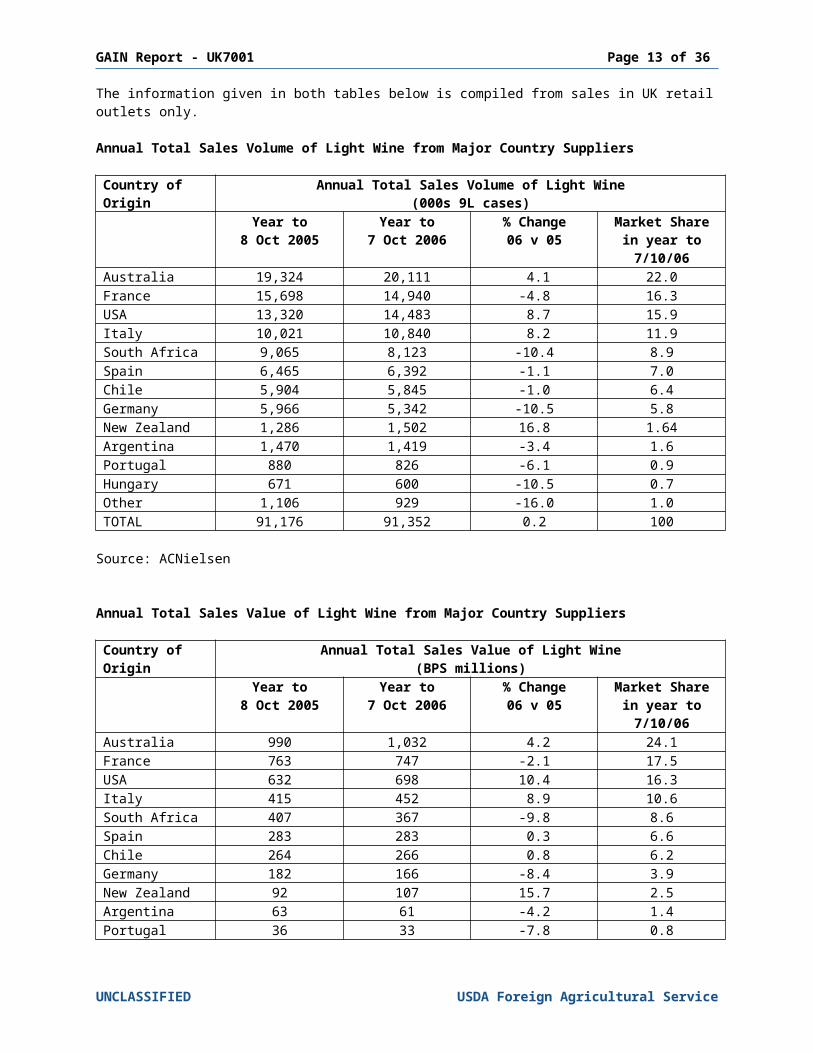
The information given in both tables below is compiled from sales in UK retail outlets only.
Annual Total Sales Volume of Light Wine from Major Country Suppliers
Country of Origin
Annual Total Sales Volume of Light Wine(000s 9L cases)
Year to8 Oct 2005
Year to7 Oct 2006
% Change06 v 05
Market Share in year to 7/10/06
Australia 19,324 20,111 4.1 22.0France 15,698 14,940 -4.8 16.3USA 13,320 14,483 8.7 15.9Italy 10,021 10,840 8.2 11.9South Africa 9,065 8,123 -10.4 8.9Spain 6,465 6,392 -1.1 7.0Chile 5,904 5,845 -1.0 6.4Germany 5,966 5,342 -10.5 5.8New Zealand 1,286 1,502 16.8 1.64Argentina 1,470 1,419 -3.4 1.6Portugal 880 826 -6.1 0.9Hungary 671 600 -10.5 0.7Other 1,106 929 -16.0 1.0TOTAL 91,176 91,352 0.2 100
Source: ACNielsen
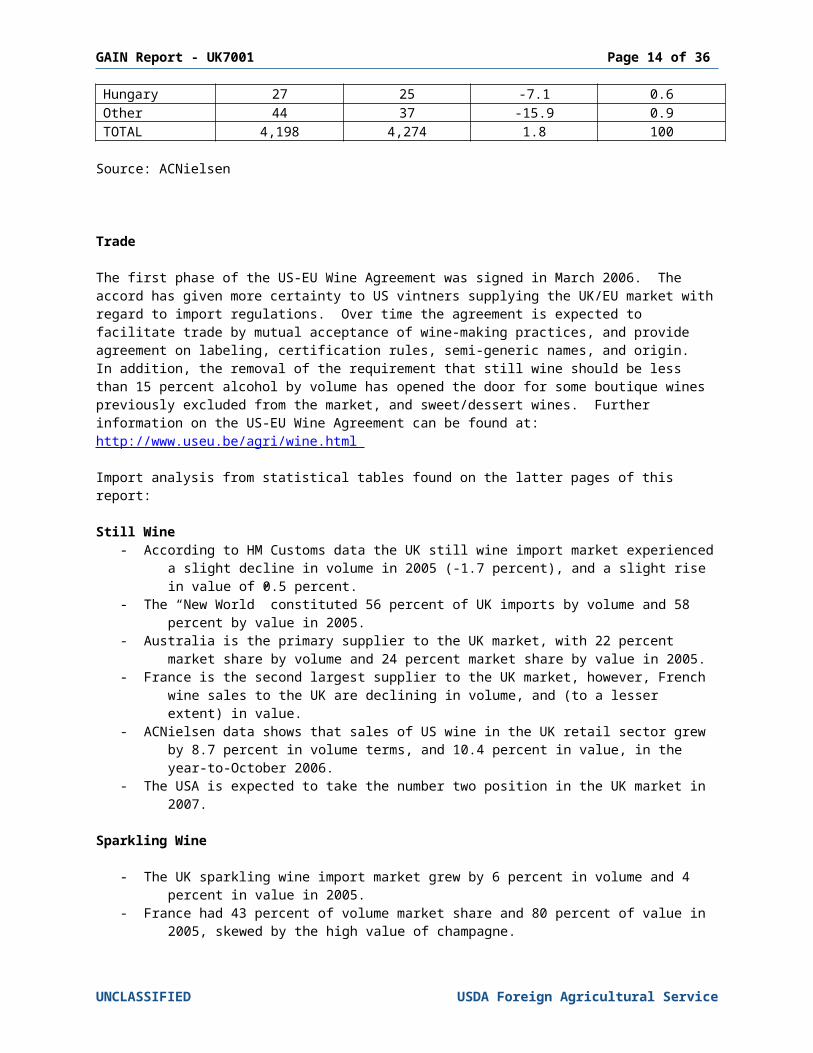
Annual Total Sales Value of Light Wine from Major Country Suppliers
Country of Origin
Annual Total Sales Value of Light Wine(BPS millions)
Year to8 Oct 2005
Year to7 Oct 2006
% Change06 v 05
Market Share in year to 7/10/06
Australia 990 1,032 4.2 24.1France 763 747 -2.1 17.5USA 632 698 10.4 16.3Italy 415 452 8.9 10.6South Africa 407 367 -9.8 8.6Spain 283 283 0.3 6.6Chile 264 266 0.8 6.2Germany 182 166 -8.4 3.9New Zealand 92 107 15.7 2.5Argentina 63 61 -4.2 1.4Portugal 36 33 -7.8 0.8Hungary 27 25 -7.1 0.6Other 44 37 -15.9 0.9TOTAL 4,198 4,274 1.8 100
Source: ACNielsen
Trade
UNCLASSIFIED USDA Foreign Agricultural Service
GAIN Report - UK7001 Page 10 of 25
The first phase of the US-EU Wine Agreement was signed in March 2006. The accord has given more certainty to US vintners supplying the UK/EU market with regard to import regulations. Over time the agreement is expected to facilitate trade by mutual acceptance of wine-making practices, and provide agreement on labeling, certification rules, semi-generic names, and origin. In addition, the removal of the requirement that still wine should be less than 15 percent alcohol by volume has opened the door for some boutique wines previously excluded from the market, and sweet/dessert wines. Further information on the US-EU Wine Agreement can be found at: http://www.useu.be/agri/wine.html
Import analysis from statistical tables found on the latter pages of this report:
Still Wine- According to HM Customs data the UK still wine import market experienced a slight
decline in volume in 2005 (-1.7 percent), and a slight rise in value of 0.5 percent.- The “New World” constituted 56 percent of UK imports by volume and 58 percent by
value in 2005.- Australia is the primary supplier to the UK market, with 22 percent market share by
volume and 24 percent market share by value in 2005.- France is the second largest supplier to the UK market, however, French wine sales to
the UK are declining in volume, and (to a lesser extent) in value.- ACNielsen data shows that sales of US wine in the UK retail sector grew by 8.7 percent
in volume terms, and 10.4 percent in value, in the year-to-October 2006.- The USA is expected to take the number two position in the UK market in 2007.
Sparkling Wine
- The UK sparkling wine import market grew by 6 percent in volume and 4 percent in value in 2005.
- France had 43 percent of volume market share and 80 percent of value in 2005, skewed by the high value of champagne.
- Imports from Australia, New Zealand and the United States enjoyed considerable value gains in 2005.
- Australia is now the third largest supplier to the UK sparkling wine market behind France and Spain. Italy is now fourth largest supplier.
Vermouth, Aromatized Wine
- UK imports of Vermouth and other aromatized wine declined by 10 percent by volume, and 6 percent in value in 2005
- The market is dominated by European suppliers, particularly France and Italy. The US is not a regular trade supplier.
- Vermouth imports to the UK are forecast to decrease in 2006 in both value and volume.
UNCLASSIFIED USDA Foreign Agricultural Service
GAIN Report - UK7001 Page 11 of 25
Market Dynamics
”Old World”
France- French wines continue to lose ground in the UK market.- To respond to market conditions in the UK, French producers, in liaison with UK
importers, are beginning to launch innovative branded wines, displaying grape varieties on the labels.
- France has strong “brands” such as Bordeaux and Burgundy and a loyal following of UK consumers (that tend to be very knowledgeable about wine).
- On the basis of the latter two points, sales of French wine may recover, but it may take many years.
- The best performing wines from France in the UK market currently are (paradoxically): Champagne and Vins de Pays. Champagne sales are linked to brand awareness. The mass market Vins de Pays delivers fruit driven wine at a competitive price, and importantly is able to label by grape variety.
Germany- For the past decade, German wine sales have fallen victim to changing UK
consumer tastes.- There are signs that Germany’s fortunes in the UK wine market are turning around.
Forecasts for value and average price per bottle for are encouraging.- The audience for Germany’s traditionally popular styles, such as Liebfraumilch and
Hock, is continuing to switch preference. However, sales of Riesling are increasing, in part due to the building of this category by Australia.
Italy- Just over one bottle out of every 10 sold in the UK supermarket sector is Italian.
This puts Italy in fourth place behind Australia, France and the US.- Italy continues to grow its exports to the UK market, albeit more slowly than
Australia and the US.- Chianti, Frascati and Pinot Grigio currently enjoy healthy sales, with Pinot Grigio
the new Chardonnay of the UK market.- Italy’s diversity of wines is said to be its greatest strength, but also its greatest
weakness as UK consumers struggle to understand the relative merits of the different Italian regions.
Spain- According to ACNielsen, volume and value sales for Spain for 2005 stagnated
somewhat in year-to-October 2006. Looking ahead, Spain is in danger of being overtaken by Chile on both accounts.
- Besides Rioja and Cava, UK consumers find it hard to identify with Spanish wine.- Rioja comprises around one-third of all Spanish wine sales in the UK. Sales are
affected by the trend towards Shiraz/Syrah, Malbec and Pinot Noir.- Spain has a reputation for cheap red wine, with many listings selling for under £3.
Spanish still white wine is less well-known.- Some Spanish wine brands are beginning to emerge, particularly from Ribera del
Duero.
UNCLASSIFIED USDA Foreign Agricultural Service
GAIN Report - UK7001 Page 12 of 25
”New World”
Australia- ACNielsen data (year-to-October 2006) shows signs that the growth of Australian
wine exports to the UK have slowed. - Large brands are playing a crucial role in Australia’s success. Australia now has
five of the top ten brands by value, led by Hardy’s.- As the focus of the UK supermarket chains is firmly on profit and how much money
can be made per square meter, they turn to the big brands to fill their key promotional slots. The result is that an estimated two-thirds of Australian wine sells below its recommended retail price.
- Discounting has largely been possible due to the oversupply of wine from Australia.
USA- Sales of US wine in the UK market are largely driven by the Blossom Hill and E&J
Gallo brands. Around one-third of US sales in the UK may be Blossom Hill alone.- This contributes to the current contradiction between 8 percent of retail shelf
space attributed to US wine and its 16 percent market share (ACNielsen).- In recent years, trade sources have described a polarity in the supply of wine by
the US to the UK market: plentiful supply of lower end wine and ample supply of boutique-priced wine.
- The Wine Institute of California is continuing their high profile campaign to demonstrate to the trade that the US can supply adequate wine for the UK market’s needs in the mid-price range.
South Africa- South Africa exports to the UK dropped by 10 percent in volume and value in the
year-to-October 2006.- The Kumala brand has recently accounted for around 22 percent of South African
wine exports to the UK. The purchase of the Kumala brand by the world’s largest wine company - Constellation is said by industry sources to have caused some interruptions in Kumala’s distribution and marketing strategy.
Chile- Chilean wine sales declined by 1 percent in volume and rose 1 percent value in
year-to-October 2006.- Around 5 years ago Chile had a reputation for cheap red wine in the UK on account
of their continuous price promotions at £2.99 ($5.30).- The Wines of Chile UK Office continue to undertake promotional work to re-position
Chile as a higher quality and price proposition.- Successful Chilean brands in the UK include: Errázuriz, Cono Sur and Concha y
Toro.
New Zealand- New Zealand had another exceptional year in 2005/6 for their wine exports to the
UK. Volume increased by 17 percent and value by 16 percent in year-to-October 2006.
- Its average price per bottle is higher than any other country producer.- The trend in the UK away from oaked chardonnays to lighter, fruitier wines is
fueling a large market for Sauvignon Blanc. Marlborough Sauvignon Blancs enjoy a very good reputation in the UK, with customers showing brand and varietal loyalty.
UNCLASSIFIED USDA Foreign Agricultural Service
GAIN Report - UK7001 Page 13 of 25
Marketing
Generic support for wine origins continues to play a pivotal role in UK wine marketing. For example, a vast array of country and regional pavilions support the London International Wine & Spirit Fair each year. This show takes place annually, and the next show is:
May 22-24 London International Wine & Spirits Trade Fair, ExCeL, London Contact: Brintex Ltd Tel: 011 44 20 7973 6401 Fax: 011 44 20 7233 5054Web site: www.londonwinefair.com E-mail: [email protected]
Examples of Generic Country Marketing Activities
Australia - Australian Wine Bureau UK Office- Australia Day Tasting- Around 66 percent of Australian wine is sold on price or multi-buy
promotion (versus 46 percent of wine as a whole)France - Wine Department within Sopexa (French marketing body) London Office
- Strategy to improve quality perception in lower appellations- Advertising campaigns for Alsace, Bordeaux, Burgundy
USA - Wine Institute of California UK Office- UK representative for wines from Washington and Oregon states- Generic regional tastings e.g. Napa Valley
Spain - Wines from Spain UK Office- Advertising in trade and consumer press- In-store promotions
Germany - German Wine Institute- Campaign to improve image of German wines
South Africa
- Wines of South Africa UK Office- Historically low price points, concentrating on brand-building instead of
discounting to build market share Chile - Wines of Chile UK Office
- Trade & Press educational messages- Chilean Bus at consumer events across the UK
Argentina - Wines of Argentina UK Office- ‘Drink Argentina’ campaign including promotions, media campaigns and
sampling in UK major cities
In the UK, the promotion of US wine is spear-headed by the Wine Institute of California’s UK Office. Their strategy is to promote “Brand California” (a region that has positive connotations in the mind of UK consumers), together with trade tastings to show the diversity of California. It is proving particularly effective. The Napa Valley Vintners’ trade body has a promotional program in the UK, administered through a PR agency – Watershed Communications. In addition, the Washington Wine Coalition and Oregon Wine Board are represented in the UK by a trade consultant - Hilltop Wines.
Looking at UK market promotion generally, above-the-line advertising expenditure has been in decline in recent years. Two-thirds of promotion undertaken in the UK is price discounting in nature.
UNCLASSIFIED USDA Foreign Agricultural Service
GAIN Report - UK7001 Page 14 of 25
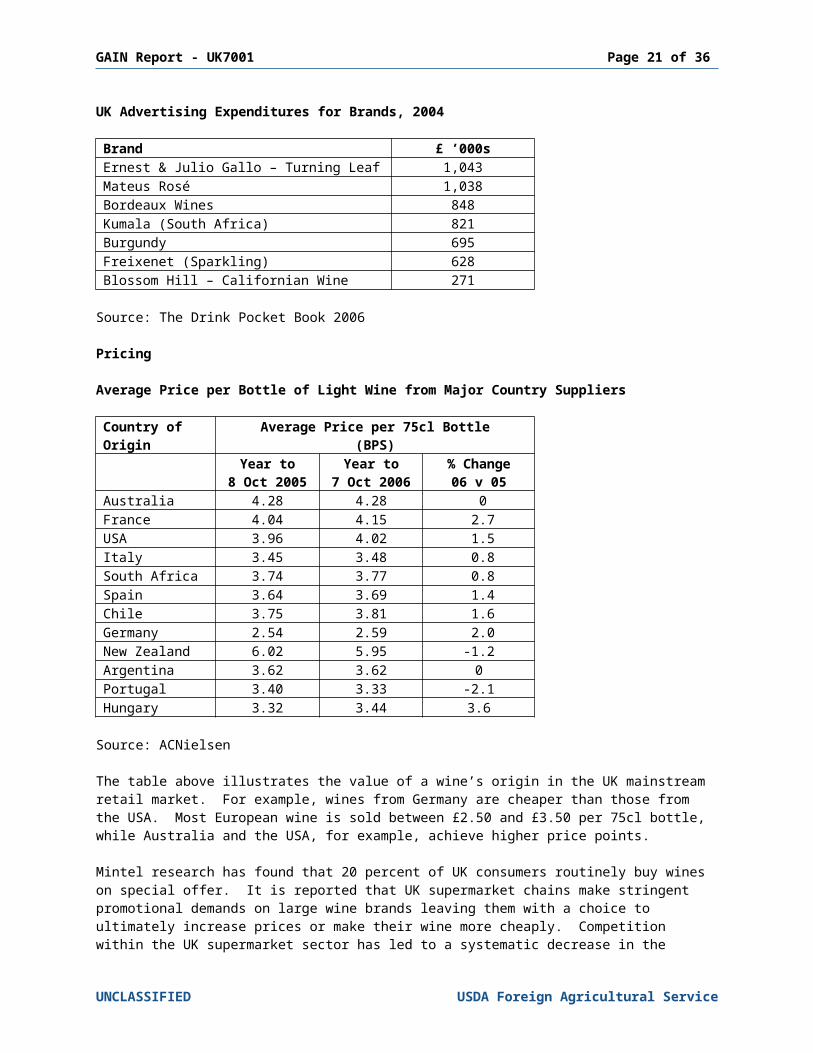
UK Advertising Expenditures for Brands, 2004
Brand £ ’000sErnest & Julio Gallo – Turning Leaf 1,043Mateus Rosé 1,038Bordeaux Wines 848Kumala (South Africa) 821Burgundy 695Freixenet (Sparkling) 628Blossom Hill – Californian Wine 271
Source: The Drink Pocket Book 2006
Pricing
Average Price per Bottle of Light Wine from Major Country Suppliers
Country of Origin
Average Price per 75cl Bottle(BPS)
Year to8 Oct 2005
Year to7 Oct 2006
% Change06 v 05
Australia 4.28 4.28 0France 4.04 4.15 2.7USA 3.96 4.02 1.5Italy 3.45 3.48 0.8South Africa 3.74 3.77 0.8Spain 3.64 3.69 1.4Chile 3.75 3.81 1.6Germany 2.54 2.59 2.0New Zealand 6.02 5.95 -1.2Argentina 3.62 3.62 0Portugal 3.40 3.33 -2.1Hungary 3.32 3.44 3.6
Source: ACNielsen
The table above illustrates the value of a wine’s origin in the UK mainstream retail market. For example, wines from Germany are cheaper than those from the USA. Most European wine is sold between £2.50 and £3.50 per 75cl bottle, while Australia and the USA, for example, achieve higher price points.
Mintel research has found that 20 percent of UK consumers routinely buy wines on special offer. It is reported that UK supermarket chains make stringent promotional demands on large wine brands leaving them with a choice to ultimately increase prices or make their wine more cheaply. Competition within the UK supermarket sector has led to a systematic decrease in the average price of a 75cl bottle of wine, despite consistent excise tax increases from the UK government. Smaller producers are finding it difficult to compete in this retail environment, which may lead to a decrease in choice of wine for the UK consumer over time.
In 2005/6, 87 percent of still wine purchased in the UK cost less than £5 (around $9.00) in the retail sector. As shown in the table below, there has been a decline in sales of very cheap
UNCLASSIFIED USDA Foreign Agricultural Service
GAIN Report - UK7001 Page 15 of 25
wine, together with a decline in sales of the most expensive wine. Price bands that have shown the most growth correlate to the pricing strategies of the major supermarket chains - ₤5.99 is an increasingly popular price point, and the growth exhibited in the ₤7.01 - ₤8.00 price bracket is mainly attributable to New Zealand Sauvignon Blanc. The overall trend shows an indication of growing consumer affluence and interest in wine.
Number of Bottles of Light Wine Sold in Key Price Ranges at Retail
Price Range 75cl Bottle
Number of Bottles Sold in each Price RangeYear to
8 Oct 2005% Year to
7 Oct 2006% % Change
06 v 05Up to ₤3 19,673,557 25% 17,627,178 22% -10.4₤3.01 - ₤4.00 31,251,950 40% 33,381,333 42% 6.8₤4.01 - ₤5.00 16,954,107 22% 17,340,841 22% 2.3₤5.01 - ₤6.00 5,847,202 8% 6,109,576 8% 12.0₤6.01 - ₤7.00 1,861,524 2% 2,085,128 3% 4.5₤7.01 - ₤8.00 930,975 1% 1,057,351 1% 13.6₤8.01 - ₤9.00 428,767 1% 443,242 1% 3.4₤9.01 - ₤10.00 344,197 0% 340,320 0% -1.1₤10.01 up 427,370 1% 360,477 0% -15.7TOTAL 77,719,651 100% 78,745,446 100% 1.3
Source: ACNielsen
Composition of UK Retail Price Points for Wine(import duty is not shown)
Component Retail Price £2.99 Retail Price £5.99
Cost of wine itself 9 pence £1.66Approximate cost of label, shipping, bottle, etc. 20 pence 20 penceRetailer profit – e.g. 33% 99 pence £1.98Value Added Tax 45 pence 89 penceExcise Duty £1.26 £1.26
Calculations correct as of July 2005 Source: Wine & Spirit Trade Association
UNCLASSIFIED USDA Foreign Agricultural Service
GAIN Report - UK7001 Page 16 of 25
Market Access
EU Regulations
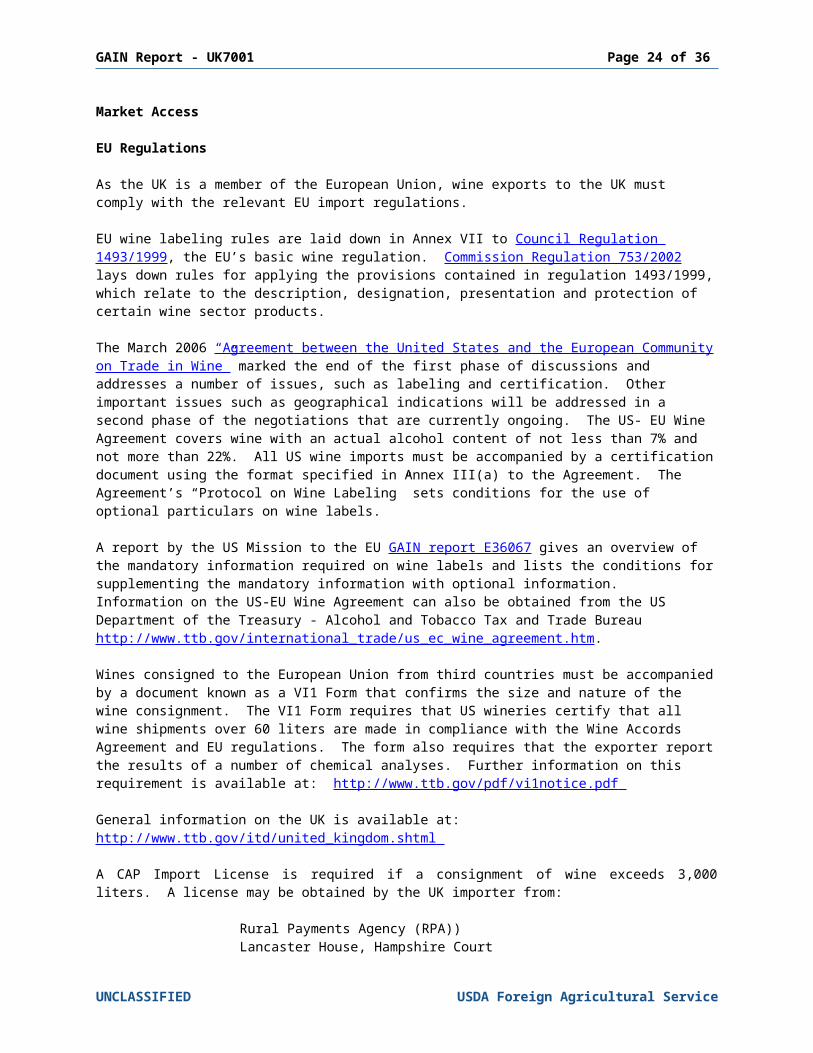
As the UK is a member of the European Union, wine exports to the UK must comply with the relevant EU import regulations.
EU wine labeling rules are laid down in Annex VII to Council Regulation 1493/1999, the EU’s basic wine regulation. Commission Regulation 753/2002 lays down rules for applying the provisions contained in regulation 1493/1999, which relate to the description, designation, presentation and protection of certain wine sector products.
The March 2006 “Agreement between the United States and the European Community on Trade in Wine” marked the end of the first phase of discussions and addresses a number of issues, such as labeling and certification. Other important issues such as geographical indications will be addressed in a second phase of the negotiations that are currently ongoing. The US- EU Wine Agreement covers wine with an actual alcohol content of not less than 7% and not more than 22%. All US wine imports must be accompanied by a certification document using the format specified in Annex III(a) to the Agreement. The Agreement’s “Protocol on Wine Labeling” sets conditions for the use of optional particulars on wine labels.
A report by the US Mission to the EU GAIN report E36067 gives an overview of the mandatory information required on wine labels and lists the conditions for supplementing the mandatory information with optional information. Information on the US-EU Wine Agreement can also be obtained from the US Department of the Treasury - Alcohol and Tobacco Tax and Trade Bureau http://www.ttb.gov/international_trade/us_ec_wine_agreement.htm.
Wines consigned to the European Union from third countries must be accompanied by a document known as a VI1 Form that confirms the size and nature of the wine consignment. The VI1 Form requires that US wineries certify that all wine shipments over 60 liters are made in compliance with the Wine Accords Agreement and EU regulations. The form also requires that the exporter report the results of a number of chemical analyses. Further information on this requirement is available at: http://www.ttb.gov/pdf/vi1notice.pdf
General information on the UK is available at: http://www.ttb.gov/itd/united_kingdom.shtml
A CAP Import License is required if a consignment of wine exceeds 3,000 liters. A license may be obtained by the UK importer from:
Rural Payments Agency (RPA))Lancaster House, Hampshire CourtNewcastle upon Tyne, NE4 7YETel: (+44) 191 226 5066/5207Fax: (+44) 191 226 5212Web: www.rpa.gov.uk
For subsequent travel through or within EU countries a Commercial Document or a Commercial Accompanying Document is also required. In addition to a transit document, a T-form will be issued when the wine enters the European Union and this will establish entitlement to EU rates of duty.
Alcoholic beverages containing sulphur dioxide and sulphites at concentrations of more than 10 mg/liter must be labeled “contains sulphites” or “contains sulphur dioxide”. Replacing the word “sulphites” by “SO2” or the E-number (E220) is not allowed. The list of authorized languages for allergen labeling can be consulted in GAIN report E36066.
UNCLASSIFIED USDA Foreign Agricultural Service
GAIN Report - UK7001 Page 17 of 25
Further information on EU import rules can be found on the US Mission to the EU’s website:http://www.useu.be/agri/wine.html
UK Regulations and Enforcement
The Department of Environment, Food and Rural Affairs (Defra) has policy responsibility for the UK and EU Wine Regulations. Contact information for the Defra Wine Unit can be found at: http://www.defra.gov.uk/foodrin/wine/contacts.htm
The most practical source of information regarding UK/EU requirements is the UK’s Wine Standards Branch (WSB) of the Food Standards Agency. The WSB enforces EU wine regulations in the UK.
The Wine Standards Branch website is a must-read resource on labeling and nomenclature rules. Here are links to the key web pages:
A Guide to the Law: http://www.wsb.org.uk/law.htm
Labeling advice: http://www.wsb.org.uk/law.htm#labelling
Please note the links within these links to useful .pdf files, for example, this link specifically on non-EU origin wine: http://www.wsb.org.uk/pdfs/EUThirdCountryWine.pdf
Wine Standards Branch (previously Board)Room 315B Food Standards AgencyAviation HouseLondon, WC2B 6NH Contact: John Boodle, Technical InspectorTel: +44 20 7276 8351 Fax:+44 20 7276 8024Email: [email protected]
Market access may be denied by Customs & Excise if documentation forms are incomplete. If the labeling is incorrect, then the wine will be allowed into bond but will not be released until the labels have been corrected. In either case, storage charges are large so it is vital that the correct documentation/labels are provided.
Examples of tariffs applied to non-European wine imports (import duties):
Sparkling Wine 32.0 Euros per hectoliterStill Wine not exceeding 13 percent abv 13.1 Euros per hectoliterStill Wine greater than 13%, less than 15% abv 15.4 Euros per hectoliterVermouth, Aromatized Wine 10.9 Euros per hectoliter
abv = alcohol by volumeSource: HM Customs & Excise Tariff Schedule
Please use the following website to determine the specific import duty for a wine product:http://europa.eu.int/comm/taxation_customs/dds/en/tarhome.htm
or contact the HM Customs & Excise Commodity Code Helpline Tel: 011 44 1702 366077plus Duty rate & VAT Helpline Tel: 011 44 845 010 9000In addition to tariff (import) duty, US wine is subject to excise duty and a Value Added Tax (VAT).
Class or Description Tax type Rate of Excise
UNCLASSIFIED USDA Foreign Agricultural Service
GAIN Report - UK7001 Page 18 of 25
code DutySparkling, exceeding 5.5%, but less than 8.5% 412 £166.70 per HLSparkling, 8.5% and above, but less than 15% 411 £220.54 per HLStill, exceeding 5.5%, but less than 15% 413 £172.17 per HLStill or Sparkling, exceeding 15%, but less than 22% 415 £229.55 per HLStill or Sparkling, exceeding 22% 419 £19.56 per liter of
alcohol in the wine
Source: HM Customs and Revenue, Web: www.hmrc.gov.uk Tel: +44 2920 501261E-mail: [email protected]
Value Added Tax (VAT) is applied ad valorem on the landed price (CIF) on arrival at the EU frontier plus all duties. The current rate of VAT is 17.5%.
Import duty is payable on samples used at trade fair tastings because of their promotional nature, public access and loss of control by HM Customs & Revenue.
Import duty is not payable in cases where organoleptic tasting by professionals takes place within companies for the purpose of quality control, provided that the wine is not consumed.
UNCLASSIFIED USDA Foreign Agricultural Service

GAIN Report - UK7001 Page 19 of 25
Statistical Note
The trend for large wine producers to ship in bulk (i.e. barrels) to Europe, and then bottle into 75cl bottles greatly affects the quality of trade data available. Please note that the 2005 UK Customs data contained within this report is adjusted to account for USA bulk shipments, but is not adjusted for the bulk shipments of other country suppliers.
Import/Export Tables
UK Imports of Still Wine by Volume, 2003-2005
United Kingdom - ImportsHS Codes: 220421 + 220429 STILL WINE
Quantity - HL ('000)Calendar Years
Rank 2005 Country 2003 2004 2005 % Change '05/'04
0 --World-- 11,340 12,442 12,230 -1.7
-EU 25- 6,053 6,160 6,259 1.6
2 France 2,511 2,371 1,760 -25.77 Germany 1,254 1,292 949 -26.54 Italy 1,038 1,290 1,507 16.95 Spain 919 909 1,076 18.49 Portugal 163 169 385 128.412 Netherlands 40 45 47 6.414 Hungary 79 41 35 -13.8
Third Countries 5,287 6,282 5,971 -5.0
1 Australia 2,059 2,526 2,566 1.63 United States 1,163 1,422 1,524 7.16 South Africa 950 993 985 -0.88 Chile 686 860 809 -5.910 Argentina 176 194 239 23.111 New Zealand 132 176 218 23.613 Bulgaria 82 64 44 -30.6
Source of data: H.M. Customs and Excise
UNCLASSIFIED USDA Foreign Agricultural Service

GAIN Report - UK7001 Page 20 of 25
UK Imports of Still Wine by Value, 2003-2005
United Kingdom - ImportsHS Codes: 220421 + 220429 STILL WINE
Millions of US DollarsCalendar Years
Rank 2005 Country 2003 2004 2005 % Change '05/04
--World-- 3002 3563 3580 0.5
-EU 25- 1558 1756 1871 6.5
2 France 797 838 708 -15.53 Italy 276 378 433 14.65 Spain 225 249 247 -0.68 Germany 135 168 176 4.5
10 Portugal 79 78 83 6.912 Netherlands 13 16 13 -15.613 Hungary 14 11 10 -12.415 Belgium 7 6 7 16.6
Third Countries 1444 1807 1709 -5.4
1 Australia 632 841 843 0.34 United States 279 338 329 -2.76 South Africa 229 250 230 -8.17 Chile 163 204 197 -3.39 New Zealand 77 107 132 23.711 Argentina 38 42 50 20.114 Bulgaria 11 9 7 -27.4
Source of data: H.M. Customs and Excise
UK Imports of Sparkling Wine by Volume, 2003-2005
United Kingdom - Imports
UNCLASSIFIED USDA Foreign Agricultural Service
GAIN Report - UK7001 Page 21 of 25
HS Code: 220410 SPARKLING WINEQuantity - HL ('000)Calendar Years
Rank 2005 Country 2003 2004 2005 % Change '05/'04 --World-- 657 691 736 6 -EU 25- 579 609 628 3 1 France 278 288 313 82 Spain 168 198 207 54 Italy 86 74 58 -225 Germany 21 43 47 9 Third Countries 78 82 108 32 3 Australia 50 52 68 306 United States 4 13 18 307 New Zealand 12 11 17 60
UK Imports of Sparkling Wine by Value, 2003-2005
United Kingdom - ImportsHS Code: 220410 SPARKLING WINE
Millions of US DollarsCalendar Years
Rank 2005 Country 2003 2004 2005 % Change '05/04
--World-- 526 658 700 4
-EU 25- 492 618 650 2
1 France 408 518 557 42 Spain 44 56 57 -93 Italy 29 25 23 -245 Germany 6 10 13 40
Third Countries 34 50 50 4
4 Australia 20 25 36 226 New Zealand 8 8 12 527 United States 2 6 8 35
Source of data: H.M. Customs and Excise
UK Imports of Flavored Wine & Vermouth by Volume, 2003-2005
United Kingdom - ImportsHS Code: 2205 FLAVORED WINE, VERMOUTH
UNCLASSIFIED USDA Foreign Agricultural Service

GAIN Report - UK7001 Page 22 of 25
Quantity - HL ('000)Calendar Years
Rank Country 2003 2004 2005 % Change '05/'04
--World-- 149 166 150 -10
-EU 25- 148 166 150 -9
1 France 62 75 74 -22 Italy 47 51 33 -353 Netherlands 25 24 22 -64 Germany 12 13 18 455 Spain 3 2 3 11
UK Imports of Flavored Wine & Vermouth by Value, 2003-2005
United Kingdom - ImportsHS Code: 2205 FLAVORED WINE, VERMOUTH
Millions of US DollarsCalendar Years
Rank Country 2003 2004 2005 % Change '05/'04
--World-- 26 24 22 -6
-EU 25- 26 24 21 -6
1 France 11 10 10 -22 Italy 8 8 6 -293 Netherlands 3 3 3 24 Germany 1 2 3 505 Spain 1 0 0 9
Source of data: H.M. Customs and Excise
UNCLASSIFIED USDA Foreign Agricultural Service

GAIN Report - UK7001 Page 23 of 25
UK Exports of Still Wine by Volume, 2003-2005
United Kingdom - ExportsHS Codes: 220421 + 220429 STILL WINE
Quantity - HL (000)Calendar Years
Country 2003 2004 2005 % Share 2005--World-- 237 233 252 100 -EU-25- 179 175 155 62 Third Countries 58 58 97 38United States 11 11 5 2
UK Exports of Still Wine by Value, 2003-2005
United Kingdom - ExportsHS Codes: 220421 + 220429 STILL WINE
Calendar YearsMillions of US Dollars
Country 2003 2004 2005 % Change 05/04--World-- 210 196 211 8 -EU-25- 84 91 103 13 Third Countries 126 105 108 3United States 64 40 33 -17.5
Source of Data: H.M. Customs and Excise
UNCLASSIFIED USDA Foreign Agricultural Service
GAIN Report - UK7001 Page 24 of 25
UK Exports of Sparkling Wine by Volume, 2003-2005
United Kingdom - ExportsHS Code: 220410 SPARKLING WINE
Quantity - HL Calendar Years
Country 2003 2004 2005 % Change '05/'04--World-- 13 13 24 -EU-25- 8 7 9 Third Countries 5 6 15United States 1 1 1 0
UK Exports of Sparkling Wine by Value, 2003-2005
United Kingdom - ExportsHS Code: 220410 SPARKLING
Calendar YearsMillions of US Dollars
Country 2003 2004 2005 % Change 05/04--World-- 20 17 22 -EU-25- 7 8 11 Third Countries 13 9 11United States 4 2 3
Source of Data: H.M. Customs and Excise
UNCLASSIFIED USDA Foreign Agricultural Service
GAIN Report - UK7001 Page 25 of 25
UK Exports of Flavored Wine & Vermouth by Volume, 2003-2005
United Kingdom - ExportsHS Code: 2205 FLAVORED WINE, VERMOUTH
Quantity - L (000)Calendar Years
Country 2003 2004 2005 % Share 2005--World-- 163 100 291 100 -EU-25- 92 41 125 43 Third Countries 71 59 166 47United States 0 0 0 0
UK Exports of Flavored Wine & Vermouth by Value, 2003-2005
United Kingdom - ExportsHS Code: 2205 FLAVORED WINE, VERMOUTH
Calendar YearsMillions of US Dollars
Country 2003 2004 2005 % Share 2005--World-- 1.4 0.8 1.1 100 -EU-25- 1.0 0.5 0.9 82 Third Countries 0.4 0.3 0.2 18United States 0.0 0.0 0.0 0
Source of Data: H.M. Customs and Excise
UNCLASSIFIED USDA Foreign Agricultural Service