apps.fas.usda.gov · Web viewAquaculture Production 5 Table 4: Aquaculture Production . 6...
28
Voluntary Report - public distribution Date: 4/20/2007 GAIN Report Number: BU7008 BU7008 Bulgaria Fishery Products Bulgarian Fish Imports Update 2007 Approved by: Susan Reid US Embassy Prepared by: Patrick Nord Report Highlights: Bulgaria's recent accession to the European Union will rpovide stimulus for further growth and expansion in the already growing market for fish and fishery products. Imports of fish and fishery products have increased overall over the past 5 years, with key factors being the decline in the local fish supply and a growing demand for varieties not found in domestic fishing grounds. Another major factor is Bulgaria's recent accession to the European Union, which changed the import tariff regime. Very low per capita fish consumption in Bulgaria, together with strongly growing demand, offer excellent opportunities for U.S. exporters to expand sales to this market. Includes PSD Changes: No Includes Trade Matrix: No Unscheduled Report Sofia [BU1] [BU] USDA Foreign Agricultural Service GAIN Report Global Agriculture Information Network Template Version 2.09
Transcript of apps.fas.usda.gov · Web viewAquaculture Production 5 Table 4: Aquaculture Production . 6...
Voluntary Report - public distributionDate: 4/20/2007
GAIN Report Number: BU7008BU7008BulgariaFishery ProductsBulgarian Fish Imports Update2007
Approved by:Susan ReidUS EmbassyPrepared by:Patrick Nord
Report Highlights:Bulgaria's recent accession to the European Union will rpovide stimulus for further growth and expansion in the already growing market for fish and fishery products. Imports of fish and fishery products have increased overall over the past 5 years, with key factors being the decline in the local fish supply and a growing demand for varieties not found in domestic fishing grounds. Another major factor is Bulgaria's recent accession to the European Union, which changed the import tariff regime. Very low per capita fish consumption in Bulgaria, together with strongly growing demand, offer excellent opportunities for U.S. exporters to expand sales to this market.
Includes PSD Changes: NoIncludes Trade Matrix: No
Unscheduled ReportSofia [BU1]
[BU]
USDA Foreign Agricultural Service
GAIN ReportGlobal Agriculture Information Network
Template Version 2.09
GAIN Report - BU7008 Page 2 of 23
Summary ………………………………………………………………………………………………………………………………… 3
Production…..............................................................................................................3Black Sea
Production………………………………………………………………………………………………………3Table 1: Black Sea Production…............................................................4
Freshwater Production……………………………………………………………………………………………………5
Table 2: Freshwater Production…………………..……………………………………………….5
Danube River Production…………………………………………………………………………………………………5
Table 3: Danube River Production……………..…………………………………………………5
Aquaculture Production……………………………………………………………………………………………………5
Table 4: Aquaculture Production………………………….………………………………………6
Consumption………………………………………………………………………………………………………………………………6
Table 5: Consumption………………………………………………………………………………………………
..7Trade……………………………………………………………………………………………………………………
………………………7Imports..
………………………………………………………………………………………………………………………….7Table 6: Value of Imports by Country…................................................8Table 7: Quantity of Imports by Country..............................................9
Table 8: Value of U.S. Imports by Species…........................................10Table 9: Comparison of Duties on Major U.S. Imports to Bulgaria…....11
Best Opportunities for U.S. Exports to Bulgaria…………………….…………………12
Challenges Facing U.S. Exports to Bulgaria………………………….…………………..12
Exports…………………………………………………………………………………………………………………………..12
Table 10: Quantity of Bulgarian Exports.....................………………………….13
Table 11: Value of Bulgarian Exports…………………………………………………………13
Marketing and Distribution……………………………………………………………………………………………………….13
AppendicesAppendix 1: Black Sea Production Numbers (metric tons)
…………………………………………15Appendix 2: Freshwater Fish Production Numbers (metric tons)…………………….
…………16
UNCLASSIFIED USDA Foreign Agricultural Service
GAIN Report - BU7008 Page 3 of 23
Appendix 3: Danube River Fish Production Numbers (metric tons)……………….………….17
Appendix 4: Bulgarian Exports (metric tons)………………………………………………………………18
Appendix 5: Bulgarian Exports (USD)………………………………………………………………………….19
Appendix 6: Bulgarian Fish Importers………………………………………………………………………….20
UNCLASSIFIED USDA Foreign Agricultural Service
GAIN Report - BU7008 Page 4 of 23
Summary
Over the past three years the fish and fish products market has continued the growth trend that started in 2000. Bulgaria has imported higher quantities (both in value and tons) of fish products since 2003. This growth and development is reflected by the increasing number of retailers and food service outlets offering a larger variety of fish and fish products (2003: 50-60 varieties; 2007: 70+). Increasing consumer income and awareness and greater availability of fish are the primary factors contributing to the expansion of the Bulgarian market. These factors and a generally more liberal trade regime with Bulgaria’s accession to the European Union are expected to contribute to further growth in the Bulgarian market.
Domestic supply of fish has declined since 2002, from 15,419 MT in 2002 to 5,434 MT in 2005. Fish farming is becoming a larger industry in Bulgaria with expansion into the market specifically targeted for exports (total number of fish farms: 2003: 127; 2005: 204). Value of aquaculture production is also significantly increasing-- mussel farms have more than quadrupled in number since 2003 (2003: 3; 2006: 15)
U.S. imports have decreased since 2003 in tonnage but increased in value (2003: 7,160 MT, 2006: 3,265 MT; 2003: USD 3,064,000, 2006: USD 4,069,000). A shift towards higher value/higher quality fish and fish products is occurring as consumers are becoming aware of the previously unavailable varieties. One of the major challenges facing U.S. imports is the lack of knowledge. Consumers are generally unaware of the differences in fish products and often do not know how to prepare fish other than trout, mackerel, carp and sprat.
Production
Prior to 1989, Bulgaria produced large quantities of seafood, and the majority of the products available were locally produced fish (mackerel, trout, carp and sprat) with very limited imports. After 1989 the industry went through a major restructuring as the fleets, fisheries and processing plants were privatized. In 2000, the industry started registering its first years of growth but since 2002 the total catch has declined each year. Measures have been implemented by the Ministry of Agriculture to increase the fish population and total catch numbers. A computerized system is being implemented by GOB to provide up to date and accurate figures on the quantity of fish caught and prices.
Black Sea Production
Pre-1989, Bulgaria’s sea fishing fleet was state owned and operated. Government regulations were such that the main fish that were available were those that could be caught by the national fleet, with exports being minimal. To meet domestic demand, the Bulgarian national fleet significantly over-fished the Black Sea, and the population of mackerel, turbot, sprat and anchovies was decimated. A second factor that has reduced supply is pollution levels in the Black Sea, often in the form of introduction of non-native species.
Privatization of the fishing fleet post-1989 initially caused a drop in the total catch from the Black Sea. Private companies became fully functional by 1999 and the total catch numbers rose, but since 2002 the total catch has significantly declined, especially of the most popular fish species — mackerel and turbot. Domestic mackerel supply is no longer large enough to meet domestic demand; in 2005, 5,356 MT of mackerel was imported from the United States.
Sprat — in 2005 sprat accounted for more than three quarters of the total catch, down from the nearly 90 percent in 2002 and 2003 but up from 50 percent in 2004. Sprat is not in high demand in Bulgaria or as an export; in 2005 average domestic price per kilogram was between .75 and .95 USD
UNCLASSIFIED USDA Foreign Agricultural Service
GAIN Report - BU7008 Page 5 of 23
(source: Bulgarian Ministry of Agriculture, Agency of Fisheries and Aquaculture).
Mackerel — mackerel is the most consumed fish in Bulgaria and is the fish with which consumers are most familiar. Recent increases in price of U.S. Atlantic mackerel have caused some Bulgarian importers (mainly those working in the lower end of the sector) to import from other third countries- mainly South American imports of lower quality Pacific mackerel.
Turbot — the Government of Bulgaria (GOB) imposed quotas to prevent over-fishing of this species in the Black Sea. A quota of 50 metric tons (MT) was set in 2003, but this quota was not meet (40.8 MT produced). In 2007 the GOB set the quota at 30 MT.
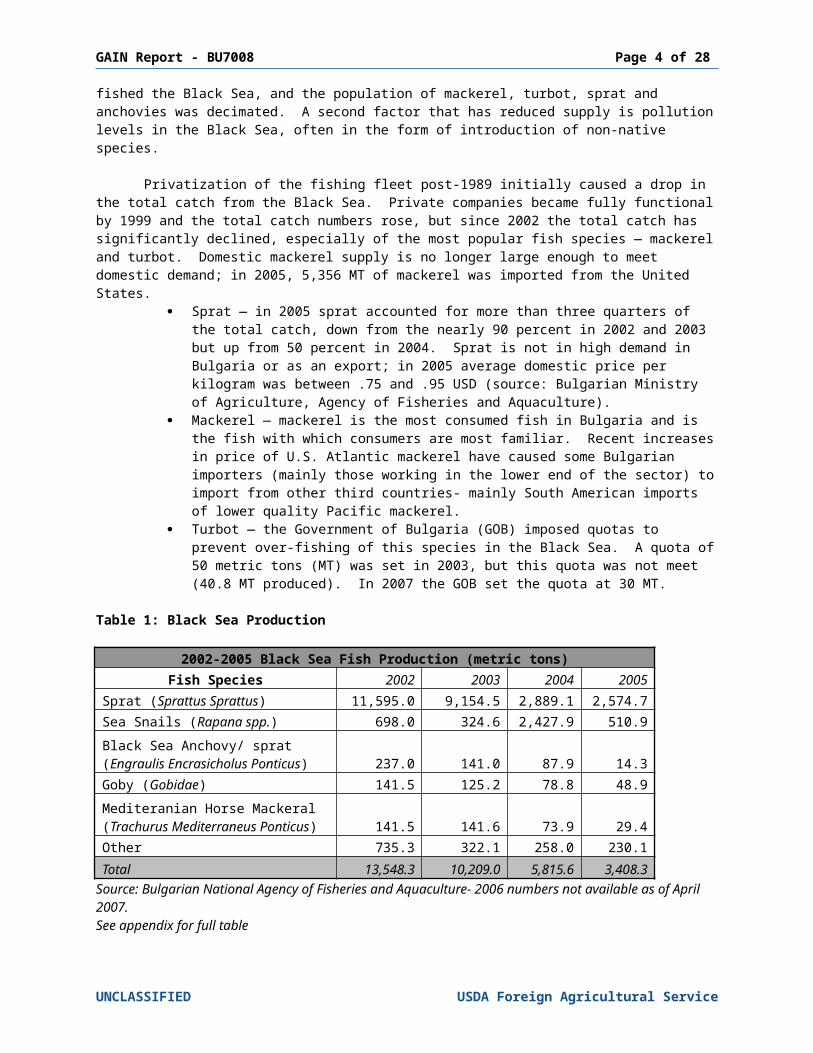
Table 1: Black Sea Production
2002-2005 Black Sea Fish Production (metric tons)Fish Species 2002 2003 2004 2005
Sprat (Sprattus Sprattus) 11,595.0 9,154.5 2,889.1 2,574.7Sea Snails (Rapana spp.) 698.0 324.6 2,427.9 510.9Black Sea Anchovy/ sprat (Engraulis Encrasicholus Ponticus) 237.0 141.0 87.9 14.3Goby (Gobidae) 141.5 125.2 78.8 48.9Mediteranian Horse Mackeral (Trachurus Mediterraneus Ponticus) 141.5 141.6 73.9 29.4Other 735.3 322.1 258.0 230.1Total 13,548.3 10,209.0 5,815.6 3,408.3
Source: Bulgarian National Agency of Fisheries and Aquaculture- 2006 numbers not available as of April 2007.See appendix for full table
Freshwater Production
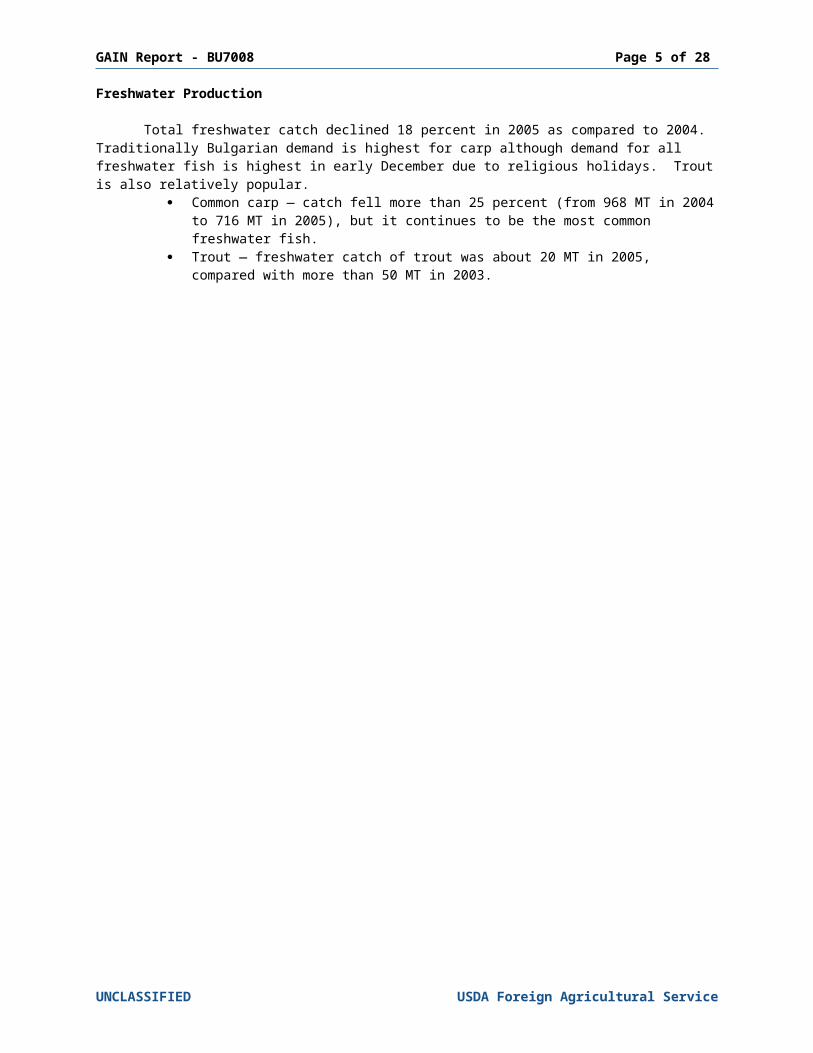
Total freshwater catch declined 18 percent in 2005 as compared to 2004. Traditionally Bulgarian demand is highest for carp although demand for all freshwater fish is highest in early December due to religious holidays. Trout is also relatively popular.
Common carp — catch fell more than 25 percent (from 968 MT in 2004 to 716 MT in 2005), but it continues to be the most common freshwater fish.
Trout — freshwater catch of trout was about 20 MT in 2005, compared with more than 50 MT in 2003.
UNCLASSIFIED USDA Foreign Agricultural Service
GAIN Report - BU7008 Page 6 of 23
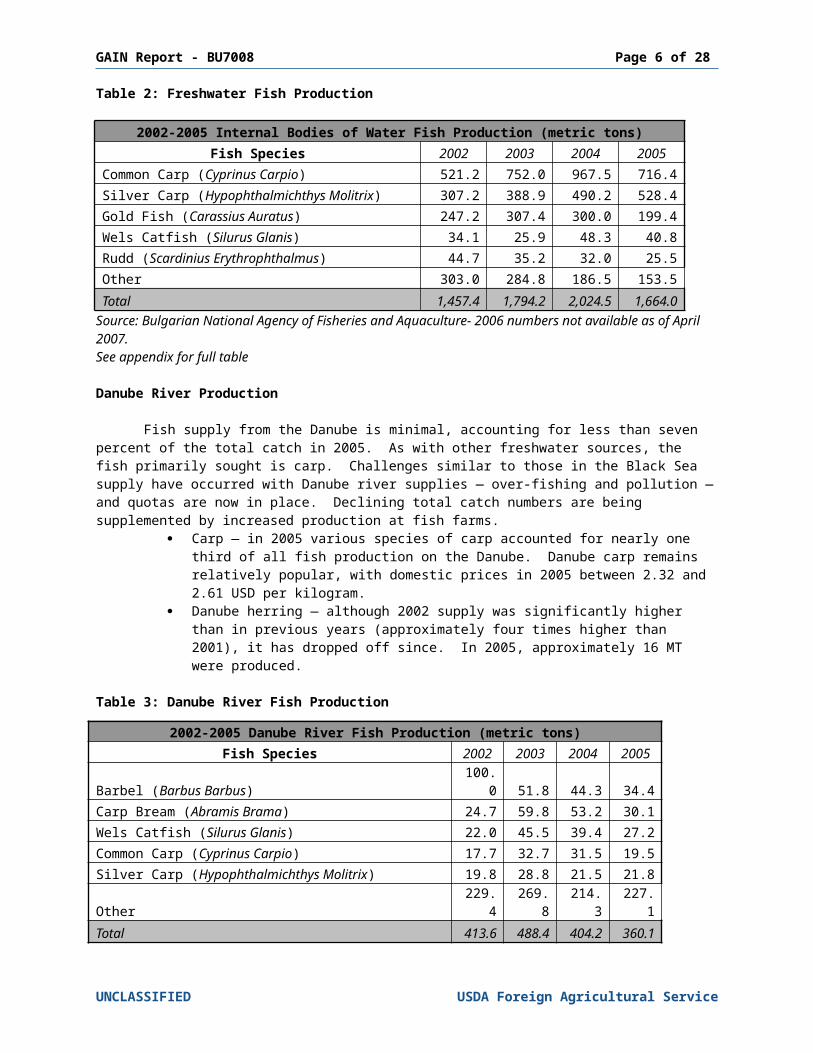
Table 2: Freshwater Fish Production
2002-2005 Internal Bodies of Water Fish Production (metric tons)Fish Species 2002 2003 2004 2005
Common Carp (Cyprinus Carpio) 521.2 752.0 967.5 716.4Silver Carp (Hypophthalmichthys Molitrix) 307.2 388.9 490.2 528.4Gold Fish (Carassius Auratus) 247.2 307.4 300.0 199.4Wels Catfish (Silurus Glanis) 34.1 25.9 48.3 40.8Rudd (Scardinius Erythrophthalmus) 44.7 35.2 32.0 25.5Other 303.0 284.8 186.5 153.5Total 1,457.4 1,794.2 2,024.5 1,664.0
Source: Bulgarian National Agency of Fisheries and Aquaculture- 2006 numbers not available as of April 2007.See appendix for full table
Danube River Production
Fish supply from the Danube is minimal, accounting for less than seven percent of the total catch in 2005. As with other freshwater sources, the fish primarily sought is carp. Challenges similar to those in the Black Sea supply have occurred with Danube river supplies — over-fishing and pollution — and quotas are now in place. Declining total catch numbers are being supplemented by increased production at fish farms.
Carp — in 2005 various species of carp accounted for nearly one third of all fish production on the Danube. Danube carp remains relatively popular, with domestic prices in 2005 between 2.32 and 2.61 USD per kilogram.
Danube herring — although 2002 supply was significantly higher than in previous years (approximately four times higher than 2001), it has dropped off since. In 2005, approximately 16 MT were produced.
Table 3: Danube River Fish Production
Source: Bulgarian National Agency of Fisheries and Aquaculture- 2006 numbers not available as of April 2007.See appendix for full table
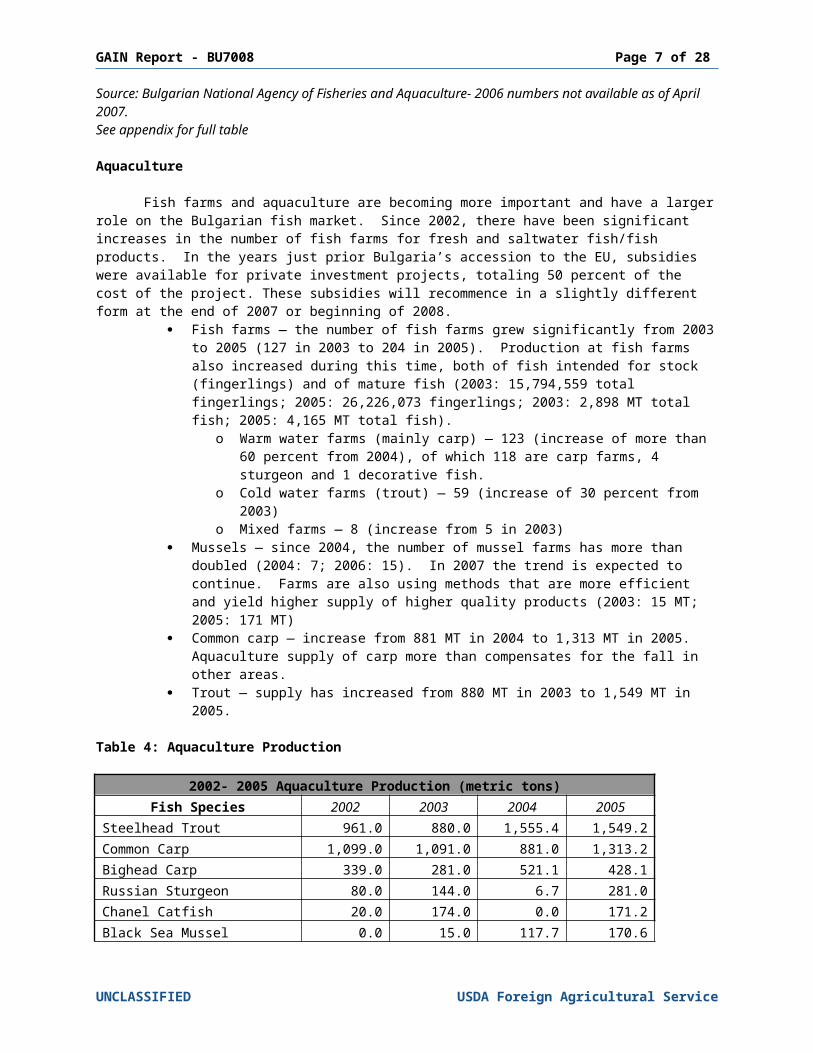
Aquaculture
Fish farms and aquaculture are becoming more important and have a larger role on the Bulgarian fish market. Since 2002, there have been significant increases in the number of fish farms for fresh and saltwater fish/fish products. In the years just prior Bulgaria’s accession to the EU, subsidies were available for private investment projects, totaling 50
UNCLASSIFIED USDA Foreign Agricultural Service
2002-2005 Danube River Fish Production (metric tons)Fish Species 2002 2003 2004 2005
Barbel (Barbus Barbus) 100.0 51.8 44.3 34.4Carp Bream (Abramis Brama) 24.7 59.8 53.2 30.1Wels Catfish (Silurus Glanis) 22.0 45.5 39.4 27.2Common Carp (Cyprinus Carpio) 17.7 32.7 31.5 19.5Silver Carp (Hypophthalmichthys Molitrix) 19.8 28.8 21.5 21.8Other 229.4 269.8 214.3 227.1Total 413.6 488.4 404.2 360.1
GAIN Report - BU7008 Page 7 of 23
percent of the cost of the project. These subsidies will recommence in a slightly different form at the end of 2007 or beginning of 2008.
Fish farms — the number of fish farms grew significantly from 2003 to 2005 (127 in 2003 to 204 in 2005). Production at fish farms also increased during this time, both of fish intended for stock (fingerlings) and of mature fish (2003: 15,794,559 total fingerlings; 2005: 26,226,073 fingerlings; 2003: 2,898 MT total fish; 2005: 4,165 MT total fish).
o Warm water farms (mainly carp) — 123 (increase of more than 60 percent from 2004), of which 118 are carp farms, 4 sturgeon and 1 decorative fish.
o Cold water farms (trout) — 59 (increase of 30 percent from 2003)o Mixed farms — 8 (increase from 5 in 2003)
Mussels — since 2004, the number of mussel farms has more than doubled (2004: 7; 2006: 15). In 2007 the trend is expected to continue. Farms are also using methods that are more efficient and yield higher supply of higher quality products (2003: 15 MT; 2005: 171 MT)
Common carp — increase from 881 MT in 2004 to 1,313 MT in 2005. Aquaculture supply of carp more than compensates for the fall in other areas.
Trout — supply has increased from 880 MT in 2003 to 1,549 MT in 2005.
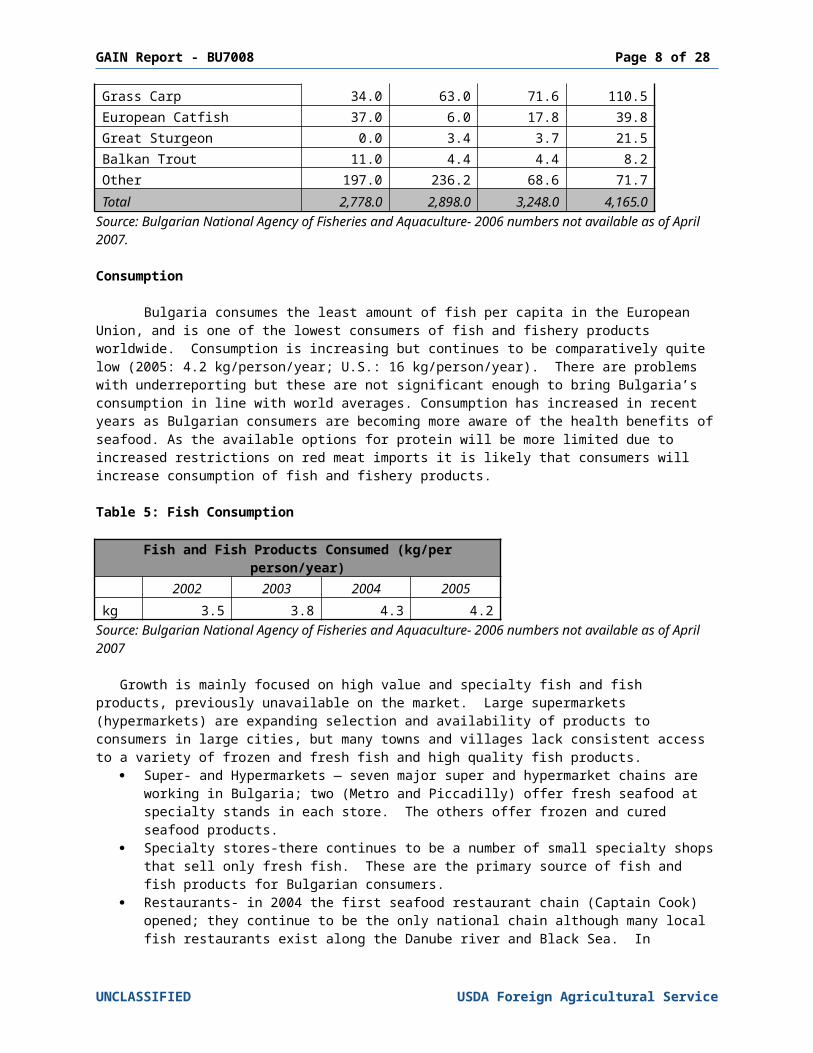
Table 4: Aquaculture Production
2002- 2005 Aquaculture Production (metric tons)Fish Species 2002 2003 2004 2005
Steelhead Trout 961.0 880.0 1,555.4 1,549.2Common Carp 1,099.0 1,091.0 881.0 1,313.2Bighead Carp 339.0 281.0 521.1 428.1Russian Sturgeon 80.0 144.0 6.7 281.0Chanel Catfish 20.0 174.0 0.0 171.2Black Sea Mussel 0.0 15.0 117.7 170.6Grass Carp 34.0 63.0 71.6 110.5European Catfish 37.0 6.0 17.8 39.8Great Sturgeon 0.0 3.4 3.7 21.5Balkan Trout 11.0 4.4 4.4 8.2Other 197.0 236.2 68.6 71.7Total 2,778.0 2,898.0 3,248.0 4,165.0
Source: Bulgarian National Agency of Fisheries and Aquaculture- 2006 numbers not available as of April 2007.
Consumption
Bulgaria consumes the least amount of fish per capita in the European Union, and is one of the lowest consumers of fish and fishery products worldwide. Consumption is increasing but continues to be comparatively quite low (2005: 4.2 kg/person/year; U.S.: 16 kg/person/year). There are problems with underreporting but these are not significant enough to bring Bulgaria’s consumption in line with world averages. Consumption has increased in recent years as Bulgarian consumers are becoming more aware of the health benefits of seafood. As the available options for protein will be more limited due to increased restrictions on red meat imports it is likely that consumers will increase consumption of fish and fishery products.
UNCLASSIFIED USDA Foreign Agricultural Service
GAIN Report - BU7008 Page 8 of 23
Table 5: Fish Consumption
Fish and Fish Products Consumed (kg/per person/year)
2002 2003 2004 2005kg 3.5 3.8 4.3 4.2
Source: Bulgarian National Agency of Fisheries and Aquaculture- 2006 numbers not available as of April 2007
Growth is mainly focused on high value and specialty fish and fish products, previously unavailable on the market. Large supermarkets (hypermarkets) are expanding selection and availability of products to consumers in large cities, but many towns and villages lack consistent access to a variety of frozen and fresh fish and high quality fish products.
Super- and Hypermarkets — seven major super and hypermarket chains are working in Bulgaria; two (Metro and Piccadilly) offer fresh seafood at specialty stands in each store. The others offer frozen and cured seafood products.
Specialty stores-there continues to be a number of small specialty shops that sell only fresh fish. These are the primary source of fish and fish products for Bulgarian consumers.
Restaurants- in 2004 the first seafood restaurant chain (Captain Cook) opened; they continue to be the only national chain although many local fish restaurants exist along the Danube river and Black Sea. In February 2007, 50,000+ people ate at Captain Cook’s largest restaurant. Other restaurants offer a limited selection of fish, often tied to holidays or religious observances.
o Octopus, calamari, sea bream and mussels are in highest demand at specialty restaurants
o The market for lobster and crab at specialty restaurants is increasingo Sushi is beginning to enter the Bulgarian market, but restaurants generally
offer limited selection and are only in large cities. The U.S. Embassy cafeteria serves sushi one day per week.
Trade
Bulgaria is a net importer of fish and fishery products. The majority of all fish and fishery products are frozen (80+ percent) with 70+ percent of these being mackerel. The United States, Canada and the European Union were major suppliers of fish and fishery products in 2005, with the same trend expected to continue. Primary exports from Bulgaria are sea snails and processed fish products (conserves, caviar etc). Bulgaria exported primarily to Romania, Japan and the European Union.
Imports
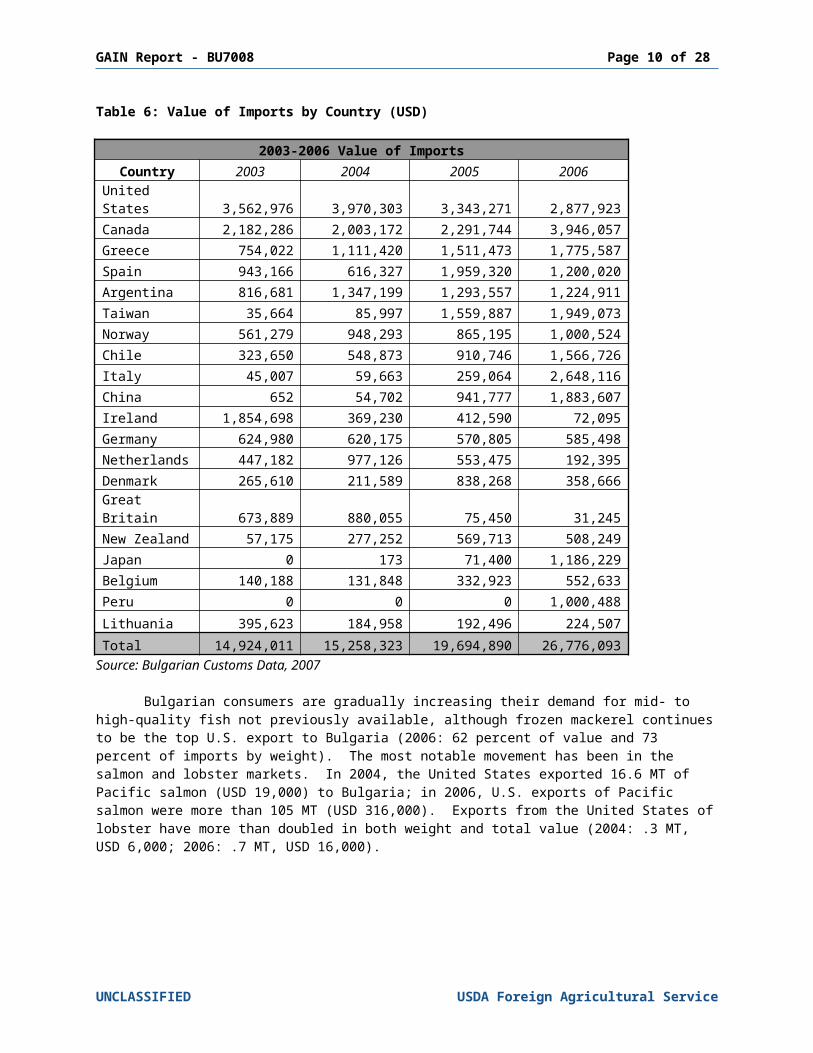
The total size of the import market is estimated at 27,000 MT for 2006 and it is expected to trend upward in 2007. Total value of imports in 2006 is estimated at nearly USD 27 million; due to increasing prices of fish and fishery products, increased imports of high value fish products and increase in total fish imports, Post projects this figure to increase by at least 10 percent in 2007. U.S. share of imports declined from 37 percent in 2004 to 14 percent in 2006. The value of U.S. imports tripled from 2004-2005 but declined by about a third from 2005-2006 (USD 2,678,000; 2005: USD 6,332,000; 2006: USD 4,070,000).
UNCLASSIFIED USDA Foreign Agricultural Service
GAIN Report - BU7008 Page 9 of 23
Table 6: Value of Imports by Country (USD)
2003-2006 Value of ImportsCountry 2003 2004 2005 2006
United States 3,562,976 3,970,303 3,343,271 2,877,923Canada 2,182,286 2,003,172 2,291,744 3,946,057Greece 754,022 1,111,420 1,511,473 1,775,587Spain 943,166 616,327 1,959,320 1,200,020Argentina 816,681 1,347,199 1,293,557 1,224,911Taiwan 35,664 85,997 1,559,887 1,949,073Norway 561,279 948,293 865,195 1,000,524Chile 323,650 548,873 910,746 1,566,726Italy 45,007 59,663 259,064 2,648,116China 652 54,702 941,777 1,883,607Ireland 1,854,698 369,230 412,590 72,095Germany 624,980 620,175 570,805 585,498Netherlands 447,182 977,126 553,475 192,395Denmark 265,610 211,589 838,268 358,666Great Britain 673,889 880,055 75,450 31,245New Zealand 57,175 277,252 569,713 508,249Japan 0 173 71,400 1,186,229Belgium 140,188 131,848 332,923 552,633Peru 0 0 0 1,000,488Lithuania 395,623 184,958 192,496 224,507Total 14,924,011 15,258,323 19,694,890 26,776,093
Source: Bulgarian Customs Data, 2007
Bulgarian consumers are gradually increasing their demand for mid- to high-quality fish not previously available, although frozen mackerel continues to be the top U.S. export to Bulgaria (2006: 62 percent of value and 73 percent of imports by weight). The most notable movement has been in the salmon and lobster markets. In 2004, the United States exported 16.6 MT of Pacific salmon (USD 19,000) to Bulgaria; in 2006, U.S. exports of Pacific salmon were more than 105 MT (USD 316,000). Exports from the United States of lobster have more than doubled in both weight and total value (2004: .3 MT, USD 6,000; 2006: .7 MT, USD 16,000).
UNCLASSIFIED USDA Foreign Agricultural Service
GAIN Report - BU7008 Page 10 of 23
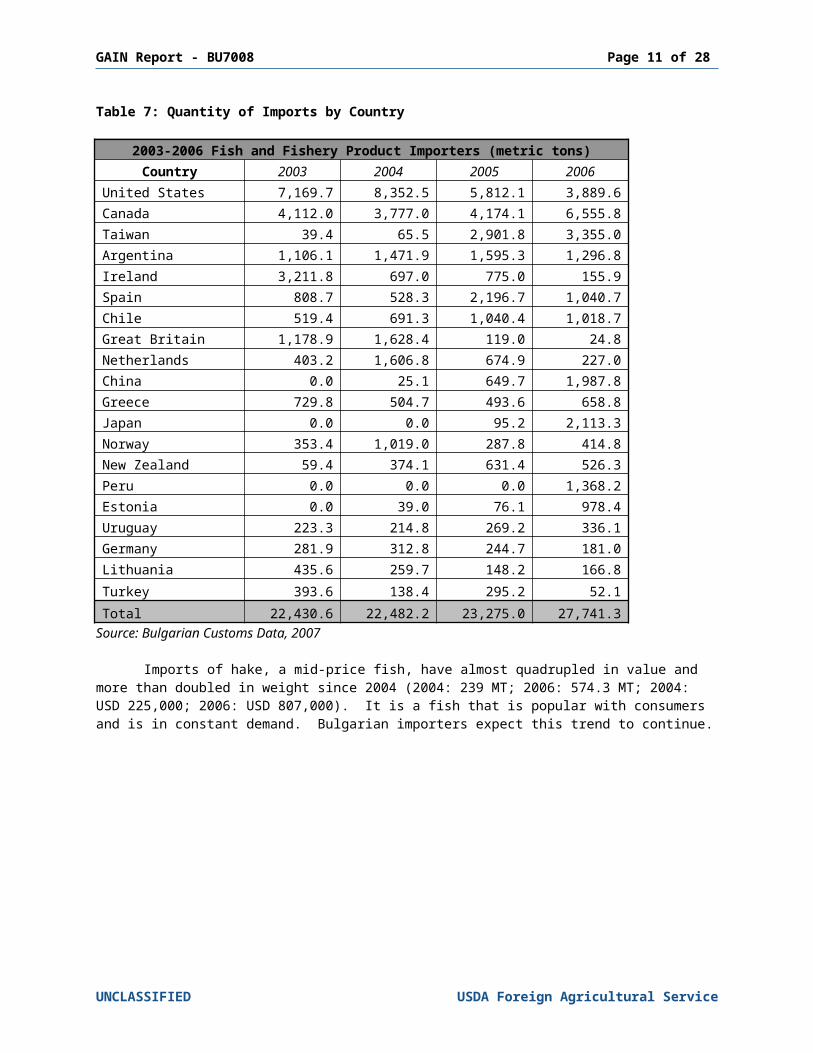
Table 7: Quantity of Imports by Country
2003-2006 Fish and Fishery Product Importers (metric tons)Country 2003 2004 2005 2006
United States 7,169.7 8,352.5 5,812.1 3,889.6Canada 4,112.0 3,777.0 4,174.1 6,555.8Taiwan 39.4 65.5 2,901.8 3,355.0Argentina 1,106.1 1,471.9 1,595.3 1,296.8Ireland 3,211.8 697.0 775.0 155.9Spain 808.7 528.3 2,196.7 1,040.7Chile 519.4 691.3 1,040.4 1,018.7Great Britain 1,178.9 1,628.4 119.0 24.8Netherlands 403.2 1,606.8 674.9 227.0China 0.0 25.1 649.7 1,987.8Greece 729.8 504.7 493.6 658.8Japan 0.0 0.0 95.2 2,113.3Norway 353.4 1,019.0 287.8 414.8New Zealand 59.4 374.1 631.4 526.3Peru 0.0 0.0 0.0 1,368.2Estonia 0.0 39.0 76.1 978.4Uruguay 223.3 214.8 269.2 336.1Germany 281.9 312.8 244.7 181.0Lithuania 435.6 259.7 148.2 166.8Turkey 393.6 138.4 295.2 52.1Total 22,430.6 22,482.2 23,275.0 27,741.3
Source: Bulgarian Customs Data, 2007
Imports of hake, a mid-price fish, have almost quadrupled in value and more than doubled in weight since 2004 (2004: 239 MT; 2006: 574.3 MT; 2004: USD 225,000; 2006: USD 807,000). It is a fish that is popular with consumers and is in constant demand. Bulgarian importers expect this trend to continue.
UNCLASSIFIED USDA Foreign Agricultural Service
GAIN Report - BU7008 Page 11 of 23
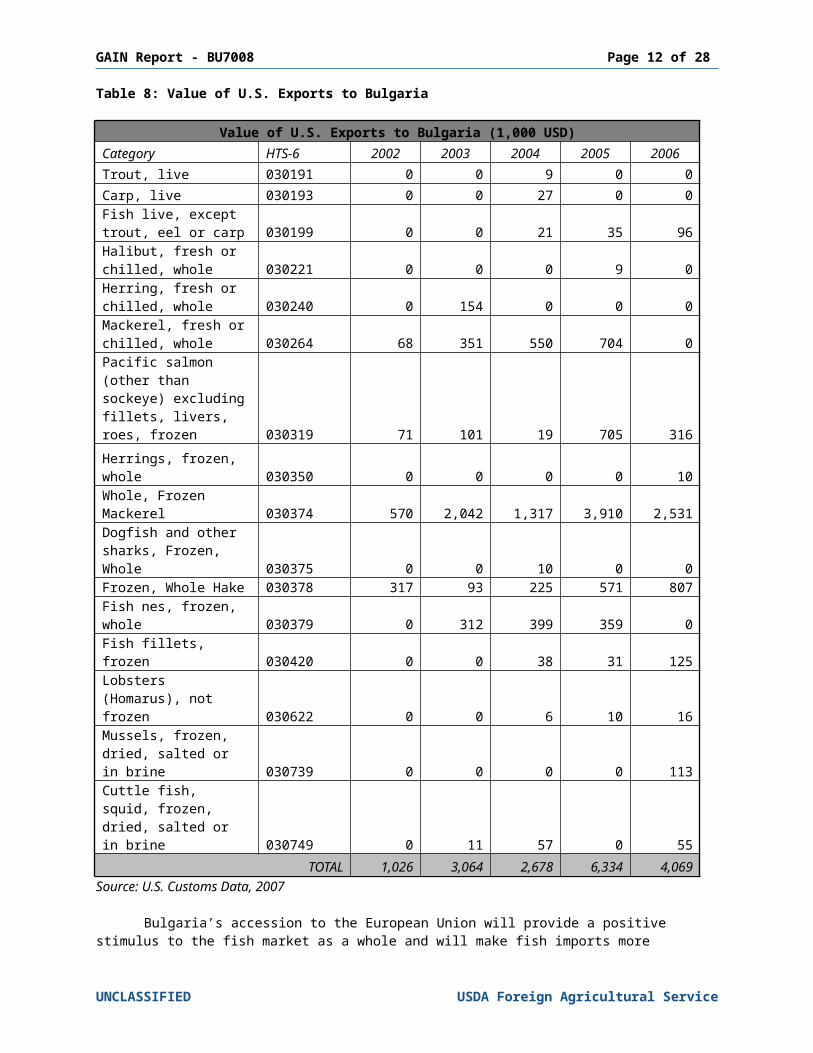
Table 8: Value of U.S. Exports to Bulgaria
Value of U.S. Exports to Bulgaria (1,000 USD)Category HTS-6 2002 2003 2004 2005 2006Trout, live 030191 0 0 9 0 0Carp, live 030193 0 0 27 0 0Fish live, except trout, eel or carp 030199 0 0 21 35 96Halibut, fresh or chilled, whole 030221 0 0 0 9 0Herring, fresh or chilled, whole 030240 0 154 0 0 0Mackerel, fresh or chilled, whole 030264 68 351 550 704 0Pacific salmon (other than sockeye) excluding fillets, livers, roes, frozen 030319 71 101 19 705 316Herrings, frozen, whole 030350 0 0 0 0 10Whole, Frozen Mackerel 030374 570 2,042 1,317 3,910 2,531Dogfish and other sharks, Frozen, Whole 030375 0 0 10 0 0Frozen, Whole Hake 030378 317 93 225 571 807Fish nes, frozen, whole 030379 0 312 399 359 0Fish fillets, frozen 030420 0 0 38 31 125Lobsters (Homarus), not frozen 030622 0 0 6 10 16Mussels, frozen, dried, salted or in brine 030739 0 0 0 0 113Cuttle fish, squid, frozen, dried, salted or in brine 030749 0 11 57 0 55
TOTAL 1,026 3,064 2,678 6,334 4,069Source: U.S. Customs Data, 2007
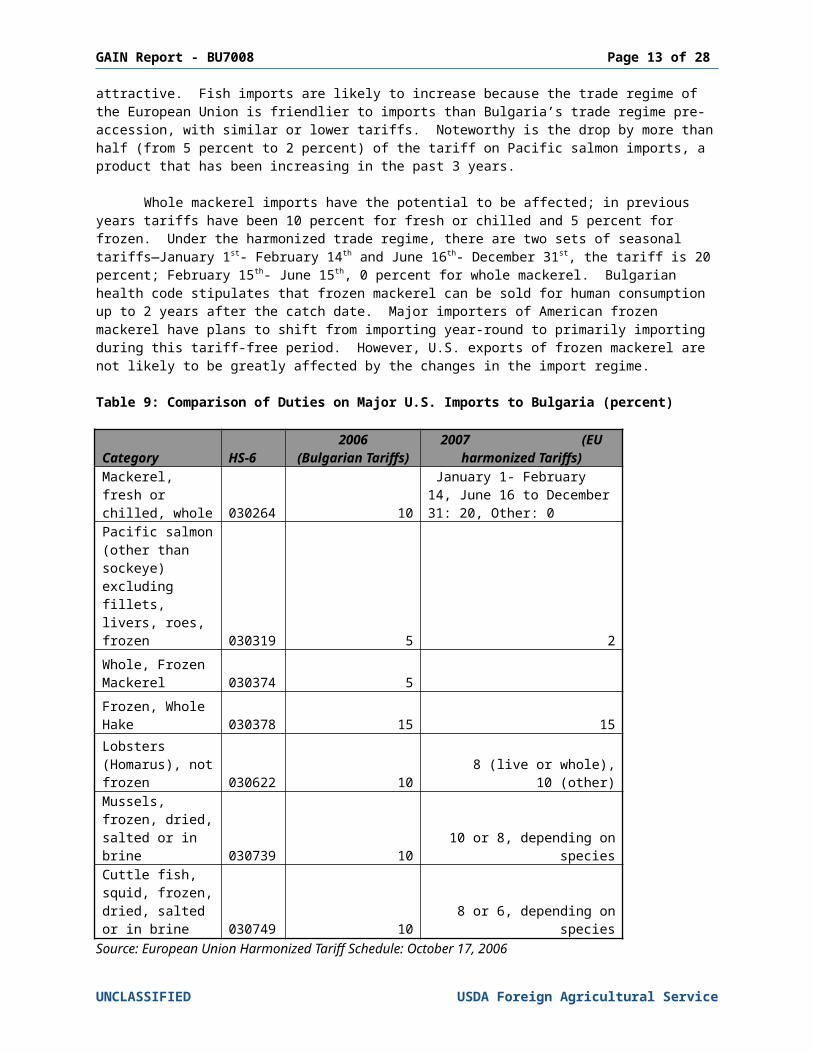
Bulgaria’s accession to the European Union will provide a positive stimulus to the fish market as a whole and will make fish imports more attractive. Fish imports are likely to increase because the trade regime of the European Union is friendlier to imports than Bulgaria’s trade regime pre-accession, with similar or lower tariffs. Noteworthy is the drop by more than half (from 5 percent to 2 percent) of the tariff on Pacific salmon imports, a product that has been increasing in the past 3 years.
Whole mackerel imports have the potential to be affected; in previous years tariffs have been 10 percent for fresh or chilled and 5 percent for frozen. Under the harmonized trade regime, there are two sets of seasonal tariffs—January 1st- February 14th and June 16th- December 31st, the tariff is 20 percent; February 15th- June 15th, 0 percent for whole mackerel. Bulgarian health code stipulates that frozen mackerel can be sold for human consumption up
UNCLASSIFIED USDA Foreign Agricultural Service
GAIN Report - BU7008 Page 12 of 23
to 2 years after the catch date. Major importers of American frozen mackerel have plans to shift from importing year-round to primarily importing during this tariff-free period. However, U.S. exports of frozen mackerel are not likely to be greatly affected by the changes in the import regime.
Table 9: Comparison of Duties on Major U.S. Imports to Bulgaria (percent)
Category HS-6
2006 (Bulgarian
Tariffs)2007
(EU harmonized Tariffs)
Mackerel, fresh or chilled, whole
030264 10
January 1- February 14, June 16 to December 31: 20, Other: 0
Pacific salmon (other than sockeye) excluding fillets, livers, roes, frozen
030319 5 2
Whole, Frozen Mackerel
030374 5
Frozen, Whole Hake
030378 15 15
Lobsters (Homarus), not frozen
030622 10
8 (live or whole), 10 (other)
Mussels, frozen, dried, salted or in brine
030739 10
10 or 8, depending on species
Cuttle fish, squid, frozen, dried, salted or in brine
030749 10
8 or 6, depending on species
Source: European Union Harmonized Tariff Schedule: October 17, 2006
For full duty listings, visit:http://eur-lex.europa.eu/LexUriServ/site/en/oj/2006/l_301/l_30120061031en00010880.pdf
Bulgaria is currently facing challenges transitioning to EU requirements. U.S. shipments have been delayed at ports of entry due to unclear understanding by the GOB and Bulgarian border control/veterinary service as to the exact nature of the EU requirements. Post has worked and will continue to work with these agencies and importers to ensure access for U.S. exports to the Bulgarian market. Currently, U.S. imports do not fall into the “third country” category of the EU; the U.S. and EU are discussing policies that will apply solely to U.S. imports, but these currently are not in place. For more information regarding how to import fish and fishery products into the European Union, visit http://www.buyusa.gov/europeanunion/summary_four_six.html or contact FAS/Sofia.
Best opportunities for U.S. Exports to Bulgaria
UNCLASSIFIED USDA Foreign Agricultural Service
GAIN Report - BU7008 Page 13 of 23
Bulgarian companies are actively seeking to expand the selection of fish available on the Bulgarian market, especially mid- to high-value products. Imports of U.S. Atlantic mackerel are likely to continue to decline, due to the availability of lower priced, although lower quality products from other countries (mainly South American countries). Food service outlets are providing a major impetus for this shift, with an increasing number offering high quality fish as a regular menu item. Good opportunities exist for U.S. exports of lobster and salmon, as both currently face lower customs duties than in 2006 and increased consumer awareness. Other opportunities exist for U.S. exports to Bulgaria to be repackaged and sold as value added goods throughout the European Union. A detailed list of importers is attached to this report.
Challenges Facing U.S. Exports to Bulgaria
In the short term (6 to 12 months), Bulgaria will face challenges applying new EU regulations. Many of the regulations and certification requirements are either partially or not at all translated into Bulgarian, which increases the likelihood of confusion on the part of border controllers. FAS/Sofia is working with Bulgarian border control, veterinary services and major importers to help clarify and explain the issues connected to imports of fish and fish products.
A structural challenge exists in the limited knowledge of fish and fishery products on the part of Bulgarian consumers. Individual incomes are rising, and consumers are beginning to have more disposable income for high quality products. Consumers, however, are often not familiar with many of the high-value fish varieties. This unfamiliarity prompts many super- and hypermarkets to be reluctant in stocking these varieties. Restaurants are much more likely to test new products, but the small quantities they demand creates a challenge for U.S. exporters.
Bulgarian Exports
Bulgarian exports, in tonnage, are primarily shipped to other countries in the region (Romania, Greece and Turkey) although relatively large quantities are also exported to Japan and Germany. Total exports have fallen since 2003 by more than 20 percent (2003: 5,773 MT; 2006: 4,413 MT) but total value of exports has significantly risen as exports of higher value products, such as sea snails and roe have grown.
For example, although Romania imported 100+ MT more of fish and fishery products than Japan in 2006 (Romania: 677 MT; Japan 545 MT) the value of the imports to Japan were more than triple the value of Romania’s imports (Romania: USD 834,907; Japan: USD 2,671,935). Companies that have traditionally imported and sold fish and fishery products with little additional processing have begun to repackage products in efforts to sell products that have added value.
UNCLASSIFIED USDA Foreign Agricultural Service
GAIN Report - BU7008 Page 14 of 23
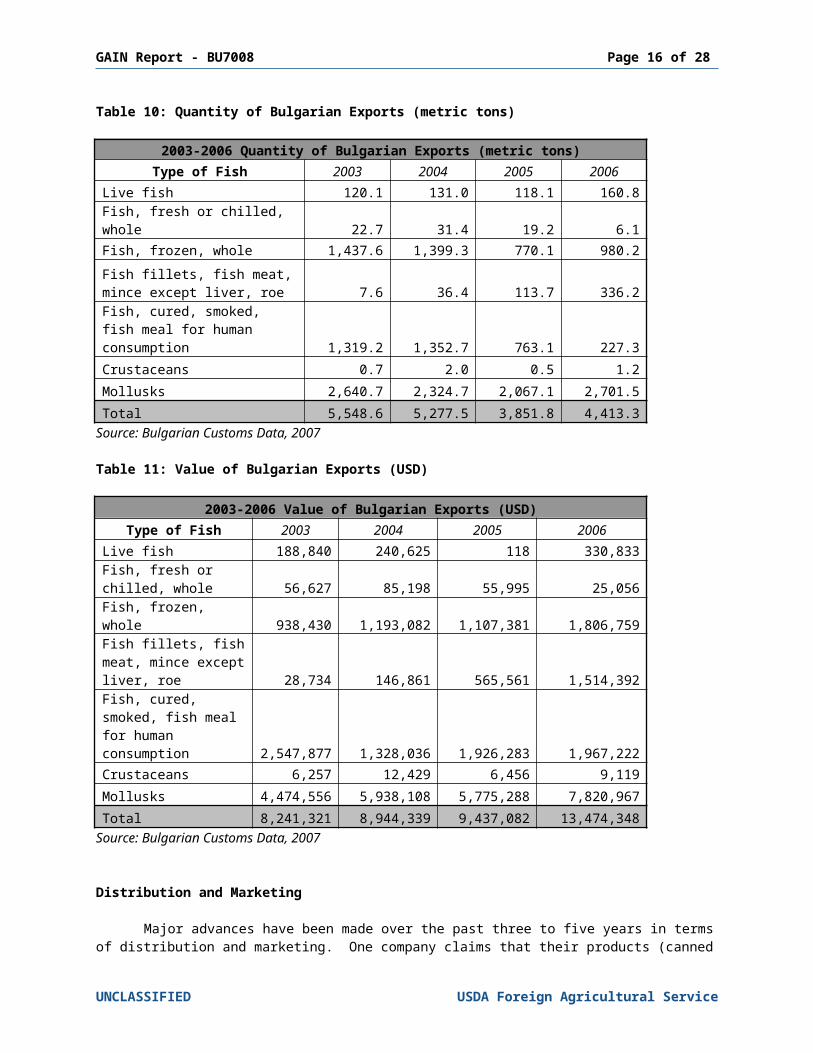
Table 10: Quantity of Bulgarian Exports (metric tons)
2003-2006 Quantity of Bulgarian Exports (metric tons)Type of Fish 2003 2004 2005 2006
Live fish 120.1 131.0 118.1 160.8Fish, fresh or chilled, whole 22.7 31.4 19.2 6.1Fish, frozen, whole 1,437.6 1,399.3 770.1 980.2Fish fillets, fish meat, mince except liver, roe 7.6 36.4 113.7 336.2Fish, cured, smoked, fish meal for human consumption 1,319.2 1,352.7 763.1 227.3Crustaceans 0.7 2.0 0.5 1.2Mollusks 2,640.7 2,324.7 2,067.1 2,701.5Total 5,548.6 5,277.5 3,851.8 4,413.3
Source: Bulgarian Customs Data, 2007
Table 11: Value of Bulgarian Exports (USD)
2003-2006 Value of Bulgarian Exports (USD)Type of Fish 2003 2004 2005 2006
Live fish 188,840 240,625 118 330,833Fish, fresh or chilled, whole 56,627 85,198 55,995 25,056Fish, frozen, whole 938,430 1,193,082 1,107,381 1,806,759Fish fillets, fish meat, mince except liver, roe 28,734 146,861 565,561 1,514,392Fish, cured, smoked, fish meal for human consumption 2,547,877 1,328,036 1,926,283 1,967,222Crustaceans 6,257 12,429 6,456 9,119Mollusks 4,474,556 5,938,108 5,775,288 7,820,967Total 8,241,321 8,944,339 9,437,082 13,474,348
Source: Bulgarian Customs Data, 2007
Distribution and Marketing
Major advances have been made over the past three to five years in terms of distribution and marketing. One company claims that their products (canned fish products) are in 90+ percent of retail outlets in Bulgaria. Companies working with fresh and frozen fish products have developed individual distribution networks, with warehouses and refrigerated trucks for delivery around the country. This allows for fresh and frozen fish products to be delivered to a much wider market than was possible even a few years ago.
Marketing is still not well developed for fish and fish products; the major fish restaurant chain does not heavily advertise nor do restaurants do fish promotions. At the Hilton Hotel in Sofia, there is a weekly seafood night which is generally well attended. In
UNCLASSIFIED USDA Foreign Agricultural Service
GAIN Report - BU7008 Page 15 of 23
2006 the restaurant hosted a weekend promotion focusing on oysters; it was quite popular and the restaurant hosted a similar promotion in February, 2007. Supermarkets and restaurants continue to rely mainly on word of mouth and general consumer trends, which accounts for the relatively slow growth in the market.
FAS/Sofia worked with a local supermarket chain to generally promote American food products in late March, 2007. Part of the promotion was of American fish and fishery products, and included a demonstration of salmon cooking. Similar promotions in the future will increase public familiarity and would likely increase demand for fish.
UNCLASSIFIED USDA Foreign Agricultural Service
GAIN Report - BU7008 Page 16 of 23
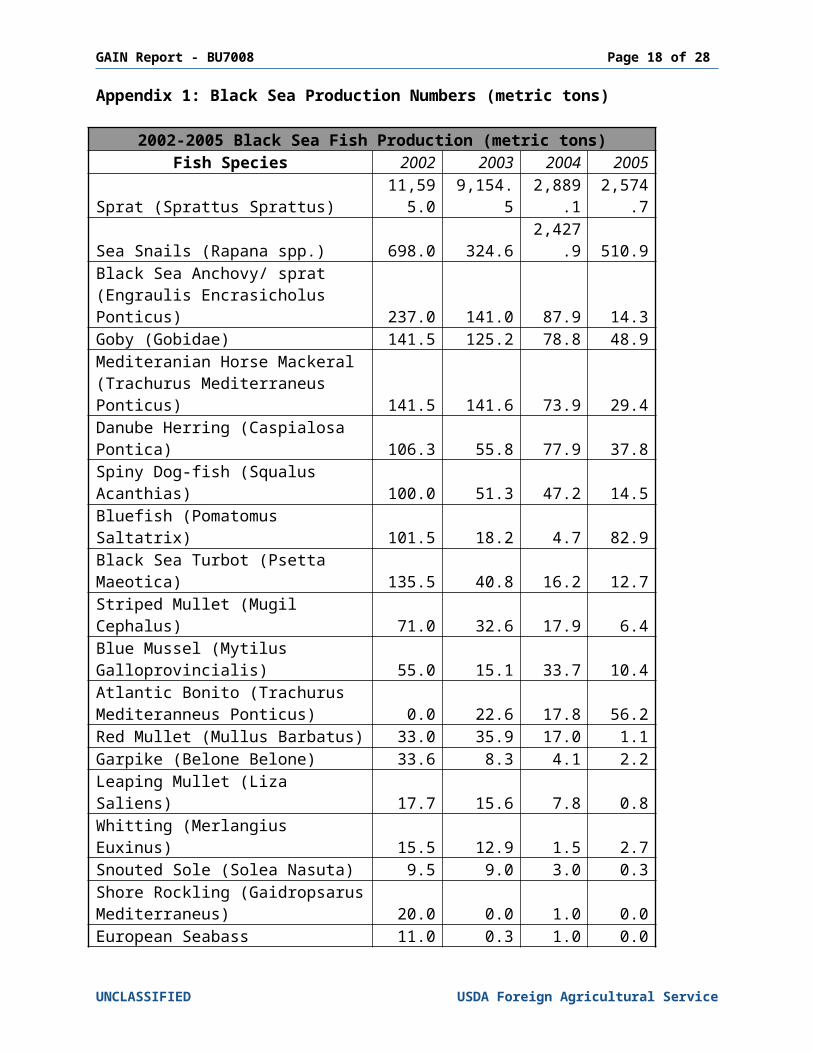
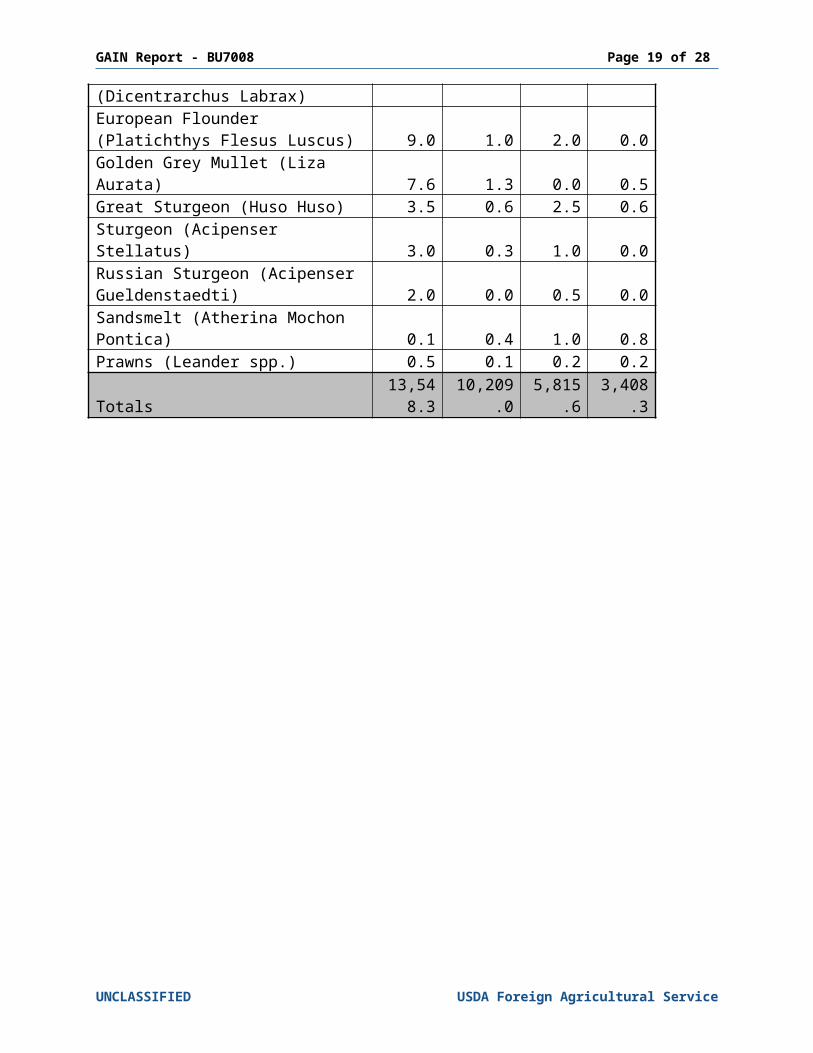
Appendix 1: Black Sea Production Numbers (metric tons)
2002-2005 Black Sea Fish Production (metric tons)Fish Species 2002 2003 2004 2005
Sprat (Sprattus Sprattus) 11,595.0 9,154.5 2,889.1 2,574.7Sea Snails (Rapana spp.) 698.0 324.6 2,427.9 510.9Black Sea Anchovy/ sprat (Engraulis Encrasicholus Ponticus) 237.0 141.0 87.9 14.3Goby (Gobidae) 141.5 125.2 78.8 48.9Mediteranian Horse Mackeral (Trachurus Mediterraneus Ponticus) 141.5 141.6 73.9 29.4Danube Herring (Caspialosa Pontica) 106.3 55.8 77.9 37.8Spiny Dog-fish (Squalus Acanthias) 100.0 51.3 47.2 14.5Bluefish (Pomatomus Saltatrix) 101.5 18.2 4.7 82.9Black Sea Turbot (Psetta Maeotica) 135.5 40.8 16.2 12.7Striped Mullet (Mugil Cephalus) 71.0 32.6 17.9 6.4Blue Mussel (Mytilus Galloprovincialis) 55.0 15.1 33.7 10.4Atlantic Bonito (Trachurus Mediteranneus Ponticus) 0.0 22.6 17.8 56.2Red Mullet (Mullus Barbatus) 33.0 35.9 17.0 1.1Garpike (Belone Belone) 33.6 8.3 4.1 2.2Leaping Mullet (Liza Saliens) 17.7 15.6 7.8 0.8Whitting (Merlangius Euxinus) 15.5 12.9 1.5 2.7Snouted Sole (Solea Nasuta) 9.5 9.0 3.0 0.3Shore Rockling (Gaidropsarus Mediterraneus) 20.0 0.0 1.0 0.0European Seabass (Dicentrarchus Labrax) 11.0 0.3 1.0 0.0European Flounder (Platichthys Flesus Luscus) 9.0 1.0 2.0 0.0Golden Grey Mullet (Liza Aurata) 7.6 1.3 0.0 0.5Great Sturgeon (Huso Huso) 3.5 0.6 2.5 0.6Sturgeon (Acipenser Stellatus) 3.0 0.3 1.0 0.0Russian Sturgeon (Acipenser Gueldenstaedti) 2.0 0.0 0.5 0.0Sandsmelt (Atherina Mochon Pontica) 0.1 0.4 1.0 0.8Prawns (Leander spp.) 0.5 0.1 0.2 0.2Totals 13,548.3 10,209.0 5,815.6 3,408.3
UNCLASSIFIED USDA Foreign Agricultural Service
GAIN Report - BU7008 Page 17 of 23
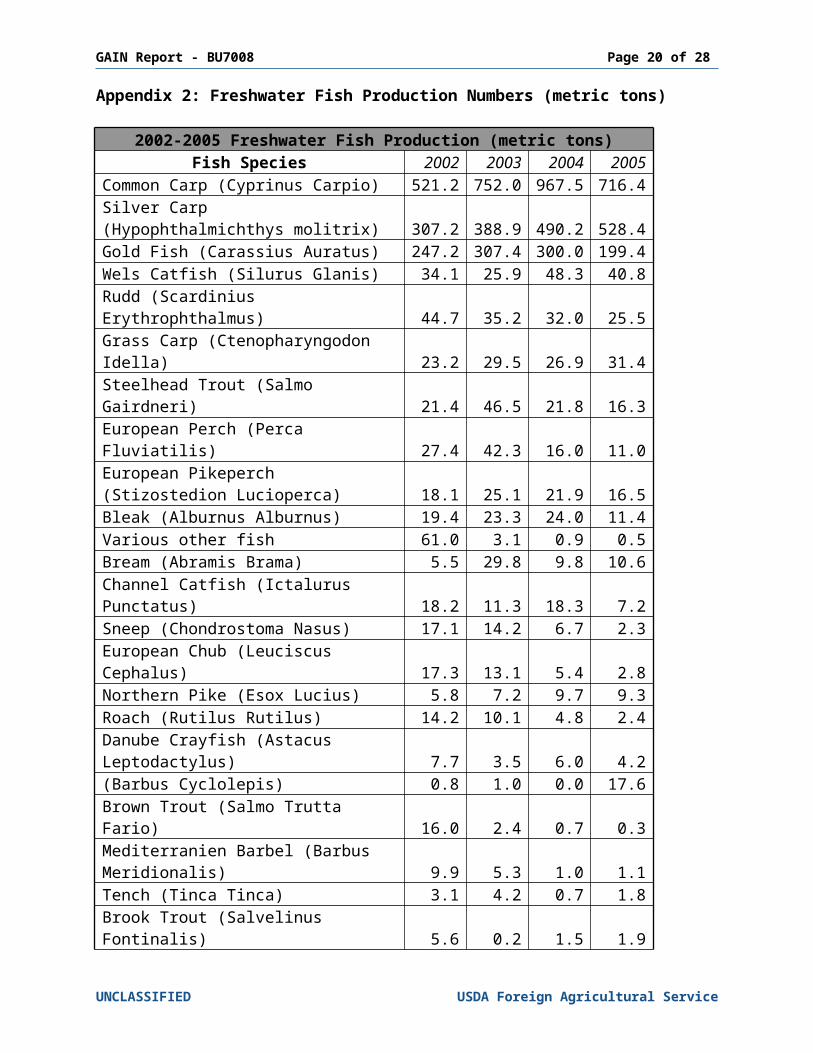
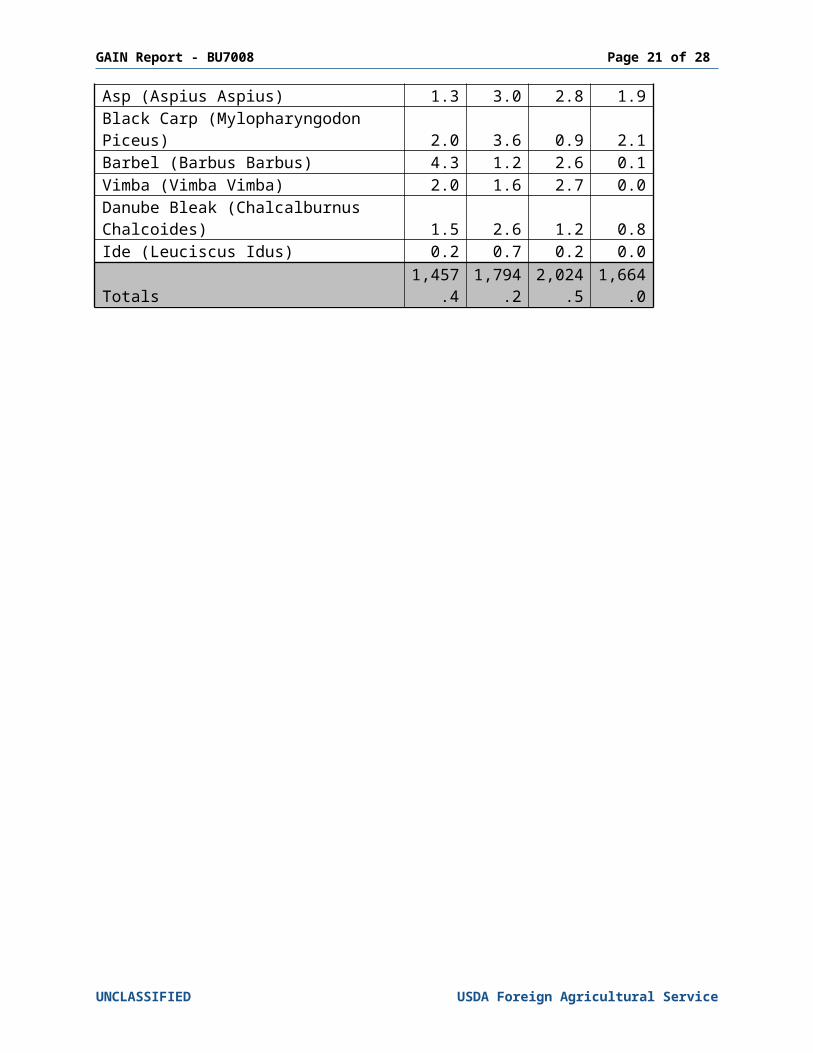
Appendix 2: Freshwater Fish Production Numbers (metric tons)
2002-2005 Freshwater Fish Production (metric tons)Fish Species 2002 2003 2004 2005
Common Carp (Cyprinus Carpio) 521.2 752.0 967.5 716.4Silver Carp (Hypophthalmichthys molitrix) 307.2 388.9 490.2 528.4Gold Fish (Carassius Auratus) 247.2 307.4 300.0 199.4Wels Catfish (Silurus Glanis) 34.1 25.9 48.3 40.8Rudd (Scardinius Erythrophthalmus) 44.7 35.2 32.0 25.5Grass Carp (Ctenopharyngodon Idella) 23.2 29.5 26.9 31.4Steelhead Trout (Salmo Gairdneri) 21.4 46.5 21.8 16.3European Perch (Perca Fluviatilis) 27.4 42.3 16.0 11.0European Pikeperch (Stizostedion Lucioperca) 18.1 25.1 21.9 16.5Bleak (Alburnus Alburnus) 19.4 23.3 24.0 11.4Various other fish 61.0 3.1 0.9 0.5Bream (Abramis Brama) 5.5 29.8 9.8 10.6Channel Catfish (Ictalurus Punctatus) 18.2 11.3 18.3 7.2Sneep (Chondrostoma Nasus) 17.1 14.2 6.7 2.3European Chub (Leuciscus Cephalus) 17.3 13.1 5.4 2.8Northern Pike (Esox Lucius) 5.8 7.2 9.7 9.3Roach (Rutilus Rutilus) 14.2 10.1 4.8 2.4Danube Crayfish (Astacus Leptodactylus) 7.7 3.5 6.0 4.2(Barbus Cyclolepis) 0.8 1.0 0.0 17.6Brown Trout (Salmo Trutta Fario) 16.0 2.4 0.7 0.3Mediterranien Barbel (Barbus Meridionalis) 9.9 5.3 1.0 1.1Tench (Tinca Tinca) 3.1 4.2 0.7 1.8Brook Trout (Salvelinus Fontinalis) 5.6 0.2 1.5 1.9Asp (Aspius Aspius) 1.3 3.0 2.8 1.9Black Carp (Mylopharyngodon Piceus) 2.0 3.6 0.9 2.1Barbel (Barbus Barbus) 4.3 1.2 2.6 0.1Vimba (Vimba Vimba) 2.0 1.6 2.7 0.0Danube Bleak (Chalcalburnus Chalcoides) 1.5 2.6 1.2 0.8Ide (Leuciscus Idus) 0.2 0.7 0.2 0.0Totals 1,457.4 1,794.2 2,024.5 1,664.0
UNCLASSIFIED USDA Foreign Agricultural Service
GAIN Report - BU7008 Page 18 of 23
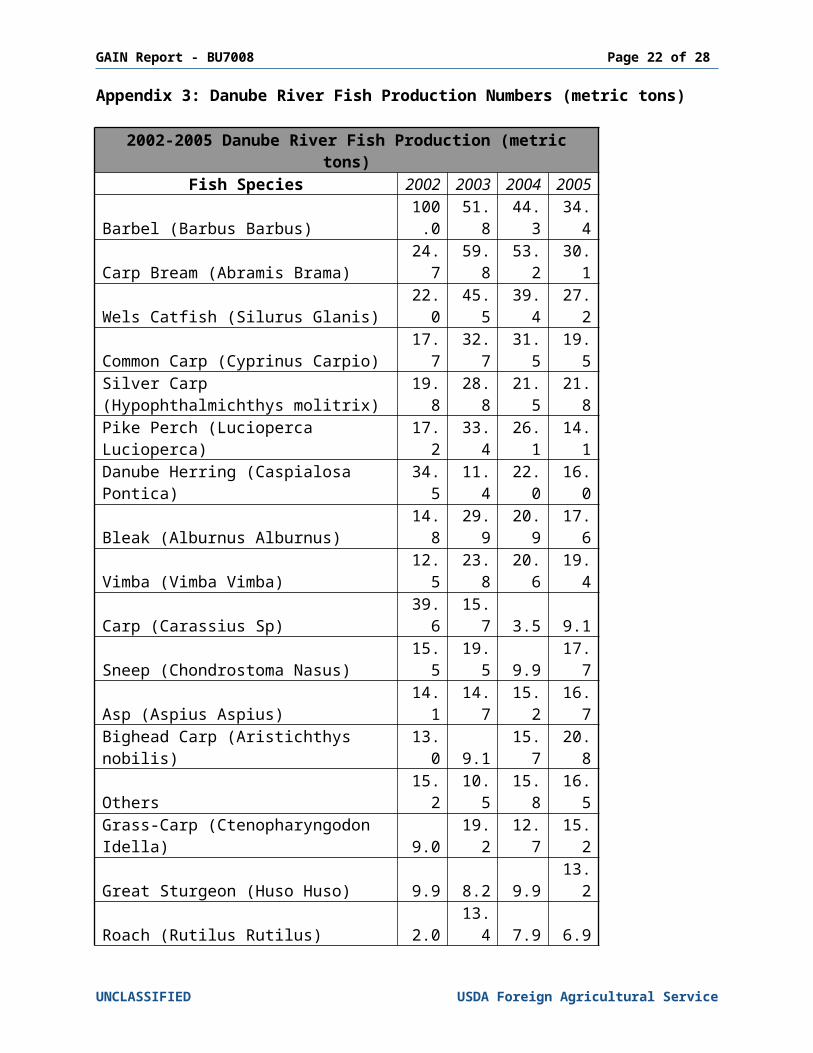
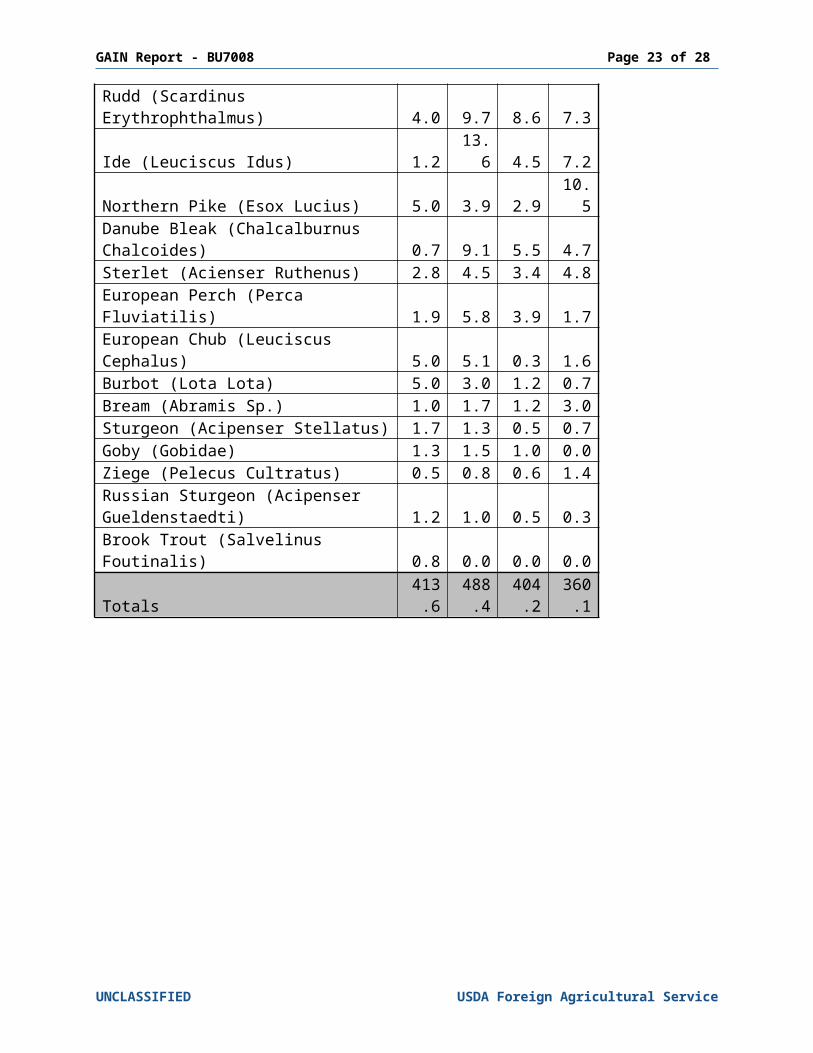
Appendix 3: Danube River Fish Production Numbers (metric tons)
2002-2005 Danube River Fish Production (metric tons)Fish Species 2002 2003 2004 2005
Barbel (Barbus Barbus) 100.0 51.8 44.3 34.4Carp Bream (Abramis Brama) 24.7 59.8 53.2 30.1Wels Catfish (Silurus Glanis) 22.0 45.5 39.4 27.2Common Carp (Cyprinus Carpio) 17.7 32.7 31.5 19.5Silver Carp (Hypophthalmichthys molitrix) 19.8 28.8 21.5 21.8Pike Perch (Lucioperca Lucioperca) 17.2 33.4 26.1 14.1Danube Herring (Caspialosa Pontica) 34.5 11.4 22.0 16.0Bleak (Alburnus Alburnus) 14.8 29.9 20.9 17.6Vimba (Vimba Vimba) 12.5 23.8 20.6 19.4Carp (Carassius Sp) 39.6 15.7 3.5 9.1Sneep (Chondrostoma Nasus) 15.5 19.5 9.9 17.7Asp (Aspius Aspius) 14.1 14.7 15.2 16.7Bighead Carp (Aristichthys nobilis) 13.0 9.1 15.7 20.8Others 15.2 10.5 15.8 16.5Grass-Carp (Ctenopharyngodon Idella) 9.0 19.2 12.7 15.2Great Sturgeon (Huso Huso) 9.9 8.2 9.9 13.2Roach (Rutilus Rutilus) 2.0 13.4 7.9 6.9Rudd (Scardinus Erythrophthalmus) 4.0 9.7 8.6 7.3Ide (Leuciscus Idus) 1.2 13.6 4.5 7.2Northern Pike (Esox Lucius) 5.0 3.9 2.9 10.5Danube Bleak (Chalcalburnus Chalcoides) 0.7 9.1 5.5 4.7Sterlet (Acienser Ruthenus) 2.8 4.5 3.4 4.8European Perch (Perca Fluviatilis) 1.9 5.8 3.9 1.7European Chub (Leuciscus Cephalus) 5.0 5.1 0.3 1.6Burbot (Lota Lota) 5.0 3.0 1.2 0.7Bream (Abramis Sp.) 1.0 1.7 1.2 3.0Sturgeon (Acipenser Stellatus) 1.7 1.3 0.5 0.7Goby (Gobidae) 1.3 1.5 1.0 0.0Ziege (Pelecus Cultratus) 0.5 0.8 0.6 1.4Russian Sturgeon (Acipenser Gueldenstaedti) 1.2 1.0 0.5 0.3Brook Trout (Salvelinus Foutinalis) 0.8 0.0 0.0 0.0Totals 413.6 488.4 404.2 360.1
UNCLASSIFIED USDA Foreign Agricultural Service
GAIN Report - BU7008 Page 19 of 23
Appendix 4: Bulgarian Exports (metric tons)
2003-2006 Destination of Bulgarian Exports by Country (metric tons)
Country 2003 2004 2005 2006Romania 1,814.2 2,011.4 913.9 677.6Japan 607.4 1,024.6 744.6 545.2Turkey 462.0 722.8 422.0 327.1
Germany 356.7 374.8 521.1 535.7
Greece 486.8 323.8 343.4 458.6Serbia 917.6 310.4 166.9 7.7Macedonia 322.2 150.0 232.9 614.5South Korea 145.0 113.5 59.0 610.2France 128.3 78.6 102.1 184.5America 0.7 0.2 180.4 111.2Bosnia 158.8 39.7 37.6 0.0Great Britain 0.4 0.4 0.2 113.5Czech Republic 36.0 0.0 42.0 27.9Sweden 0.0 0.0 0.0 79.4Norway 0.0 72.8 0.1 0.1China 0.3 10.4 10.5 23.5Italy 20.6 0.4 0.3 16.4
Spain 34.9 0.0 0.0 0.0
Netherlands 0.2 16.4 1.0 11.0Cambodia 25.4 0.1 0.0 0.3Total 5,548.6 5,277.5 3,851.8 4,413.3
UNCLASSIFIED USDA Foreign Agricultural Service
GAIN Report - BU7008 Page 20 of 23
Appendix 5: Bulgarian Exports (USD)
2003-2006 Value of Bulgarian Exports by Country (USD)Country 2003 2004 2005 2006
Japan 1,894,217 3,849,323 3,291,304 2,671,935Germany 1,170,378 1,128,754 1,781,810 2,535,969South Korea 520,586 497,335 296,519 3,029,956
Romania 1,677,991 952,506 728,105 834,907
France 521,614 375,758 1,189,324 1,655,838Turkey 417,173 709,463 298,893 230,297America 227,279 88,351 889,032 446,265Greece 385,320 274,528 283,684 464,197Macedonia 331,888 239,629 119,022 627,871Serbia 622,890 189,533 98,207 22,618Czech Republic 101,821 0 58,136 197,889Norway 215 279,634 352 3,191China 2,666 39,375 32,058 100,172Great Britain 1,895 2,064 1,139 167,368Sweden 0 0 0 164,460Netherlands 1,062 135,844 4,540 13,616Italy 74,432 2,363 1,795 55,913
Bosnia 96,142 15,750 14,877 0
Lichtenstein 0 0 123,933 0Spain 87,238 0 132 369Total 8,241,321 8,944,339 9,437,082 13,474,348
UNCLASSIFIED USDA Foreign Agricultural Service
GAIN Report - BU7008 Page 21 of 23
Appendix 6: Bulgarian Fish ImportersFish Producers, Processors and Importers Association BG FISHMr. Valeri Baronov, Che-mail: [email protected] Fish LtdCell (359)(899) 881 818Tel. 359 2 978 4060Tel/fax 359 2 978 4660Tel/fax (359)(2) 958 5649e-mail: [email protected]: www.bgfish.com
AtlanticMr. Ivailo Russinov3 “Industrial Zone”BourgasTel. (359)(56) 871 601; 871 602; 871 603 - directFax (359)(56) 840 692Cell (359)(888) 923 028e-mail: [email protected]; [email protected]
Electa Co. LtdMrs. Luybov Georgieva15A “Bratya Georgievich”9000 Varnatel./fax (359)(52) 69 11 55cell (359) 898 645 500e-mail: [email protected]
Danel 97 LtdMr. Plamen Danchev, ManagerSlatina Commodity ExchangeTel. (359)(2) 978 8505Mobile (359) 889 715 112Fax (359)(2) 973 4194e-mail: [email protected] Mrs. Neli Kunderova, Trade DirectorMobile (359) 887 905 909e-mail: [email protected]
UNCLASSIFIED USDA Foreign Agricultural Service
GAIN Report - BU7008 Page 22 of 23
Vi-VendaMr.Hristo DjundjurovTel. (359)(2) 931 2157Fax (359)(2) 931 1740Mobile (359) 888 444314e-mail: [email protected]
Delta IndustryMr. Mindo Kanchev Stoyanov, Executive Director22 “Kapitan Petko Voivoda” StrSozopolTel. 359 550 22420Tel/fax 359 550 22459Cell 359 888 206 469e-mail: [email protected]
NESI-5 LtdMr. Krum Drumev, Managing director2 “Georgi Tringov” StrPlovdiv 4003Tel. 359 32 968 100Fax 359 32 968 104e-mail: [email protected]
Silvex Commerce LtdMrs. Silvia Vladimirova5 A “Shishman” Str1000 Sofiatel. (359)(2) 980 9519; 989 0917fax (359)(2) 981 5966mobile: (359) 888 517 991e-mail: [email protected]
Diavena LtdMrs. Daniela Jelezcheva, PresidentMr. Plamen Gerchev, Trade ManagerIndustrial Zone9700 Shumentel. (359) (54) 832 594tel/ fax (359) (54) 628 71cell 359 899 943 079e-mail: [email protected] e-mail: [email protected]; web: www.diavena.com web: http://www.diavena.com
UNCLASSIFIED USDA Foreign Agricultural Service
GAIN Report - BU7008 Page 23 of 23
Kamarko LtdMr. George Kostadinov17A “Tintyava” StrSofiaTel. (359)(2) 969 2011Fax (359)(2) 962 5849Cell (359) 888 438 368e-mail: [email protected]
Ecomar Ltd.Mr. Ivaylo Tomov, ManagerCell 0888 920 428Sofia 1000,20-22 William Gladstone St, 6th floor, ap.18tel: 359 2 981 36 72fax; 359 2 981 4538GSM 359 888 920 428e-mail: [email protected]
Poseidon Frozen Foods Ltd.Mr. Dimitar Ganev, ManagerSofia 157413, Tzvetan Lazarov St.Storehouse 202Tel: 359 2 978 63 66Fax: 359 2 973 41 84Mobile: 359 885 551 999e-mail: [email protected] e-mail: [email protected]
Seafood LtdMr. Venelin Dimitrov, President51 “Patrirach Eftimii” Str.Bourgas Tel. 056 842 395e-mail [email protected]
UNCLASSIFIED USDA Foreign Agricultural Service