approved; - American Association of Clinical Endocrinologists...
74
Transcript of approved; - American Association of Clinical Endocrinologists...


US FDA. Drugs@FDA. http://www.accessdata.fda.gov/Scripts/cder/DrugsatFDA.
Basal insulins
Human insulins (intermediate acting)
U-100 NPH
Analogues (long acting)
U-100 glargine
U-100 detemir
U-100 biosimilarglargine
Analogues (ultralong acting)
U-300 glargine
U-100 degludecb
U-200 degludecb
Peglisproc
Blue boxes = FDA Approveda Approved by the FDA but not for interchangeailityb Approved by the US FDA in September 2015.c Not currently approved by the US FDA.

GIR
, mg/
kg/m
in
5
4
3
2
1
0
6
Time, hour0 6 12 18 24 30 36
http://www.google.com/patents/US20120122774.
U-100 0.3 U/kg
U-100 0.4 U/kg
U-100 0.6 U/kg
U-100 1.2 U/kg
U-300 0.6 U/kg
U-300 0.9 U/kg
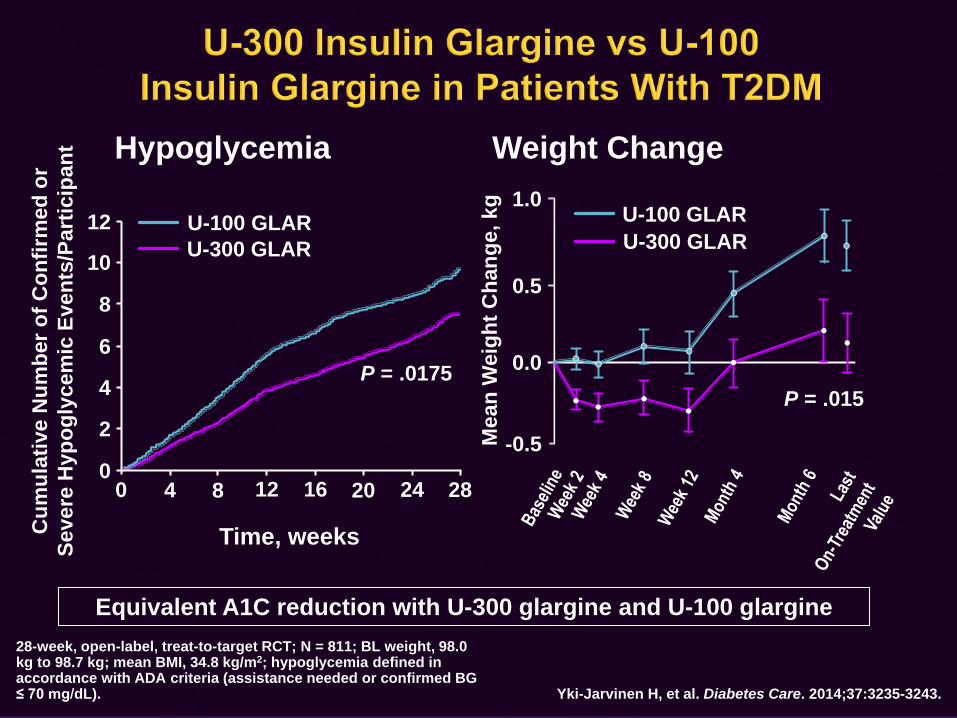
Hypoglycemia Weight Change
28-week, open-label, treat-to-target RCT; N = 811; BL weight, 98.0 kg to 98.7 kg; mean BMI, 34.8 kg/m2; hypoglycemia defined in accordance with ADA criteria (assistance needed or confirmed BG ≤ 70 mg/dL). Yki-Jarvinen H, et al. Diabetes Care. 2014;37:3235-3243.
Equivalent A1C reduction with U-300 glargine and U-100 glargine
Time, weeks
0
4
6
10
12
0 8 20 28
Cum
ulat
ive
Num
ber o
f Con
firm
ed o
r Se
vere
Hyp
ogly
cem
ic E
vent
s/Pa
rtic
ipan
t
8
2
4 12 2416
U-100 GLARU-300 GLAR
P = .015
U-100 GLARU-300 GLAR
1.0
0.5
0.0
-0.5Mea
n W
eigh
t Cha
nge,
kg
P = .0175

Comparator U-300 GLAR
U-100 GLAR
DET NPH DEG Premixed Insulin
Δ A1C Ref Same Same Same Same SameΔ Weight Ref Same Same Same Same SameNocturnal hypoglycemia
Ref Morea More Morea More Morea
Documented symptomatic hypoglycemia
Ref More More More More More
Systematic literature review of 44 trials.Same, statistically equivalent.More, numerically higher.a Statistically significant difference, P < .05. Wang H, et al. Diabetes. 2015;64(suppl 1):A26 [abstract 99-OR].
U-300 glargine is associated with a 32%-79% lower risk of nocturnal hypoglycemia than other basal insulins
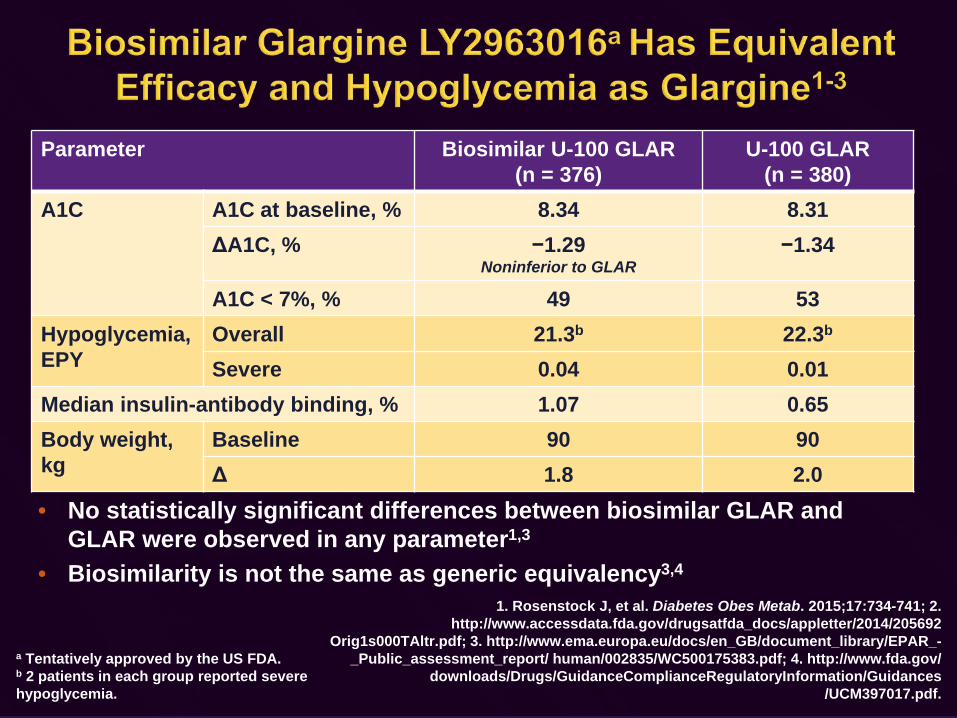
Parameter Biosimilar U-100 GLAR(n = 376)
U-100 GLAR(n = 380)
A1C A1C at baseline, % 8.34 8.31ΔA1C, % −1.29
Noninferior to GLAR−1.34
A1C < 7%, % 49 53Hypoglycemia, EPY
Overall 21.3b 22.3b
Severe 0.04 0.01Median insulin-antibody binding, % 1.07 0.65Body weight, kg
Baseline 90 90Δ 1.8 2.0
a Tentatively approved by the US FDA. b 2 patients in each group reported severe hypoglycemia.
1. Rosenstock J, et al. Diabetes Obes Metab. 2015;17:734-741; 2. http://www.accessdata.fda.gov/drugsatfda_docs/appletter/2014/205692
Orig1s000TAltr.pdf; 3. http://www.ema.europa.eu/docs/en_GB/document_library/EPAR_-_Public_assessment_report/ human/002835/WC500175383.pdf; 4. http://www.fda.gov/
downloads/Drugs/GuidanceComplianceRegulatoryInformation/Guidances/UCM397017.pdf.
• No statistically significant differences between biosimilar GLAR and GLAR were observed in any parameter1,3
• Biosimilarity is not the same as generic equivalency3,4

1. Jonassen I, et al. Pharm Res. 2012;29:2104-2114; 2. Haahr H, Heise T. Clin Pharmacokinet. 2014;53:787-800; 3. Rosenstock J, et al. Diabetes. 2012;61(suppl 1):A263 [abstract 1026-P]; 4. Henry RR, et al. Diabetes Care.
2014;37:2609-2615; 5. Moore MC, et al. Diabetes. 2014;63:494-504.
Insulin lispro(5.8 kDa)
≈ 26 kDa(actual size)
Polyethylene glycol chain
(≈ 20 kDa)
Long multihexamer chainsassemble
Phenol from the vehiclediffuses quickly, and insulindegludec links up via single
side-chain contacts
Insulin degludec injected
Insulin Peglispro3-5,a
• Delayed insulin absorption• Reduced renal clearance• Functional size exceeds that of albumin
(71-98 kDa vs ≈ 65 kDa)• Large size preserves hepatic distribution and
activity• Large size decreases peripheral action
Insulin Degludec1,2
• Dihexamers (69 kDa) form soluble multihexamers after injection
• Multihexamers (> 5000 kDa) disassemble slowly
• Monomers are released rapidly after hexamers disassemble
a Not currently approved by the US FDA.
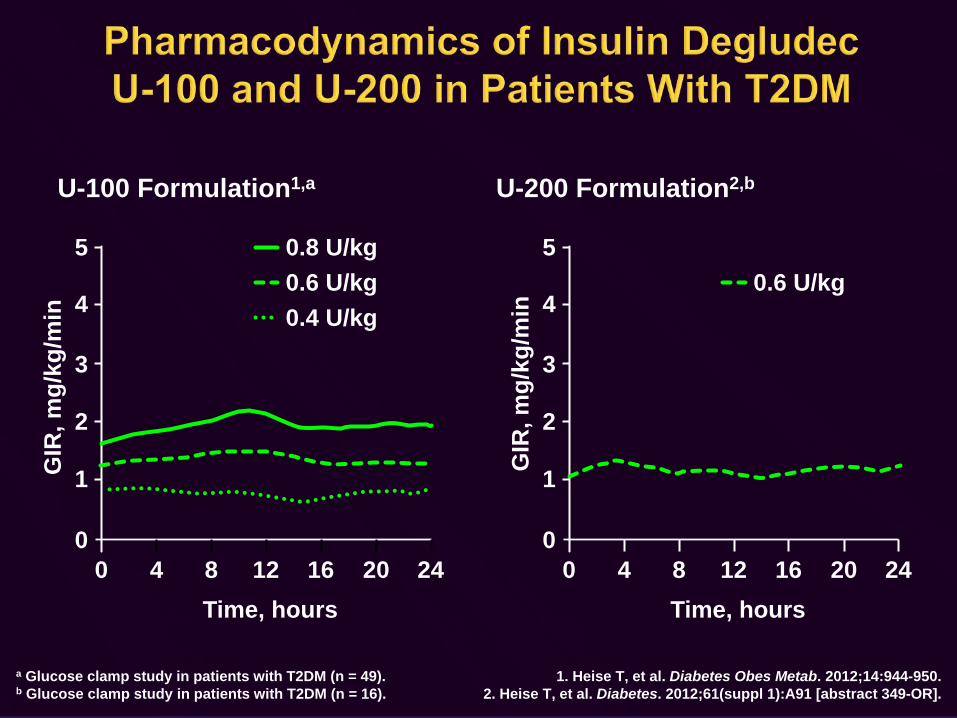
a Glucose clamp study in patients with T2DM (n = 49).b Glucose clamp study in patients with T2DM (n = 16).
1. Heise T, et al. Diabetes Obes Metab. 2012;14:944-950.2. Heise T, et al. Diabetes. 2012;61(suppl 1):A91 [abstract 349-OR].
U-100 Formulation1,a U-200 Formulation2,b
GIR
, mg/
kg/m
in
0
2
3
4
5
1
160 4 8 12 20 24Time, hours
0.8 U/kg
0.4 U/kg0.6 U/kg
GIR
, mg/
kg/m
in0
2
3
4
5
1
160 4 8 12 20 24Time, hours
0.6 U/kg

BEGIN One Long1,a,b
104 weeks, N = 1030 (n = 725 in extension)
BEGIN Basal-Bolus Type 22,a,c
78 weeks, N = 1006 (n = 757 in extension)
Comparator U-100 GLAR U-100 GLARΔ A1C Same SameΔ Weight Favors GLAR
2.7 vs 2.4 kgFavors DEGd
4.0 vs 4.4 kgNocturnal hypoglycemia DEG bettere DEG bettere
Documented symptomatic hypoglycemia
Not significantly different
DEG bettere
a Data shown for extension trial set from beginning to end of trial. b Insulin naive with OADS (MET ± PIO ± DPP-4i).c Insulin experienced, on basal-bolus insulin ± MET.d Data shown for safety analysis set.e Statistically significant superiority.
1. Rodbard HW, et al. Diabet Med. 2013;30:1298-1304.2. Hollander P, et al. Diabetes Obes Metab. 2015;17:202-206.
Degludec has equivalent efficacy, with 31%-43% less nocturnal hypoglycemia than U-100 glargine
0.03
0.02
0.01 0.01 0.01 0.01
0
0.01
0.02 0.02
0.01 0.01
0 0
0.01 0.01
0
0.01
0.02
0.03
0.04
Even
t Rat
e, p
er p
erso
n-ye
ar
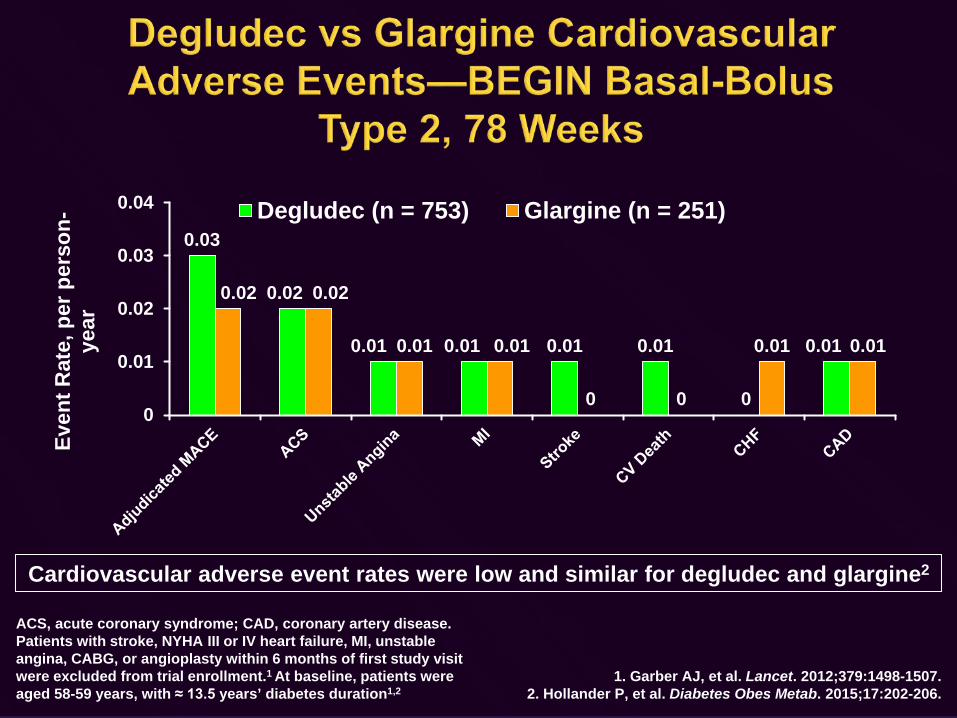
Degludec (n = 753) Glargine (n = 251)
ACS, acute coronary syndrome; CAD, coronary artery disease.Patients with stroke, NYHA III or IV heart failure, MI, unstable angina, CABG, or angioplasty within 6 months of first study visit were excluded from trial enrollment.1 At baseline, patients were aged 58-59 years, with ≈ 13.5 years’ diabetes duration1,2
1. Garber AJ, et al. Lancet. 2012;379:1498-1507.2. Hollander P, et al. Diabetes Obes Metab. 2015;17:202-206.
Cardiovascular adverse event rates were low and similar for degludec and glargine2
0
1
2
3
4
5
0 2 4 6 8 10 12 14 16 18 20 22 24
Mea
n G
IR, m
g/m
in/k
g
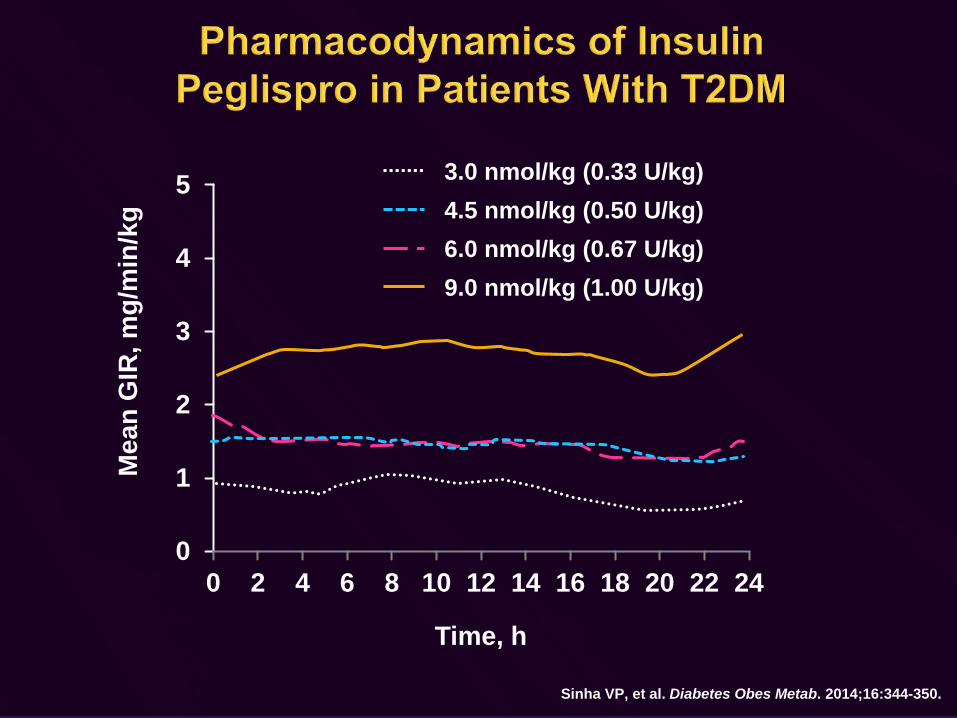
Sinha VP, et al. Diabetes Obes Metab. 2014;16:344-350.
Time, h
3.0 nmol/kg (0.33 U/kg)4.5 nmol/kg (0.50 U/kg)6.0 nmol/kg (0.67 U/kg)9.0 nmol/kg (1.00 U/kg)
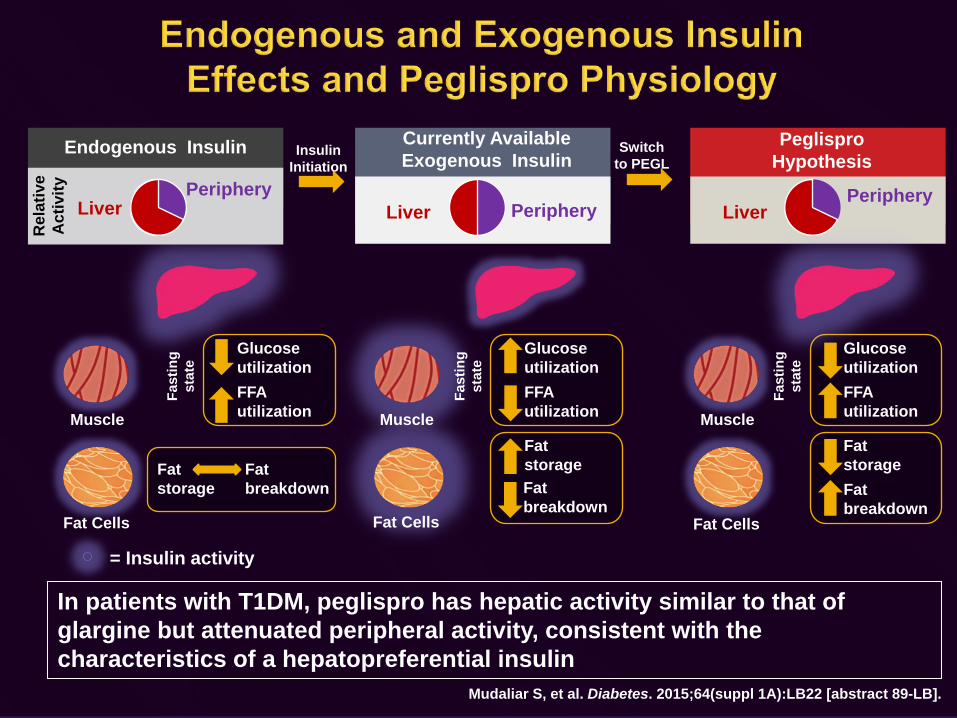
Mudaliar S, et al. Diabetes. 2015;64(suppl 1A):LB22 [abstract 89-LB].
In patients with T1DM, peglispro has hepatic activity similar to that of glargine but attenuated peripheral activity, consistent with the characteristics of a hepatopreferential insulin
Glucose utilization
Insulin Initiation
Switch to PEGL
LiverPeriphery
Rel
ativ
e A
ctiv
ity
FFAutilization
Glucose utilizationFFAutilization
Glucose utilizationFFAutilization
Fat storageFat breakdown
Fat storageFat breakdown
Fat storage
Fat breakdown
Fast
ing
stat
e
Fast
ing
stat
e
Fast
ing
stat
e
PeglisproHypothesis
Currently AvailableExogenous Insulin
Endogenous Insulin
= Insulin activity
Muscle Muscle Muscle
Fat Cells Fat Cells Fat Cells
Liver LiverPeripheryPeriphery
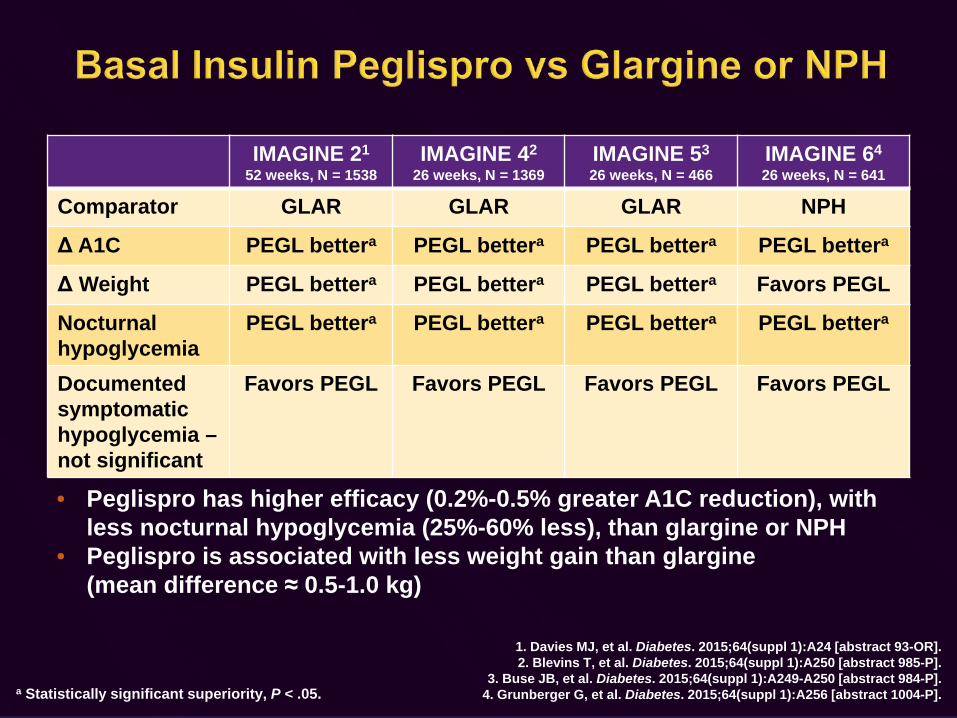
IMAGINE 21
52 weeks, N = 1538IMAGINE 42
26 weeks, N = 1369IMAGINE 53
26 weeks, N = 466IMAGINE 64
26 weeks, N = 641
Comparator GLAR GLAR GLAR NPH
Δ A1C PEGL bettera PEGL bettera PEGL bettera PEGL bettera
Δ Weight PEGL bettera PEGL bettera PEGL bettera Favors PEGL
Nocturnal hypoglycemia
PEGL bettera PEGL bettera PEGL bettera PEGL bettera
Documented symptomatic hypoglycemia –not significant
Favors PEGL Favors PEGL Favors PEGL Favors PEGL
a Statistically significant superiority, P < .05.
1. Davies MJ, et al. Diabetes. 2015;64(suppl 1):A24 [abstract 93-OR].2. Blevins T, et al. Diabetes. 2015;64(suppl 1):A250 [abstract 985-P].
3. Buse JB, et al. Diabetes. 2015;64(suppl 1):A249-A250 [abstract 984-P].4. Grunberger G, et al. Diabetes. 2015;64(suppl 1):A256 [abstract 1004-P].
• Peglispro has higher efficacy (0.2%-0.5% greater A1C reduction), with less nocturnal hypoglycemia (25%-60% less), than glargine or NPH
• Peglispro is associated with less weight gain than glargine (mean difference ≈ 0.5-1.0 kg)

Hepatic Steatosis ALT Valuesa
a Data are LS mean; study endpoint refers to last visit completed, including 4-week follow-up visit after treatment completion; b P < .05 vs baseline. Hartman ML, et al. Diabetes. 2015;64(suppl 1):A251 [abstract 989-P].
Hepatic steatosis was defined as liver fat content ≥ 6%
IMAGINE 252 or 78 wk
Insulin Naive
IMAGINE 552 wk
Basal Only
IMAGINE 426 wkBBT
Last visit on PEGL
40
35
30
25
20
ALT
, IU
/L
BaselineStudy endpoint
0
20
40
60
80
100
Insulin Naive Previous Insulin Treatment
Patie
nts,
%
GLAR BL GLAR 52 wk PEGL BL PEGL 52 wk
bb
b
b b
b

Compound ID Mechanism of Protraction
Tested in Duration of Action
PE01391 Inert repeating polymeric elastin like peptide on C-terminus of recombinant human monomeric insulin
Patients with T2DM T½ max = 51-73 h (2-3 days)
HM124702 Conjugated soluble insulin and a non-glycosylated Fc carrier via a nonpeptidyl linker
Animal models T½ max = 132 h(5.5 days)
AB1013 Microsphere pegylatedhuman recombinantinsulin
Animal models Cmax > 30 ng/mL at 7-9 days postdose
1. Marquez F, et al. Diabetes. 2015;64(suppl 1):A26 [abstract 100-OR].2. Huh Y, et al. Diabetes. 2015;64(suppl 1A):LB22 [abstract 86-LB].
3. Roberts BK, et al. Diabetes. 2015;64(suppl 1):A25-A26 [abstract 97-OR].4. Hauber AB, et al. Diabetes Ther. 2015;6:75-84.
5. Boegelund M, et al. Diabetes. 2015;64(suppl 1):A349 [abstract 1341-P].
Patients may prefer once-weekly injectable agents to once-daily agents4,5

• Subcutaneous insulin injection does not exactly mimic endogenous insulin secretion
• Ultralong-acting basal insulins have a flatter time-action profile and may be even less likely to cause nocturnal hypoglycemia than first-generation insulin analogues
U-300 Glargine
• Approved• Same molecule as U-
100 glargine• Compared with U-100
glargine:• Equally effective• Less nocturnal
hypoglycemia• Equivalent weight gain
Degludec
• Approved• Forms multihexamers
for slow release• Compared with U-100
glargine:• Equally effective• Less nocturnal
hypoglycemia• Equivalent weight gain
Peglispro
• Investigational• Greater hepatic action,
less peripheral action• Compared with U-100
glargine:• More effective • Less nocturnal
hypoglycemia• Less weight gain• LFT abn and Tg
• Several insulins designed for once-weekly administration are in early development
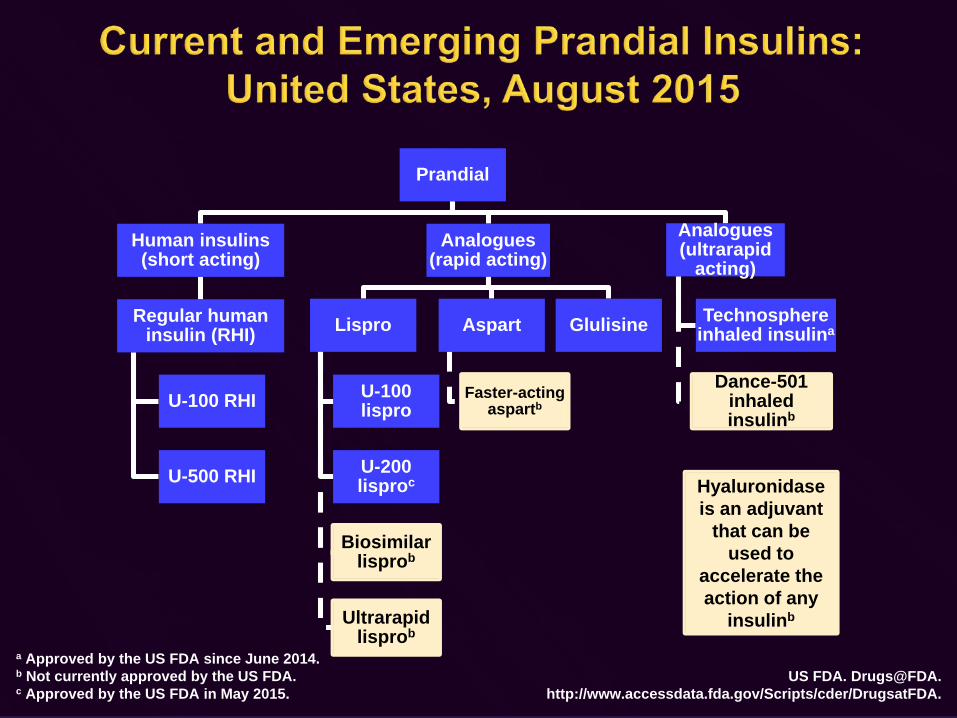
a Approved by the US FDA since June 2014.b Not currently approved by the US FDA.c Approved by the US FDA in May 2015.
US FDA. Drugs@FDA. http://www.accessdata.fda.gov/Scripts/cder/DrugsatFDA.
Prandial
Human insulins (short acting)
Regular human insulin (RHI)
U-100 RHI
U-500 RHI
Analogues (rapid acting)
Lispro
U-100 lispro
U-200 lisproc
Biosimilar lisprob
Ultrarapidlisprob
Aspart
Faster-acting aspartb
Glulisine
Analogues (ultrarapid
acting)
Technosphereinhaled insulina
Dance-501 inhaled insulinb
Hyaluronidase is an adjuvant
that can be used to
accelerate the action of any
insulinb
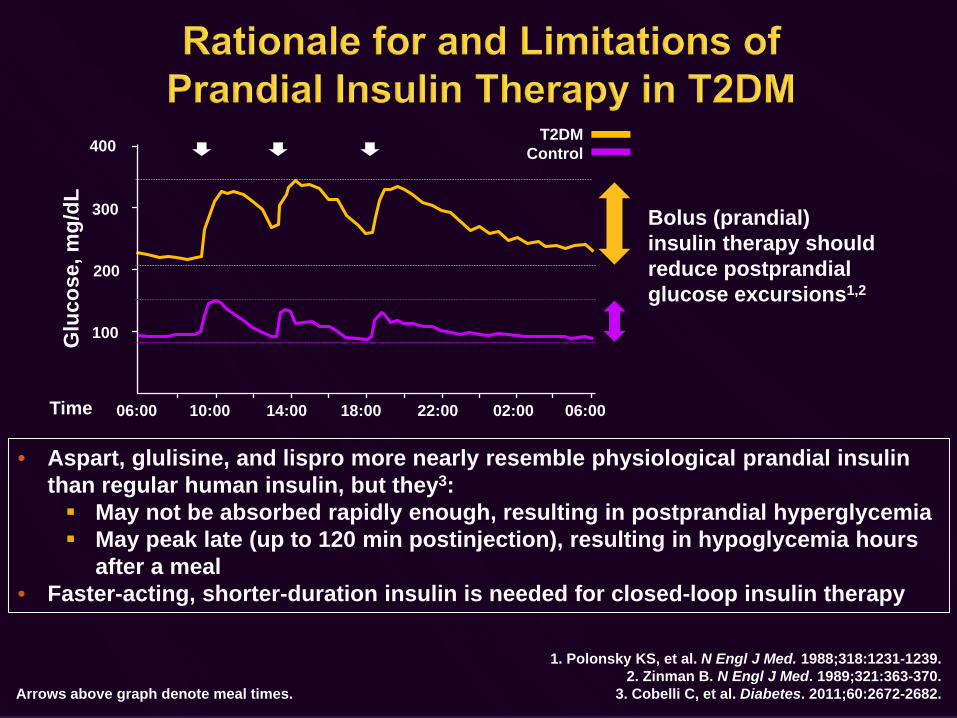
Arrows above graph denote meal times.
1. Polonsky KS, et al. N Engl J Med. 1988;318:1231-1239. 2. Zinman B. N Engl J Med. 1989;321:363-370.
3. Cobelli C, et al. Diabetes. 2011;60:2672-2682.
• Aspart, glulisine, and lispro more nearly resemble physiological prandial insulin than regular human insulin, but they3: May not be absorbed rapidly enough, resulting in postprandial hyperglycemia May peak late (up to 120 min postinjection), resulting in hypoglycemia hours
after a meal• Faster-acting, shorter-duration insulin is needed for closed-loop insulin therapy
400
300
200
100
06:00 10:00 14:00 18:00 22:00 02:00 06:00
Glu
cose
, mg/
dL
T2DMControl
Bolus (prandial) insulin therapy should reduce postprandial glucose excursions1,2
Time
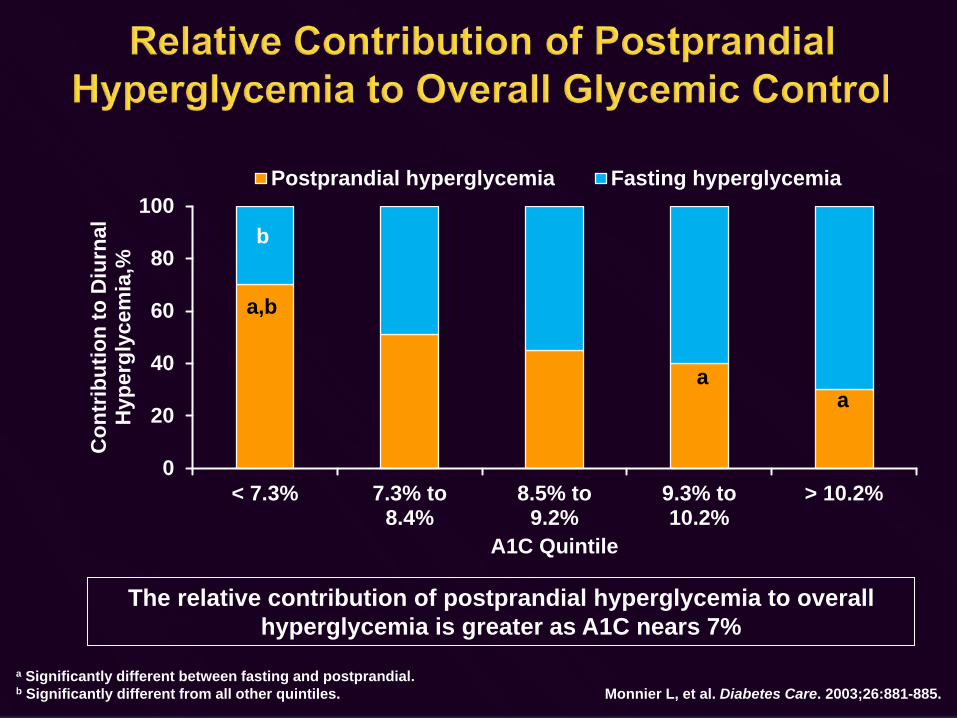
0
20
40
60
80
100
< 7.3% 7.3% to8.4%
8.5% to9.2%
9.3% to10.2%
> 10.2%
Con
trib
utio
n to
Diu
rnal
H
yper
glyc
emia
,%
A1C Quintile
Postprandial hyperglycemia Fasting hyperglycemia
a Significantly different between fasting and postprandial.b Significantly different from all other quintiles. Monnier L, et al. Diabetes Care. 2003;26:881-885.
a,b
b
aa
The relative contribution of postprandial hyperglycemia to overall hyperglycemia is greater as A1C nears 7%
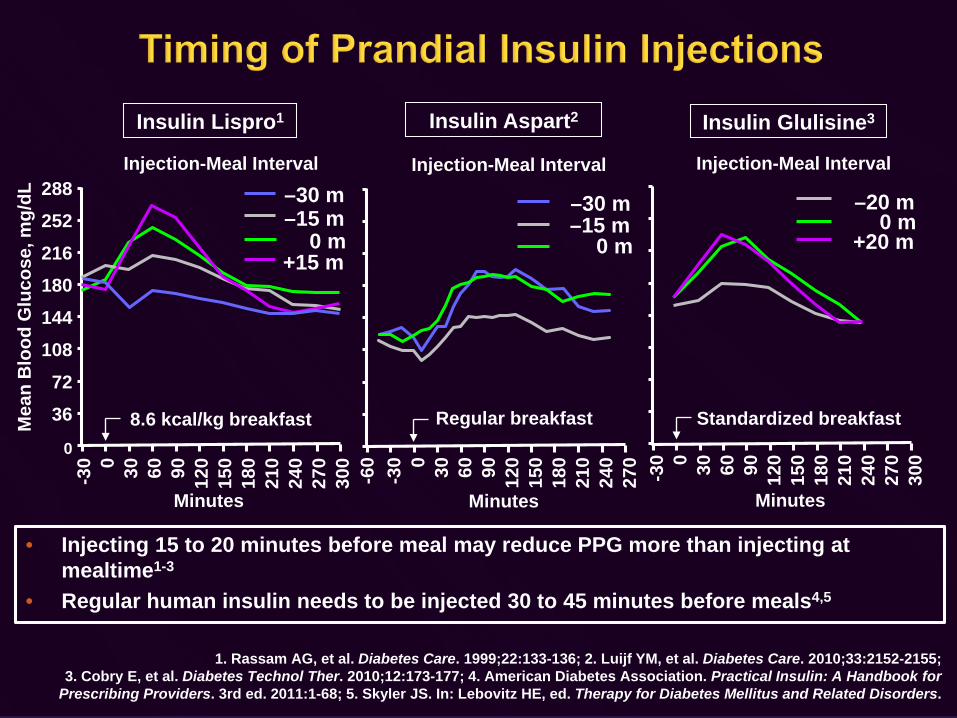
1. Rassam AG, et al. Diabetes Care. 1999;22:133-136; 2. Luijf YM, et al. Diabetes Care. 2010;33:2152-2155; 3. Cobry E, et al. Diabetes Technol Ther. 2010;12:173-177; 4. American Diabetes Association. Practical Insulin: A Handbook for
Prescribing Providers. 3rd ed. 2011:1-68; 5. Skyler JS. In: Lebovitz HE, ed. Therapy for Diabetes Mellitus and Related Disorders.
Insulin Lispro1
300
-30 0 30 60 24090 270
120
150
180
210
8.6 kcal/kg breakfast
Minutes
Mea
n B
lood
Glu
cose
, mg/
dL 288252216180144108
7236
0
Injection-Meal Interval–30 m–15 m
0 m+15 m
Standardized breakfast
Minutes
Insulin Glulisine3
300
-30 0 30 60 24090 270
120
150
180
210
Injection-Meal Interval
–20 m0 m
+20 m0 m
–30 m–15 m
Insulin Aspart2
Regular breakfast-3
0 0 30 60 24090 270
120
150
180
210
-60
Minutes
Injection-Meal Interval
• Injecting 15 to 20 minutes before meal may reduce PPG more than injecting at mealtime1-3
• Regular human insulin needs to be injected 30 to 45 minutes before meals4,5

Key Findings
• Greater A1C reduction (0.1%; P = .037)
• Greater 2-h PPG reduction at breakfast and dinner (≈ 10-12 mg/dL; P < .001)
• Possibly less frequent severe hypoglycemia (ORMH = 0.61; P = NS)
Conclusions
• Prandial analogues have slightly greater efficacy and possibly less risk of severe hypoglycemia than RHI
• Comparative efficacy analyses among prandial insulin analogues is not possible with available data
Mannucci E, et al. Diabetes Obes Metab. 2009;11:53-59.Meta-analysis of 13 trials of 4361 individuals with T2DM.

1. Rave K, et al. J Diabetes Sci Technol. 2008;2:205-212.2. Rosenstock J, et al. Diabetes Care. 2015 Aug 7. [Epub ahead of print].
Inhaled TI (48 units)SC RHI (24 units)
5.0
3.0
1.0GIR
, mg/
kg/m
in
0 60 120 180Time, min
4.0
2.0
0.0240 300 360 420 480 540
• Duration of action for inhaled insulin is much shorter than for RHI1• Almost complete PPG suppression has been observed in a double-blind,
placebo-controlled trial in insulin-naive patients with T2DM using OADs2

24-week, double-blind, multicenter, multinational RCT; N = 353; BL A1C = 8.3%; BL FPG = 175-176 mg/dL; BL Wt = 90-91 kg. OADsincluded MET or ≥ 2 OADs. Exclusions: recent smoking, GLP-1 RAs, or TZDs. a P < .0001. Rosenstock J, et al. Diabetes Care. 2015 Aug 7. [Epub ahead of print].
Treatment Group Severe Hypo, % Cough Events, % Weight Change, kgInsulin (TI) 5.1 23.7 0.49Placebo (TP) 1.7 19.9 -1.13a
Blo
od G
luco
se, m
g/dL
7-Point Blood Glucose Profile at Week 24
Insulin (TI) =Placebo (TP) =
Before Breakfast
After Breakfast
Before Lunch
After Lunch
After Dinner
Before Dinner
Bedtime
122116
110106
114102
115104
112105
117112
9393
130140150160170180190200210220230240250260
Insulin (TI)
Placebo (TP)
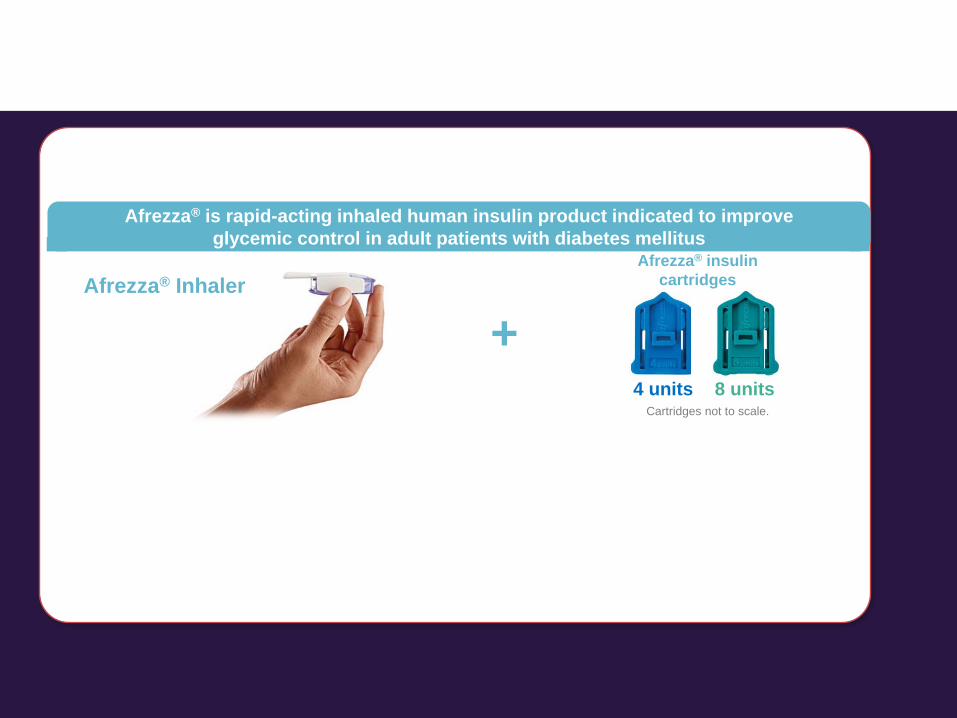
Afrezza® is rapid-acting inhaled human insulin product indicated to improve glycemic control in adult patients with diabetes mellitus
Afrezza® Inhaler
Cartridges not to scale.4 units 8 units
Afrezza® insulincartridges
+
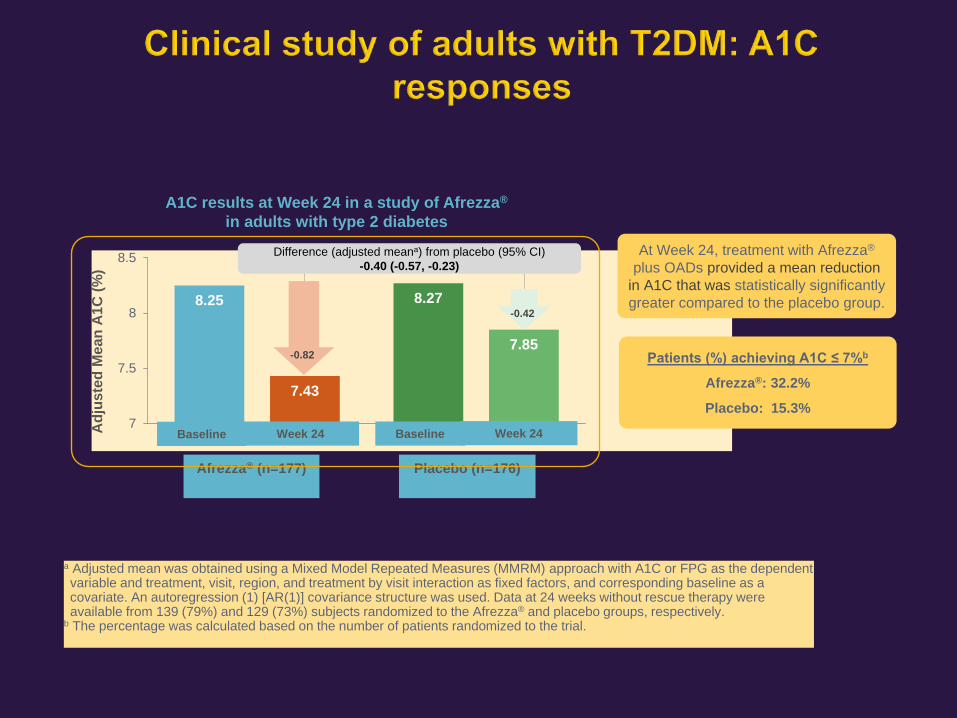
8.25 8.27
7.43
7.85
7
7.5
8
8.5
Adj
uste
d M
ean
A1C
(%)
Baseline
Placebo (n=176)
Week 24
Difference (adjusted meana) from placebo (95% CI)-0.40 (-0.57, -0.23)
-0.82
-0.42
A1C results at Week 24 in a study of Afrezza®
in adults with type 2 diabetes
a Adjusted mean was obtained using a Mixed Model Repeated Measures (MMRM) approach with A1C or FPG as the dependent variable and treatment, visit, region, and treatment by visit interaction as fixed factors, and corresponding baseline as a covariate. An autoregression (1) [AR(1)] covariance structure was used. Data at 24 weeks without rescue therapy were available from 139 (79%) and 129 (73%) subjects randomized to the Afrezza® and placebo groups, respectively.
b The percentage was calculated based on the number of patients randomized to the trial.
Baseline
Afrezza® (n=177)
Week 24
Patients (%) achieving A1C ≤ 7%b
Afrezza®: 32.2%
Placebo: 15.3%
At Week 24, treatment with Afrezza®
plus OADs provided a mean reduction in A1C that was statistically significantly greater compared to the placebo group.
Adj
uste
d M
ean
FPG
(mg/
dL)
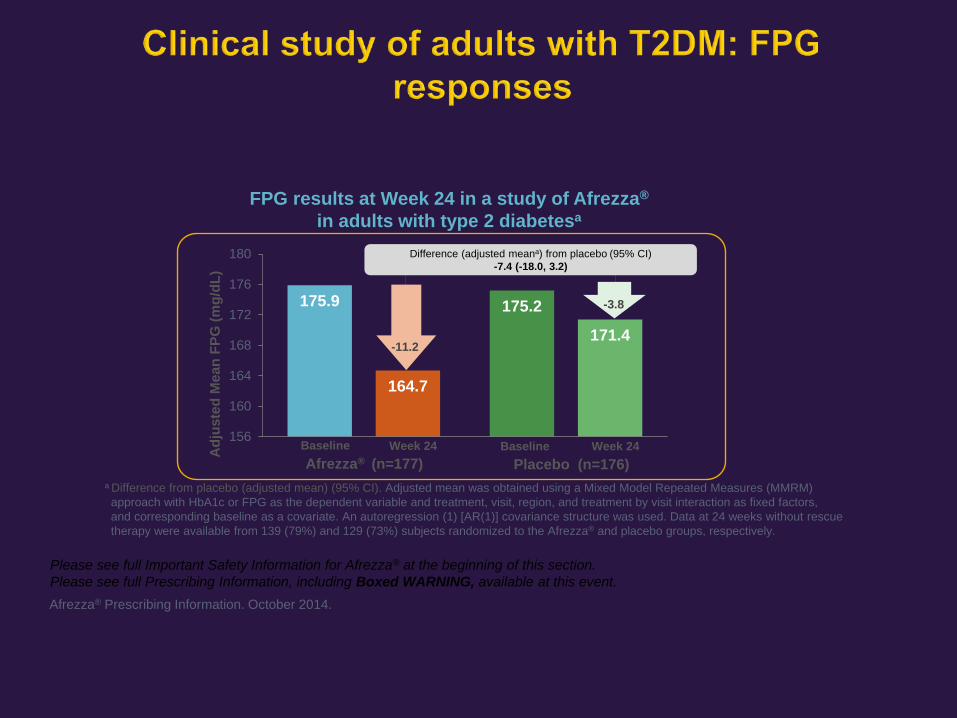
175.9 175.2
164.7
171.4
156
160
164
168
172
176
180
Baseline Week 24Afrezza® (n=177) Placebo (n=176)
Baseline Week 24
Difference (adjusted meana) from placebo (95% CI)-7.4 (-18.0, 3.2)
-11.2
-3.8
a Difference from placebo (adjusted mean) (95% CI). Adjusted mean was obtained using a Mixed Model Repeated Measures (MMRM) approach with HbA1c or FPG as the dependent variable and treatment, visit, region, and treatment by visit interaction as fixed factors, and corresponding baseline as a covariate. An autoregression (1) [AR(1)] covariance structure was used. Data at 24 weeks without rescue therapy were available from 139 (79%) and 129 (73%) subjects randomized to the Afrezza® and placebo groups, respectively.
FPG results at Week 24 in a study of Afrezza®
in adults with type 2 diabetesa
Please see full Important Safety Information for Afrezza® at the beginning of this section. Please see full Prescribing Information, including Boxed WARNING, available at this event. Afrezza® Prescribing Information. October 2014.

Baseline-corrected serum insulin concentrations after administration of Afrezza®
or subcutaneous insulin lispro in type 1 diabetes patients
Study design: The pharmacokinetic (PK) profiles for orally inhaled Afrezza® 8 units relative to subcutaneously administered insulin lispro 8 units from a study in 12 patients with type 1 diabetes. Data are baseline-corrected serum insulin concentrations after administration of Afrezza® or subcutaneous insulin lispro.Despite the faster absorption of insulin (PK) from Afrezza®, the onset of activity (PD) was comparable to insulin lispro.
Afrezza® pharmacokinetics:• Maximum serum insulin concentration
achieved in 12-15 minutes • Return to baseline: ~180 minutes• Carrier particles are not metabolized and
are eliminated unchanged in the urine following the lung absorption
Insulin lispro (8 units)
Afrezza® (8 units)
Insu
lin (µ
U/m
L)
Time (minutes)
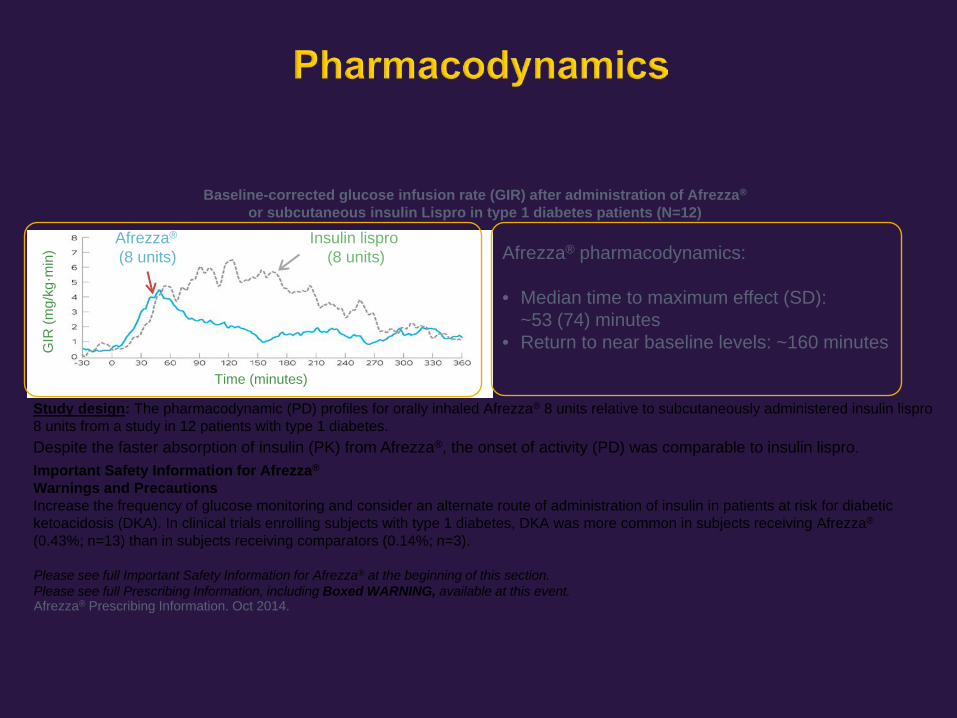
Despite the faster absorption of insulin (PK) from Afrezza®, the onset of activity (PD) was comparable to insulin lispro.Important Safety Information for Afrezza®
Warnings and PrecautionsIncrease the frequency of glucose monitoring and consider an alternate route of administration of insulin in patients at risk for diabetic ketoacidosis (DKA). In clinical trials enrolling subjects with type 1 diabetes, DKA was more common in subjects receiving Afrezza®
(0.43%; n=13) than in subjects receiving comparators (0.14%; n=3).
Study design: The pharmacodynamic (PD) profiles for orally inhaled Afrezza® 8 units relative to subcutaneously administered insulin lispro 8 units from a study in 12 patients with type 1 diabetes.
Afrezza® pharmacodynamics:
• Median time to maximum effect (SD):~53 (74) minutes
• Return to near baseline levels: ~160 minutes
Afrezza® Prescribing Information. Oct 2014.
Please see full Important Safety Information for Afrezza® at the beginning of this section. Please see full Prescribing Information, including Boxed WARNING, available at this event.
Insulin lispro (8 units)
Afrezza®
(8 units)
Baseline-corrected glucose infusion rate (GIR) after administration of Afrezza®
or subcutaneous insulin Lispro in type 1 diabetes patients (N=12)
GIR
(mg/
kg·m
in)
Time (minutes)

• Mean (+/- SE) change in FEV1 (L) from baseline for type 1 and type 2 diabetes patients
Cha
nge
from
Bas
elin
e in
FEV
1(L
)
Visit
0.1
0
-0.1
-0.2
-0.3
Afrezza®
Comparator
3 6 9 12 15 18 21 24 Month
Month Baseline 3 6 9 12 18 24Afrezza®, n 1532 1173 1058 454 801 507 380Comparator, n 1542 1262 1202 519 957 674 596
Please see full Important Safety Information for Afrezza® at the beginning of this section. Please see full Prescribing Information, including Boxed WARNING, available at this event. Afrezza® Prescribing Information. October 2014.
• Afrezza® had a 40 mL (95% CI: -80, -1) greater decline from baseline in FEV1 compared to other anti-diabetes treatments
Important Safety Information for Afrezza®
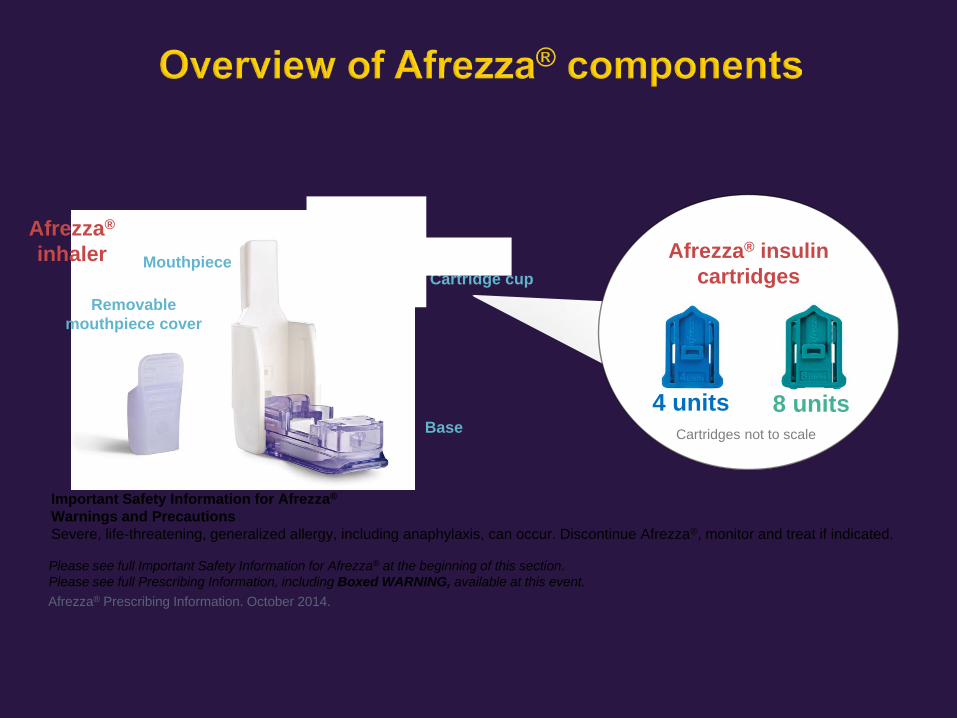
Warnings and PrecautionsSevere, life-threatening, generalized allergy, including anaphylaxis, can occur. Discontinue Afrezza®, monitor and treat if indicated.
Afrezza® Prescribing Information. October 2014.
Please see full Important Safety Information for Afrezza® at the beginning of this section. Please see full Prescribing Information, including Boxed WARNING, available at this event.
Afrezza® insulin cartridges
Cartridges not to scale
4 units 8 units
Afrezza®
inhaler
Removablemouthpiece cover
Mouthpiece
Base
Cartridges
Cartridge cup

Inhaled insulin is slightly less effective than SC insulin, but has much lower risks of hypoglycemia and weight gain1,a
• A1C reduction favors SC insulin (0.16%; P < .05)b
• Hypoglycemia risk favors inhaled insulin (OR 0.61; P < .05)
• Weight gain favors inhaled insulin (–1.6 kg; P < .05)
Respiratory adverse effects are more common with inhaled insulin than SC insulin1,a
• Mild, transient, dry cough (OR 7.82; P < .05)
• Slight decline in FEV1 (–0.04 L; P < .05)
Mild-to-moderate acute or chronic respiratory disease does not PK of inhaled insulin2,3
• URTI did not significantly affect the PK/PD properties of inhaled insulin2
• Mild to moderate COPD did not significantly alter the PK properties of inhaled insulin3
Recommendations1,2
• For nonpregnant, nonsmoking adults free of pulmonary disease who are needlephobic and would otherwise delay initiating or intensifying insulin therapy1
• If URTI prevents proper inhalation, substitute SC insulin2
a Meta-analysis of 12 trials with 5273 individuals with T1DM or T2DM; b noninferiority study designs may have biased this comparison.
1. Westcott GP, et al. Diabetes. 2015;64(suppl 1A);LB25 [abstract 96-LB].2. Levin PA, et al. Diabetes. 2015;64(suppl 1A):LB24 [abstract 94-LB].
3. Potocka E, et al. Curr Med Res Opin. 2010;26:2347-2353.

Randomized crossover trial of 24 patients with T2DM with normal lung function.a Dance-501 is not currently approved by the US FDA. Zijlstra E, et al. Diabetes. 2015;64(suppl 1):A248 [abstract 978-P].
Dose levels:• LIS med: 18 U• INH high: 207.7 IU, equivalent to SC: 27 IU• INH med: 138.5 IU 18 IU• INH low: 69.2 IU 9 IU
4
3
2
1
0
GIR
, mg/
kg/m
in
0 240 360 480 600 720Time (min)
120
Time-Action Profile
LIS medINH highINH medINH low
• Inhaler device produces a fine mist of aerosolized liquid human insulin for inhalation
• Coughing observed in 0.6% of inhalations
• No clinically relevant changes in measures of lung function at postinhalation or during follow-up

Pharmacokinetics Pharmacodynamics
PK/PD data generated from a study of 10 patients with T1DM. http://uspl.lilly.com/humalog/humalog.html#pi.
Potentially offers the advantage of a smaller injection volume for patients with high prandial insulin requirements
0 240 360 480300 420
Time, min120 18060
250
200
150
100
0
Blo
od G
luco
se, m
g/dL
50
LIS 0.2 U/kg (n = 10)RHI (n = 10); mean dose, 15.4 U
0 240 360 480300 420
Time, min120 18060
80
70
50
30
0
10
20
40
60
Seru
m F
ree
Insu
lin
Con
cent
ratio
n, m
U/L Humanlog (n=10)
LIS 0.2 U/kg (n = 10)RHI (n = 10);mean dose, 15.4 U
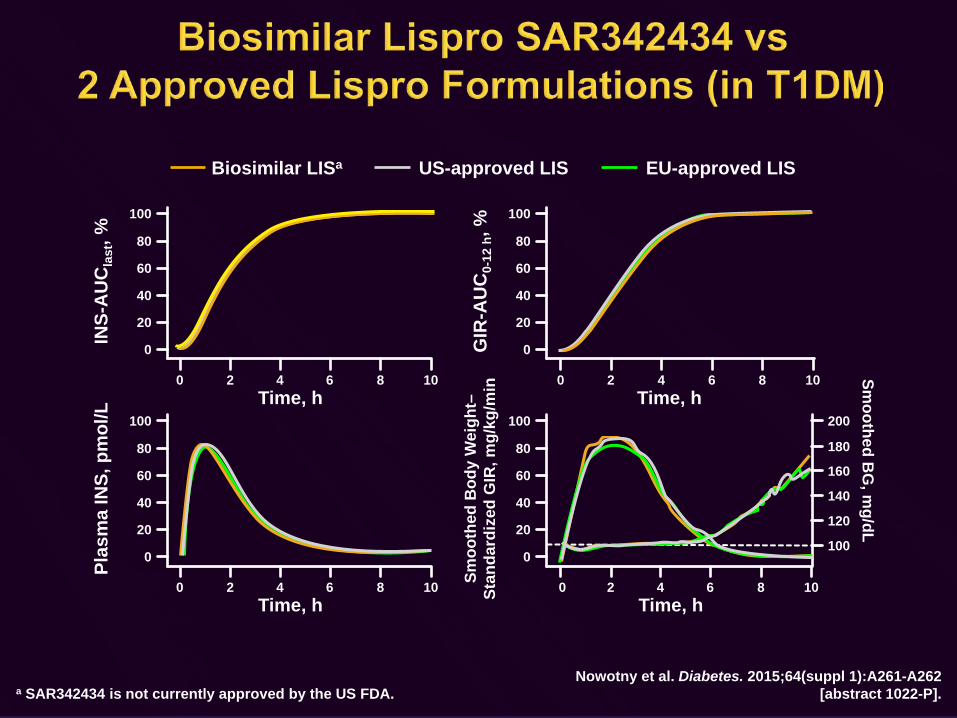
a SAR342434 is not currently approved by the US FDA.Nowotny et al. Diabetes. 2015;64(suppl 1):A261-A262
[abstract 1022-P].
0 4 6 8 10
INS-
AU
Cla
st, %
Time, h2
0
20
40
60
80
100
0 4 6 8 10
GIR
-AU
C0-
12 h
, %
Time, h2
0
20
40
60
80
100
0 4 6 8 10
Plas
ma
INS,
pm
ol/L
Time, h2
0
20
40
60
80
100
0 4 6 8 10Smoo
thed
Bod
y W
eigh
t–St
anda
rdiz
ed G
IR, m
g/kg
/min
Time, h2
0
20
40
60
80
100
Biosimilar LISa US-approved LIS EU-approved LIS
100
120
140
180
200
160
Smoothed B
G, m
g/dL

Randomized, 4-period crossover study in 38 male patients with T1DM.a BC lispro is not currently approved by the US FDA.b 0.2 units/kg dose. Andersen G, et al. Diabetes. 2015;64(suppl 1):A248 [abstract 979-P].
Difference in GIR Between BC LIS and LIS
0
1
2
3
4
5
6
7
8
0 60 120 180 240 300 360 420 480
BC LIS 0.2 U/kgLIS 0.2 U/kg
Time, min
GIR
, mg/
kg/m
in
0 60 120 180 240 300 360 420 480
Time, min
0
2
4
6
8
10
12
GIR
, mg/
kg/m
in
BC LIS 0.2 U/kgBC LIS 0.1 U/kg
BC LIS 0.4 U/kg
BC LIS Linear Dose Response
• 48% earlier t1/2 max for BC lispro vs lispro (14 min vs 27 min, P < .0001)b
• 67% higher GIR for BC lispro in the first hour postinjection (P < .0001)b
• 18% lower GIR for BC lispro at 3-8 hours postinjection (P < .02)b
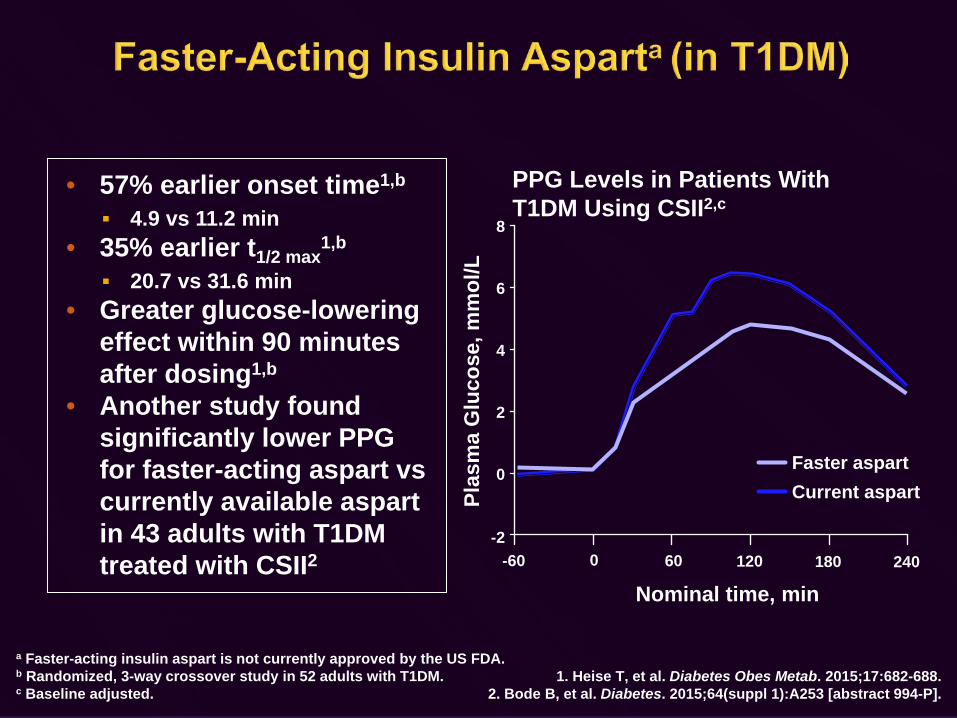
a Faster-acting insulin aspart is not currently approved by the US FDA.b Randomized, 3-way crossover study in 52 adults with T1DM. c Baseline adjusted.
1. Heise T, et al. Diabetes Obes Metab. 2015;17:682-688.2. Bode B, et al. Diabetes. 2015;64(suppl 1):A253 [abstract 994-P].
PPG Levels in Patients With T1DM Using CSII2,c
-2
2
4
6
8
0
-60 60 120 180 240
Nominal time, min0
Plas
ma
Glu
cose
, mm
ol/L
Faster aspartCurrent aspart
• 57% earlier onset time1,b
4.9 vs 11.2 min• 35% earlier t1/2 max
1,b
20.7 vs 31.6 min• Greater glucose-lowering
effect within 90 minutes after dosing1,b
• Another study found significantly lower PPG for faster-acting aspart vs currently available aspartin 43 adults with T1DM treated with CSII2
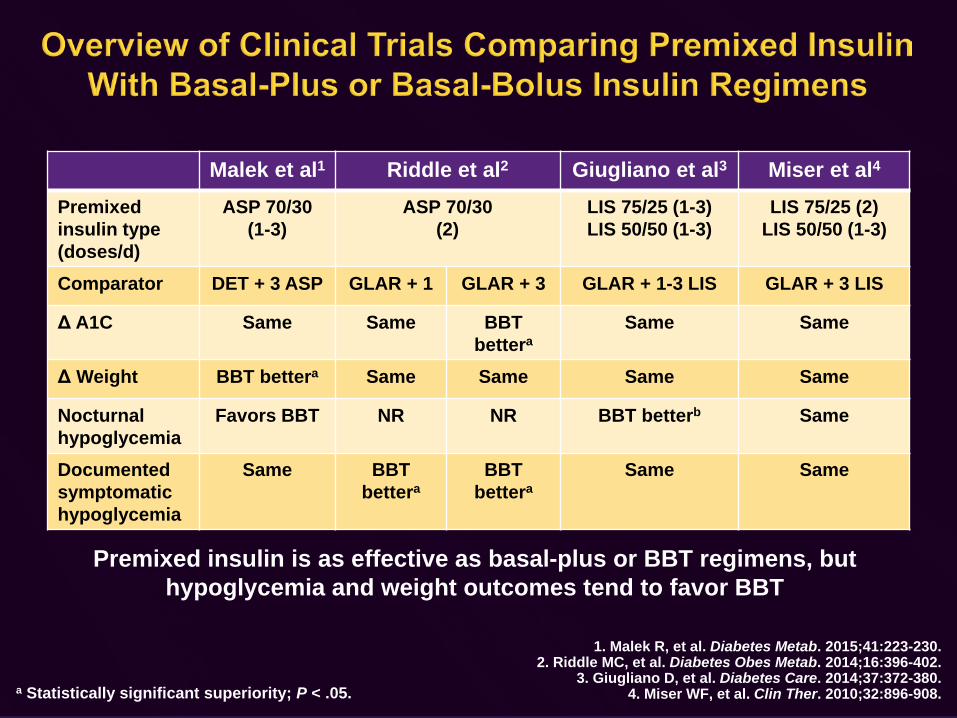
Malek et al1 Riddle et al2 Giugliano et al3 Miser et al4
Premixed insulin type (doses/d)
ASP 70/30(1-3)
ASP 70/30 (2)
LIS 75/25 (1-3)LIS 50/50 (1-3)
LIS 75/25 (2)LIS 50/50 (1-3)
Comparator DET + 3 ASP GLAR + 1 GLAR + 3 GLAR + 1-3 LIS GLAR + 3 LIS
Δ A1C Same Same BBTbettera
Same Same
Δ Weight BBT bettera Same Same Same Same
Nocturnal hypoglycemia
Favors BBT NR NR BBT betterb Same
Documented symptomatic hypoglycemia
Same BBTbettera
BBTbettera
Same Same
a Statistically significant superiority; P < .05.
1. Malek R, et al. Diabetes Metab. 2015;41:223-230.2. Riddle MC, et al. Diabetes Obes Metab. 2014;16:396-402.
3. Giugliano D, et al. Diabetes Care. 2014;37:372-380.4. Miser WF, et al. Clin Ther. 2010;32:896-908.
Premixed insulin is as effective as basal-plus or BBT regimens, but hypoglycemia and weight outcomes tend to favor BBT

Confirmed Hypoglycemia Mean Weight Change
446 patients with T2DM previously using premixed or self-mixed insulin with or without oral agents. Both insulins were dosed twice daily. Confirmed hypoglycemia, plasma glucose < 56 mg/dL or assistance required. Fulcher GR, et al. Diabetes Care. 2014;37:2084-2090.
P < .05
Similar A1C change, but more patients attained A1C < 7% without confirmed hypoglycemia using premixed DEG + ASP than with ASP 70/30 (21.8% vs 14.9%; P = .041)
1.72.2
0
1
2
3
4
5
Premixed DEG +ASP
ASP 70/30
Wei
ght C
hang
e, k
g
0 16 18 20 22 24 26Time Since Randomization, weeks
0
2
4
5
6
7
Con
firm
ed H
ypog
lyce
mia
(cum
ulat
ive
even
ts p
er
patie
nt),
n
3
1
2 6 84 10 12 14
DEG + ASP ASP 70/30
32% reduction, P = .0049
• The glucose-suppressing effect of prandial insulins is critically dependent on when the doses are administered relative to meals
• Inhaled insulins have very rapid onset and offset compared with subcutaneous fast-acting insulin
• Faster-acting subcutaneous insulins may reduce PPG concentrations more rapidly than other subcutaneous prandial insulins
• Faster-acting insulins are less likely to cause hypoglycemia than other insulins; patients tend to prefer agents with lower risks of hypoglycemia
• Premixed insulin may be an appropriate alternative to basal-plus or basal-bolus insulin for some patients

Glycemic control• A1C < 7%• A1C ≤ 6.5%
Weight gain• No weight gain• < 1 kg weight
gain
Hypoglycemia• No severe
hypoglycemia• No symptomatic
hypoglycemia
Original criteria proposed by Zinman et al are shown in italics. Zinman B, et al. Diabetes Obes Metab. 2012;14:77-82.

• Current guidelines for intensifying basal insulin regimens: ADA/EASD: consider a trial of a GLP-1 RA; consider a
SGLT2 inhibitor or low-dose TZD in selected patients1
AACE/ACE: consider a GLP-1 RA, SGLT2 inhibitor, or DPP-4 inhibitor2
Use of a GLP-1 RA as an alternative to prandial insulin is a new recommendation in both guidelines1,2
• Consult the back of the program book for full treatment recommendations and algorithms
1. Inzucchi SE, et al. Diabetes Care. 2015;38:140-149.2. Garber AJ, et al. Endocr Pract. 2015;21:438-447.

Adding EXN BID to InsulinFLAT-SUGAR1,2,a
Parameter Basal INS + Prandial INS
+ MET(n = 50)
Basal INS + EXN
+ MET(n = 52)
BL A1C, %1,2 7.9 8.0End A1C, %2 7.2 7.1
BL Wt, kg1 99.7 101.3Δ Wt, kg2 0.8 −4.7 (P < .001)
Severe hypo, n2 0 0Overall hypo2 NR NR
Adding Insulin to EXN BIDArakaki et al3,b
Parameter EXN BID + GLAR QD
(n = 168)
EXN BID + ILPS QDc
(n = 171)BL A1C, % 8.2 8.2
End A1C, % 6.8 7.0BL Wt, kg 102.3 101.6
Δ Wt, kg 0.7 0.3 (P = NS)Severe hypo, % 0 1.8Overall hypo, % 74.9 70.6
a EXN administered at 2-3 meals daily, prandial insulin administered at 3 meals daily1; b EXN administered twice daily, basal insulin administered at bedtime3; c ILPS is not approved by the US FDA except as a component of premixed lispro 50/50 and 75/25.
1. FLAT-SUGAR Trial Investigators. Diabetes Care. 2015;38:1558-1566.2. Hirsch IB, et al. Diabetes. 2015;64(suppl 1):A100 [abstract 385-OR].
3. Arakaki RF, et al. Diabetes Obes Metab. 2014;16:510-518.
• Glycemic variability (MAGE) was improved in the EXN BID group but not in the prandial insulin group2
• Proportions of patients attaining A1C < 7% without hypoglycemia were similar: 11.4% GLAR; 10.0% ILPS3
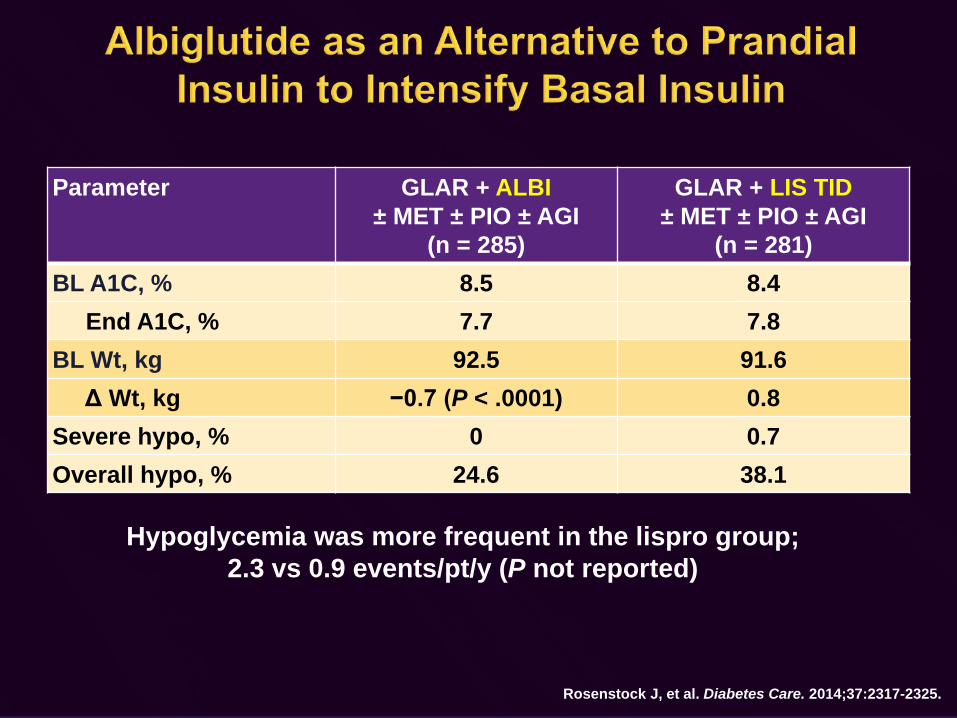
Parameter GLAR + ALBI± MET ± PIO ± AGI
(n = 285)
GLAR + LIS TID± MET ± PIO ± AGI
(n = 281)BL A1C, % 8.5 8.4
End A1C, % 7.7 7.8BL Wt, kg 92.5 91.6
Δ Wt, kg −0.7 (P < .0001) 0.8Severe hypo, % 0 0.7Overall hypo, % 24.6 38.1
Rosenstock J, et al. Diabetes Care. 2014;37:2317-2325.
Hypoglycemia was more frequent in the lispro group; 2.3 vs 0.9 events/pt/y (P not reported)
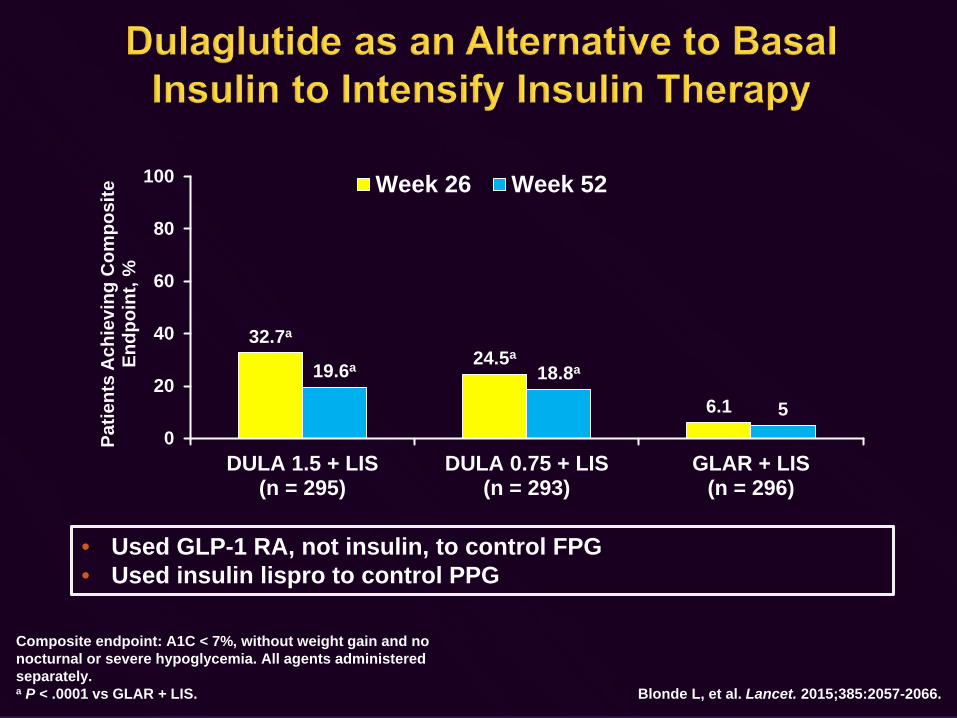
32.7a
24.5a
6.1
19.6a 18.8a
50
20
40
60
80
100
DULA 1.5 + LIS(n = 295)
DULA 0.75 + LIS(n = 293)
GLAR + LIS(n = 296)
Patie
nts
Ach
ievi
ng C
ompo
site
En
dpoi
nt, %
Week 26 Week 52
Composite endpoint: A1C < 7%, without weight gain and no nocturnal or severe hypoglycemia. All agents administered separately.a P < .0001 vs GLAR + LIS. Blonde L, et al. Lancet. 2015;385:2057-2066.
• Used GLP-1 RA, not insulin, to control FPG• Used insulin lispro to control PPG

LIRA + INS vs ↑INS1,a
19
67
0
20
40
60
80
100
↑ INS LIRA + INS
Patie
nts
Ach
ievi
ng
Com
posi
te E
ndpo
int,
%
LIRA + INS vs LIRA2,b
a Composite efficacy definition: A1C ≤ 7.0% with no weight gain and no hypoglycemia; Chinese study population, BL A1C 8.7%-8.8%, BL Wt 86-89 kg; 12 weeks; b Composite efficacy definition: A1C < 7%, Δ Wt ≤ 0 kg, no hypoglycemia; North American and European study population, BL A1C 8.2%-8.3%, BL Wt 99 kg; 26 weeks; c LIXI and LIXI + GLAR are not US FDA approved; d Composite efficacy definition: A1C ≤ 7.0% with no weight gain and no documented symptomatic hypoglycemia; meta-analysis of 5 RCTs.
1. Li CJ, et al. Cardiovasc Diabetol. 2012;11:142.2. DeVries JH, et al. Diabetes Care. 2012;35:1446-1454.
3. Raccah D, et al. J Diabetes Complications. 2014;28:40-44.
921
LIRA LIRA + INS
Add-on Add-onGLU + GLAR vs LIXI + GLAR3,c,d
1529
GLU + GLAR LIXI + GLAR
Add-on
Adding a GLP-1 RA to basal insulin was more effective than increasing the insulin dose, using the GLP-1 RA alone, or adding prandial insulin

PBO + GLAR vs LIXI + GLAR1,a,b
28.6
46.3d
0
20
40
60
80
100
PBO + GLAR LIXI + GLAR
Patie
nts
Ach
ievi
ng
Com
posi
te E
ndpo
int,
%
DEG vs LIRA vs LIRA + DEG2,a,c
14
5236e,f
DEG LIRA LIRA + DEG
a Not US FDA approved; b Composite efficacy definition: A1C < 7%, no hypoglycemia, no weight gain; BL A1C 8.0%; BL BMI 32.1 kg/m2; 24 weeks; c Composite efficacy definition: A1C < 7% without weight gain or hypoglycemia; multinational population, BL A1C 8.3%, BL Wt87 kg; 26 weeks; d P < .05 vs PBO + GLAR; e P < .0001 vs DEG; f P < .0001 vs LIRA.
1. Rosenstock J, et al. Diabetologia. 2014;57(suppl 1) [abstract 241].2. Gough SC, et al. Lancet Diabetes Endocrinol. 2014;2:885-893.
3. Gough SC, et al. Diabetes Obes Metab. 2015 May 15. [Epub ahead of print].
Coformulated Coformulated
At 52 weeks, the proportions meeting the composite endpoints were: 45.7% LIRA (P = .0007 vs LIRA + DEG), 35.7% LIRA + DEG,15.7% DEG (P < .0001 vs LIRA + DEG)3

• Some of the more common etiologies of insulin resistance include: Obesity1
NAFLD1
Corticosteroid use2
• Concentrated insulin is recommended for individuals requiring high insulin doses3
1. Cusi K. Curr Opin Endocrinol Diabetes Obes. 2009;16:141-149.2. Clore JN, Thurby-Hay L. Endocr Pract. 2009;15:469-474.
3. Cochran E, et al. Diabetes Care. 2005;28:1240-1244.
Effect of Insulin Resistance on Response to Insulin Therapy3
Insulin Dose, units
Res
pons
e, %
100
80
60
40
20
00 100 200 300 400 500
Therapeutic target
3 to > 500 U/kg/d
0.5-1 U/kg/d
0.3-0.6 U/kg/d
T1DM T2DM Genetic syndromes
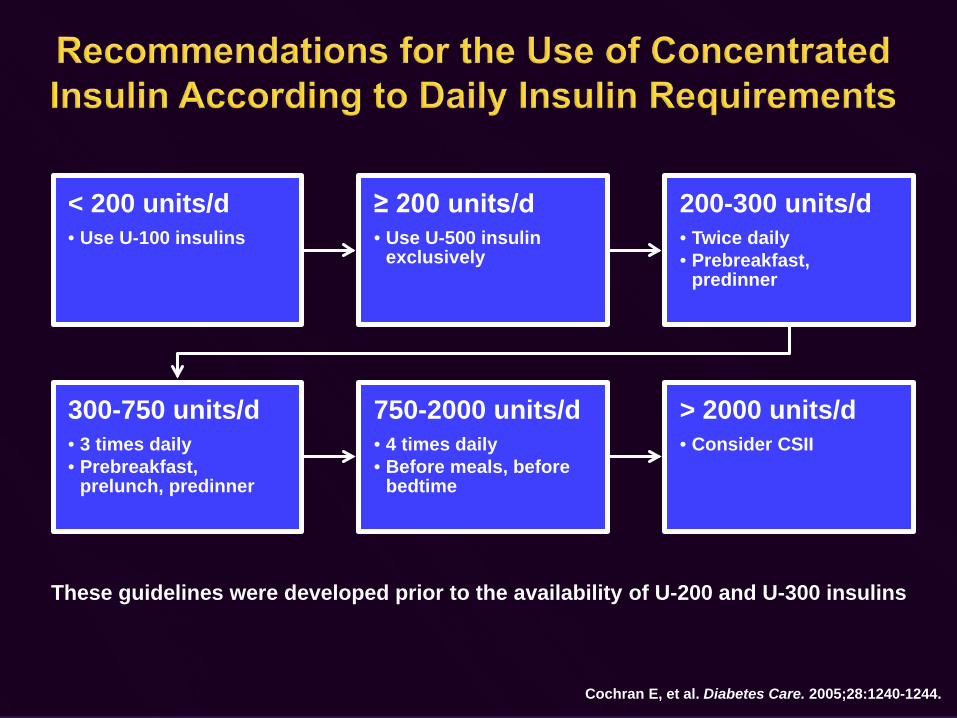
< 200 units/d• Use U-100 insulins
≥ 200 units/d• Use U-500 insulin
exclusively
200-300 units/d• Twice daily • Prebreakfast,
predinner
300-750 units/d• 3 times daily• Prebreakfast,
prelunch, predinner
750-2000 units/d• 4 times daily• Before meals, before
bedtime
> 2000 units/d• Consider CSII
Cochran E, et al. Diabetes Care. 2005;28:1240-1244.
These guidelines were developed prior to the availability of U-200 and U-300 insulins

24-week RCT.a Documented at any time between bedtime and waking, BG ≤ 70 mg/dL; b P < .05; c Documented symptomatic hypoglycemia, BG ≤ 70 mg/dL; d After 4-week run-in using U-100 insulin, 2-10 injections/d. Hood RC, et al. Endocr Pract. 2015;21:782-793.
Parameter TID Dosing (40:30:30)(n = 162)
BID Dosing (60:40) (n = 163)
BL A1C, % 8.7 8.7End A1C, % 7.5 7.4
BL Wt, kg 120.9 122.9Δ Wt, kg 5.4 4.9
Severe hypo, % 1.9 3.7Nocturnal hypo,a % 78 81b
Overall hypo, c % 92b 90BL insulin TDD,d units/kg 2.5 2.4
Δ TDD, units/kg 0.3 0.3• Patients were underinsulinized prior to run-in, despite TDD ≈ 290 units• Insulin TDD was reduced 20% when transitioning from U-100 to U-500 insulin
Glycemic Control
0
10
20
30
40
50
60
70
MET SU MET + SU
Patie
nts
Atta
inin
g A
1C <
7%
, %
Concomitant OAD Use
< 25 ≥ 25 to < 30 ≥ 30
Overall Hypoglycemia
0
2
4
6
8
10
12
MET SU MET + SUEv
ents
per
Pat
ient
-Yea
rConcomitant OAD Use
< 25 ≥ 25 to < 30 ≥ 30
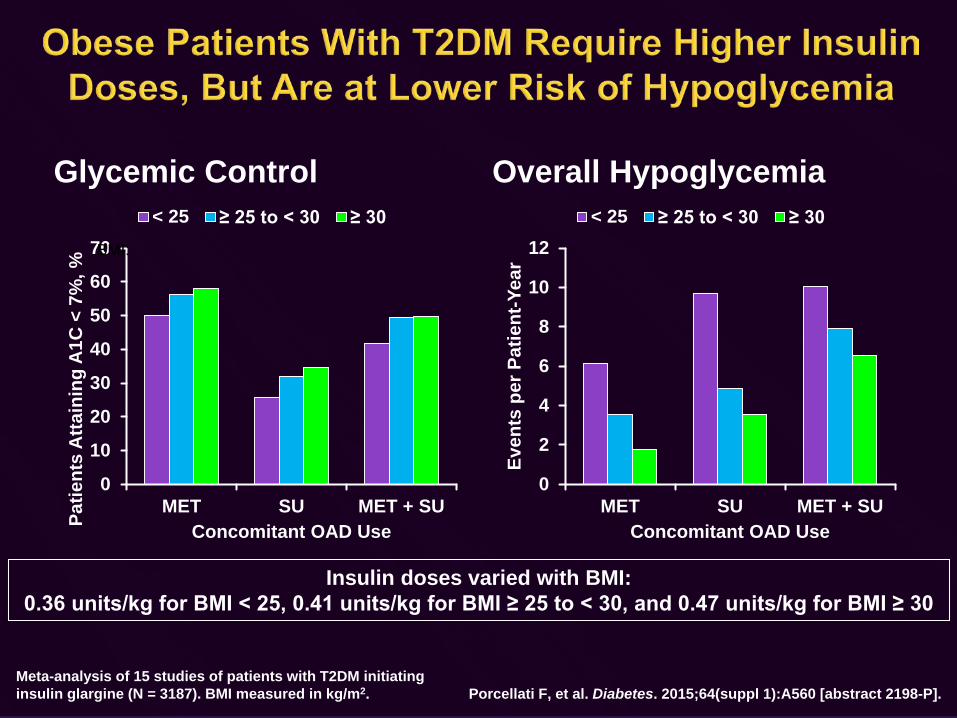
Meta-analysis of 15 studies of patients with T2DM initiating insulin glargine (N = 3187). BMI measured in kg/m2. Porcellati F, et al. Diabetes. 2015;64(suppl 1):A560 [abstract 2198-P].
Insulin doses varied with BMI: 0.36 units/kg for BMI < 25, 0.41 units/kg for BMI ≥ 25 to < 30, and 0.47 units/kg for BMI ≥ 30
BMI:
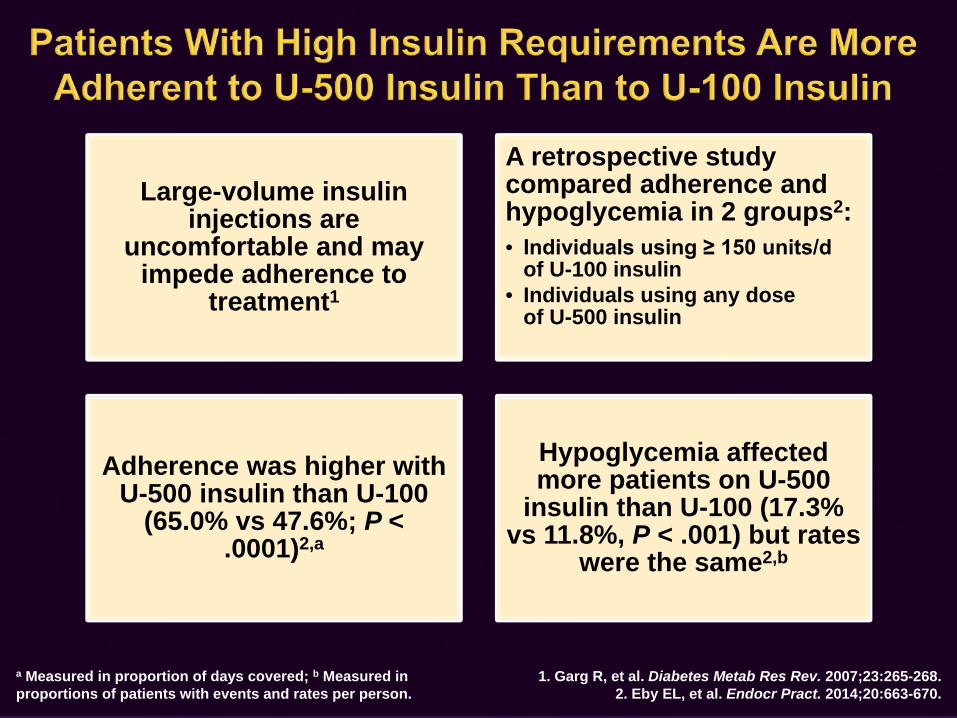
Large-volume insulin injections are
uncomfortable and may impede adherence to
treatment1
A retrospective study compared adherence and hypoglycemia in 2 groups2:• Individuals using ≥ 150 units/d
of U-100 insulin• Individuals using any dose
of U-500 insulin
Adherence was higher with U-500 insulin than U-100
(65.0% vs 47.6%; P < .0001)2,a
Hypoglycemia affected more patients on U-500
insulin than U-100 (17.3% vs 11.8%, P < .001) but rates
were the same2,b
a Measured in proportion of days covered; b Measured in proportions of patients with events and rates per person.
1. Garg R, et al. Diabetes Metab Res Rev. 2007;23:265-268.2. Eby EL, et al. Endocr Pract. 2014;20:663-670.
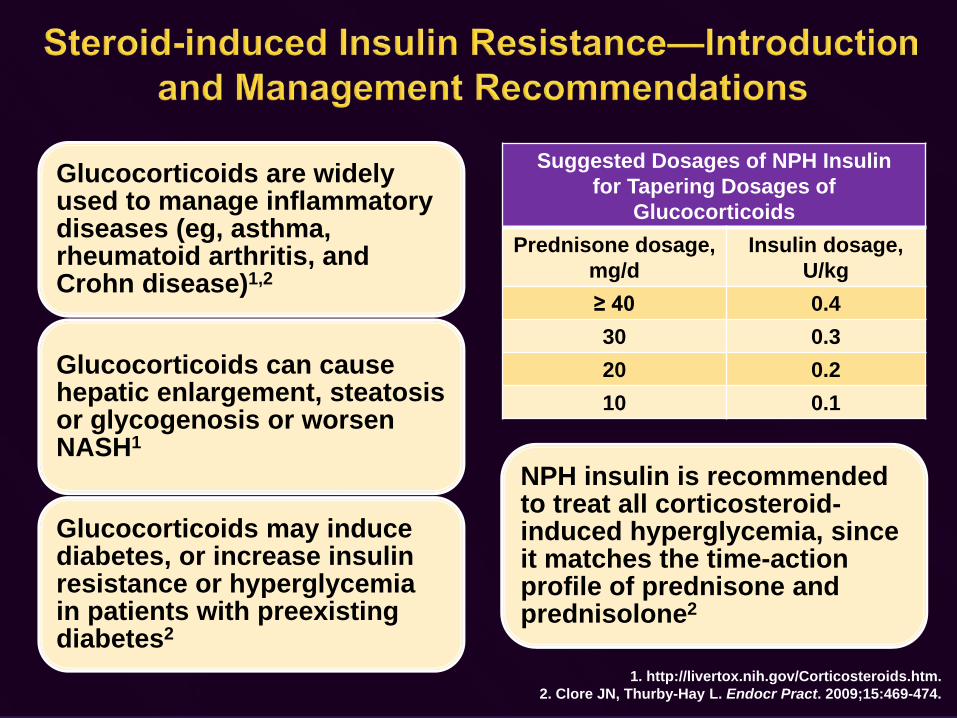
Glucocorticoids are widely used to manage inflammatory diseases (eg, asthma, rheumatoid arthritis, and Crohn disease)1,2
Glucocorticoids can cause hepatic enlargement, steatosis or glycogenosis or worsen NASH1
Glucocorticoids may induce diabetes, or increase insulin resistance or hyperglycemia in patients with preexisting diabetes2
1. http://livertox.nih.gov/Corticosteroids.htm.2. Clore JN, Thurby-Hay L. Endocr Pract. 2009;15:469-474.
Suggested Dosages of NPH Insulinfor Tapering Dosages of
GlucocorticoidsPrednisone dosage,
mg/dInsulin dosage,
U/kg≥ 40 0.430 0.320 0.210 0.1
NPH insulin is recommended to treat all corticosteroid-induced hyperglycemia, since it matches the time-action profile of prednisone and prednisolone2
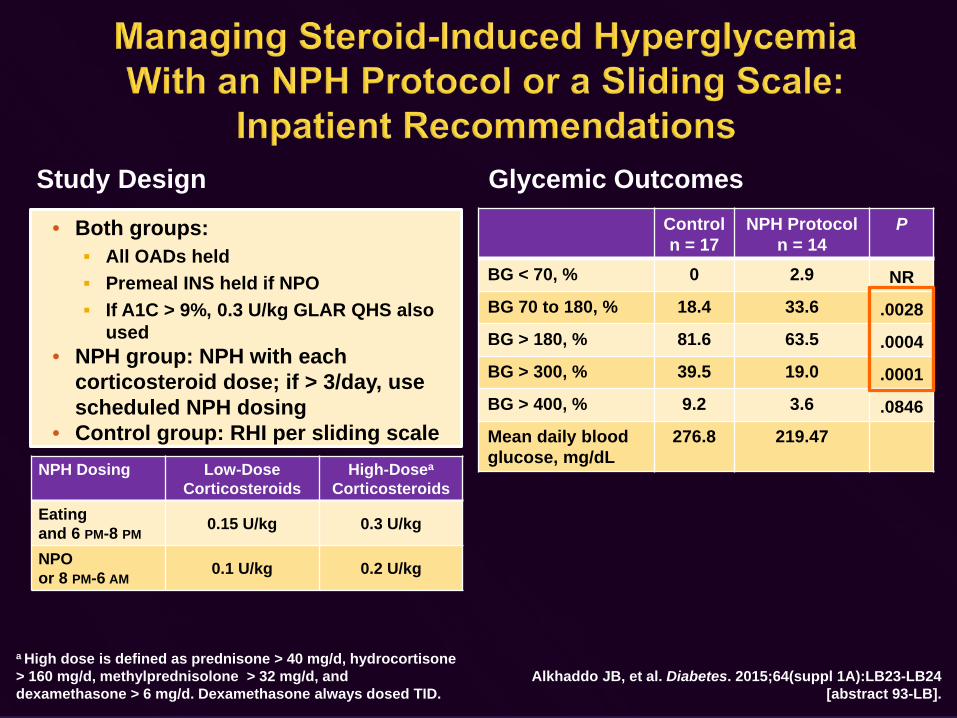
a High dose is defined as prednisone > 40 mg/d, hydrocortisone > 160 mg/d, methylprednisolone > 32 mg/d, and dexamethasone > 6 mg/d. Dexamethasone always dosed TID.
Alkhaddo JB, et al. Diabetes. 2015;64(suppl 1A):LB23-LB24 [abstract 93-LB].
Controln = 17
NPH Protocoln = 14
P
BG < 70, % 0 2.9 NRBG 70 to 180, % 18.4 33.6 .0028BG > 180, % 81.6 63.5 .0004BG > 300, % 39.5 19.0 .0001BG > 400, % 9.2 3.6 .0846Mean daily blood glucose, mg/dL
276.8 219.47
NPH Dosing Low-Dose Corticosteroids
High-Dosea
CorticosteroidsEating and 6 PM-8 PM
0.15 U/kg 0.3 U/kg
NPOor 8 PM-6 AM
0.1 U/kg 0.2 U/kg
• Both groups: All OADs held Premeal INS held if NPO If A1C > 9%, 0.3 U/kg GLAR QHS also
used• NPH group: NPH with each
corticosteroid dose; if > 3/day, use scheduled NPH dosing
• Control group: RHI per sliding scale
Glycemic OutcomesStudy Design

Glycemic Control
Meta-analysis of 5 RCTs including 1169 patients with T2DM requiring > 60 units/day basal insulin, BL BMI 33.6 kg/m2. Insulin doses increased ≈ 66 units during the trial (final doses: DEG, 0.98 units/kg; GLAR, 0.92 units/kg). Rodbard HW, et al. Endocr Pract. 2014;20:285-292.
Weight change was similar (estimated treatment difference DEG vs GLAR, −0.13 kg; P = .65)
Overall Confirmed Hypoglycemia
Nocturnal Confirmed Hypoglycemia
A1C
, %
6.0
7.0
8.0
9.0
6.0
Estimated treatment difference:6.05%; P = .44
BL EOTDEG
BL EOTGLAR
8.4
7.2
8.5
7.2
FPG
, mg/
dL
200Estimated treatment difference:
−5.9 mg/dL; P= .04
BL EOTDEG
BL EOTGLAR
176
115
180
120
180160140120100
8060
0.125 0.25 0.5 1 2 4 8
Dose group, U
> 60
All
Favors DEG Favors GLAR
0.125 0.25 0.5 1 2 4 8
Dose group, U
> 60
All
Favors DEG Favors GLAR

Comparison (over 16 weeks)
U-200 Degludec vs U-100 Glargine
Insulin dose No difference
Split doses Favors U-200 degludec(64.4% vs 95.6%)
A1C reduction No difference (noninferiority study)(P = NS)
Mean Δ FPG Favors U-200 degludec (−14.5 vs −0.5 mg/dL; P < .05)
Nocturnal hypoglycemia Favors U-200 degludec (34% lower, P = NS)
Any hypoglycemia Favors U-200 degludec(41% lower; P < .05)
Body weight Favors U-200 degludec(0.9 vs 2.3 lb, P = NS)
2-period crossover study of 145 patients with T2DM, 2 oral agents, and prerandomization basal glargine dose ≥ 81 units. Warren M, et al. Diabetes. 2015;64(suppl 1):A266-A267
[abstract 1040-P].
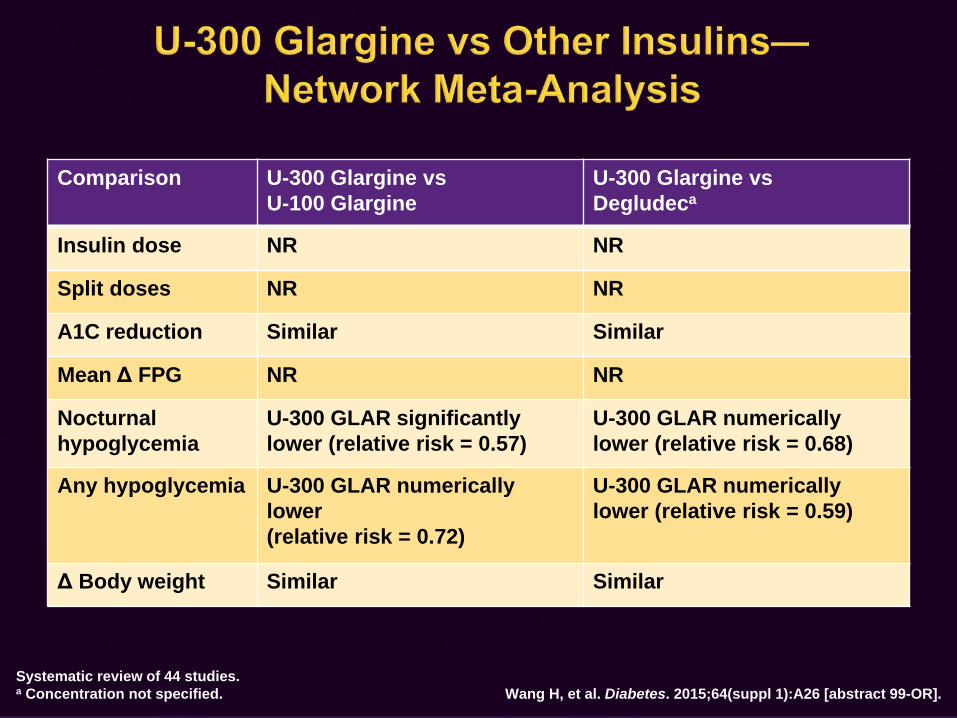
Comparison U-300 Glargine vs U-100 Glargine
U-300 Glargine vs Degludeca
Insulin dose NR NR
Split doses NR NR
A1C reduction Similar Similar
Mean Δ FPG NR NR
Nocturnal hypoglycemia
U-300 GLAR significantlylower (relative risk = 0.57)
U-300 GLAR numerically lower (relative risk = 0.68)
Any hypoglycemia U-300 GLAR numerically lower(relative risk = 0.72)
U-300 GLAR numerically lower (relative risk = 0.59)
Δ Body weight Similar Similar
Systematic review of 44 studies.a Concentration not specified. Wang H, et al. Diabetes. 2015;64(suppl 1):A26 [abstract 99-OR].
• Many patients with T2DM have high daily insulin requirements Patients with obesity Patients with NAFLD—insulin treatment may reduce liver
volume Corticosteroid-treated patients
• Concentrated insulins permit delivery of high insulin doses with a smaller injection volume, reducing injection discomfort
• Concentrated insulin improves glycemic control in patients with high insulin requirements
• Several new concentrated insulins have been approved, and more are in development
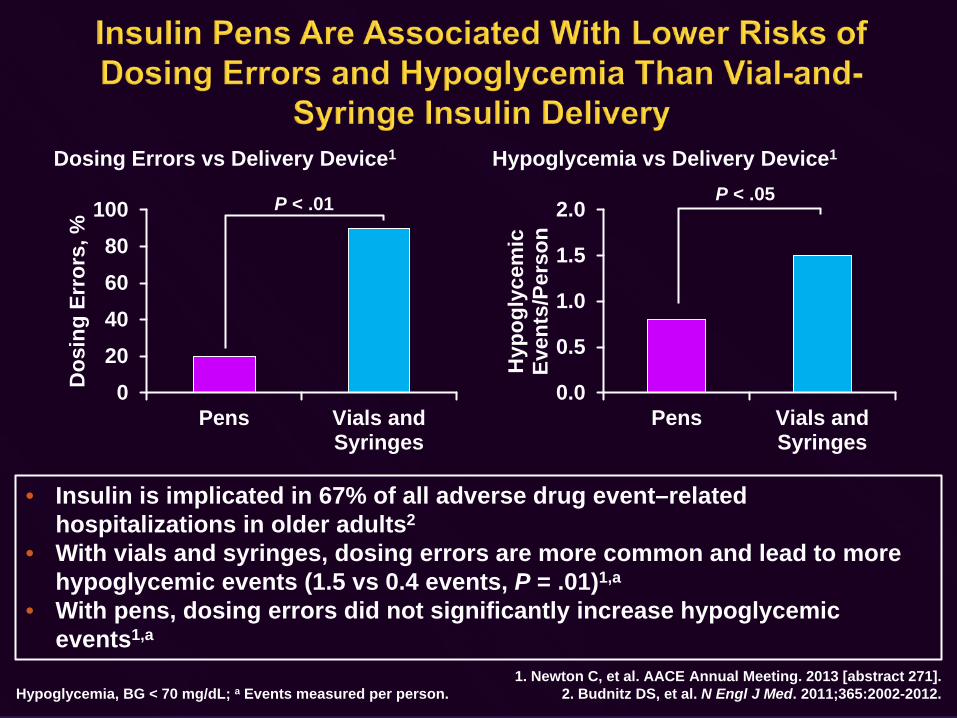
Dosing Errors vs Delivery Device1
020406080
100
Pens Vials andSyringes
Dos
ing
Erro
rs, %
Hypoglycemia vs Delivery Device1
0.0
0.5
1.0
1.5
2.0
Pens Vials andSyringes
Hyp
ogly
cem
ic
Even
ts/P
erso
n
Hypoglycemia, BG < 70 mg/dL; a Events measured per person.1. Newton C, et al. AACE Annual Meeting. 2013 [abstract 271].
2. Budnitz DS, et al. N Engl J Med. 2011;365:2002-2012.
• Insulin is implicated in 67% of all adverse drug event–related hospitalizations in older adults2
• With vials and syringes, dosing errors are more common and lead to more hypoglycemic events (1.5 vs 0.4 events, P = .01)1,a
• With pens, dosing errors did not significantly increase hypoglycemic events1,a
P < .01 P < .05
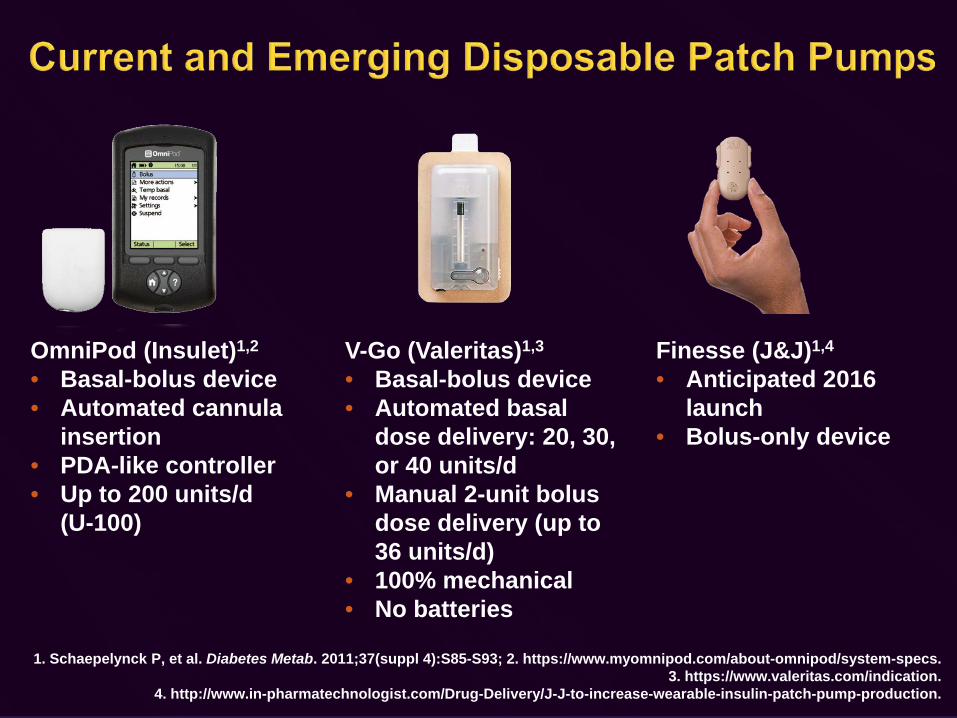
1. Schaepelynck P, et al. Diabetes Metab. 2011;37(suppl 4):S85-S93; 2. https://www.myomnipod.com/about-omnipod/system-specs.3. https://www.valeritas.com/indication.
4. http://www.in-pharmatechnologist.com/Drug-Delivery/J-J-to-increase-wearable-insulin-patch-pump-production.
OmniPod (Insulet)1,2
• Basal-bolus device• Automated cannula
insertion• PDA-like controller• Up to 200 units/d
(U-100)
Finesse (J&J)1,4
• Anticipated 2016 launch
• Bolus-only device
V-Go (Valeritas)1,3
• Basal-bolus device• Automated basal
dose delivery: 20, 30, or 40 units/d
• Manual 2-unit bolus dose delivery (up to 36 units/d)
• 100% mechanical• No batteries

-0.8
-1.9
-3.2
-0.6
-1.5
-2.4
-1.1
-2.2
-3.7
-2.6
-3.8-4
-3.5
-3
-2.5
-2
-1.5
-1
-0.5
07.2%-8.9% 9.0%-10.4% 10.5%-13.9%
Cha
nge
in A
1C F
rom
B
asel
ine,
%
All cohorts (n = 151)MDI (n = 86)Basal (n = 45)Insulin naive (n = 20)
Retrospective study of 151 patients with T2DM, 6 months after switching to a V-Go patch pump. Lajara R, et al. Diabetes. 2015;64(suppl 1):A278 [abstract 1083-P].
Baseline A1C (by tertile)
• All A1C reductions from baseline were statistically significant (P < .05)• A1C reductions were greater in patients with less intensive insulin therapy at baseline

1. Lane WS, et al. Endocr Pract. 2010;16:778-784.2. Lane WS, et al. Endocr Pract. 2013;19:196-201.
0
2
4
6
8
10
A1C
A1C
, %
Baseline EOT
1.35
3.7
0
1
2
3
4
5
BG < 70 mg/dL
Tim
e in
H
ypog
lyce
mia
, %
Baseline EOT
Efficacy Hypoglycemia Weight Change
5.4
0123456
Weight
Wei
ght C
hang
e, k
g
BL Wt: 113.7 N = 21
• 1 severe hypoglycemic episode reported1,a
• Range of weight change: −6.4 to +13.1 kg1
• Insulin doses changed from 1.73 to 1.75 units/kg1
• Durable CSII use up to 9.5 years resulted in sustained A1C reduction with change in body weight correlated with TDD; severe hypoglycemia rate = 0.1 event/person/year2
P < .001 P = .149
a Assistance required, (BG = 39 mg/dL).1

Data shown from crossover study of 20 patients with T1DM. Luijf YM, et al. Diabetes Technol Ther. 2013;15:575-579.
• Insulin absorption is significantly faster 3 days after catheter insertion for both durable and patch pumps
• The effect of wear time needs to be considered in insulin dosing
Postprandial Insulin Levels Postprandial Glucose Levels
Insu
lin, p
mol
/L
500
400
300
200
0
100
0 60 120 180 240 300
Time, minG
luco
se, m
g/dL
200
180
160
140
100
120
0 60 120 180 240 300
Time, min
PP day 1CP day 1PP day 3CP day 3
PP day 1CP day 1PP day 3CP day 3

a IDF recommendations in individuals with T2DM who are not treated with insulin.
1. http://www.idf.org/webdata/docs/SMBG_EN2.pdf.2. ADA. Diabetes Care. 2015;38(suppl 1):S1-S93.
IDF Focused SMBG1,a
5-Point Profile
Staggered Profile
ADA Recommendations for SMBG2
• In patients using multidose insulin or CSII, perform SMBG: Before meals and snacks Occasionally postprandially At bedtime Prior to exercise When hypoglycemia is suspected After treatment of hypoglycemia
until normoglycemia is acheived Prior to critical tasks, eg driving
• Insufficient data are available to specify SMBG frequency in less-intensive insulin regimens, such as basal insulin + OADs
Mon
Tue
Wed X X X X X
Thu X X X X X
Fri X X X X X
Sat
Sun
Mon X X
Tue X X
Wed X X
Thu X X
Fri X X
Sat X X
Sun X X
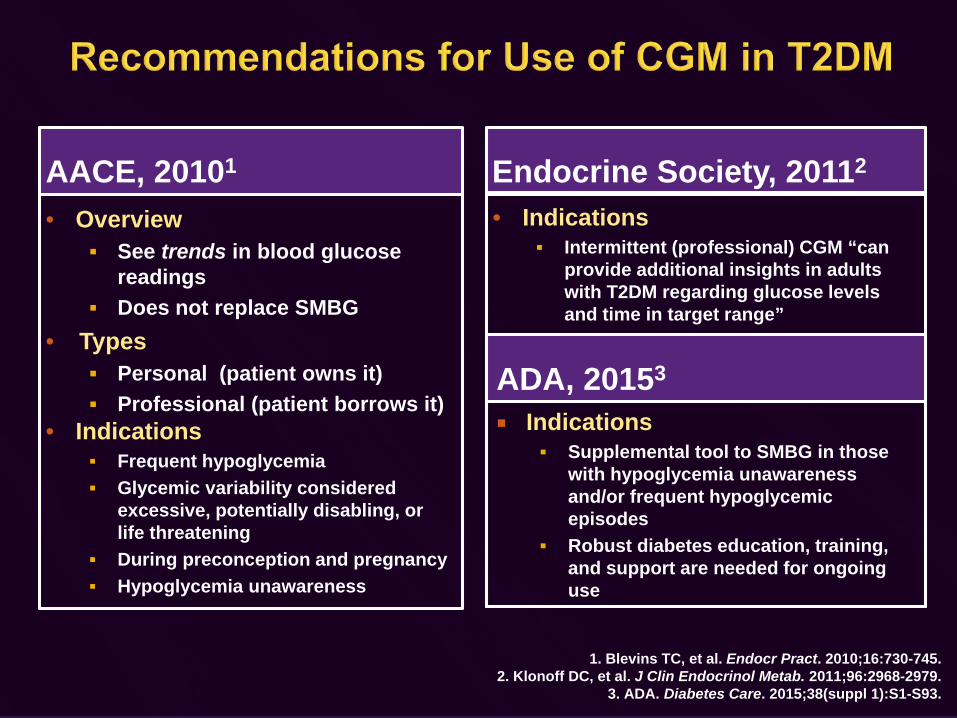
AACE, 20101
• Overview See trends in blood glucose
readings Does not replace SMBG
• Types Personal (patient owns it) Professional (patient borrows it)
• Indications Frequent hypoglycemia Glycemic variability considered
excessive, potentially disabling, or life threatening
During preconception and pregnancy Hypoglycemia unawareness
Endocrine Society, 20112
• Indications Intermittent (professional) CGM “can
provide additional insights in adults with T2DM regarding glucose levels and time in target range”
1. Blevins TC, et al. Endocr Pract. 2010;16:730-745.2. Klonoff DC, et al. J Clin Endocrinol Metab. 2011;96:2968-2979.
3. ADA. Diabetes Care. 2015;38(suppl 1):S1-S93.
ADA, 20153
Indications Supplemental tool to SMBG in those
with hypoglycemia unawareness and/or frequent hypoglycemic episodes
Robust diabetes education, training, and support are needed for ongoing use

1. http://main.diabetes.org/dforg/pdfs/2015/2015-cg-insulin-pumps.pdf; 2. http://www.prnewswire.com/news-releases/tandem-diabetes-care-announces-fda-approval-of-tslim-g4-insulin-pump-with-cgm-integration-300139659.html;
3. http://dexcom.com/news/1257506247-fda-approves-dexcom-g5%C2%AE-mobile-continuous-glucose-monitoring-system;4. http://main.diabetes.org/dforg/pdfs/2015/2015-cg-continuous-glucose-monitors.pdf.
Pump Capacity, units (U-100)
Infusion Sets CGMIntegration
Tandem t:flex1 480 Luer-lock NoRoche Accu-Chek Combo1 315 Luer-lock NoTandem t:slim/t:slim G42 300 Luer-lock Optional (G4)Medtronic MiniMed 530G with Enlite1 180 or 300 Proprietary YesMedtronic MiniMed Paradigm Real-Time Revel1 180 or 300 Proprietary YesSooil Dana Diabecare IIS1 300 Proprietary NoAnimas OneTouch Ping1 200 Luer-lock NoAnimas Vibe1 200 Luer-lock Yes
CGM Sensor duration, days SoftwareDexcom G53 NR BluetoothDexcom G4 Platinum4 7 ProprietaryMedtronic Guardian Real-time4 3 Proprietary
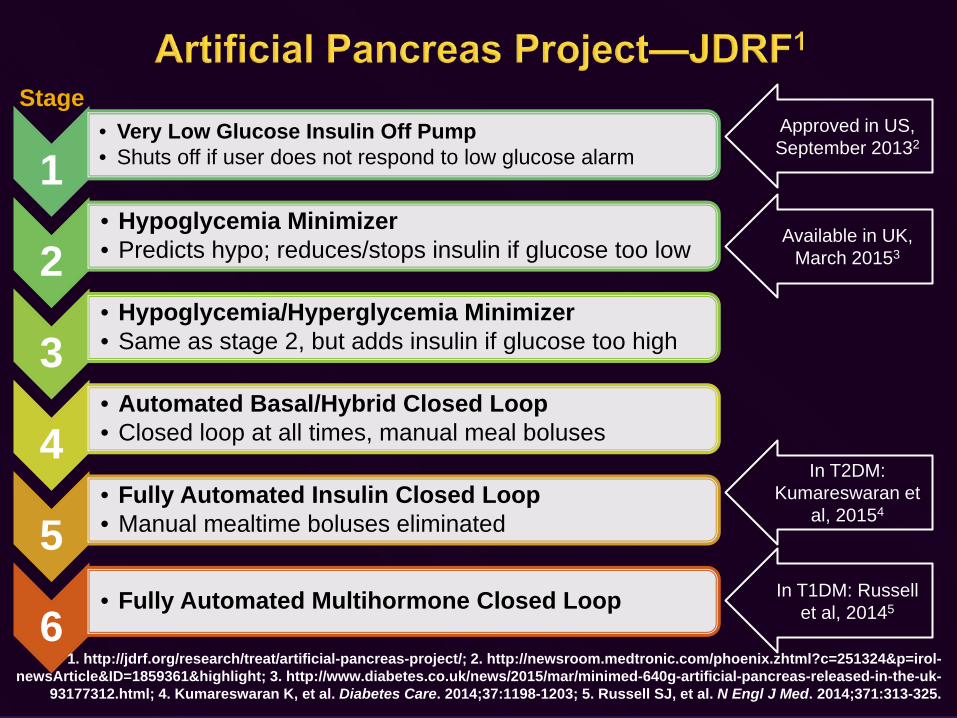
1• Very Low Glucose Insulin Off Pump• Shuts off if user does not respond to low glucose alarm
2• Hypoglycemia Minimizer• Predicts hypo; reduces/stops insulin if glucose too low
3• Hypoglycemia/Hyperglycemia Minimizer• Same as stage 2, but adds insulin if glucose too high
4• Automated Basal/Hybrid Closed Loop• Closed loop at all times, manual meal boluses
5• Fully Automated Insulin Closed Loop• Manual mealtime boluses eliminated
6• Fully Automated Multihormone Closed Loop
1. http://jdrf.org/research/treat/artificial-pancreas-project/; 2. http://newsroom.medtronic.com/phoenix.zhtml?c=251324&p=irol-newsArticle&ID=1859361&highlight; 3. http://www.diabetes.co.uk/news/2015/mar/minimed-640g-artificial-pancreas-released-in-the-uk-
93177312.html; 4. Kumareswaran K, et al. Diabetes Care. 2014;37:1198-1203; 5. Russell SJ, et al. N Engl J Med. 2014;371:313-325.
Stage
In T1DM: Russell et al, 20145
In T2DM: Kumareswaran et
al, 20154
Approved in US, September 20132
Available in UK, March 20153
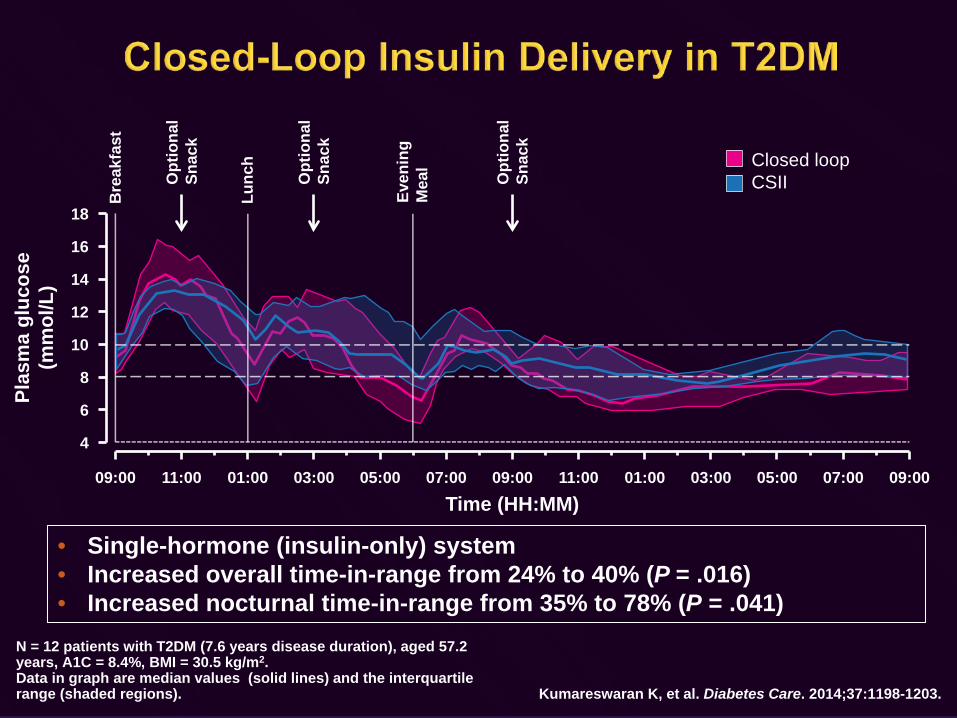
Closed loopCSII
N = 12 patients with T2DM (7.6 years disease duration), aged 57.2 years, A1C = 8.4%, BMI = 30.5 kg/m2. Data in graph are median values (solid lines) and the interquartile range (shaded regions). Kumareswaran K, et al. Diabetes Care. 2014;37:1198-1203.
• Single-hormone (insulin-only) system • Increased overall time-in-range from 24% to 40% (P = .016)• Increased nocturnal time-in-range from 35% to 78% (P = .041)
18
16
14
12
10
8
6
4
Plas
ma
gluc
ose
(mm
ol/L
)
09:00 11:00 01:00 03:00 05:00 07:00 09:00 11:00 01:00 03:00 05:00 07:00 09:00Time (HH:MM)
Bre
akfa
st
Lunc
h
Even
ing
Mea
l
Opt
iona
lSn
ack
Opt
iona
lSn
ack
Opt
iona
lSn
ack
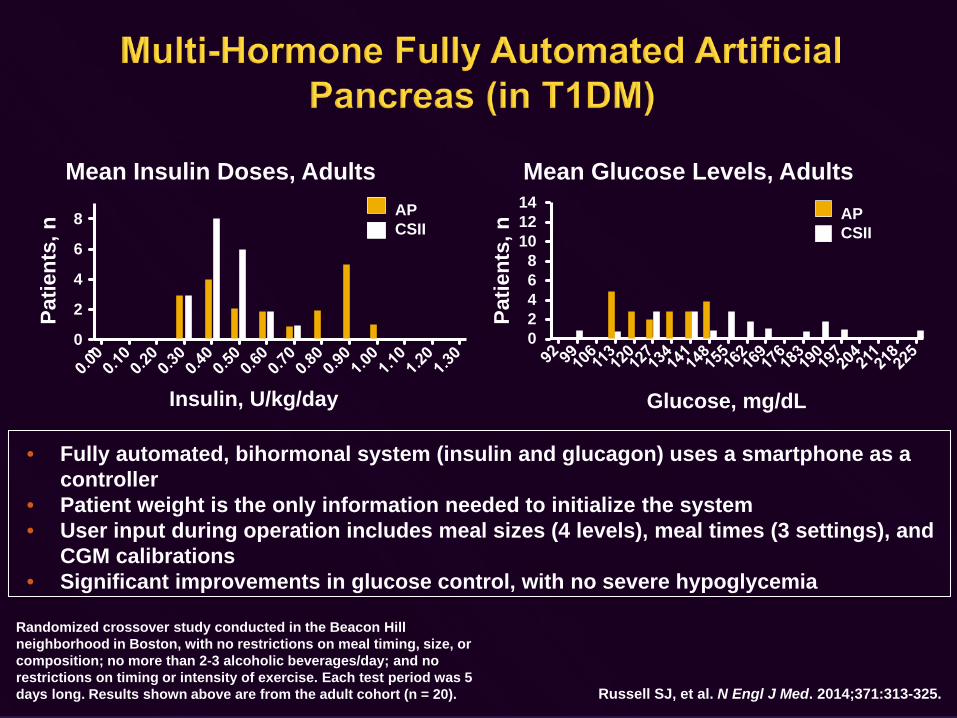
Randomized crossover study conducted in the Beacon Hill neighborhood in Boston, with no restrictions on meal timing, size, or composition; no more than 2-3 alcoholic beverages/day; and no restrictions on timing or intensity of exercise. Each test period was 5 days long. Results shown above are from the adult cohort (n = 20). Russell SJ, et al. N Engl J Med. 2014;371:313-325.
• Fully automated, bihormonal system (insulin and glucagon) uses a smartphone as a controller
• Patient weight is the only information needed to initialize the system• User input during operation includes meal sizes (4 levels), meal times (3 settings), and
CGM calibrations• Significant improvements in glucose control, with no severe hypoglycemia
8
4
2
0
6
Mean Insulin Doses, Adults
Patie
nts,
n
Insulin, U/kg/day
14121086420
Mean Glucose Levels, Adults
Glucose, mg/dL
Patie
nts,
n
APCSII
APCSII
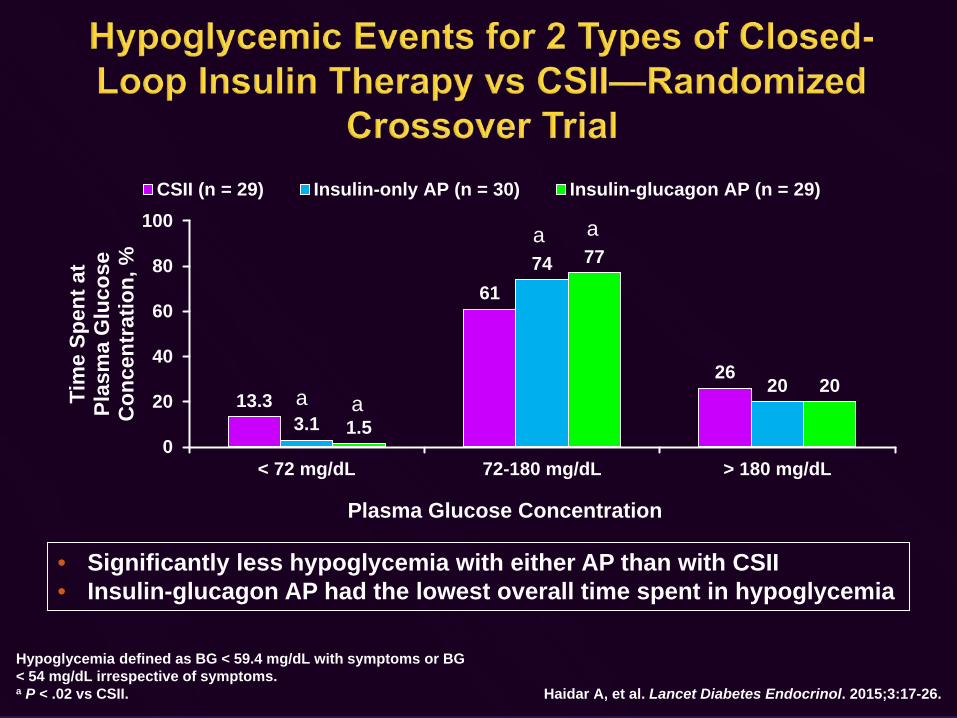
13.3
61
26
3.1
74
20
1.5
77
20
0
20
40
60
80
100
< 72 mg/dL 72-180 mg/dL > 180 mg/dL
Tim
e Sp
ent a
t Pl
asm
a G
luco
se
Con
cent
ratio
n, %
Plasma Glucose Concentration
CSII (n = 29) Insulin-only AP (n = 30) Insulin-glucagon AP (n = 29)
Hypoglycemia defined as BG < 59.4 mg/dL with symptoms or BG < 54 mg/dL irrespective of symptoms.a P < .02 vs CSII. Haidar A, et al. Lancet Diabetes Endocrinol. 2015;3:17-26.
• Significantly less hypoglycemia with either AP than with CSII• Insulin-glucagon AP had the lowest overall time spent in hypoglycemia
a a
a a
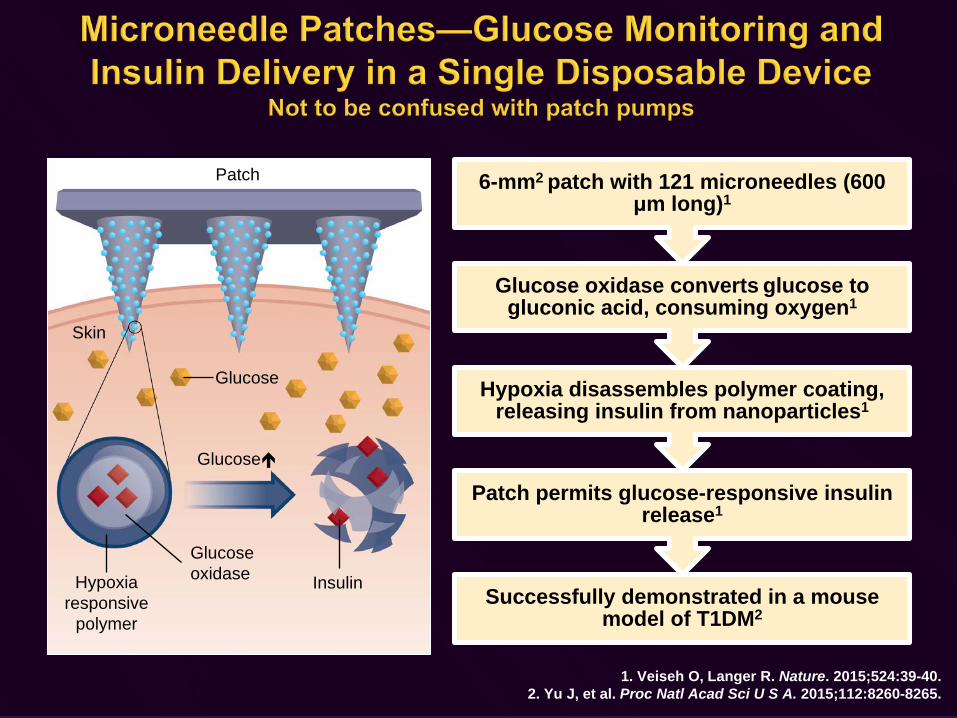
Successfully demonstrated in a mouse model of T1DM2
Patch permits glucose-responsive insulin release1
Hypoxia disassembles polymer coating, releasing insulin from nanoparticles1
Glucose oxidase converts glucose to gluconic acid, consuming oxygen1
6-mm2 patch with 121 microneedles (600 μm long)1
1. Veiseh O, Langer R. Nature. 2015;524:39-40.2. Yu J, et al. Proc Natl Acad Sci U S A. 2015;112:8260-8265.
Skin
Patch
Glucose
Glucose
Insulin
GlucoseoxidaseHypoxia
responsivepolymer
• Insulin pens and pumps are increasingly used by patients with T2DM
• Both durable and disposable (patch) pumps can improve glycemic control in patients with T2DM; adherence data have not yet been reported
• Individualized SMBG regimens are recommended; CGMmay be a helpful adjunct to SMBG in some patients with T2DM
• Integrated insulin pumps and CGM devices are the foundation of closed-loop insulin delivery systems
• Microneedle patches permit glucose-sensitive insulin delivery without repeated injections or cannula insertion