
APPROACHES TO THE PROCESS CAPABILITY...
7
15. - 17. 5. 2013, Brno, Czech Republic, EU APPROACHES TO THE PROCESS CAPABILITY ANALYSIS IN THE CASE OF NON- NORMALLY DISTRIBUTED PRODUCT QUALITY CHARACTERISTIC Jiří PLURA, Milan ZEMEK, Pavel KLAPUT VŠB-Technical University of Ostrava, Faculty of Metallurgy and Materials Engineering, Department of Quality Management, 17.listopadu 15, 70833 Ostrava-Poruba, Czech Republic, EU [email protected], [email protected], [email protected] Abstract Process capability analyses, which characterize the ability of processes to produce products meeting the quality criteria, are now a standard part of products and processes quality planning and improvement. Automotive industry considerably contributes to their wide application, because its suppliers must demonstrate the capability of their processes. Standard process capability analysis procedure applies a number of assumptions. One of them is the assumption of normal distribution of given quality characteristic that may not be met in real conditions. The article deals with possible causes of not meeting this assumption and it highlights the fact that in many cases it may not be related to the nature of the quality characteristic distribution. For situations where non-normality is the natural behaviour of the product quality characteristic, various approaches that make it possible to evaluate the process capability are analysed. In a concrete example, the results of the application of selected approaches are compared and discussed. Keywords: process capability, product quality characteristic, non-normal distribution 1. INTRODUCTION The capability of the used production processes has significant influence on the quality of manufactured products. The capability of processes can be characterized as the ability of the processes to provide products meeting the required quality criteria in the long term. In many industrial enterprises, including those from metallurgical industry, the analyses of the process capability is becoming common or even a necessity in many industrial companies, including the companies from metallurgical industry. A significant contribution to this fact comes from the automotive industry, where process capability analyses are required. Unfortunately, in some cases, it is a superficial or purposeful study, which is performed only on the basis of customer´s requirement and the managers do not understand the essence and the context of the necessary prerequisites for achieving objective results. However, the analysis of the process capability can´t be downgraded only to collecting data and putting them into formulas used for the calculation of the capability indices. It is very important to realize that all the necessary steps of the analysis must be made in correct sequence [1, 2] which, among other things, includes the verification of the fundamental presumptions. The verification of normality of the monitored characteristic is one of the most important presumption for the utilization of standard formulas used for the calculation of the capability indices. In real practice, however, there are many measurable characteristics, whose natural distribution is not normal. They include taper ration, flatness, roughness, concentricity, eccentricity, perpendicularity, roundness, angularity, weld strength, tensile strength, hardness of castings, hole location or parallelism. It is essential to find suitable procedures of process capability analysis deciding about the values of these characteristics even in such cases. This article deals with the issue of normality non-compliance of the monitored characteristic, and it presents the possible solutions of this non-standard situation.
Transcript of APPROACHES TO THE PROCESS CAPABILITY...
15. - 17. 5. 2013, Brno, Czech Republic, EU
APPROACHES TO THE PROCESS CAPABILITY ANALYSIS IN THE CASE OF NON-
NORMALLY DISTRIBUTED PRODUCT QUALITY CHARACTERISTIC
Jiří PLURA, Milan ZEMEK, Pavel KLAPUT
VŠB-Technical University of Ostrava, Faculty of Metallurgy and Materials Engineering, Department of Quality
Management, 17.listopadu 15, 70833 Ostrava-Poruba, Czech Republic, EU
[email protected], [email protected], [email protected]
Abstract
Process capability analyses, which characterize the ability of processes to produce products meeting the
quality criteria, are now a standard part of products and processes quality planning and improvement.
Automotive industry considerably contributes to their wide application, because its suppliers must
demonstrate the capability of their processes. Standard process capability analysis procedure applies a
number of assumptions. One of them is the assumption of normal distribution of given quality characteristic
that may not be met in real conditions. The article deals with possible causes of not meeting this assumption
and it highlights the fact that in many cases it may not be related to the nature of the quality characteristic
distribution. For situations where non-normality is the natural behaviour of the product quality characteristic,
various approaches that make it possible to evaluate the process capability are analysed. In a concrete
example, the results of the application of selected approaches are compared and discussed.
Keywords: process capability, product quality characteristic, non-normal distribution
1. INTRODUCTION
The capability of the used production processes has significant influence on the quality of manufactured
products. The capability of processes can be characterized as the ability of the processes to provide
products meeting the required quality criteria in the long term. In many industrial enterprises, including those
from metallurgical industry, the analyses of the process capability is becoming common or even a necessity
in many industrial companies, including the companies from metallurgical industry. A significant contribution
to this fact comes from the automotive industry, where process capability analyses are required.
Unfortunately, in some cases, it is a superficial or purposeful study, which is performed only on the basis of
customer´s requirement and the managers do not understand the essence and the context of the necessary
prerequisites for achieving objective results. However, the analysis of the process capability can´t be
downgraded only to collecting data and putting them into formulas used for the calculation of the capability
indices. It is very important to realize that all the necessary steps of the analysis must be made in correct
sequence [1, 2] which, among other things, includes the verification of the fundamental presumptions. The
verification of normality of the monitored characteristic is one of the most important presumption for the
utilization of standard formulas used for the calculation of the capability indices.
In real practice, however, there are many measurable characteristics, whose natural distribution is not
normal. They include taper ration, flatness, roughness, concentricity, eccentricity, perpendicularity,
roundness, angularity, weld strength, tensile strength, hardness of castings, hole location or parallelism. It is
essential to find suitable procedures of process capability analysis deciding about the values of these
characteristics even in such cases. This article deals with the issue of normality non-compliance of the
monitored characteristic, and it presents the possible solutions of this non-standard situation.

15. - 17. 5. 2013, Brno, Czech Republic, EU
2. THE POSSIBILITIES OF PROCESS CAPABILITY ANALYSIS IN THE CASE OF NON-
COMPLIANCE OF DATA NORMALITY
The situation, where the distribution of the monitored feature of quality does not correspond with normal
distribution can in principle be addressed in the following ways:
a) transformation of data to a variable coming from normal distribution
b) use of different theoretical model of distribution
c) use of indicators that are not based on a concrete model of distribution.
Before using one of the possible procedures solving the problem of non- normality, it is, however, desirable
to pay attention to its causes. The cause of non- normality may be the occurrence of outliers resulting from
gross measurement errors, but often, it is the inhomogeneity of data caused by step changes of conditions
during the data collection. In such cases, it is necessary to eliminate the effect of the relevant causes by
suitably sorting the data or by collecting new data.
2.1 Transformation of data to normally distributed variable
In the case of data transformation, the original data, which do not correspond to normal distribution, use
suitable transformation function to be transformed into data, whose distribution is most closely approximating
normal distribution. The next step will verify the normality of the transformed data using suitable numerical
tests. If the normality of data is confirmed it is followed by the transformation of tolerance limits using the
identified transformation function, and the process capability analysis can be carried out in accordance with
the procedure for normal distribution [3].
Power transformation of data
Power transformation of data is a frequently used kind of transformation, mainly due to its simplicity. The aim
is to transform the data of the examined selection using suitably chosen powers so as to stabilize the
variance, minimize the skewness and so as to have the shape of the distribution as close as possible to
normal distribution. Power transformation is carried out according to relations:
(1)
where:
x – original variable
y – transformed variable
λ – parameter of transformation function
Box – Cox data transformation
George E. P. Box and David Cox have created a transformation that allows approximation of selection
distribution to normal distribution with respect to skewness and kurtosis. It is a very commonly used
transformation, mainly due to its simplicity. Box - Cox transformation follows the relations:
(2)

15. - 17. 5. 2013, Brno, Czech Republic, EU
Johnson data transformation
Johnson transformation chooses one of three types of equations, depending on whether the random variable
is bounded (SB), log-normal (SL) or non-bounded (SU). The equations are:
Type SB – bounded random variable:
(3)
Type SL - log-normal distribution of random variable:
(4)
Type SU – non-bounded random variable:
b > 0; d >0 (5)
For example, Minitab 16 software proceeds in such a way that it takes into account all three possible
Johnson transformation equations, estimates their parameters, transforms the data, and then performs
Anderson - Darling test and selects the function that provides the best approximation to normal distribution.
Johnson transformation has a wider range of applications, because unlike the Box - Cox transformation or
the power transformation, it is also applicable for negative values.
2.2 The use of another theoretical model of distribution
Another way of solution of the problem of non-normality of the monitored characteristic of quality is based on
finding another suitable probability distribution to describe the distribution of characteristic. To verify the
suitability of the selected theoretical model, it is useful to apply some of goodness of fit tests, and to use
some statistical software in order to find the necessary quantiles. The calculation of the basic process
capability indices takes advantage of several different procedures.
Perhaps the most widely used method of evaluation of process capability using a different model of
distribution is “ISO” method [3]. Similarly as in the case of normal distribution, where the values of -3 and
+3 correspond to the quantiles for which the distribution function reaches the values of 0.00135 and
0.99865, another probability model uses quantiles corresponding to these values of distribution function. The
corresponding values of capability indices can be calculated as:
(6)
(7)
where:
x0,00135 - 0,135 % quantile of appropriate distribution
x0,99865 - 99,865 % quantile of appropriate distribution
x0,5 - median of appropriate distribution
H. Schneider, J.Pruett and C. Lagrange [4] have also designed a calculation using the quantiles of the given
distribution for data originating from normal distribution in order to estimate the process capability indices of
15. - 17. 5. 2013, Brno, Czech Republic, EU
Cp and Cpk. The calculation of the Cp capability index uses the same relation as the “ISO” method, the Cpk
index (in the original work referred to as Cpp) however, uses a different calculation formula:
(8
)
W.L. Pearn and K.S.Chen [5] recommend using the same relation to calculate Cp as in case of the „ISO”
method for any other than normal distribution, for the calculation of Cpk, they have proposed this formula:
(9)
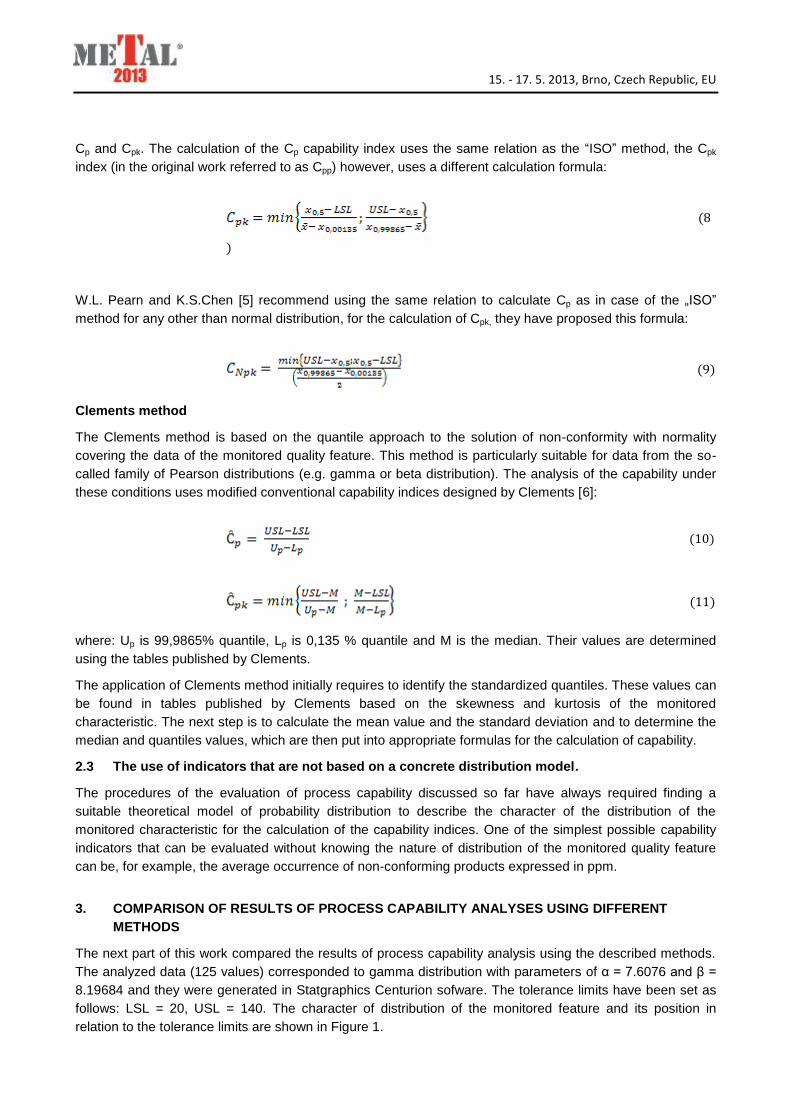
Clements method
The Clements method is based on the quantile approach to the solution of non-conformity with normality
covering the data of the monitored quality feature. This method is particularly suitable for data from the so-
called family of Pearson distributions (e.g. gamma or beta distribution). The analysis of the capability under
these conditions uses modified conventional capability indices designed by Clements [6]:
(10)
(11)
where: Up is 99,9865% quantile, Lp is 0,135 % quantile and M is the median. Their values are determined
using the tables published by Clements.
The application of Clements method initially requires to identify the standardized quantiles. These values can
be found in tables published by Clements based on the skewness and kurtosis of the monitored
characteristic. The next step is to calculate the mean value and the standard deviation and to determine the
median and quantiles values, which are then put into appropriate formulas for the calculation of capability.
2.3 The use of indicators that are not based on a concrete distribution model.
The procedures of the evaluation of process capability discussed so far have always required finding a
suitable theoretical model of probability distribution to describe the character of the distribution of the
monitored characteristic for the calculation of the capability indices. One of the simplest possible capability
indicators that can be evaluated without knowing the nature of distribution of the monitored quality feature
can be, for example, the average occurrence of non-conforming products expressed in ppm.
3. COMPARISON OF RESULTS OF PROCESS CAPABILITY ANALYSES USING DIFFERENT
METHODS
The next part of this work compared the results of process capability analysis using the described methods.
The analyzed data (125 values) corresponded to gamma distribution with parameters of α = 7.6076 and β =
8.19684 and they were generated in Statgraphics Centurion sofware. The tolerance limits have been set as
follows: LSL = 20, USL = 140. The character of distribution of the monitored feature and its position in
relation to the tolerance limits are shown in Figure 1.

15. - 17. 5. 2013, Brno, Czech Republic, EU
Provided that the analysed data represent 25 subgroups with a subgroup range of 5, a average and range
control chart was used to perform the analysis of process statistical stability. Both charts did not indicate any
signals of the effect of assignable causes, so it was possible to consider the analysed process as “in control”
and to evaluate the capability indices of Cp and Cpk. Statistical software Minitab 16 and Statgraphics
Centurion were used for the given situation to evaluate the process capability indices according to all the
above discussed procedures.
3.1 Discussion on the achieved results
The comparison of Cp and Cpk indices determined using different methods is presented in Table 1 and Figure
2. Apart from the values of the capability indices, Table 1 also shows their percentage expression, while their
values determined by means of “ISO” method are taken as the basis.
Fig. 1 Histogram of analysed data
Tab. 1 Comparison of capability indices calculated by means of different methods
Method Cp % Cpk % ppm
Box-Cox transformation 0,88 101,1 0,78 90,7 10572
Johnson transformation 1,3 149,4 0,88 102,3 4065
"ISO" method 0,87 100 0,86 100 9633
Clements 1,14 131,0 1,06 123,3 -
Schneider et al. 0,87 100 0,84 97,7 9633
Pearn, Chen 0,87 100 0,6 69,8 9633

15. - 17. 5. 2013, Brno, Czech Republic, EU
Fig. 2 Comparison of process capability indices calculated using different methods
In the case of Cp index, the values determined using the Johnson transformation and the Clements method
are most different from the result obtained using “ISO” method. On the contrary, the value of Cp index
determined using the Box-Cox transformation is practically the same. On the other hand, Cpk index achieved
the best match with the result obtained by “ISO” methods in case of Johnson transformation and in case of
evaluation according to Schneider et al., where it is connected with a small difference between the values of
the median and the average. When Clements method is compared with the result according to “ISO”
method, the value of Cpk index is the most overrated, and in calculation according to Pearn and Chen, it is
the most undervalued index. As far as the expected occurrence of non-conforming products in ppm is
concerned, the values are comparable with the exception of Johnson transformation, where the determined
value is lower by more than a half.
Calculation of Cpk equivalents based on the expected occurrence of non-conforming products is another
possibility of process capability assessment in the cases of using other distribution model. For 9633 ppm of
non-conforming products calculated Cpk equivalent is equal to 0.78 which corresponds to the result obtained
using the Box Cox transformation.
For comparison, in case of not respecting non-normality of given characteristic and calculating capability
indices with using formulas for normal distribution determined results are: Cp = 0.86; Cpk = 0.61. These
values are not quite different from those listed in Table 1, however corresponding expected occurrence of
non-conforming products is significantly higher: 34059 ppm.
4. CONCLUSION
The obtained results clearly show that the results of process capability analysis of data which do not
correspond to normal distribution can be significantly different, depending on the chosen method of analysis.
The differences in the determined values of capability indices amounted up to 50 % in case of analysed data
of gamma distribution, when various methods were used. For this reason, it is always desirable to state
which method was used to achieve the determined results.
However, in real practice, there may be situations where some methods can´t be used. For example, the
transformation of data may not be successful and may not lead to achieving normality. It may also happen
that the tolerance limits lie outside the range of the transformation and it won´t be possible to transform
them. The efforts to find another theoretical model of probability distribution to describe the distribution of the
measured data doesn´t have to be successful either. The reasons of these complications are often unrelated

15. - 17. 5. 2013, Brno, Czech Republic, EU
to completely unusual behaviour of the monitored characteristic, but they are related to inhomogeneous sets
of data, where one set includes data obtained under different conditions.
ACKNOWLEDGEMENT
This paper was elaborated in the frame of the specific research project No. SP2013/49, which
has been solved at the Faculty of Metallurgy and Materials Engineering, VŠB-TU Ostrava with the
support of Ministry of Education, Youth and Sports, Czech Republic.
REFERENCES
[1] PLURA, J.; KLAPUT, P.; VYKYDAL, D.: The Most Frequent Mistakes at Process Capability Analyses. Hutnické
listy, Vol. LXIV, 2011, No. 6, pp. 126-130
[2] PLURA, J.: Procedures and Methods of Quality Planning and their Use for Forming Process Optimization. In:
Engineering the Future. Laszlo Dudas (editor). 1st edition. Rijeka: Sciyo, 2010, Chapter 13, pp. 257-279, ISBN
978-953-307-210-4
[3] KOTZ, S.; LOVELACE, C. R.: Process Capability Indices in Theory and Practice. New York: Oxford University
Press, 1998, ISBN 0-340-69177-8
[4] SCHNEIDER, H.; PRUETT, J.; LAGRANGE, C.: Uses of Process Capability Indices in the Supplier Certification
Process. Quality Engineering, 1995, pp. 225-235.
[5] PEARN, W.L.; CHEN, K.S.: Capability Indices for Non-normal Distributions with an Application in Electrolytic
Capacitor Manufacturing. Microelectronics and Reliability,, Vol. 37, No. 12, pp. 1853-1858
[6] CLEMENTS, J. A.: Process Capability Calculations for Non-normal Distributions. Quality Progress, ASQC, 1999,
pp. 95-100.


![DEGRADATION OF HEAT RESISTANT STEELS …metal2014.tanger.cz/files/proceedings/12/reports/1815.pdf · vgb-tw 507) [9]. For documentation of some acquired results three components (tubes)](https://static.fdocuments.in/doc/165x107/5b9f6dd709d3f26e288cd369/degradation-of-heat-resistant-steels-vgb-tw-507-9-for-documentation-of-some.jpg)