Approaches to Evaluating Research Performance: Peer Review ... Mingers.pdf · Approaches to...
28
Approaches to Evaluating Research Performance: Peer Review and Scientometrics - The Case of the UK Research Evaluation Framework (REF) Professor John Mingers, Kent Business School
Transcript of Approaches to Evaluating Research Performance: Peer Review ... Mingers.pdf · Approaches to...
Approaches to Evaluating Research
Performance: Peer Review and
Scientometrics -The Case of the UK Research
Evaluation Framework (REF)
Professor John Mingers, Kent Business School
1. Introduction
2. The Research Excellence Framework (REF)
3. The dysfunctions of the REF
4. Overview of scientometrics
5. Basic citation metrics
6. Journal Citation metrics
7. Visualizing Science
8. Alt Metrics
9. Use for evaluation and policy
1. The UK Research Assessments
1. 1986: Started small with a “Research Selectivity Exercise” simply
to allocate research funding
• Each department submitted just FIVE papers and a description
of research
• Ranked from “below average” to “outstanding” by peer review
• Little interest until league tables were produced by THE
2. 1989 – 2104: Six more, ever more complex, expensive and time
consuming.
• The 2014 REF was estimated to have cost £250m
• The biggest driver of university behaviour and huge effects on
university staff
2. Overview of the 2014 REF
1. Each department makes a submission based on a selection of
academics
• Four research outputs per academic (less are scored zero)
• A “Research Environment Statement” describing their research
strategy, processes and management, PhD students and
research income
• Non-academic impact case studies – 1 per 10 staff
2. Each output, the research environment and the case studies are all
graded from 0 – 4 in terms of research quality
3. The results are presented in a profile – the % judged to be in each
category.
4. This is quickly converted into a (grade point) average (GPA) by the
Times Higher and used to create a league table for each university
and each subject
5. The quality profile ignores the number of staff submitted but the
funding is related to volume, as well as being heavily weighted to 4*
work
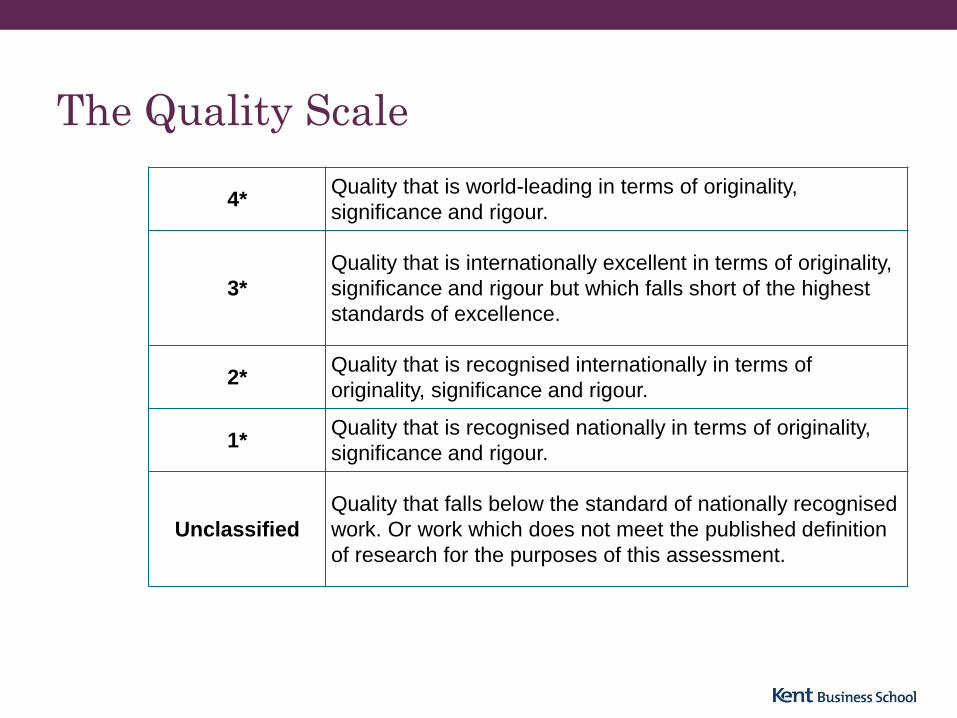
The Quality Scale
4* Quality that is world-leading in terms of originality,
significance and rigour.
3*
Quality that is internationally excellent in terms of originality,
significance and rigour but which falls short of the highest
standards of excellence.
2* Quality that is recognised internationally in terms of
originality, significance and rigour.
1* Quality that is recognised nationally in terms of originality,
significance and rigour.
Unclassified
Quality that falls below the standard of nationally recognised
work. Or work which does not meet the published definition
of research for the purposes of this assessment.
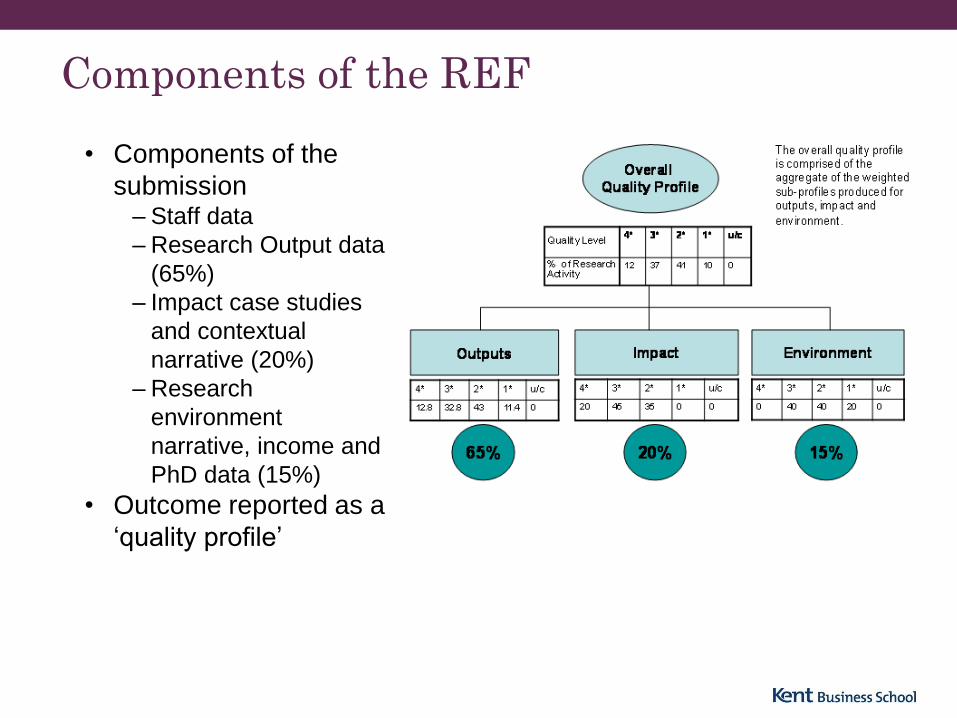
Components of the REF
• Components of the
submission – Staff data
– Research Output data
(65%)
– Impact case studies
and contextual
narrative (20%)
– Research
environment
narrative, income and
PhD data (15%)
• Outcome reported as a
„quality profile‟
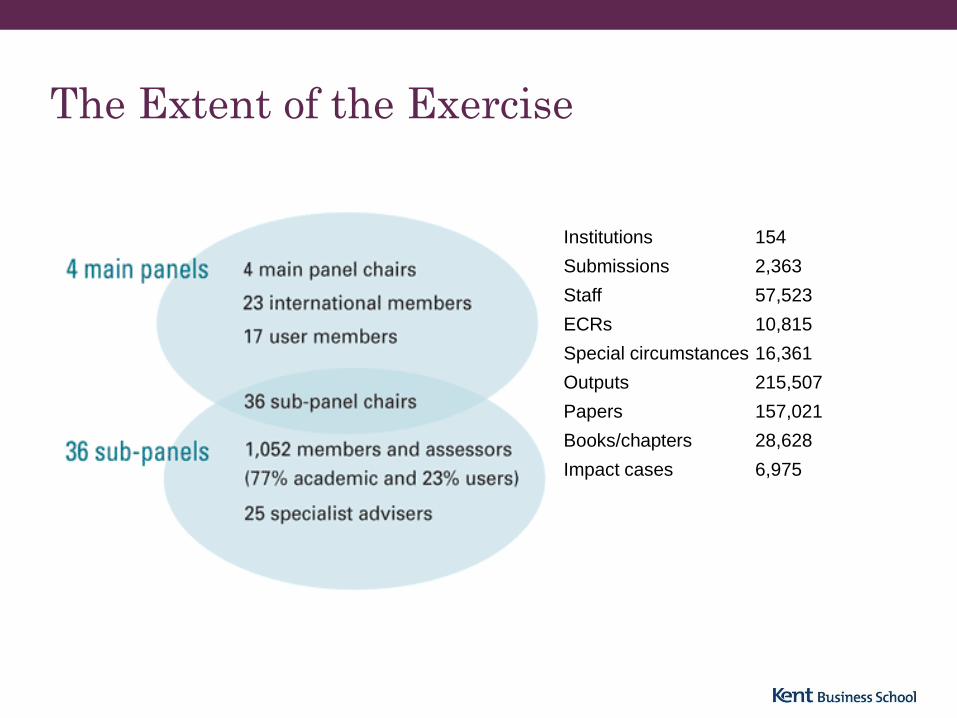
The Extent of the Exercise
Institutions 154
Submissions 2,363
Staff 57,523
ECRs 10,815
Special circumstances 16,361
Outputs 215,507
Papers 157,021
Books/chapters 28,628
Impact cases 6,975
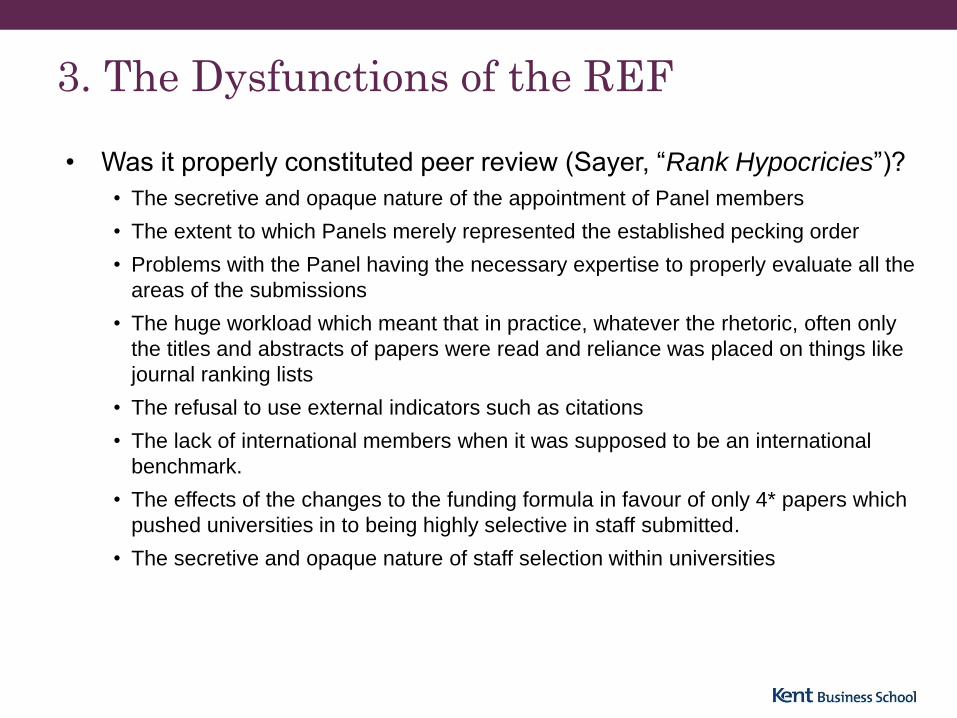
3. The Dysfunctions of the REF
• Was it properly constituted peer review (Sayer, “Rank Hypocricies”)?
• The secretive and opaque nature of the appointment of Panel members
• The extent to which Panels merely represented the established pecking order
• Problems with the Panel having the necessary expertise to properly evaluate all the
areas of the submissions
• The huge workload which meant that in practice, whatever the rhetoric, often only
the titles and abstracts of papers were read and reliance was placed on things like
journal ranking lists
• The refusal to use external indicators such as citations
• The lack of international members when it was supposed to be an international
benchmark.
• The effects of the changes to the funding formula in favour of only 4* papers which
pushed universities in to being highly selective in staff submitted.
• The secretive and opaque nature of staff selection within universities
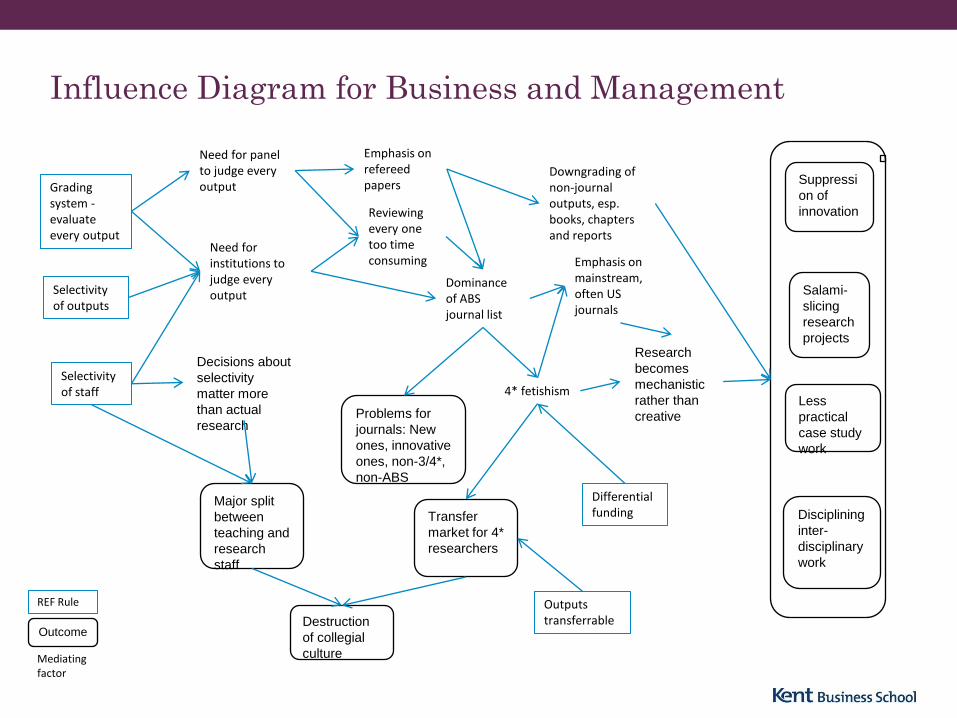
Influence Diagram for Business and Management
Grading system - evaluate every output
Selectivity of outputs
Selectivity of staff
Differential funding
Outputs transferrable
Need for panel to judge every output
Need for institutions to judge every output
Emphasis on refereed papers
Reviewing every one too time consuming
Dominance of ABS journal list
Downgrading of non-journal outputs, esp. books, chapters and reports
4* fetishism
Emphasis on mainstream, often US journals
Suppressi
on of
innovation
Salami-
slicing
research
projects
Less
practical
case study
work
Transfer
market for 4*
researchers
Decisions about
selectivity
matter more
than actual
research
Research
becomes
mechanistic
rather than
creative Problems for
journals: New
ones, innovative
ones, non-3/4*,
non-ABS
Disciplining
inter-
disciplinary
work
Major split
between
teaching and
research
staff
Destruction
of collegial
culture
REF Rule
Outcome
Mediating factor
View, Master, Slide Master to change this text to the title of your presentation
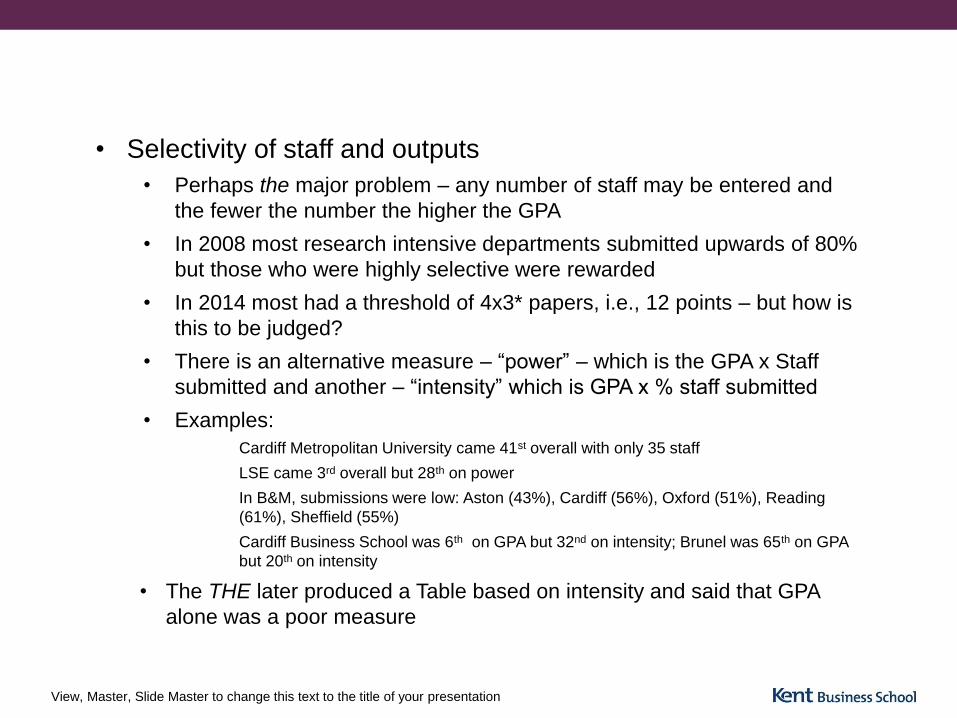
• Selectivity of staff and outputs
• Perhaps the major problem – any number of staff may be entered and
the fewer the number the higher the GPA
• In 2008 most research intensive departments submitted upwards of 80%
but those who were highly selective were rewarded
• In 2014 most had a threshold of 4x3* papers, i.e., 12 points – but how is
this to be judged?
• There is an alternative measure – “power” – which is the GPA x Staff
submitted and another – “intensity” which is GPA x % staff submitted
• Examples:
Cardiff Metropolitan University came 41st overall with only 35 staff
LSE came 3rd overall but 28th on power
In B&M, submissions were low: Aston (43%), Cardiff (56%), Oxford (51%), Reading
(61%), Sheffield (55%)
Cardiff Business School was 6th on GPA but 32nd on intensity; Brunel was 65th on GPA
but 20th on intensity
• The THE later produced a Table based on intensity and said that GPA
alone was a poor measure
View, Master, Slide Master to change this text to the title of your presentation
• The Taylorization of research
• The hegemony of the ABS list
• Dominance of (US) 3* and 4* journals
• Suppression of innovation
• Salami-slicing projects
• Disciplining inter-disciplinary work
• Marginalising practical engagement
• Two track researchers
• Destruction of the journal ecosystem
• Fragmentation of the academic community
Recommendations
View, Master, Slide Master to change this text to the title of your presentation
• Assess ALL staff and research outputs over a
particular time window
• This would require bibliometrics subject to peer
review
• Perhaps different arrangements for science/
social science/ arts because of the quality of
citation data
• Establish a national database of all research
outputs from institutional repositories
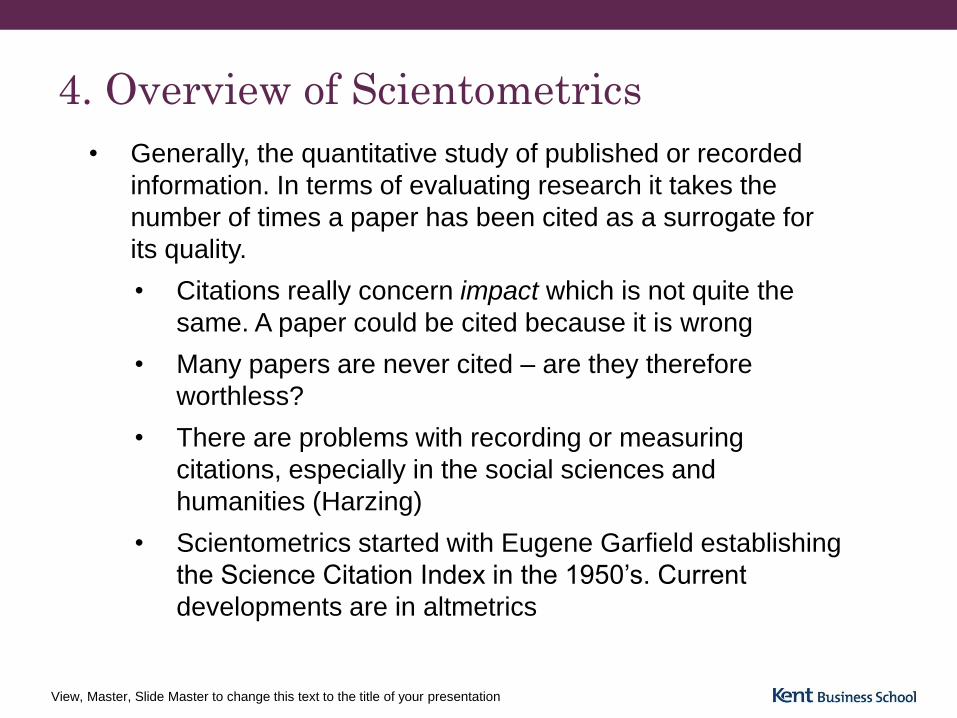
4. Overview of Scientometrics
View, Master, Slide Master to change this text to the title of your presentation
• Generally, the quantitative study of published or recorded
information. In terms of evaluating research it takes the
number of times a paper has been cited as a surrogate for
its quality.
• Citations really concern impact which is not quite the
same. A paper could be cited because it is wrong
• Many papers are never cited – are they therefore
worthless?
• There are problems with recording or measuring
citations, especially in the social sciences and
humanities (Harzing)
• Scientometrics started with Eugene Garfield establishing
the Science Citation Index in the 1950‟s. Current
developments are in altmetrics
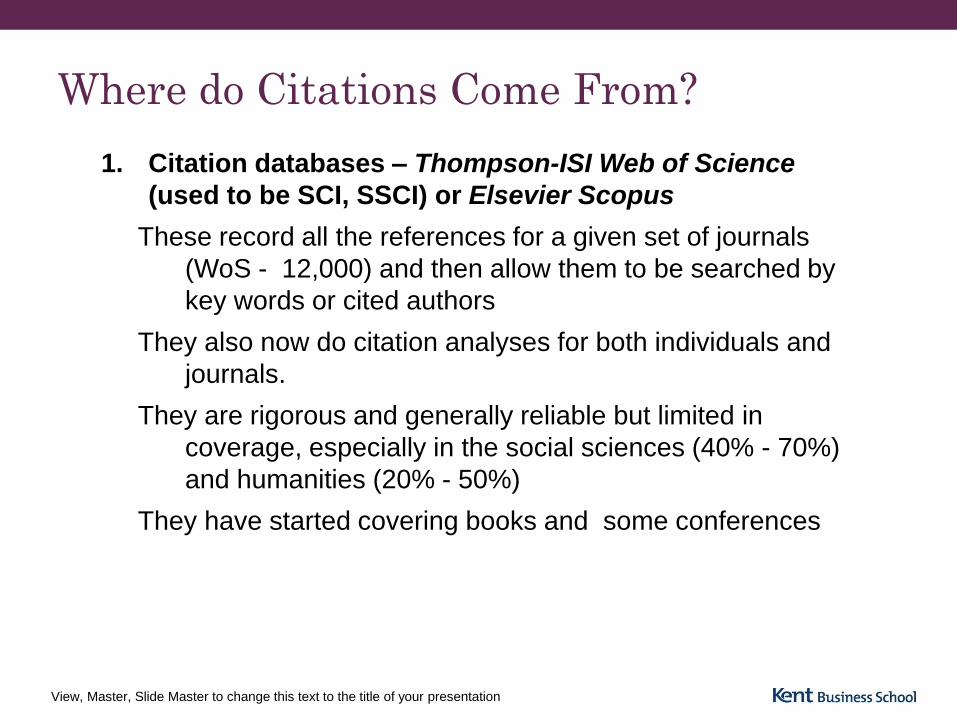
Where do Citations Come From?
View, Master, Slide Master to change this text to the title of your presentation
1. Citation databases – Thompson-ISI Web of Science
(used to be SCI, SSCI) or Elsevier Scopus
These record all the references for a given set of journals
(WoS - 12,000) and then allow them to be searched by
key words or cited authors
They also now do citation analyses for both individuals and
journals.
They are rigorous and generally reliable but limited in
coverage, especially in the social sciences (40% - 70%)
and humanities (20% - 50%)
They have started covering books and some conferences
View, Master, Slide Master to change this text to the title of your presentation
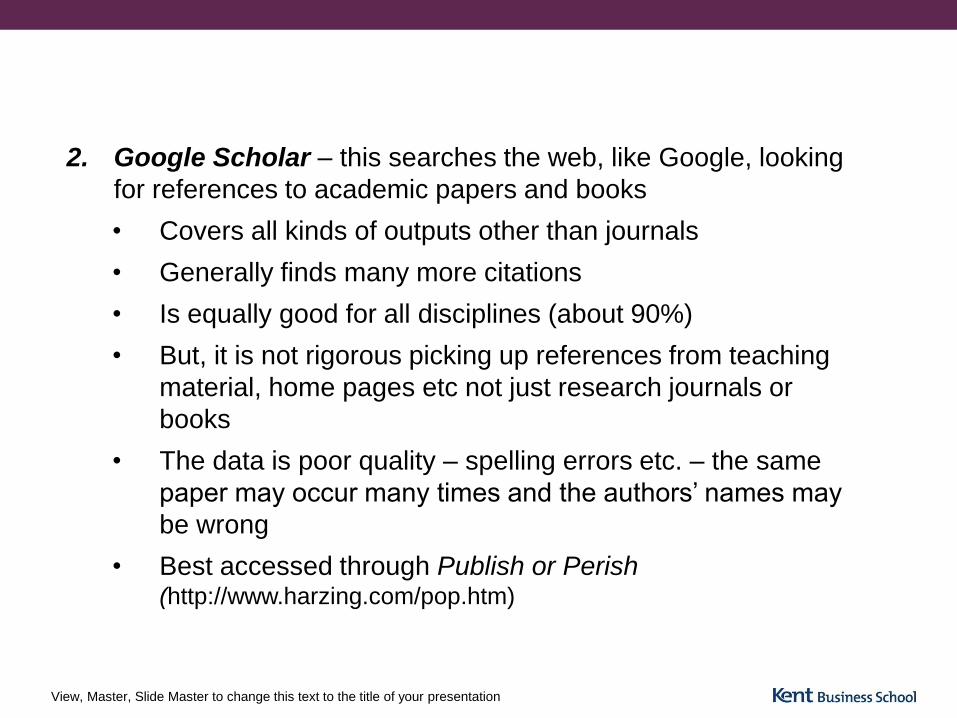
2. Google Scholar – this searches the web, like Google, looking
for references to academic papers and books
• Covers all kinds of outputs other than journals
• Generally finds many more citations
• Is equally good for all disciplines (about 90%)
• But, it is not rigorous picking up references from teaching
material, home pages etc not just research journals or
books
• The data is poor quality – spelling errors etc. – the same
paper may occur many times and the authors‟ names may
be wrong
• Best accessed through Publish or Perish (http://www.harzing.com/pop.htm)
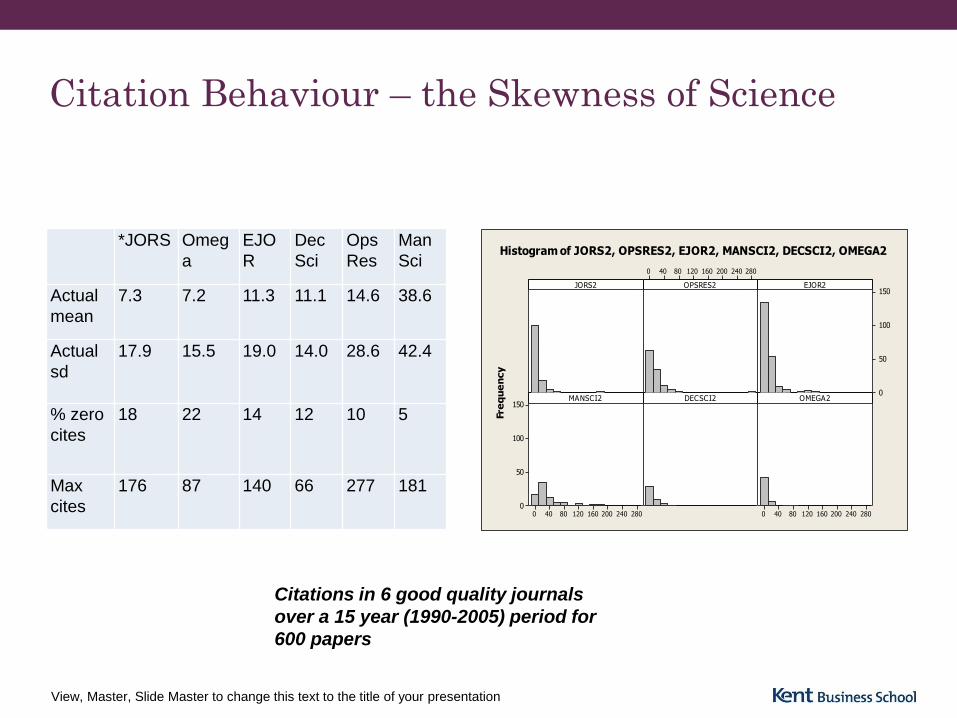
Citation Behaviour – the Skewness of Science
View, Master, Slide Master to change this text to the title of your presentation
*JORS Omeg
a
EJO
R
Dec
Sci
Ops
Res
Man
Sci
Actual
mean
7.3 7.2 11.3 11.1 14.6 38.6
Actual
sd
17.9 15.5 19.0 14.0 28.6 42.4
% zero
cites
18 22 14 12 10 5
Max
cites
176 87 140 66 277 181
Citations in 6 good quality journals
over a 15 year (1990-2005) period for
600 papers
Fre
qu
en
cy
28024020016012080400
150
100
50
0
28024020016012080400
150
100
50
028024020016012080400
JORS2 OPSRES2 EJOR2
MANSCI2 DECSCI2 OMEGA2
Histogram of JORS2, OPSRES2, EJOR2, MANSCI2, DECSCI2, OMEGA2
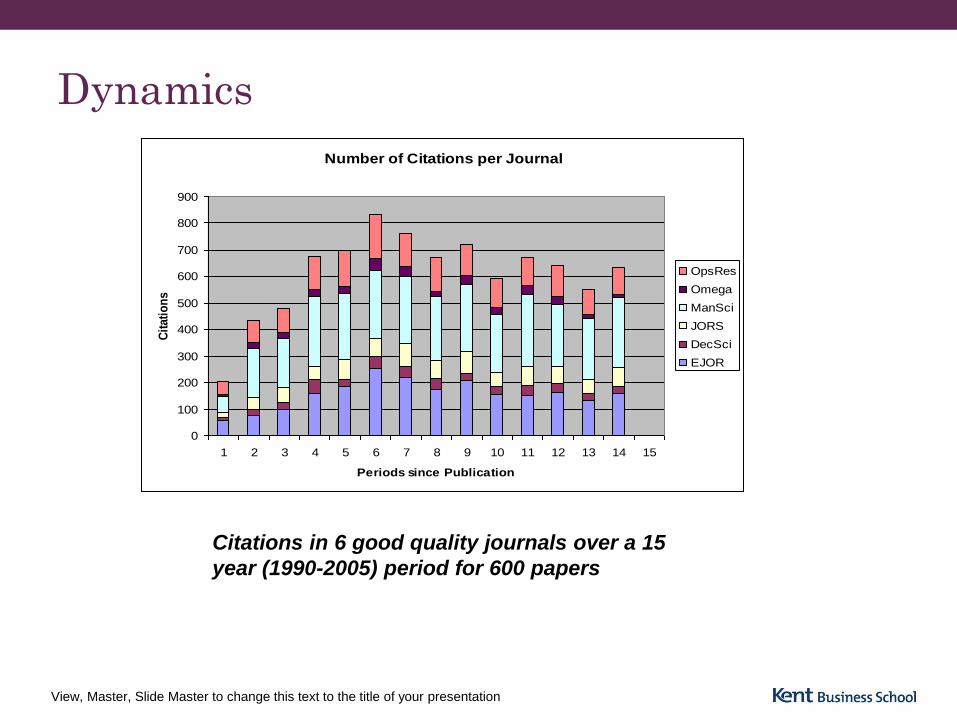
Dynamics
View, Master, Slide Master to change this text to the title of your presentation
Number of Citations per Journal
0
100
200
300
400
500
600
700
800
900
1 2 3 4 5 6 7 8 9 10 11 12 13 14 15
Periods since Publication
Cit
ati
on
s
OpsRes
Omega
ManSci
JORS
DecSci
EJOR
Citations in 6 good quality journals over a 15
year (1990-2005) period for 600 papers
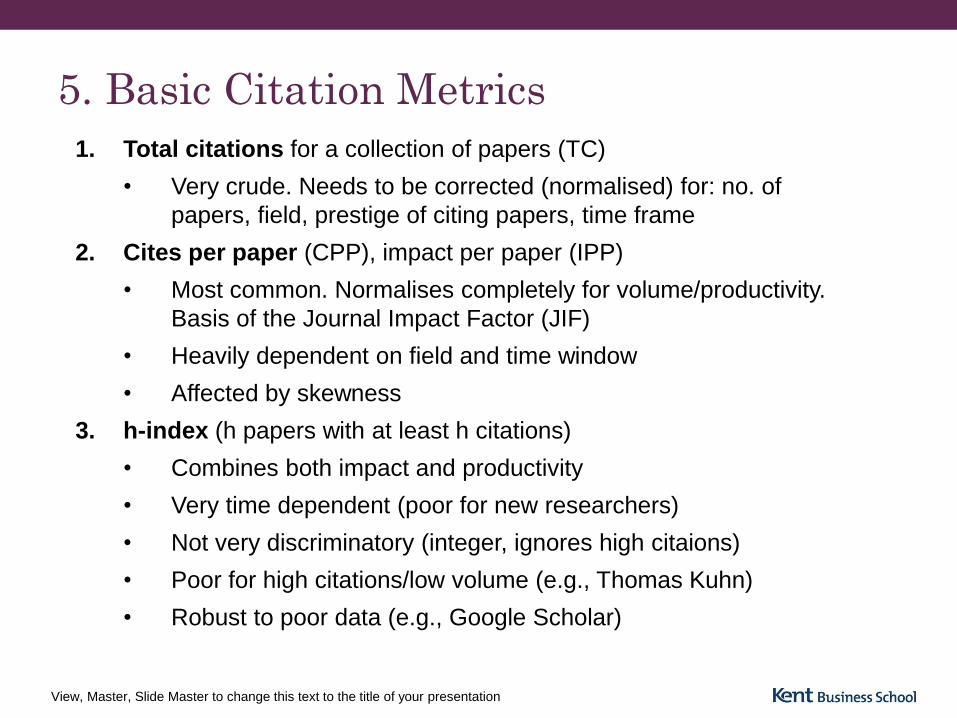
5. Basic Citation Metrics
View, Master, Slide Master to change this text to the title of your presentation
1. Total citations for a collection of papers (TC)
• Very crude. Needs to be corrected (normalised) for: no. of
papers, field, prestige of citing papers, time frame
2. Cites per paper (CPP), impact per paper (IPP)
• Most common. Normalises completely for volume/productivity.
Basis of the Journal Impact Factor (JIF)
• Heavily dependent on field and time window
• Affected by skewness
3. h-index (h papers with at least h citations)
• Combines both impact and productivity
• Very time dependent (poor for new researchers)
• Not very discriminatory (integer, ignores high citaions)
• Poor for high citations/low volume (e.g., Thomas Kuhn)
• Robust to poor data (e.g., Google Scholar)
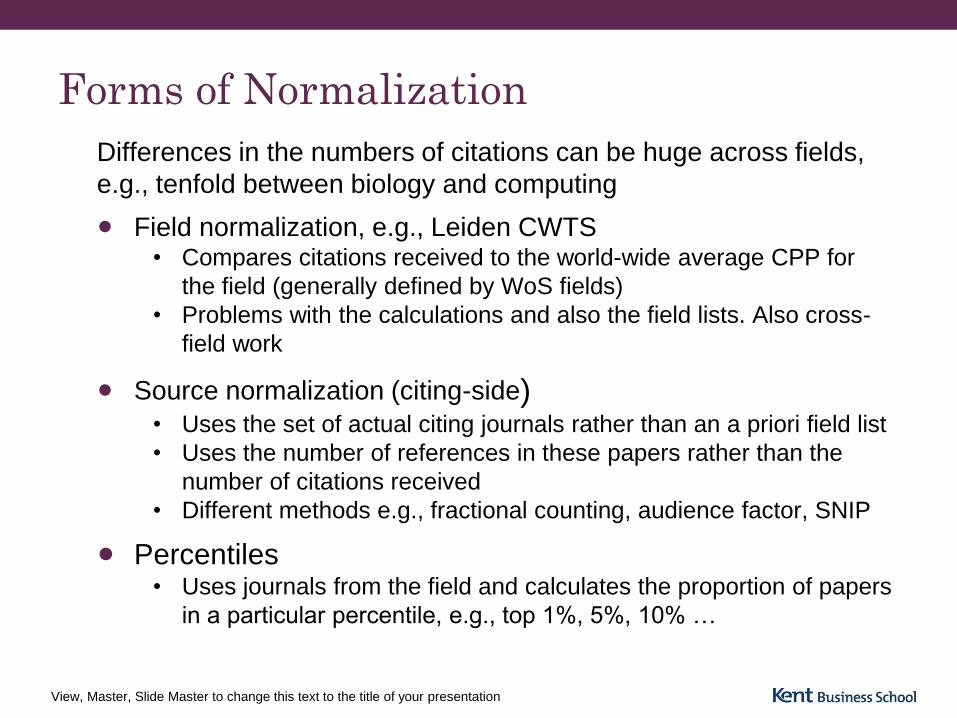
Forms of Normalization
Differences in the numbers of citations can be huge across fields,
e.g., tenfold between biology and computing
• Field normalization, e.g., Leiden CWTS • Compares citations received to the world-wide average CPP for
the field (generally defined by WoS fields)
• Problems with the calculations and also the field lists. Also cross-
field work
• Source normalization (citing-side) • Uses the set of actual citing journals rather than an a priori field list
• Uses the number of references in these papers rather than the
number of citations received
• Different methods e.g., fractional counting, audience factor, SNIP
• Percentiles • Uses journals from the field and calculates the proportion of papers
in a particular percentile, e.g., top 1%, 5%, 10% …
View, Master, Slide Master to change this text to the title of your presentation
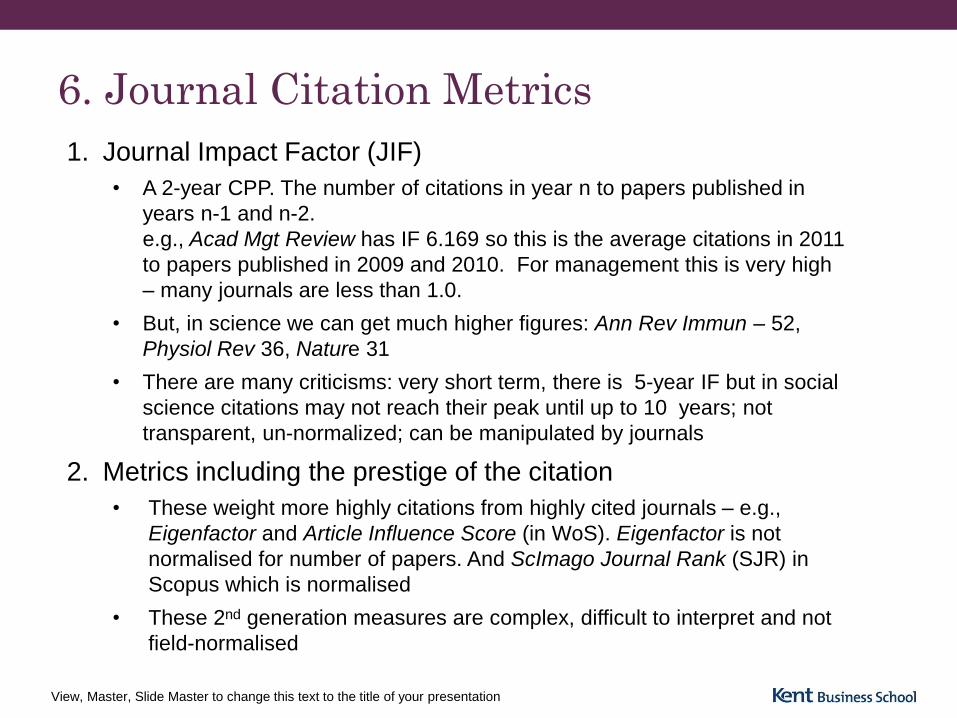
6. Journal Citation Metrics
View, Master, Slide Master to change this text to the title of your presentation
1. Journal Impact Factor (JIF)
• A 2-year CPP. The number of citations in year n to papers published in
years n-1 and n-2.
e.g., Acad Mgt Review has IF 6.169 so this is the average citations in 2011
to papers published in 2009 and 2010. For management this is very high
– many journals are less than 1.0.
• But, in science we can get much higher figures: Ann Rev Immun – 52,
Physiol Rev 36, Nature 31
• There are many criticisms: very short term, there is 5-year IF but in social
science citations may not reach their peak until up to 10 years; not
transparent, un-normalized; can be manipulated by journals
2. Metrics including the prestige of the citation
• These weight more highly citations from highly cited journals – e.g.,
Eigenfactor and Article Influence Score (in WoS). Eigenfactor is not
normalised for number of papers. And ScImago Journal Rank (SJR) in
Scopus which is normalised
• These 2nd generation measures are complex, difficult to interpret and not
field-normalised
View, Master, Slide Master to change this text to the title of your presentation
3. The h-index
• This can be used for the papers in a journal over a particular time
period.
• It has the same pros and cons as with an individual researcher. It
favours journals that publish a lot of papers, and it is not field
normalised
4. Source-normalised impact per paper (SNIP)
• This is based on impact per paper (IPP) but normalised it by
comparing it with the mean number of references in citing
journals.
• SNIP therefore normalises for both papers and field without
having to use the WoS field categories
• There have been criticisms of the form of calculations
5. Two others are fractional counting of citations and
percentile measures (I3)
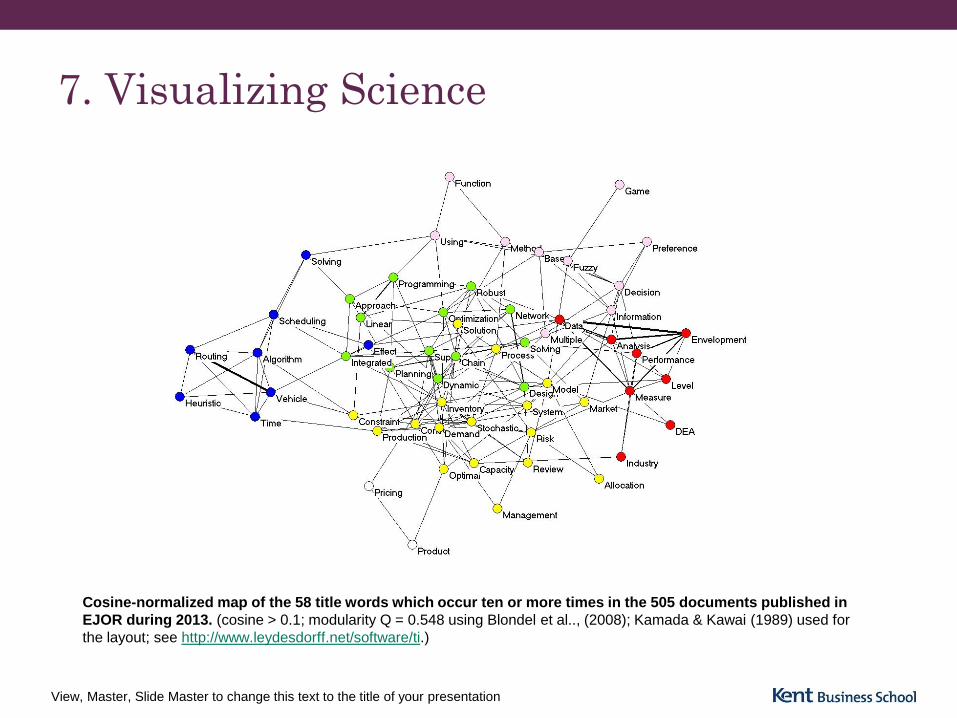
7. Visualizing Science
View, Master, Slide Master to change this text to the title of your presentation
Cosine-normalized map of the 58 title words which occur ten or more times in the 505 documents published in
EJOR during 2013. (cosine > 0.1; modularity Q = 0.548 using Blondel et al.., (2008); Kamada & Kawai (1989) used for
the layout; see http://www.leydesdorff.net/software/ti.)
View, Master, Slide Master to change this text to the title of your presentation
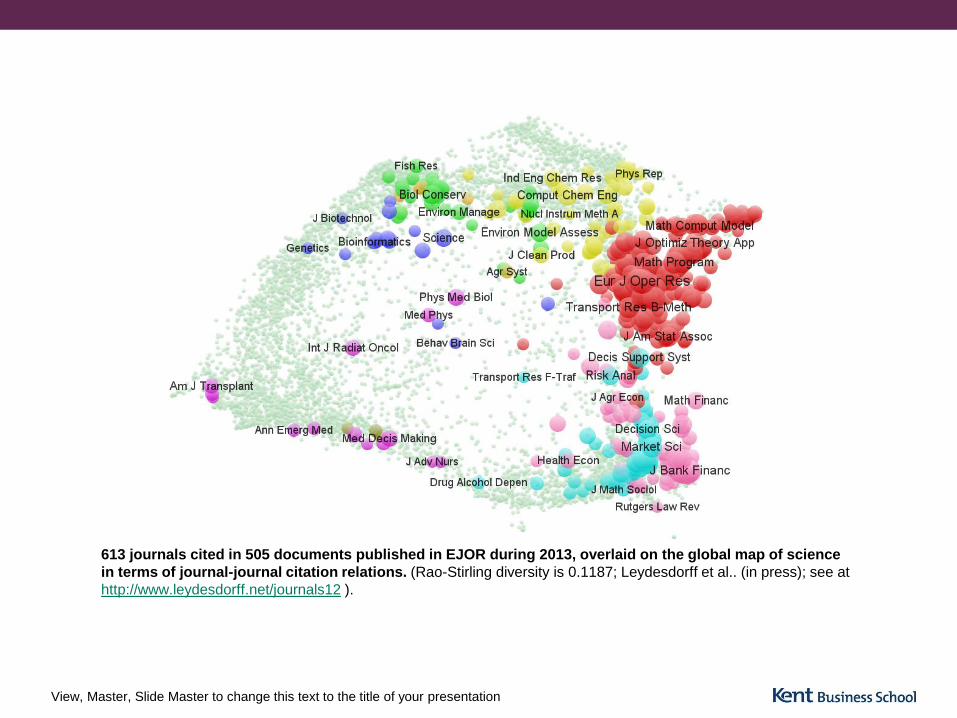
613 journals cited in 505 documents published in EJOR during 2013, overlaid on the global map of science
in terms of journal-journal citation relations. (Rao-Stirling diversity is 0.1187; Leydesdorff et al.. (in press); see at
http://www.leydesdorff.net/journals12 ).
View, Master, Slide Master to change this text to the title of your presentation
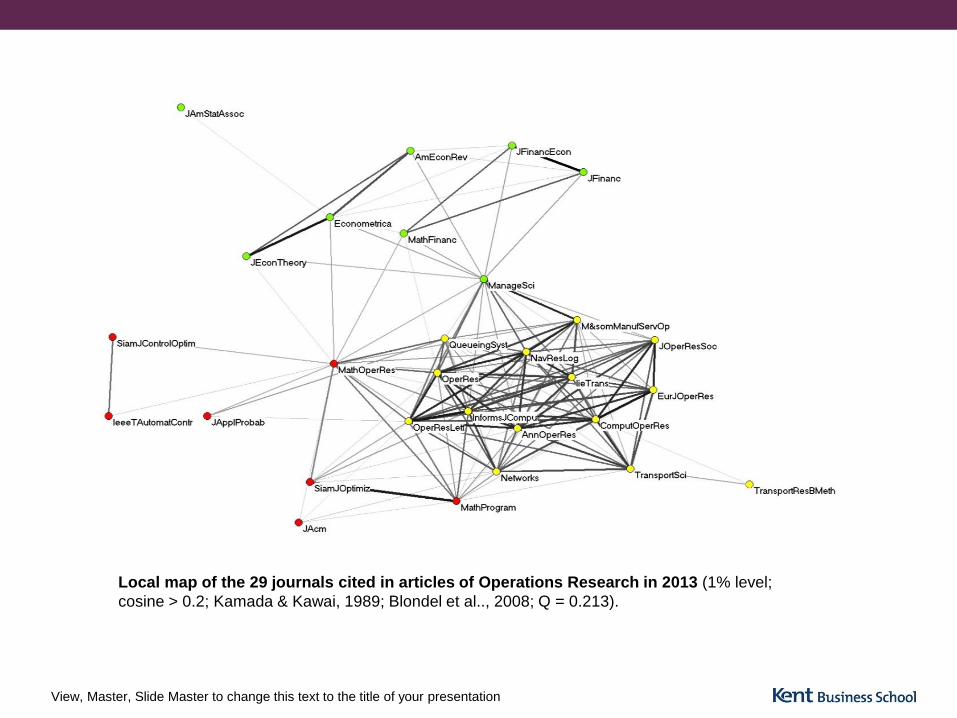
Local map of the 29 journals cited in articles of Operations Research in 2013 (1% level;
cosine > 0.2; Kamada & Kawai, 1989; Blondel et al.., 2008; Q = 0.213).
8. Alt Metrics
View, Master, Slide Master to change this text to the title of your presentation
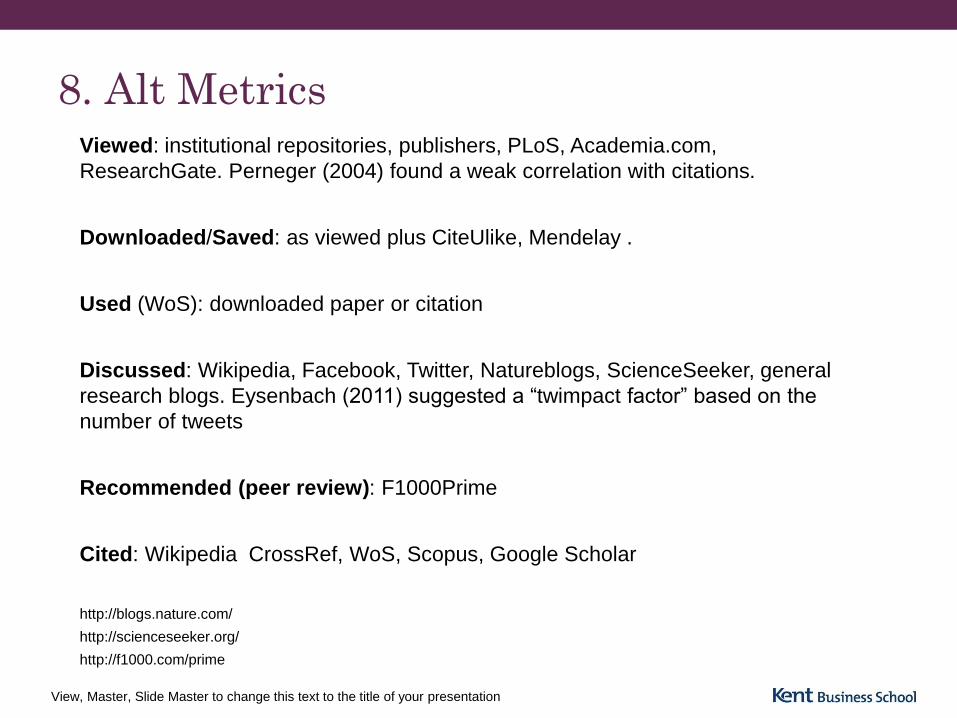
Viewed: institutional repositories, publishers, PLoS, Academia.com,
ResearchGate. Perneger (2004) found a weak correlation with citations.
Downloaded/Saved: as viewed plus CiteUlike, Mendelay .
Used (WoS): downloaded paper or citation
Discussed: Wikipedia, Facebook, Twitter, Natureblogs, ScienceSeeker, general
research blogs. Eysenbach (2011) suggested a “twimpact factor” based on the
number of tweets
Recommended (peer review): F1000Prime
Cited: Wikipedia CrossRef, WoS, Scopus, Google Scholar
http://blogs.nature.com/
http://scienceseeker.org/
http://f1000.com/prime
9. Use for Evaluation and Policy
View, Master, Slide Master to change this text to the title of your presentation
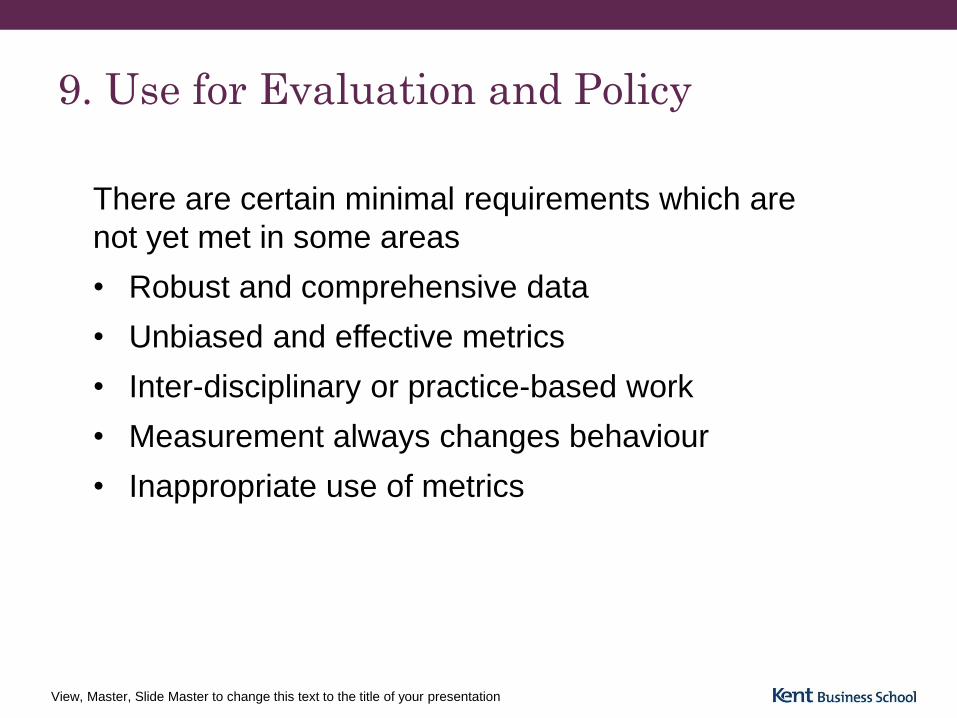
There are certain minimal requirements which are
not yet met in some areas
• Robust and comprehensive data
• Unbiased and effective metrics
• Inter-disciplinary or practice-based work
• Measurement always changes behaviour
• Inappropriate use of metrics
References
View, Master, Slide Master to change this text to the title of your presentation
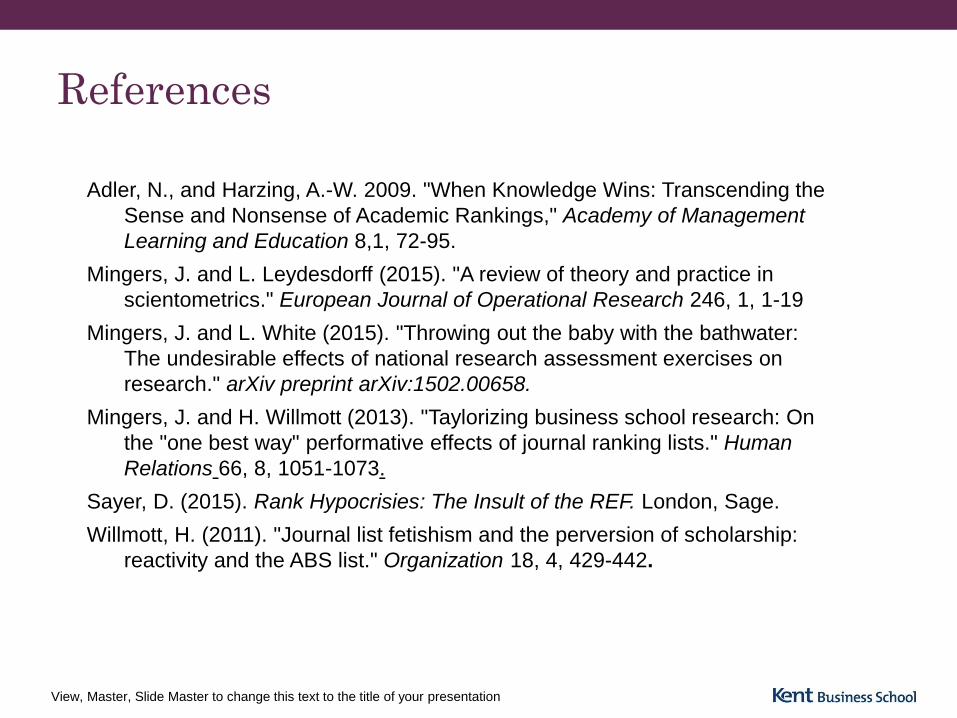
Adler, N., and Harzing, A.-W. 2009. "When Knowledge Wins: Transcending the
Sense and Nonsense of Academic Rankings," Academy of Management
Learning and Education 8,1, 72-95.
Mingers, J. and L. Leydesdorff (2015). "A review of theory and practice in
scientometrics." European Journal of Operational Research 246, 1, 1-19
Mingers, J. and L. White (2015). "Throwing out the baby with the bathwater:
The undesirable effects of national research assessment exercises on
research." arXiv preprint arXiv:1502.00658.
Mingers, J. and H. Willmott (2013). "Taylorizing business school research: On
the "one best way" performative effects of journal ranking lists." Human
Relations 66, 8, 1051-1073.
Sayer, D. (2015). Rank Hypocrisies: The Insult of the REF. London, Sage.
Willmott, H. (2011). "Journal list fetishism and the perversion of scholarship:
reactivity and the ABS list." Organization 18, 4, 429-442.

THE UK’S EUROPEAN UNIVERSITY
www.kent.ac.uk/kbs