Apprenticeship statistics - UCL Institute of Educationdera.ioe.ac.uk/22847/1/SN06113.pdf · ·...
21
Apprenticeship statistics Standard Note: SN/EP/6113 Last updated: 25 March 2015 Author: James Mirza-Davies Section: Economic Policy and Statistics This note provides statistics on people starting apprenticeships in England. In the 2013/14 academic year (August-July): There were 440,000 apprenticeship starts in England. This is 70,000 fewer than the number of starts in the 2012/13 academic year, but 161,000 more than in the 2009/10 academic year. The number of apprenticeship starts by people aged 25 and over fell by 69,000 compared to 2012/13, but was still 112,000 higher than in 2009/10. The number of apprenticeship starters aged 24 and under was about the same as in 2012/13 and was 48,000 higher than in 2009/10. The majority of people starting apprenticeships chose frameworks in the service sectors. Almost three quarters of starts were in three sectors: Business, administration & law; health, public services & care; and retail & commercial enterprise. 233,000 apprenticeships were started by women (53% of the total) and 207,000 by men (47%). By the end of January 2015 there had been 248,700 apprenticeships starts in the 2014/15 academic year. Further House of Commons Library Standard Notes that may be of interest include: Apprenticeships policy Apprenticeships and small businesses This information is provided to Members of Parliament in support of their parliamentary duties and is not intended to address the specific circumstances of any particular individual. It should not be relied upon as being up to date; the law or policies may have changed since it was last updated; and it should not be relied upon as legal or professional advice or as a substitute for it. A suitably qualified professional should be consulted if specific advice or information is required. This information is provided subject to our general terms and conditions which are available online or may be provided on request in hard copy. Authors are available to discuss the content of this briefing with Members and their staff, but not with the general public.
Transcript of Apprenticeship statistics - UCL Institute of Educationdera.ioe.ac.uk/22847/1/SN06113.pdf · ·...
Apprenticeship statistics
Standard Note: SN/EP/6113
Last updated: 25 March 2015
Author: James Mirza-Davies
Section: Economic Policy and Statistics
This note provides statistics on people starting apprenticeships in England.
In the 2013/14 academic year (August-July):
There were 440,000 apprenticeship starts in England.
This is 70,000 fewer than the number of starts in the 2012/13 academic year, but
161,000 more than in the 2009/10 academic year.
The number of apprenticeship starts by people aged 25 and over fell by 69,000
compared to 2012/13, but was still 112,000 higher than in 2009/10.
The number of apprenticeship starters aged 24 and under was about the same as in
2012/13 and was 48,000 higher than in 2009/10.
The majority of people starting apprenticeships chose frameworks in the service
sectors. Almost three quarters of starts were in three sectors: Business,
administration & law; health, public services & care; and retail & commercial
enterprise.
233,000 apprenticeships were started by women (53% of the total) and 207,000 by
men (47%).
By the end of January 2015 there had been 248,700 apprenticeships starts in the 2014/15
academic year.
Further House of Commons Library Standard Notes that may be of interest include:
Apprenticeships policy
Apprenticeships and small businesses
This information is provided to Members of Parliament in support of their parliamentary duties
and is not intended to address the specific circumstances of any particular individual. It should
not be relied upon as being up to date; the law or policies may have changed since it was last
updated; and it should not be relied upon as legal or professional advice or as a substitute for
it. A suitably qualified professional should be consulted if specific advice or information is
required.
This information is provided subject to our general terms and conditions which are available
online or may be provided on request in hard copy. Authors are available to discuss the
content of this briefing with Members and their staff, but not with the general public.
2
Contents
1 Overview of apprenticeships 3
1.1 Apprenticeship funding 3
2 Government ambitions for apprenticeship starts 4
3 Apprenticeship starts since 1996/97 4
4 Apprenticeship starts by age 5
5 Apprenticeship starts by qualification level 7
6 Apprenticeship starts by sector and framework 8
6.1 Starts by sector 8
6.2 Starts by framework 9
7 Apprenticeship starts by gender 10
8 Apprenticeship starts by employer size 10
9 Apprenticeship starts by region and Parliamentary Constituency 11011

3
1 Overview of apprenticeships
Skills and training are devolved policy areas. This Note deals with apprenticeships statistics
for England only.
Apprenticeships are paid jobs that incorporate on and off the job training. A successful
apprentice will qualify with a nationally recognised qualification on completion of their
contract.
The government pays a proportion of the training costs for apprentices, depending on their
age. The apprentice’s employer will normally cover any remaining training costs.
The government contributes:
100% of the training costs if the apprentice is aged 16-18.
50% of the training costs if the apprentice is aged 19-24.
Up to 50% of the training costs if the apprentice is aged over 25.1
1.1 Apprenticeship funding
The table below shows the budget for apprenticeships.
The BIS apprenticeship budget is intended to increase between 2012/13 and 2014/15,
despite the total adult skills budget (including apprenticeships) falling from £2.7 billion to
£2.3 billion over the same period.2 Part of the adult apprenticeships budget has been
allocated to the Employer Ownership of Skills Pilot (further information is provided in the
Library’s standard note on Apprenticeships Policy).
1 National Apprenticeship Service website, Training and funding 2 BIS, Skills Funding Statement 2013-16, February 2014
Apprenticeships budget
£ millions - Financial years (1 April - 31 March) - England
2009/10 2010/11 2011/12 2012/13 2013/14* 2014/15* 2015/16*
688 751 764 679 728 - -
384 451 625 756 759 810 770
1,072 1,202 1,389 1,435 1,487 - -
Sources: SFA, Annual report and accounts 2013/14 , June 2014, p 74
Young People's Learning Agency, Funding statement , December 2011, p 5
BIS, Skills funding statement 2013-16 , February 2014, p 26
Education Funding Agency, funding allocation letter from Peter Mucklow, March 2013
SFA, Allocations for the Funding Year 2015 to 2016 , 26 Febrary 2015
Notes: * Minimum expected budgets for apprenticeships
2012/13 figure includes £32 million for AGE 16-24
2013/14 figure includes £42 million available as FE loans and £13 million for AGE 16-24
Includes money allocated to the Employer Ownership Pilot and traineeships
"-" figures not yet available
2014/15 includes an extra £40 million for Higher Apprenticeships
Age of apprentice
16-18 (DfE)
19+ (BIS)
Total apprenticeships budget

4
2 Government ambitions for apprenticeship starts
Over the first financial year of the current Parliament, the Government targeted 50,000 more
apprenticeship starts by people aged 19 and over compared to the previous financial year, a
total of 203,000 adult apprenticeship starts. There were 256,000 adult apprenticeship starts
during the period, 53,000 more than the Government’s target.
In August 2014 the Queen’s Speech3 set a target to “increase the total number of
apprenticeship places by two million by the end of the Parliament.” The Business Secretary
Vince Cable announced in December 2014 that this target had been reached in August
earlier that year.4
The Government committed to providing an additional £40 million for 20,000 more new
higher apprenticeship starts over the 2013/14 and 2014/15 academic years in the 2013
Autumn Statement.5
3 Apprenticeship starts since 1996/97
There were 440,400 apprenticeship starts in the 2013/14 academic year, 69,800 (14%) less
than the number of starts in the previous year but 160,700 more (57%) than in 2009/10. By
the end of January 2015 there had been 248,700 apprenticeships starts in the 2014/15
academic year.
There was a large jump in the number of apprenticeship starts between 2009/10 and
2010/11 (see section 4 for further discussion).
3 Prime Minister’s Office, The Queen’s Speech 2014, 4 June 2014 4 BIS, Vince Cable celebrates two million apprenticeships, 9 December 2014 5 HM Treasury, Autumn Statement 2013, December 2013
Apprenticeship starts, thousands
* Data for 2014/15 are for August to January only.
Notes
Data are for academic years (August 1st to July 31st)
Data prior to 2002/03 is not directly comparable to later years.
Data from 2011/12 onwards is not directly comparable to earlier years. Small technical changes have been made leading to a reduction in
overall learner numbers of approximately 2 percent.
Figures are rounded to the nearest hundred. Figures prior to 2002/03 are rounded to the nearest thousand.
Source: BIS FE data library: apprenticeships and HC Deb 14 Feb 2011 c560-1W (PQ38062)
100
200
300
400
500
600
96/97 97/98 98/99 99/00 00/01 01/02 02/03 03/04 04/05 05/06 06/07 07/08 08/09 09/10 10/11 11/12 12/13 13/14 14/15*

5
4 Apprenticeship starts by age
The table below shows total apprenticeship starts for academic years since 2002/03. Before
2004/05, apprenticeships were not available for people over the age of 24.
There has been a sharp rise in the number of apprenticeship starts by people aged 25 and
over since 2009/10. 161,600 people aged 25 or over started apprenticeships in 2013/14, a
30% fall on 2012/13 but more than three times as many as in 2009/10. The table shows the
number of apprenticeship starts by age group and as a proportion of all apprenticeship starts
over the past five academic years:
37% of all apprenticeship starts in 2013/14 were by people aged 25 and over, a lower
proportion than in 2012/13 but up from 18% in 2009/10. Starts by people aged under 19 have
declined as a share of total starts since 2009/10, but the actual number of starts by this age
group has seen a slight increase over the period.
Apprenticeship starts by age, thousands
Notes
Academic years (1st August - 31 July)
Source: BIS FE data library: apprenticeships
100
200
300
400
500
600
02/03 03/04 04/05 05/06 06/07 07/08 08/09 09/10 10/11 11/12 12/13 13/14
25+
19-24
Under 19
09/10 10/11 11/12 12/13 13/14
Level %
Level
Under 19 117 132 130 115 120 3 3%
19-24 114 143 161 165 159 45 40%
25+ 49 182 229 230 162 112 229%
Proportion
Under 19 42% 29% 25% 22% 27% - -
19-24 41% 31% 31% 32% 36% - -
25+ 18% 40% 44% 45% 37% - -
Notes
Source: BIS FE data library: apprenticeships
Data are for academic years (August 1st to July 31st)
Apprenticeship starts by age, thousands
Proportion is the percentage of all apprenticeship starts made by an age group.
Change since
2009/10
Data from 2011/12 onwards is not directly comparable to earlier years. Small technical
changes have been made leading to a reduction in overall learner numbers if

6
The table below provides data on starts for more specific age groups.
Apprenticeship starts by age, thousands
09/10 10/11 11/12 12/13 13/14 14/15*
Level %
Level
Under 16 0 0 0 0 0 0 0 -50%
16 29 30 30 25 26 20 -4 -13%
17 41 45 43 36 39 25 -2 -4%
18 46 56 57 53 55 33 9 19%
19-24 114 143 161 165 159 81 45 40%
25-34 25 73 97 101 74 42 49 195%
35-44 14 54 66 65 43 23 29 213%
45-59 10 50 62 61 42 22 32 327%
60+ 0 4 4 3 2 1 2 520%
Proportion
Under 16 0% 0% 0% 0% 0% - - -
16 11% 7% 6% 5% 6% 8% - -
17 15% 10% 8% 7% 9% 10% - -
18 17% 12% 11% 11% 13% 13% - -
19-24 41% 31% 31% 32% 36% 33% - -
25-34 9% 16% 19% 20% 17% 17% - -
35-44 5% 12% 13% 13% 10% 9% - -
45-59 4% 11% 12% 12% 10% 9% - -
60+ 0% 1% 1% 1% 1% 1% - -
* Data for 2014/15 are for August to January only.
Notes
Source: BIS FE data library: apprenticeships
Under 500 people aged under 16 started an apprenticeship in every academic year since 2009/10.
Data are for academic years (August 1st to July 31st)
Change 2009/10
to 2013/14
Data from 2011/12 onwards is not directly comparable to earlier years. Small technical changes have been
made leading to a reduction in overall learner numbers if approximately 2 per cent
Proportion is the percentage of all apprenticeship starts made by an age group.

7
5 Apprenticeship starts by qualification level
Apprenticeship starts by qualification level are shown by the chart below.6 The majority of
apprenticeship starts are for Intermediate Level apprenticeships.
The number of Intermediate Level apprenticeship starts has more than doubled since
2002/03, while the number of Advanced Level apprenticeship starts has almost tripled. There
were large increases in the number of starts between 2009/10 and 2010/11 for both
Intermediate and Advanced Level apprenticeships.
Higher Level apprenticeships did not exist before 2006/07. There were 9,200 Higher Level
apprenticeship starts in 2013/14, 2% of all starts.
6 Qualification levels are explained in the House of Commons Library Standard Note on Training
Apprenticeship starts by level (thousands)
Notes
Academic years (1st August - 31 July)
Source: BIS FE data library: apprenticeships
0
100
200
300
400
500
600
02/03 03/04 04/05 05/06 06/07 07/08 08/09 09/10 10/11 11/12 12/13 13/14
Higher
Advanced
Intermediate
Apprenticeship starts by level, thousands
09/10 10/11 11/12 12/13 13/14
Level %
Level
Intermediate 191 301 329 293 287 96 50%
Advanced 88 154 188 208 145 57 65%
Higher 2 2 4 10 9 8 513%
Proportion
Intermediate 68% 66% 63% 57% 65% - -
Advanced 31% 34% 36% 41% 33% - -
Higher 1% 0% 1% 2% 2% - -
Notes
Source: BIS FE data library: apprenticeships
Data are for academic years (August 1st to July 31st)
Change 2009/10
to 2013/14
Data from 2011/12 onwards is not directly comparable to earlier years. Small technical changes have
been made leading to a reduction in overall learner numbers if approximately 2 per cent
Proportion is the percentage of all apprenticeship starts made at each level.

8
6 Apprenticeship starts by sector and framework
6.1 Starts by sector
There was an increase in the number of people starting apprenticeships in nearly all broad
sectors in 2013/14 compared with 2009/10, with the exception of construction, planning & the
built environment and leisure, travel and tourism. Sectors that already had a high number of
apprenticeship starts, such as the business administration or retail sectors, still saw large
increases.
More than half (53%) of all apprenticeship starts in 2013/14 were in the business
administration sector or the health, public service and care sector. Including retail and
commercial enterprises the top three sectors made up almost three-quarters (73%) of
apprenticeship starts in 2013/14.
09/10 10/11 11/12 12/13 13/14 14/15*
Level %
Business, Administration and Law 77 134 165 160 126 66 49 64%
Health, Public Services and Care 44 90 109 123 109 56 64 146%
Retail and Commercial Enterprise 62 103 108 101 87 43 26 42%
Engineering & Manufacturing Technologies 43 55 70 66 65 46 22 52%
Construction, Planning & Built Environment 21 22 14 14 16 13 -5 -23%
Information& Communication Technology 13 20 19 14 13 13 0 4%
Leisure, Travel and Tourism 15 22 20 14 11 7 -3 -23%
Agriculture, Horticulture and Animal Care 6 7 8 7 7 7 1 24%
Education and Training 1 4 8 8 5 5 4 452%
Arts, Media and Publishing 0 1 1 1 1 1 1 220%
Science and Mathematics - 0 0 0 0 0 0 n/a
Notes
Data are for academic years (August 1st to July 31st)
Under 500 people started an apprenticeship in Science and Mathematics for every academic year since 2009/10.
Source: BIS FE data library: apprenticeships
Apprenticeship starts by sector subject area, thousands
Change 2009/10
to 2013/14
Data from 2011/12 onwards is not directly comparable to earlier years. Small technical changes have been made leading to a reduction in
overall learner numbers if approximately 2 per cent
* Data for 2014/15 are for August to January only.
Apprenticeship starts by sector subject, thousands
England (2013/14)
Source: BIS FE data library: apprenticeships
20 40 60 80 100 120 140
Business, Admin. and Law
Health
Retail
Engineering
Construction, Planning and the Built Environment
Information and Communication Technology
Leisure, Travel and Tourism
Agriculture, Horticulture and Animal Care
Education and Training
Arts, Media and Publishing
Science and Mathematics

9
6.2 Starts by framework
The table shows the twenty most popular apprenticeship frameworks in 2013/14 by the
number of starts, as well as a comparison with previous years. Generally, the most popular
frameworks were the same as for 2012/13, but there have been some notable changes since
2009/10. Health and Social Care (5th to 1st) and Management (11th to 3rd) have both risen
up the list.
Apprenticeship starts by framework, thousands
20 most popular frameworks in 2013/14
09/10 10/11 11/12 12/13 13/14 14/15*
Level %
Health and Social Care 18 54 71 81 70 36 52 292%
Business Administration 27 39 45 49 44 23 17 64%
Management 10 30 45 48 33 17 23 238%
Hospitality and Catering 21 30 36 36 32 16 11 49%
Customer Service 29 54 59 45 31 14 2 6%
Children's Care Learning & Development 20 27 26 26 24 11 4 21%
Retail 17 41 31 25 17 7 0 -2%
Engineering 15 18 13 14 16 12 1 4%
Construction Skills 14 16 14 14 16 13 1 10%
Industrial Applications 1 4 19 15 15 8 14 1098%
Hairdressing 16 16 17 16 15 9 -2 -10%
IT and Telecoms Professionals 8 12 12 9 10 6 2 22%
Active Leisure and Learning 11 18 16 12 9 5 -2 -19%
Vehicle Maintenance and Repair 10 9 8 8 9 6 -1 -12%
Warehousing and Storage 3 6 7 7 7 3 4 154%
Accountancy 5 7 8 8 7 5 1 24%
Electrotechnical 5 6 5 5 5 4 0 -1%
MES Plumbing 5 5 4 5 5 4 -1 -12%
Public Services 2 1 3 4 4 3 3 181%
Sales and Telesales 2 2 4 4 4 2 2 96%
* Data for 2014/15 are for August to January only.
Notes
Data are for academic years (August 1st to July 31st).
Source: BIS FE data library: apprenticeships
Change 2009/10
to 2013/14
10
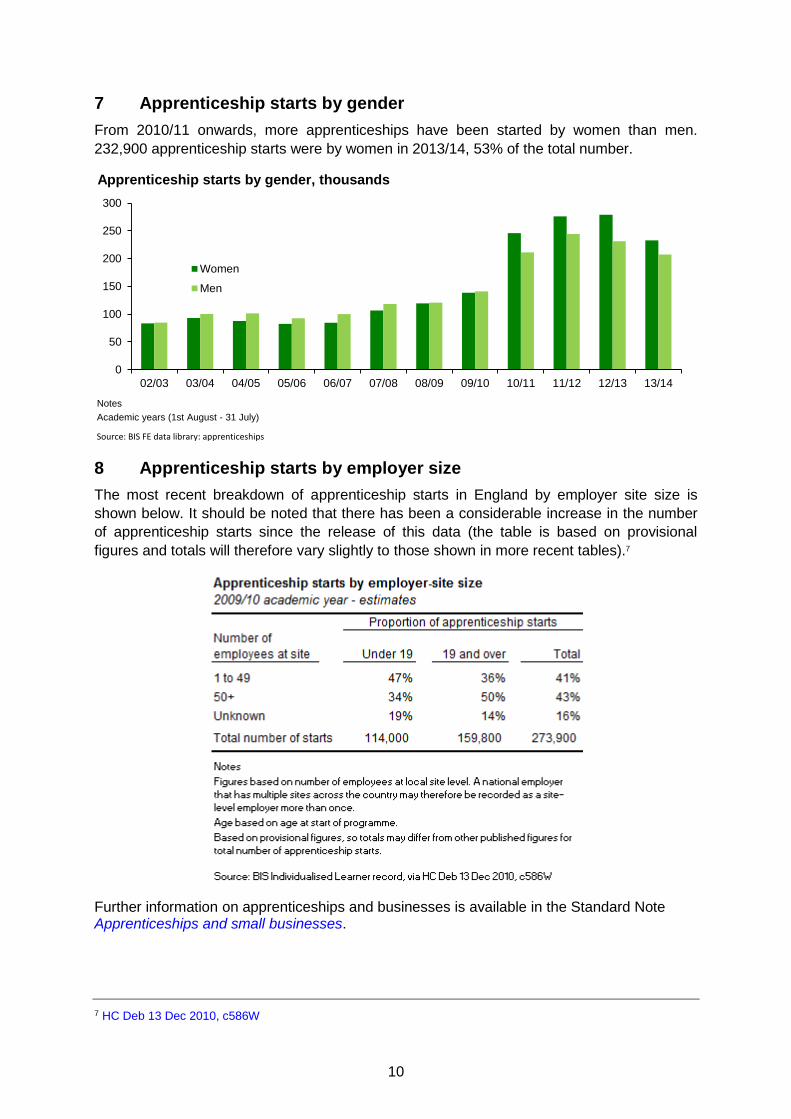
7 Apprenticeship starts by gender
From 2010/11 onwards, more apprenticeships have been started by women than men.
232,900 apprenticeship starts were by women in 2013/14, 53% of the total number.
8 Apprenticeship starts by employer size
The most recent breakdown of apprenticeship starts in England by employer site size is
shown below. It should be noted that there has been a considerable increase in the number
of apprenticeship starts since the release of this data (the table is based on provisional
figures and totals will therefore vary slightly to those shown in more recent tables).7
Further information on apprenticeships and businesses is available in the Standard Note Apprenticeships and small businesses.
7 HC Deb 13 Dec 2010, c586W
Apprenticeship starts by gender, thousands
Notes
Academic years (1st August - 31 July)
Source: BIS FE data library: apprenticeships
0
50
100
150
200
250
300
02/03 03/04 04/05 05/06 06/07 07/08 08/09 09/10 10/11 11/12 12/13 13/14
Women
Men

Apprenticeship Starts by Parliamentary Constituency in EnglandFigures for 2011/12 onwards are not directly comparable to earlier years as a new data collection system has been introduced.
These figures are based on the geographic boundaries as of May 2010.
Trailblazer starts are included within the total apprenticeship figures.
2009/10 2010/11 2011/12 2012/13 2013/14 2014/15
England 279,700 457,200 520,600 510,200 440,400 248,700
Aldershot 640 810 1,100 1,130 920 470
Aldridge Brownhills 460 800 870 850 720 440
Altrincham and Sale West 290 490 720 740 610 310
Amber Valley 600 890 1,080 1,070 930 520
Arundel and South Downs 300 470 480 470 400 220
Ashfield 710 1,270 1,490 1,380 1,150 740
Ashford 470 770 1,340 1,130 760 440
Ashton under Lyne 690 1,260 1,350 1,140 1,110 580
Aylesbury 740 760 810 980 860 430
Banbury 590 790 1,010 1,010 760 440
Barking 460 930 1,030 1,160 1,090 530
Barnsley Central 750 1,070 1,320 1,220 1,100 540
Barnsley East 830 1,130 1,420 1,320 1,210 650
Barrow and Furness 780 1,230 1,250 1,250 1,250 730
Basildon and Billericay 440 660 710 710 700 430
Basingstoke 510 910 1,060 950 950 500
Bassetlaw 620 1,000 1,140 1,220 1,050 650
Bath 290 460 490 450 390 210
Batley and Spen 620 1,160 1,240 1,170 1,040 590
Battersea 160 340 370 330 270 150
Beaconsfield 290 450 490 540 450 270
Beckenham 270 400 450 470 390 200
Bedford 350 620 620 920 750 370
Bermondsey and Old Southwark 320 680 800 840 650 310
Berwick upon Tweed 510 780 940 1,010 840 410
Bethnal Green and Bow 380 790 780 710 740 350
Beverley and Holderness 4,210 3,540 3,850 2,890 2,890 1,550
Bexhill and Battle 350 610 640 640 600 300
Bexleyheath and Crayford 380 630 740 790 640 350
Birkenhead 730 1,310 1,570 1,460 1,150 660
Birmingham Edgbaston 400 740 770 780 660 350
Birmingham Erdington 650 1,050 1,160 1,430 1,190 730
Birmingham Hall Green 440 830 820 830 770 440
Birmingham Hodge Hill 570 1,060 1,080 1,180 1,050 640
Birmingham Ladywood 510 1,050 1,070 1,070 970 540
Birmingham Northfield 640 1,360 1,440 1,390 1,130 690
Birmingham Perry Barr 560 1,060 1,060 1,190 910 580
Birmingham Selly Oak 510 930 1,000 990 870 520
Birmingham Yardley 640 1,130 1,270 1,310 1,130 680
Bishop Auckland 510 1,160 1,370 1,240 1,070 620
Blackburn 670 1,060 1,290 1,310 1,240 580
Blackley and Broughton 680 1,170 1,290 1,260 1,080 590
Blackpool North and Cleveleys 680 990 1,060 1,060 810 470
Blackpool South 770 1,070 1,140 1,200 950 520
Blaydon 590 1,180 1,210 1,120 1,000 560
Blyth Valley 660 1,320 1,400 1,370 1,210 620
Bognor Regis and Littlehampton 460 850 910 980 860 430
Bolsover 590 1,030 1,220 1,340 1,110 620
Bolton North East 660 1,000 1,130 1,150 930 520
Bolton South East 640 1,030 1,270 1,220 1,040 610
Aug to Oct
only
Data are based upon the home postcode of the learner. England total includes apprentices with postcodes outside of England.
11

Apprenticeship Starts by Parliamentary Constituency in EnglandFigures for 2011/12 onwards are not directly comparable to earlier years as a new data collection system has been introduced.
These figures are based on the geographic boundaries as of May 2010.
Trailblazer starts are included within the total apprenticeship figures.
2009/10 2010/11 2011/12 2012/13 2013/14 2014/15
England 279,700 457,200 520,600 510,200 440,400 248,700
Aug to Oct
only
Data are based upon the home postcode of the learner. England total includes apprentices with postcodes outside of England.
Bolton West 610 990 1,090 1,060 930 550
Bootle 930 1,510 1,780 1,760 1,260 750
Boston and Skegness 510 880 910 950 780 480
Bosworth 390 1,080 990 1,030 820 530
Bournemouth East 530 920 940 1,080 920 570
Bournemouth West 550 820 870 1,100 880 530
Bracknell 510 800 840 950 750 460
Bradford East 610 1,140 1,140 1,020 920 450
Bradford South 670 1,120 1,240 1,340 1,120 540
Bradford West 490 820 890 800 750 360
Braintree 410 820 850 980 790 440
Brent Central 280 690 840 750 650 370
Brent North 230 630 710 590 550 310
Brentford and Isleworth 270 540 620 530 480 270
Brentwood and Ongar 360 520 600 590 530 320
Bridgwater and West Somerset 620 1,030 1,140 1,060 810 530
Brigg and Goole 460 810 950 1,020 830 510
Brighton Kemptown 350 640 710 760 600 250
Brighton Pavilion 240 520 540 520 410 180
Bristol East 590 1,050 1,100 1,040 880 470
Bristol North West 500 800 840 780 710 350
Bristol South 760 1,100 1,250 1,110 940 490
Bristol West 260 570 610 540 490 220
Broadland 440 690 880 790 680 410
Bromley and Chislehurst 260 460 550 570 480 240
Bromsgrove 490 820 920 910 750 410
Broxbourne 290 570 560 670 660 370
Broxtowe 440 690 810 890 760 440
Buckingham 360 470 480 520 510 300
Burnley 510 890 1,170 1,290 1,000 600
Burton 540 1,010 1,180 1,150 1,080 540
Bury North 620 770 1,000 1,070 820 410
Bury South 640 950 1,050 1,050 910 500
Bury St Edmunds 750 910 1,130 1,010 970 470
Calder Valley 570 1,020 1,030 1,110 930 590
Camberwell and Peckham 320 790 870 840 780 320
Camborne and Redruth 600 800 960 810 760 410
Cambridge 260 380 530 610 500 250
Cannock Chase 580 1,260 1,160 1,410 1,150 560
Canterbury 310 540 570 610 460 240
Carlisle 640 950 1,000 980 980 570
Carshalton and Wallington 400 680 720 690 570 360
Castle Point 500 980 870 700 700 450
Central Devon 510 720 780 690 640 370
Central Suffolk and North Ipswich 480 660 780 780 710 440
Charnwood 450 760 980 1,020 740 590
Chatham and Aylesford 420 820 900 850 680 430
Cheadle 490 760 740 690 610 340
Chelmsford 530 740 920 760 690 410
Chelsea and Fulham 100 230 220 200 180 90
12

Apprenticeship Starts by Parliamentary Constituency in EnglandFigures for 2011/12 onwards are not directly comparable to earlier years as a new data collection system has been introduced.
These figures are based on the geographic boundaries as of May 2010.
Trailblazer starts are included within the total apprenticeship figures.
2009/10 2010/11 2011/12 2012/13 2013/14 2014/15
England 279,700 457,200 520,600 510,200 440,400 248,700
Aug to Oct
only
Data are based upon the home postcode of the learner. England total includes apprentices with postcodes outside of England.
Cheltenham 340 590 730 700 590 310
Chesham and Amersham 230 360 390 420 390 190
Chesterfield 600 1,110 1,330 1,240 1,160 620
Chichester 330 560 550 600 530 290
Chingford and Woodford Green 340 530 540 550 560 290
Chippenham 460 690 670 700 590 390
Chipping Barnet 170 380 480 390 370 200
Chorley 650 1,040 1,120 1,100 830 570
Christchurch 460 640 680 660 580 370
Cities of London and Westminster 240 570 520 450 400 240
City of Chester 410 750 900 880 710 350
City of Durham 400 840 890 880 720 510
Clacton 410 840 900 1,000 960 440
Cleethorpes 510 780 990 990 810 520
Colchester 470 870 1,120 1,130 1,040 540
Colne Valley 700 1,010 1,220 1,000 900 580
Congleton 490 800 920 1,000 900 440
Copeland 620 890 990 980 950 630
Corby 570 950 1,190 1,490 1,040 820
Coventry North East 660 1,230 1,460 1,400 1,040 610
Coventry North West 650 1,070 1,280 1,290 1,080 600
Coventry South 510 850 1,060 960 820 470
Crawley 450 770 850 820 730 390
Crewe and Nantwich 680 1,230 1,490 1,340 1,050 630
Croydon Central 490 820 1,010 950 750 390
Croydon North 400 920 1,070 1,080 810 450
Croydon South 340 530 670 660 580 300
Dagenham and Rainham 450 770 860 950 880 470
Darlington 620 1,310 1,700 1,440 1,100 600
Dartford 330 680 830 770 730 350
Daventry 440 620 770 940 740 460
Denton and Reddish 720 1,320 1,370 1,220 1,160 570
Derby North 690 1,060 1,150 1,070 990 510
Derby South 800 1,120 1,210 1,190 1,120 570
Derbyshire Dales 340 530 620 660 580 350
Devizes 1,590 1,870 2,070 2,160 1,640 1,010
Dewsbury 670 1,160 1,200 1,040 940 520
Don Valley 830 1,120 1,430 1,160 1,020 650
Doncaster Central 750 1,230 1,570 1,240 1,170 680
Doncaster North 860 1,260 1,560 1,240 1,150 670
Dover 440 680 790 880 780 440
Dudley North 640 1,060 1,000 940 900 510
Dudley South 550 950 920 1,000 770 450
Dulwich and West Norwood 230 520 570 530 460 220
Ealing Central and Acton 180 450 440 420 380 180
Ealing North 340 790 840 690 680 340
Ealing Southall 220 530 600 560 540 310
Easington 630 1,250 1,500 1,330 1,200 790
East Devon 1,310 1,360 1,460 1,520 1,360 700
East Ham 370 930 1,000 960 990 440
13

Apprenticeship Starts by Parliamentary Constituency in EnglandFigures for 2011/12 onwards are not directly comparable to earlier years as a new data collection system has been introduced.
These figures are based on the geographic boundaries as of May 2010.
Trailblazer starts are included within the total apprenticeship figures.
2009/10 2010/11 2011/12 2012/13 2013/14 2014/15
England 279,700 457,200 520,600 510,200 440,400 248,700
Aug to Oct
only
Data are based upon the home postcode of the learner. England total includes apprentices with postcodes outside of England.
East Hampshire 280 440 490 520 760 490
East Surrey 360 580 630 660 580 290
East Worthing and Shoreham 400 560 790 770 650 310
East Yorkshire 460 770 860 840 860 460
Eastbourne 510 880 930 920 830 350
Eastleigh 550 900 910 1,010 890 510
Eddisbury 470 800 860 830 800 390
Edmonton 280 640 780 770 730 380
Ellesmere Port and Neston 570 1,070 1,280 1,170 950 550
Elmet and Rothwell 520 900 900 870 770 440
Eltham 360 640 720 660 560 270
Enfield North 280 570 660 710 590 320
Enfield Southgate 150 340 400 370 310 220
Epping Forest 320 590 590 600 560 270
Epsom and Ewell 260 350 490 510 410 270
Erewash 680 970 1,140 1,220 1,070 590
Erith and Thamesmead 390 960 1,110 1,060 840 430
Esher and Walton 220 370 380 380 370 190
Exeter 680 900 950 890 780 450
Fareham 420 710 860 860 740 470
Faversham and Mid Kent 310 660 680 720 610 300
Feltham and Heston 450 760 1,110 930 870 530
Filton and Bradley Stoke 490 850 820 820 730 450
Finchley and Golders Green 130 300 330 370 270 180
Folkestone and Hythe 420 760 1,030 1,070 960 500
Forest of Dean 400 630 760 790 720 420
Fylde 470 780 850 880 750 460
Gainsborough 510 870 850 920 780 480
Garston and Halewood 860 1,740 1,770 1,380 1,010 580
Gateshead 680 1,230 1,310 1,180 1,030 590
Gedling 590 870 980 1,070 940 490
Gillingham and Rainham 410 700 800 740 710 370
Gloucester 760 1,050 1,300 1,390 1,140 690
Gosport 2,080 1,730 2,040 2,150 2,330 1,240
Grantham and Stamford 520 840 1,060 1,020 760 450
Gravesham 380 600 700 800 680 380
Great Grimsby 480 760 940 860 740 440
Great Yarmouth 450 760 860 920 790 470
Greenwich and Woolwich 310 720 880 860 690 330
Guildford 230 410 440 460 400 210
Hackney North and Stoke Newington 230 560 630 510 510 230
Hackney South and Shoreditch 240 580 690 670 580 280
Halesowen and Rowley Regis 540 940 960 1,060 890 520
Halifax 650 1,180 1,200 1,280 1,100 660
Haltemprice and Howden 450 720 750 700 620 420
Halton 830 1,440 1,530 1,270 1,090 560
Hammersmith 250 510 540 410 370 180
Hampstead and Kilburn 130 320 360 380 310 170
Harborough 440 750 860 960 700 490
Harlow 450 800 820 930 770 400
14

Apprenticeship Starts by Parliamentary Constituency in EnglandFigures for 2011/12 onwards are not directly comparable to earlier years as a new data collection system has been introduced.
These figures are based on the geographic boundaries as of May 2010.
Trailblazer starts are included within the total apprenticeship figures.
2009/10 2010/11 2011/12 2012/13 2013/14 2014/15
England 279,700 457,200 520,600 510,200 440,400 248,700
Aug to Oct
only
Data are based upon the home postcode of the learner. England total includes apprentices with postcodes outside of England.
Harrogate and Knaresborough 1,780 1,990 2,220 1,490 740 410
Harrow East 200 450 490 430 390 210
Harrow West 170 520 510 450 380 210
Hartlepool 670 1,080 1,400 1,240 1,260 700
Harwich and North Essex 360 620 740 720 670 370
Hastings and Rye 430 980 870 860 790 360
Havant 420 650 900 860 830 460
Hayes and Harlington 440 770 940 930 810 470
Hazel Grove 570 910 1,000 840 880 420
Hemel Hempstead 350 630 740 760 700 340
Hemsworth 610 890 1,090 980 920 480
Hendon 230 510 610 570 490 240
Henley 310 460 570 580 470 270
Hereford and South Herefordshire 630 960 1,220 1,100 940 550
Hertford and Stortford 270 590 730 720 490 300
Hertsmere 300 570 690 620 520 300
Hexham 430 650 800 700 670 340
Heywood and Middleton 760 1,200 1,540 1,280 1,160 660
High Peak 490 800 1,010 900 830 500
Hitchin and Harpenden 220 410 380 430 380 210
Holborn and St Pancras 300 540 540 500 440 240
Hornchurch and Upminster 370 600 710 800 780 420
Hornsey and Wood Green 180 470 530 430 390 200
Horsham 380 530 590 620 530 280
Houghton and Sunderland South 820 1,610 1,480 1,340 1,170 750
Hove 330 520 670 630 520 260
Huddersfield 610 980 1,130 940 920 550
Huntingdon 370 620 800 890 790 470
Hyndburn 720 1,070 1,320 1,440 1,180 660
Ilford North 270 480 580 560 530 300
Ilford South 270 550 620 710 650 330
Ipswich 610 840 1,100 990 970 590
Isle of Wight 820 1,690 1,760 1,630 1,430 740
Islington North 190 420 430 430 390 160
Islington South and Finsbury 220 450 460 450 410 190
Jarrow 740 1,240 1,350 1,280 1,030 670
Keighley 500 790 880 760 700 430
Kenilworth and Southam 310 440 480 560 460 280
Kensington 130 260 280 240 230 110
Kettering 520 840 980 1,030 850 500
Kingston and Surbiton 240 490 500 490 470 230
Kingston upon Hull East 800 1,280 1,360 1,280 1,020 620
Kingston upon Hull North 620 1,010 1,170 1,050 900 520
Kingston upon Hull West and Hessle 680 1,050 1,100 1,070 770 540
Kingswood 610 930 1,110 1,080 950 550
Knowsley 1,040 1,810 2,130 1,840 1,480 770
Lancaster and Fleetwood 500 750 720 760 660 400
Leeds Central 580 1,220 1,340 1,200 1,000 590
Leeds East 540 1,120 1,160 1,040 970 510
Leeds North East 340 630 630 570 510 250
15

Apprenticeship Starts by Parliamentary Constituency in EnglandFigures for 2011/12 onwards are not directly comparable to earlier years as a new data collection system has been introduced.
These figures are based on the geographic boundaries as of May 2010.
Trailblazer starts are included within the total apprenticeship figures.
2009/10 2010/11 2011/12 2012/13 2013/14 2014/15
England 279,700 457,200 520,600 510,200 440,400 248,700
Aug to Oct
only
Data are based upon the home postcode of the learner. England total includes apprentices with postcodes outside of England.
Leeds North West 280 560 580 490 470 250
Leeds West 580 1,110 1,160 1,100 920 490
Leicester East 350 760 900 940 680 500
Leicester South 390 770 850 830 730 530
Leicester West 480 1,010 1,190 1,240 970 520
Leigh 830 1,270 1,390 1,320 1,110 640
Lewes 250 580 540 540 460 220
Lewisham Deptford 290 590 850 690R
740 290
Lewisham East 310 610 820 790R
690 300
Lewisham West and Penge 340 610 810 720R
610 300
Leyton and Wanstead 270 550 670 610 590 290
Lichfield 480 860 860 850 950 590
Lincoln 720 1,000 1,340 1,340 1,010 600
Liverpool Riverside 610 1,220 1,260 1,050 760 410
Liverpool Walton 900 1,550 1,740 1,520 1,170 600
Liverpool Wavertree 570 1,090 1,260 1,030 750 420
Liverpool West Derby 760 1,330 1,650 1,470 1,140 620
Loughborough 380 710 760 870 710 400
Louth and Horncastle 490 670 750 930 730 430
Ludlow 380 560 660 750 600 310
Luton North 290 720 850 740 700 440
Luton South 390 750 830 890 890 460
Macclesfield 420 670 820 740 660 390
Maidenhead 320 440 520 570 530 270
Maidstone and The Weald 290 560 690 720 620 350
Makerfield 790 1,340 1,480 1,390 1,170 670
Maldon 460 740 820 690 580 400
Manchester Central 740 1,310 1,260 1,180 1,140 550
Manchester Gorton 460 920 980 910 800 400
Manchester Withington 350 630 690 650 570 310
Mansfield 840 1,330 1,370 1,430 1,130 710
Meon Valley 610 710 910 860 810 450
Meriden 610 910 1,190 1,260 980 660
Mid Bedfordshire 390 560 700 790 650 410
Mid Derbyshire 600 890 940 800 790 480
Mid Dorset and North Poole 470 590 670 720 640 390
Mid Norfolk 460 730 850 830 800 470
Mid Sussex 300 520 580 560 480 320
Mid Worcestershire 430 710 860 850 810 360
Middlesbrough 680 1,120 1,260 1,330 1,000 590
Middlesbrough South and East Cleveland 640 1,220 1,300 1,220 1,020 640
Milton Keynes North 540 960 1,170 1,190 860 440
Milton Keynes South 570 1,020 1,060 1,130 950 490
Mitcham and Morden 320 720 740 740 590 320
Mole Valley 210 270 360 390 340 200
Morecambe and Lunesdale 560 980 1,050 1,130 870 550
Morley and Outwood 520 1,040 1,040 1,030 900 550
New Forest East 530 910 960 900 800 450
New Forest West 370 580 650 700 580 380
Newark 560 790 910 1,070 810 470
16

Apprenticeship Starts by Parliamentary Constituency in EnglandFigures for 2011/12 onwards are not directly comparable to earlier years as a new data collection system has been introduced.
These figures are based on the geographic boundaries as of May 2010.
Trailblazer starts are included within the total apprenticeship figures.
2009/10 2010/11 2011/12 2012/13 2013/14 2014/15
England 279,700 457,200 520,600 510,200 440,400 248,700
Aug to Oct
only
Data are based upon the home postcode of the learner. England total includes apprentices with postcodes outside of England.
Newbury 480 710 790 820 730 460
Newcastle under Lyme 640 1,040 1,080 1,180 930 530
Newcastle upon Tyne Central 520 1,000 1,120 940 780 460
Newcastle upon Tyne East 510 930 950 930 760 420
Newcastle upon Tyne North 620 1,080 1,170 1,040 980 520
Newton Abbot 610 890 1,010 980 760 430
Normanton Pontefract and Castleford 680 1,280 1,390 1,350 1,260 680
North Cornwall 500 830 1,110 960 830 460
North Devon 450 650 850 760 610 390
North Dorset 1,670 2,160 1,910 1,400 1,720 910
North Durham 650 1,370 1,430 1,330 1,040 680
North East Bedfordshire 330 560 730 730 710 390
North East Cambridgeshire 410 730 1,060 1,030 860 480
North East Derbyshire 570 990 1,110 1,120 1,000 570
North East Hampshire 300 520 570 620 520 270
North East Hertfordshire 290 640 600 620 540 310
North East Somerset 390 570 710 670 600 340
North Herefordshire 420 690 810 750 730 380
North Norfolk 380 600 710 740 630 380
North Shropshire 670 1,050 1,220 1,140 940 510
North Somerset 510 780 830 760 700 400
North Swindon 580 880 1,040 930 810 520
North Thanet 460 950 960 1,040 820 480
North Tyneside 890 1,730 1,850 1,630 1,340 730
North Warwickshire 450 850 950 1,060 880 590
North West Cambridgeshire 550 900 1,170 1,230 930 540
North West Durham 620 1,200 1,470 1,370 1,130 750
North West Hampshire 990 930 870 1,020 1,280 620
North West Leicestershire 420 970 970 1,040 800 570
North West Norfolk 460 770 840 800 650 380
North Wiltshire 370 520 520 560 470 290
Northampton North 470 800 1,030 1,030 800 420
Northampton South 510 870 1,220 1,320 970 500
Norwich North 460 700 980 810 710 430
Norwich South 370 550 730 640 580 310
Nottingham East 460 730 810 920 830 420
Nottingham North 790 1,200 1,330 1,470 1,280 680
Nottingham South 450 720 780 830 700 400
Nuneaton 500 830 1,010 1,080 860 570
Old Bexley and Sidcup 370 650 690 700 570 310
Oldham East and Saddleworth 580 1,060 1,140 1,200 990 540
Oldham West and Royton 700 1,170 1,260 1,170 1,100 630
Orpington 330 460 590 590 470 270
Oxford East 350 630 730 710 510 310
Oxford West and Abingdon 350 500 620 600 530 320
Pendle 470 820 970 1,150 870 430
Penistone and Stocksbridge 660 980 1,030 1,020 880 570
Penrith and The Border 420 710 840 780 740 440
Peterborough 520 840 980 1,070 850 490
Plymouth Moor View 880 1,190 1,530 1,330 1,140 660
17

Apprenticeship Starts by Parliamentary Constituency in EnglandFigures for 2011/12 onwards are not directly comparable to earlier years as a new data collection system has been introduced.
These figures are based on the geographic boundaries as of May 2010.
Trailblazer starts are included within the total apprenticeship figures.
2009/10 2010/11 2011/12 2012/13 2013/14 2014/15
England 279,700 457,200 520,600 510,200 440,400 248,700
Aug to Oct
only
Data are based upon the home postcode of the learner. England total includes apprentices with postcodes outside of England.
Plymouth Sutton and Devonport 870 1,280 1,520 1,350 1,080 640
Poole 480 740 810 980 780 430
Poplar and Limehouse 400 890 910 850 920 420
Portsmouth North 400 790 1,110 1,100 960 590
Portsmouth South 280 610 990 870 680 390
Preston 700 1,070 1,170 1,120 930 640
Pudsey 460 770 820 850 750 420
Putney 140 290 330 300 240 130
Rayleigh and Wickford 490 790 850 780 680 500
Reading East 410 790 740 790 650 380
Reading West 580 920 1,080 1,030 880 520
Redcar 660 1,270 1,380 1,460 1,150 670
Redditch 440 920 950 1,120 890 470
Reigate 230 410 470 460 410 270
Ribble Valley 680 1,000 1,080 1,160 890 570
Richmond (Yorks) 580 1,150 3,670 4,710 4,500 3,000
Richmond Park 130 220 270 250 220 120
Rochdale 660 1,150 1,220 1,080 1,010 650
Rochester and Strood 840 1,200 1,330 1,580 1,420 670
Rochford and Southend East 410 750 740 900 750 490
Romford 390 580 710 800 720 440
Romsey and Southampton North 470 770 840 740 760 380
Rossendale and Darwen 660 1,020 1,250 1,340 1,100 610
Rother Valley 620 980 1,180 1,180 1,020 580
Rotherham 700 1,040 1,210 1,050 1,050 530
Rugby 570 870 1,020 1,110 720 490
Ruislip Northwood and Pinner 220 440 480 430 340 220
Runnymede and Weybridge 200 340 500 510 510 250
Rushcliffe 360 590 660 700 600 310
Rutland and Melton 370 690 830 910 680 440
Saffron Walden 370 620 660 730 530 320
Salford and Eccles 790 1,300 1,490 1,230 1,160 610
Salisbury 430 570 610 660 600 270
Scarborough and Whitby 560 860 1,050 1,070 880 590
Scunthorpe 530 840 870 920 810 540
Sedgefield 570 1,290 1,430 1,230 1,080 590
Sefton Central 490 860 960 1,070 740 430
Selby and Ainsty 510 880 1,030 920 800 450
Sevenoaks 220 440 510 550 420 260
Sheffield Brightside and Hillsborough 870 1,250 1,270 1,260 1,180 650
Sheffield Central 440 630 650 610 520 300
Sheffield Hallam 310 450 510 420 390 240
Sheffield Heeley 730 1,150 1,120 990 910 500
Sheffield South East 740 1,210 1,230 1,150 1,030 620
Sherwood 640 990 1,150 1,220 990 580
Shipley 460 750 790 860 740 400
Shrewsbury and Atcham 510 950 1,130 1,150 780 450
Sittingbourne and Sheppey 440 750 1,090 1,070 1,010 570
Skipton and Ripon 510 820 820 840 750 420
Sleaford and North Hykeham 690 930 1,050 1,230 940 500
18

Apprenticeship Starts by Parliamentary Constituency in EnglandFigures for 2011/12 onwards are not directly comparable to earlier years as a new data collection system has been introduced.
These figures are based on the geographic boundaries as of May 2010.
Trailblazer starts are included within the total apprenticeship figures.
2009/10 2010/11 2011/12 2012/13 2013/14 2014/15
England 279,700 457,200 520,600 510,200 440,400 248,700
Aug to Oct
only
Data are based upon the home postcode of the learner. England total includes apprentices with postcodes outside of England.
Slough 460 730 960 1,010 890 510
Solihull 470 720 880 960 780 470
Somerton and Frome 530 750 860 810 700 420
South Basildon and East Thurrock 560 770 900 890 780 500
South Cambridgeshire 360 580 580 580 570 270
South Derbyshire 510 970 1,110 1,110 930 550
South Dorset 1,920 1,680 2,060 1,860 1,750 1,090
South East Cambridgeshire 450 570 770 830 670 410
South East Cornwall 830 980 1,230 1,060 1,010 550
South Holland and The Deepings 470 880 970 940 750 460
South Leicestershire 520 960 1,090 1,090 830 540
South Norfolk 370 580 650 680 660 380
South Northamptonshire 530 710 890 950 840 420
South Ribble 670 1,060 1,060 1,070 890 530
South Shields 660 1,270 1,360 1,230 1,060 650
South Staffordshire 570 830 1,070 970 830 490
South Suffolk 380 570 640 810 720 400
South Swindon 500 760 950 910 750 420
South Thanet 360 620 780 870 730 350
South West Bedfordshire 440 700 840 870 710 440
South West Devon 780 1,010 1,260 1,050 930 570
South West Hertfordshire 280 480 490 500 420 190
South West Norfolk 510 820 1,140 990 780 410
South West Surrey 220 360 420 490 410 210
South West Wiltshire 940 1,280 1,460 1,040 1,170 680
Southampton Itchen 530 890 970 1,060 880 490
Southampton Test 430 820 890 880 810 410
Southend West 300 520 600 630 610 300
Southport 550 1,000 1,100 1,040 890 460
Spelthorne 370 570 630 670 630 340
St Albans 250 430 510 470 390 220
St Austell and Newquay 650 1,030 1,230 1,130 920 600
St Helens North 710 1,140 1,570 1,300 1,150 610
St Helens South and Whiston 720 1,240 1,660 1,440 1,240 690
St Ives 570 710 800 760 650 350
Stafford 420 820 830 970 750 400
Staffordshire Moorlands 480 780 850 870 730 400
Stalybridge and Hyde 670 1,150 1,170 1,130 1,060 520
Stevenage 380 680 810 830 710 390
Stockport 630 1,090 1,200 950 970 530
Stockton North 670 1,180 1,470 1,400 1,250 650
Stockton South 600 1,110 1,210 1,320 1,090 540
Stoke on Trent Central 610 900 1,040 1,190 890 480
Stoke on Trent North 730 1,240 1,280 1,520 1,210 650
Stoke on Trent South 670 1,110 1,230 1,330 1,160 640
Stone 410 700 850 840 720 370
Stourbridge 480 810 800 900 710 430
Stratford on Avon 290 510 620 700 600 280
Streatham 200 540 600 530 440 230
Stretford and Urmston 570 980 1,150 1,150 1,090 530
19

Apprenticeship Starts by Parliamentary Constituency in EnglandFigures for 2011/12 onwards are not directly comparable to earlier years as a new data collection system has been introduced.
These figures are based on the geographic boundaries as of May 2010.
Trailblazer starts are included within the total apprenticeship figures.
2009/10 2010/11 2011/12 2012/13 2013/14 2014/15
England 279,700 457,200 520,600 510,200 440,400 248,700
Aug to Oct
only
Data are based upon the home postcode of the learner. England total includes apprentices with postcodes outside of England.
Stroud 520 600 780 790 660 400
Suffolk Coastal 490 760 850 770 740 440
Sunderland Central 850 1,390 1,400 1,360 1,140 810
Surrey Heath 1,360 890 980 1,030 1,080 350
Sutton and Cheam 310 530 580 560 490 290
Sutton Coldfield 410 580 720 780 630 340
Tamworth 460 960 1,070 1,060 930 480
Tatton 340 520 590 610 590 280
Taunton Deane 660 950 1,050 1,090 900 480
Telford 550 960 1,100 1,410 1,120 530
Tewkesbury 460 740 870 870 710 420
The Cotswolds 350 540 570 570 530 280
The Wrekin 1,360 1,650 1,850 1,710 1,740 890
Thirsk and Malton 490 720 940 920 800 500
Thornbury and Yate 460 790 900 720 670 420
Thurrock 430 830 910 940 870 510
Tiverton and Honiton 560 790 910 810 790 480
Tonbridge and Malling 240 390 480 550 460 240
Tooting 140 300 350 380 300 120
Torbay 710 1,170 1,270 1,210 980 510
Torridge and West Devon 590 930 1,060 910 810 470
Totnes 450 700 820 700 620 380
Tottenham 330 790 820 760 690 390
Truro and Falmouth 600 700 930 720 650 340
Tunbridge Wells 210 360 450 520 440 250
Twickenham 190 340 390 350 310 150
Tynemouth 660 1,200 1,290 1,230 1,030 570
Uxbridge and South Ruislip 410 680 800 720 590 370
Vauxhall 250 500 640 580 520 250
Wakefield 530 1,060 1,050 930 860 500
Wallasey 710 1,360 1,710 1,550 1,140 650
Walsall North 630 970 1,250 1,190 970 560
Walsall South 590 970 1,140 1,050 800 460
Walthamstow 320 630 710 690 650 360
Wansbeck 630 1,120 1,370 1,330 1,140 550
Wantage 410 600 760 800 720 400
Warley 600 1,020 990 1,010 880 520
Warrington North 1,050 1,290 1,450 1,160 1,050 590
Warrington South 840 1,150 1,420 1,100 1,040 490
Warwick and Leamington 350 590 610 800 710 390
Washington and Sunderland West 810 1,440 1,540 1,390 1,220 810
Watford 380 790 750 810 650 340
Waveney 540 880 920 1,020 830 550
Wealden 350 690 670 750 530 320
Weaver Vale 520 890 1,100 930 830 450
Wellingborough 560 1,000 1,050 1,120 900 500
Wells 480 890 1,020 1,000 770 410
Welwyn Hatfield 310 660 660 640 550 290
Wentworth and Dearne 710 1,130 1,390 1,180 1,070 670
West Bromwich East 540 990 1,090 1,060 890 480
20

Apprenticeship Starts by Parliamentary Constituency in EnglandFigures for 2011/12 onwards are not directly comparable to earlier years as a new data collection system has been introduced.
These figures are based on the geographic boundaries as of May 2010.
Trailblazer starts are included within the total apprenticeship figures.
2009/10 2010/11 2011/12 2012/13 2013/14 2014/15
England 279,700 457,200 520,600 510,200 440,400 248,700
Aug to Oct
only
Data are based upon the home postcode of the learner. England total includes apprentices with postcodes outside of England.
West Bromwich West 670 1,160 1,230 1,290 1,040 580
West Dorset 520 680 880 810 710 430
West Ham 430 1,060 1,210 1,190 1,140 560
West Lancashire 550 950 1,070 1,030 820 480
West Suffolk 460 730 990 920 810 490
West Worcestershire 310 630 810 730 620 340
Westminster North 180 310 330 270 250 140
Westmorland and Lonsdale 370 720 770 760 730 450
Weston Super Mare 700 1,240 1,270 1,120 1,060 550
Wigan 810 1,340 1,440 1,410 1,100 690
Wimbledon 110 240 260 230 190 110
Winchester 970 800 960 1,020 730 400
Windsor 320 500 540 640 440 270
Wirral South 350 760 810 780 630 350
Wirral West 430 720 770 730 620 320
Witham 440 770 830 750 640 370
Witney 530 620 780 840 750 430
Woking 360 580 680 690 590 280
Wokingham 2,450 2,240 2,140 2,370 1,850 930
Wolverhampton North East 660 980 1,210 1,060 990 510
Wolverhampton South East 600 1,040 1,140 1,110 960 490
Wolverhampton South West 400 670 780 750 660 340
Worcester 470 880 1,060 1,010 870 400
Workington 520 780 990 990 900 680
Worsley and Eccles South 740 1,180 1,370 1,390 1,270 660
Worthing West 330 520 760 790 620 320
Wycombe 420 650 600 670 580 310
Wyre and Preston North 460 720 740 830 580 360
Wyre Forest 460 980 1,080 1,080 880 510
Wythenshawe and Sale East 620 1,150 1,510 1,320 1,160 660
Yeovil 770 1,010 1,170 1,190 1,010 660
York Central 530 850 960 900 710 480
York Outer 420 650 700 680 600 410
North East 18,510 34,550 38,340 35,870 30,480 17,760
North West 47,280 78,660 89,310 84,180 71,670 40,010
Yorkshire and The Humber 36,530 55,800 64,200 59,900 53,120 31,020
East Midlands 24,620 40,860 46,790 49,010 40,290 23,900
West Midlands 31,720 54,290 60,470 62,430 52,410 29,410
East of England 23,730 39,760 45,820 46,220 40,430 23,130
London 20,350 41,400 47,230 45,070 40,050 20,850
South East 39,120 58,340 66,850 68,960 60,220 32,380
South West 35,020 49,330 55,950 52,540 45,960 26,500
21