
Appraising Motion Picture Studios. Some Background.
15
Appraising Motion Picture Studios
-
Upload
naomi-fields -
Category
Documents
-
view
220 -
download
3
Transcript of Appraising Motion Picture Studios. Some Background.

Appraising Motion Picture Studios

Some Background

Historically the Studios were owned and operated by major production companies.
Product filmed and edited on the major’s lots.
Limited facilities used for outside rentals.
Many operators came on line to operate properties for real estate revenue
Began to change substantially in the 1980s
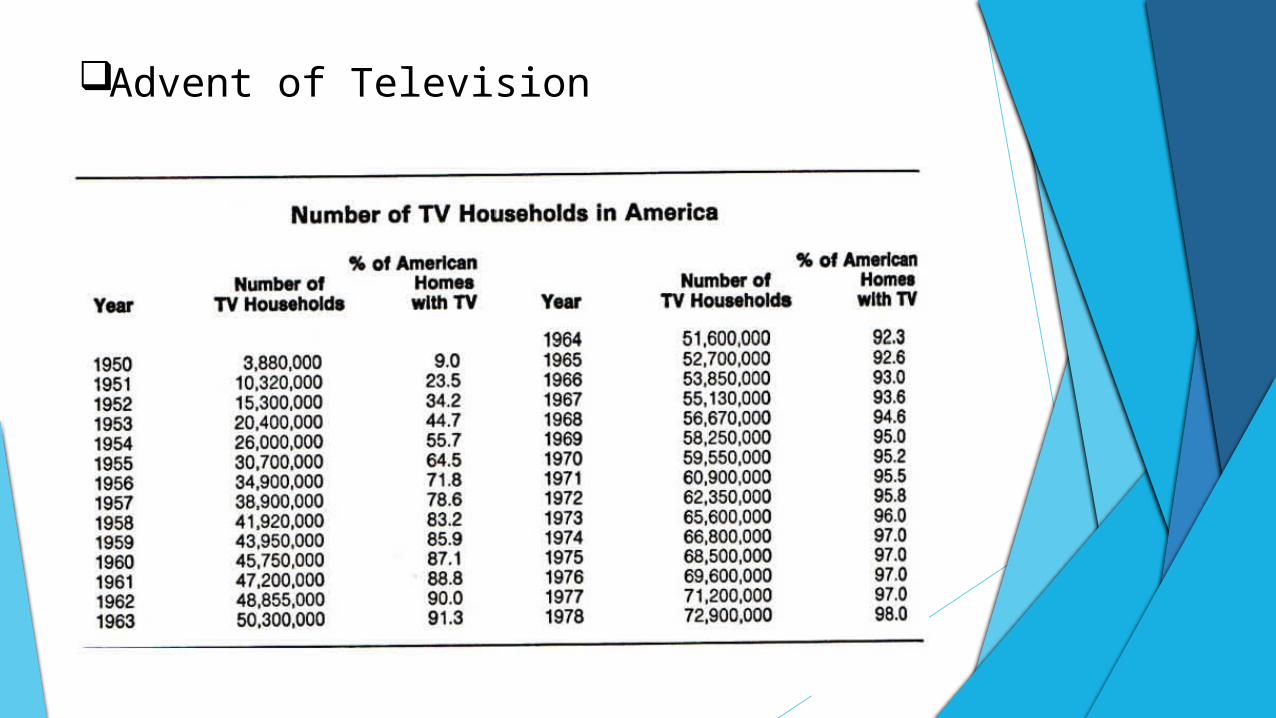
Advent of Television

Decline of the Major Studios Movie attendance (which had been declining steadily since the Golden
Age) hit an all-time low in 1971.
Example: From 15 releases in 1973, the next year MGM was down to 5; its average for the rest of the 1970s would be even lower.
New independent (some major-related) production companies emerged: Touchstone Pictures, Buena Vista, Orion Pictures, Tri_-Star Pictures, HBO
In 1986, the combined share of the six classic majors—at that point Paramount, Warner Bros., Columbia, Universal, Fox, and MGM/UA—fell to 64%, the lowest since the beginning of the Golden Age.
Smaller independents garnered 13%—more than any major studio aside from Paramount.
By comparison in 1964 all of the companies beside the then seven majors and Disney had combined for a grand total of 1%.

Movie Attendance

Filling A Void

Rise of the For Rent Facility
Not just a Cost Approach any more
Entrepreneurs take advantage; not “movie” people
Several facilities with “deferred maintenance” (nicely said)
Occupancy rises, increased demand
Renovations begin, some stages and offices added

Major Motion Picture StudiosWarner Bros. Burbank
Universal Universal City
Paramount Hollywood
Sony Culver City
CBS - Radford Studio City
Fox Century City
Disney Burbank
Culver Culver City
Manhattan Beach Manhattan Beach
Raleigh Hollywood
Sunset-Gower Hollywood
Hollywood Center Hollywood
Sunset Bronson (KTLA) Hollywood
The Lot West Hollywood
Los Angeles Center Los Angeles
Red Studios Hollywood

Major Motion Picture Studios By Type Studio Total Square
No. Name Location Stages Feet
Major Production Companies: 1 Warner Bros. Burbank 34 544,8292 Universal Universal City 31 383,7123 Paramount Hollywood 28 358,9694 Sony Culver City 22 396,0415 CBS - Radford Studio City 18 336,8506 Fox Century City 15 299,3897 Disney Burbank 7 113,918 Subtotal 2,433,708
Independent/For-Rent: 8 Culver Culver City 14 154,2459 Manhattan Beach Manhattan Beach 14 287,000
10 Raleigh Hollywood 12 120,78911 Sunset-Gower Hollywood 12 156,21412 Hollywood Center Hollywood 10 124,18013 Sunset Bronson (KTLA) Hollywood 8 84,27014 The Lot West Hollywood 7 88,16415 Los Angeles Center Los Angeles 6 108,00016 Red Studios Hollywood 5 77,979 Subtotal 1,200,841 Total 243 3,634,549

Valuing The Studio

Income Approach Type of Revenue:
Direct Stage Revenue (rent) Indirect Stage Revenue (power, dressing rooms, air-conditioning,
guards, stage managers, forklifts, expendables Equipment Rentals Office Rentals (includes miscellaneous such as editing rooms) Parking, Telephone
Level of Revenue Discounts from “rate card” rates for stages Many “package” deals Obviously many are short term rentals Vacant factor not your typical “5%” Must carefully analyze historicals Indirect Stage Revenue often from about 15% to 25% of total Stage Equipment Rentals – must be only at subject facility Often many other sources of revenue – not part of the real estate

Income Approach Type of Expenses:
Taxes Insurance Repairs and Maintenance Utilities Salaries (must include a management fee) Equipment Costs (maintenance and replacements)
Level of Expenses High expense ratio (typical 40% to 50%+) Salaries and equipment costs can be half the total expenses Although not included in historicals, often include a “guru” manager
expense

Sales Comparison Approach Not many sales of the major studios Sales of “conversions” less comparable Many “conversions” type throughout Los Angeles
Santa Clarita (ground up) Quixote Smashbox Delfino Occidential GMT Chandler Valley Center Lacy Street
Often must “trend” the few sales Often highly specific to property performance Going Concern a separate issue Cap rates can be difficult to extract

Sales Comparison Approach
(1) Included sale lease-back
Sale Square No. of Sale PriceStudio Date Feet Stages Total /Sq.Ft.
Culver StudiosCulver City
4/04 294,925 13 $73,000,000
$247.52
Same
3/11 396,458 13 $89,650,000
$226.13
Manhattan Beach StudiosManhattan Beach
11/04 586,632 14 $98,000,000
$167.06
Same
6/07 586,632 14 $150,000,000
$255.70
Sunset-Gower StudiosHollywood
11/04 556,000 12 $110,000,000
$197.84
Same
8/07 619,000 12 $205,000,000
$331.18
Same
6/10 619,000 12 Portfolio
KTLA Studios (Bronson)Hollywood
1/08 238,193 8 $125,000,000
$524.78Leaseback
Same
6/10 238,193 8 Portfolio
Ren-Mar (now Red Studios)Hollywood
1/10 135,207 6 $23,500,000
$173.81
KCET StudiosHollywood
4/11 105,000 2 $42,000,000
$400.00


![Warner Bros. et al. v. WTV Systems [Zediva] - Opposition to Motion Picture Studios' Motion for Preliminary Injunction](https://static.fdocuments.in/doc/165x107/577d28fa1a28ab4e1ea5b3a1/warner-bros-et-al-v-wtv-systems-zediva-opposition-to-motion-picture.jpg)


