AppManager for IBM PowerVM Management Guide · PowerVM is a secure and scalable virtualization...
30
NetIQ ® AppManager ® for IBM PowerVM Management Guide December 2013
Transcript of AppManager for IBM PowerVM Management Guide · PowerVM is a secure and scalable virtualization...
NetIQ® AppManager® for IBM PowerVM
Management Guide
December 2013

Legal Notice
THIS DOCUMENT AND THE SOFTWARE DESCRIBED IN THIS DOCUMENT ARE FURNISHED UNDER AND ARE SUBJECT TO THE TERMS OF A LICENSE AGREEMENT OR A NON-DISCLOSURE AGREEMENT. EXCEPT AS EXPRESSLY SET FORTH IN SUCH LICENSE AGREEMENT OR NON-DISCLOSURE AGREEMENT, NETIQ CORPORATION PROVIDES THIS DOCUMENT AND THE SOFTWARE DESCRIBED IN THIS DOCUMENT "AS IS" WITHOUT WARRANTY OF ANY KIND, EITHER EXPRESS OR IMPLIED, INCLUDING, BUT NOT LIMITED TO, THE IMPLIED WARRANTIES OF MERCHANTABILITY OR FITNESS FOR A PARTICULAR PURPOSE. SOME STATES DO NOT ALLOW DISCLAIMERS OF EXPRESS OR IMPLIED WARRANTIES IN CERTAIN TRANSACTIONS; THEREFORE, THIS STATEMENT MAY NOT APPLY TO YOU.
For purposes of clarity, any module, adapter or other similar material ("Module") is licensed under the terms and conditions of the End User License Agreement for the applicable version of the NetIQ product or software to which it relates or interoperates with, and by accessing, copying or using a Module you agree to be bound by such terms. If you do not agree to the terms of the End User License Agreement you are not authorized to use, access or copy a Module and you must destroy all copies of the Module and contact NetIQ for further instructions.
This document and the software described in this document may not be lent, sold, or given away without the prior written permission of NetIQ Corporation, except as otherwise permitted by law. Except as expressly set forth in such license agreement or non-disclosure agreement, no part of this document or the software described in this document may be reproduced, stored in a retrieval system, or transmitted in any form or by any means, electronic, mechanical, or otherwise, without the prior written consent of NetIQ Corporation. Some companies, names, and data in this document are used for illustration purposes and may not represent real companies, individuals, or data.
This document could include technical inaccuracies or typographical errors. Changes are periodically made to the information herein. These changes may be incorporated in new editions of this document. NetIQ Corporation may make improvements in or changes to the software described in this document at any time.
U.S. Government Restricted Rights: If the software and documentation are being acquired by or on behalf of the U.S. Government or by a U.S. Government prime contractor or subcontractor (at any tier), in accordance with 48 C.F.R. 227.7202-4 (for Department of Defense (DOD) acquisitions) and 48 C.F.R. 2.101 and 12.212 (for non-DOD acquisitions), the government’s rights in the software and documentation, including its rights to use, modify, reproduce, release, perform, display or disclose the software or documentation, will be subject in all respects to the commercial license rights and restrictions provided in the license agreement.
© 2013 NetIQ Corporation and its affiliates. All Rights Reserved.
For information about NetIQ trademarks, see https://www.netiq.com/company/legal/.
Contents
About this Book and the Library 5About NetIQ Corporation 7
1 Introducing AppManager for IBM PowerVM 9
2 Installing AppManager for IBM PowerVM 11
2.1 System Requirements . . . . . . . . . . . . . . . . . . . . . . . . . . . . . . . . . . . . . . . . . . . . . . . . . . . . . . . . . . . . 112.2 Installing the Module . . . . . . . . . . . . . . . . . . . . . . . . . . . . . . . . . . . . . . . . . . . . . . . . . . . . . . . . . . . . . 122.3 Discovering AppManager for IBM PowerVM Resources . . . . . . . . . . . . . . . . . . . . . . . . . . . . . . . . . . 13
3 PowerVM Knowledge Scripts 17
3.1 PowerVM_CpuPoolUtil. . . . . . . . . . . . . . . . . . . . . . . . . . . . . . . . . . . . . . . . . . . . . . . . . . . . . . . . . . . . 173.2 PowerVM_Inventory. . . . . . . . . . . . . . . . . . . . . . . . . . . . . . . . . . . . . . . . . . . . . . . . . . . . . . . . . . . . . . 183.3 PowerVM_LPARCpuUtil . . . . . . . . . . . . . . . . . . . . . . . . . . . . . . . . . . . . . . . . . . . . . . . . . . . . . . . . . . 243.4 PowerVM_ManagedSystemCpuUtil . . . . . . . . . . . . . . . . . . . . . . . . . . . . . . . . . . . . . . . . . . . . . . . . . . 253.5 PowerVM_ManagedSystemMemUtil . . . . . . . . . . . . . . . . . . . . . . . . . . . . . . . . . . . . . . . . . . . . . . . . . 263.6 PowerVM_PhysicalVolumeDiskSpaceUtil . . . . . . . . . . . . . . . . . . . . . . . . . . . . . . . . . . . . . . . . . . . . . 283.7 PowerVM_PhysicalVolumeGroupDiskSpaceUtil . . . . . . . . . . . . . . . . . . . . . . . . . . . . . . . . . . . . . . . . 29
Contents 3

4 AppManager for IBM PowerVM Management Guide
About this Book and the Library
The NetIQ AppManager product (AppManager) is a comprehensive solution for managing, diagnosing, and analyzing performance, availability, and health for a broad spectrum of operating environments, applications, services, and server hardware.
AppManager provides system administrators with a central, easy-to-use console to view critical server and application resources across the enterprise. With AppManager, administrative staff can monitor computer and application resources, check for potential problems, initiate responsive actions, automate routine tasks, and gather performance data for real-time and historical reporting and analysis.
Intended AudienceThis guide provides information for individuals responsible for installing an AppManager module and monitoring specific applications with AppManager.
Other Information in the LibraryThe library provides the following information resources:
Installation Guide for AppManager Provides complete information about AppManager pre-installation requirements and step-by-step installation procedures for all AppManager components.
User Guide for AppManager Control Center Provides complete information about managing groups of computers, including running jobs, responding to events, creating reports, and working with Control Center. A separate guide is available for the AppManager Operator Console.
Administrator Guide for AppManager Provides information about maintaining an AppManager management site, managing security, using scripts to handle AppManager tasks, and leveraging advanced configuration options.
Upgrade and Migration Guide for AppManager Provides complete information about how to upgrade from a previous version of AppManager.
Management guides Provide information about installing and monitoring specific applications with AppManager.
Help Provides context-sensitive information and step-by-step guidance for common tasks, as well as definitions for each field on each window.
The AppManager library is available in Adobe Acrobat (PDF) format from the AppManager Documentation page of the NetIQ Web site.
About this Book and the Library 5

6 AppManager for IBM PowerVM Management Guide
About NetIQ Corporation
We are a global, enterprise software company, with a focus on the three persistent challenges in your environment: Change, complexity and risk—and how we can help you control them.
Our ViewpointAdapting to change and managing complexity and risk are nothing new
In fact, of all the challenges you face, these are perhaps the most prominent variables that deny you the control you need to securely measure, monitor, and manage your physical, virtual, and cloud computing environments.
Enabling critical business services, better and faster We believe that providing as much control as possible to IT organizations is the only way to enable timelier and cost effective delivery of services. Persistent pressures like change and complexity will only continue to increase as organizations continue to change and the technologies needed to manage them become inherently more complex.
Our PhilosophySelling intelligent solutions, not just software
In order to provide reliable control, we first make sure we understand the real-world scenarios in which IT organizations like yours operate — day in and day out. That's the only way we can develop practical, intelligent IT solutions that successfully yield proven, measurable results. And that's so much more rewarding than simply selling software.
Driving your success is our passion We place your success at the heart of how we do business. From product inception to deployment, we understand that you need IT solutions that work well and integrate seamlessly with your existing investments; you need ongoing support and training post-deployment; and you need someone that is truly easy to work with — for a change. Ultimately, when you succeed, we all succeed.
Our Solutions Identity & Access Governance Access Management Security Management Systems & Application Management Workload Management Service Management
About NetIQ Corporation 7
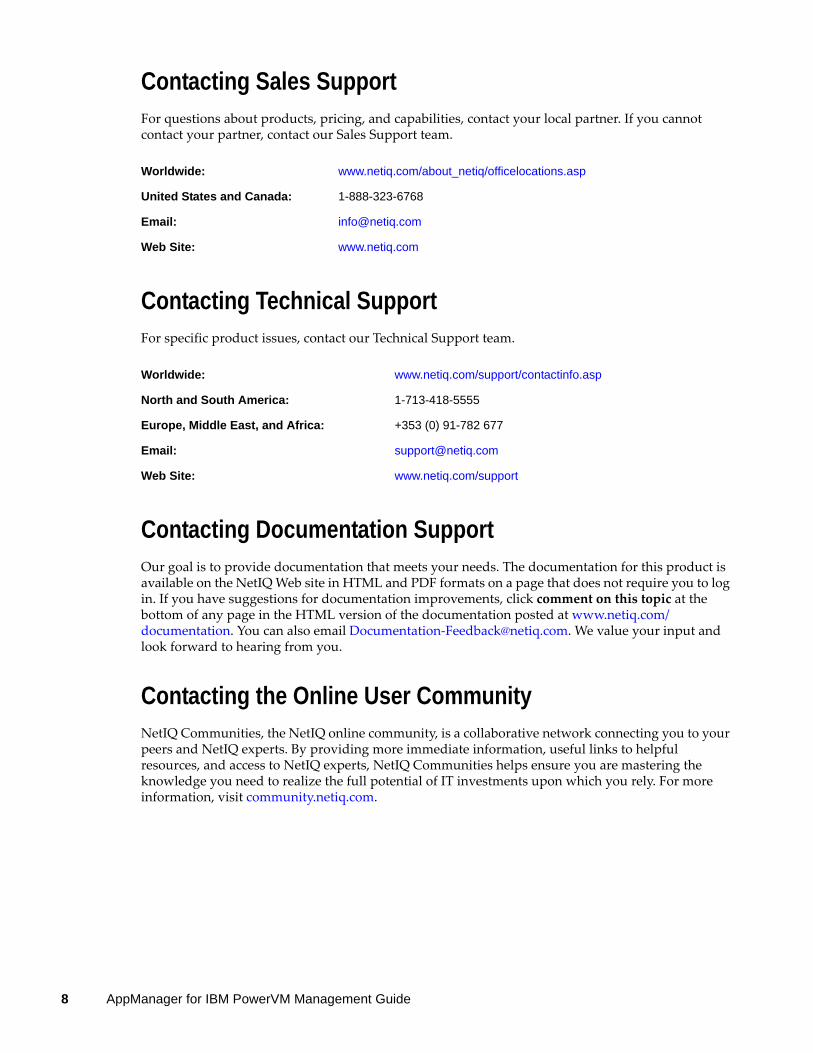
Contacting Sales SupportFor questions about products, pricing, and capabilities, contact your local partner. If you cannot contact your partner, contact our Sales Support team.
Contacting Technical SupportFor specific product issues, contact our Technical Support team.
Contacting Documentation SupportOur goal is to provide documentation that meets your needs. The documentation for this product is available on the NetIQ Web site in HTML and PDF formats on a page that does not require you to log in. If you have suggestions for documentation improvements, click comment on this topic at the bottom of any page in the HTML version of the documentation posted at www.netiq.com/documentation. You can also email [email protected]. We value your input and look forward to hearing from you.
Contacting the Online User CommunityNetIQ Communities, the NetIQ online community, is a collaborative network connecting you to your peers and NetIQ experts. By providing more immediate information, useful links to helpful resources, and access to NetIQ experts, NetIQ Communities helps ensure you are mastering the knowledge you need to realize the full potential of IT investments upon which you rely. For more information, visit community.netiq.com.
Worldwide: www.netiq.com/about_netiq/officelocations.asp
United States and Canada: 1-888-323-6768
Email: [email protected]
Web Site: www.netiq.com
Worldwide: www.netiq.com/support/contactinfo.asp
North and South America: 1-713-418-5555
Europe, Middle East, and Africa: +353 (0) 91-782 677
Email: [email protected]
Web Site: www.netiq.com/support
8 AppManager for IBM PowerVM Management Guide
1 1Introducing AppManager for IBM PowerVM
PowerVM is a secure and scalable virtualization environment for hosting Advanced Interactive eXecutive (AIX), IBM i, and Linux applications on the IBM Power Systems platform.
AppManager for AppManager for IBM PowerVM resource usage, performance, and availability information for the PowerVM managed systems and logical partitions (LPARs) without requiring individual agents on the managed systems and LPARs.
AppManager Unix for PowerVM offers the following:
CPU Pool Utilization
Monitor CPU pool utilization and raise an event when the utilization exceeds the threshold you set.
Monitor the number of LPARs associated with a CPU pool and raise an event when the number exceeds the threshold.
Inventory
Monitor the managed system inventory and raise an event when a managed system is added or removed or when a managed system attribute is changed.
Monitor the LPAR inventory and raise an event when an LPAR is added or removed or when an LPAR attribute is changed.
Monitor the CPU pool inventory and raise an event when a CPU pool is added or removed or when a CPU pool attribute is changed.
Monitor the physical volume group inventory and raise an event when a physical volume group is added or removed or when a physical volume group attribute is changed.
Monitor the physical volume inventory and raise an event when a physical volume is added or removed or when a physical volume attribute is changed.
LPAR CPU Utilization
Monitor LPAR CPU utilization and raise an event when utilization exceeds the threshold you set.
Managed System CPU Utilization
Monitor managed system CPU utilization and raise an event when utilization exceeds the threshold you set
Managed System Memory Utilization
Monitor managed system memory utilization and raise an event when utilization exceeds the threshold you set.
Monitor managed system free memory and raise an event when free memory falls below the threshold you set.
Introducing AppManager for IBM PowerVM 9
Physical Volume Disk Space Utilization
Monitor physical volume disk space utilization and raise an event when the utilization in percent exceeds the threshold you set.
Monitor physical volume free disk space and raise an event when free disk space falls below the threshold you set.
Physical Volume Group Disk Space Utilization
Monitor physical volume group disk space utilization and raise an event when the utilization exceeds the threshold you set.
Monitor physical volume group free disk space and raise an event when the free disk space falls below the threshold you set.
10 AppManager for IBM PowerVM Management Guide
2 2Installing AppManager for IBM PowerVM
This chapter provides installation instructions and describes system requirements for AppManager for IBM PowerVM.
This chapter assumes you have an AppManager repository, console, management server, and UNIX agent installed:
For more information about installing AppManager Windows components, see the Installation Guide for AppManager. This document is available on the AppManager Documentation page.
For information about installing the UNIX agent, see the AppManager for UNIX and Linux Servers Management Guide. This document is available on the AppManager Module Documentation page.
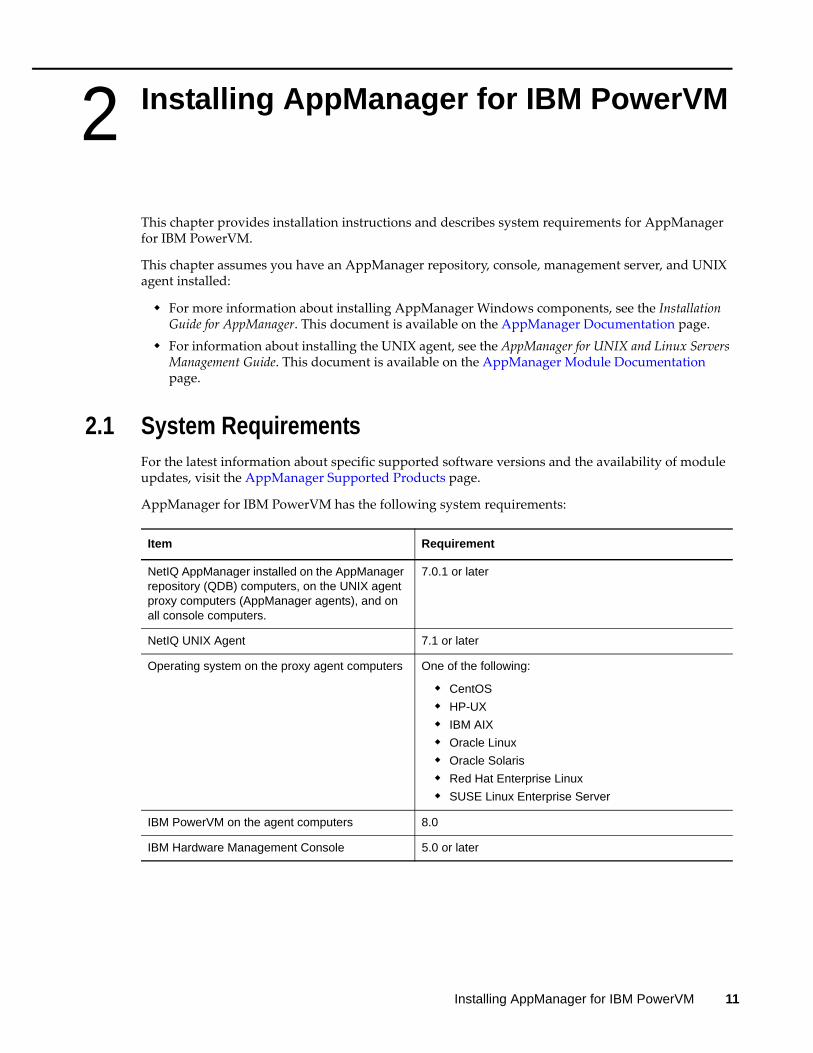
2.1 System RequirementsFor the latest information about specific supported software versions and the availability of module updates, visit the AppManager Supported Products page.
AppManager for IBM PowerVM has the following system requirements:
Item Requirement
NetIQ AppManager installed on the AppManager repository (QDB) computers, on the UNIX agent proxy computers (AppManager agents), and on all console computers.
7.0.1 or later
NetIQ UNIX Agent 7.1 or later
Operating system on the proxy agent computers One of the following:
CentOS
HP-UX
IBM AIX
Oracle Linux
Oracle Solaris
Red Hat Enterprise Linux
SUSE Linux Enterprise Server
IBM PowerVM on the agent computers 8.0
IBM Hardware Management Console 5.0 or later
Installing AppManager for IBM PowerVM 11
AppManager for IBM PowerVM uses any NetIQ UNIX agent on a UNIX computer as a proxy monitoring server and from there uses the IBM Hardware Management Console to monitor PowerVM resources. AppManager for IBM PowerVM requires a passwordless trusted SSH connection to the IBM Hardware Management Console from the UNIX agent computer using the same user account used to install the UNIX agent.
2.2 Installing the ModuleTo install the module you must:
Install the Knowledge Scripts by running the module installer AM70-PowerVM-8.0.x.x.msi on all AppManager repositories that store data for this module.
Install the Help files by running the module installer AM70-PowerVM-8.0.x.x.msi on all AppManager Control Center and Operator Console computers you will use with this module.
Ensure the correct UNIX agent patch level is installed on the proxy monitoring server computer:— UNIX agent 7.1 with patch 7.1.0.51 — UNIX agent 7.2 with patch 7.2.0.7
You can access the AM70-PowerVM-8.0.x.x.msi module installer and the p71p51.zip or p72p7.zip patch from the AM70_PowerVM_8.0.x.x self-extracting installation package on the AppManager Module Upgrades & Trials page.
The module installer now installs Knowledge Scripts for each module directly into the QDB instead of the \AppManager\qdb\kp folder as in previous releases of AppManager.
To install the module:
1 Ensure you have the UNIX agent installed on the proxy monitoring server computer or computers. For information about how to install the agent, see the AppManager for UNIX and Linux Servers Management Guide.
2 (Conditional) If you have UNIX agent 7.1, apply patch 7.1.0.51 to the proxy monitoring server computers. If you have UNIX agent 7.2, apply patch 7.2.0.7 to the proxy monitoring server computers. For information about how to apply UNIX agent patches, see the AppManager for UNIX and Linux Servers Management Guide.
3 To install the Knowledge Scripts into the QDB:3a Select Install Knowledge Scripts to install the repository components, including the
Knowledge Scripts, object types, and SQL stored procedures.3b Specify the SQL Server name of the server hosting the QDB, as well as the case-sensitive
QDB name.
NOTE: Microsoft .NET Framework 3.5 is required on the computer where you run the installation program for the QDB portion of the module. For computers running more recent versions of Windows operating systems that use a newer version of .NET, install .NET 3.5 with the Add Roles and Features wizard in Windows Server Manager, as described in this Microsoft article.
4 (Conditional) If you use Control Center 7.x, run the module installer for each QDB attached to Control Center.
5 (Conditional) If you use Control Center 8.x, run the module installer only for the primary QDB. Control Center automatically replicates this module to secondary QDBs.
12 AppManager for IBM PowerVM Management Guide
6 Run the module installer on all console computers to install the Help and console extensions.7 (Conditional) If you have not discovered PowerVM resources through the IBM Hardware
Management Console, run the Discovery_PowerVM Knowledge Script on all proxy monitoring server computers. For more information, see “Discovering AppManager for IBM PowerVM Resources” on page 13.
After the installation has completed, the PowerVM_Install.log file, located in the \NetIQ\Temp\NetIQ_Debug\ServerName folder, lists any problems that occurred.
2.2.1 Silently Installing the Knowledge Scripts
To silently install the module on an AppManager repository, you can use Windows authentication or SQL authentication.
Windows authentication:
AM70-PowerVM-8.0.x.x.msi /qn MO_B_QDBINSTALL=1 MO_B_SQLSVR_WINAUTH=1 MO_SQLSVR_NAME=SQLServerName MO_QDBNAME=AMRepositoryName
SQL authentication:
AM70-PowerVM-8.0.x.x.msi /qn MO_B_QDBINSTALL=1 MO_B_SQLSVR_WINAUTH=0 MO_SQLSVR_USER=SQL login MO_SQLSVR_PWD=SQLLoginPassword MO_SQLSVR_NAME=SQLServerName MO_QDBNAME=AMRepositoryName
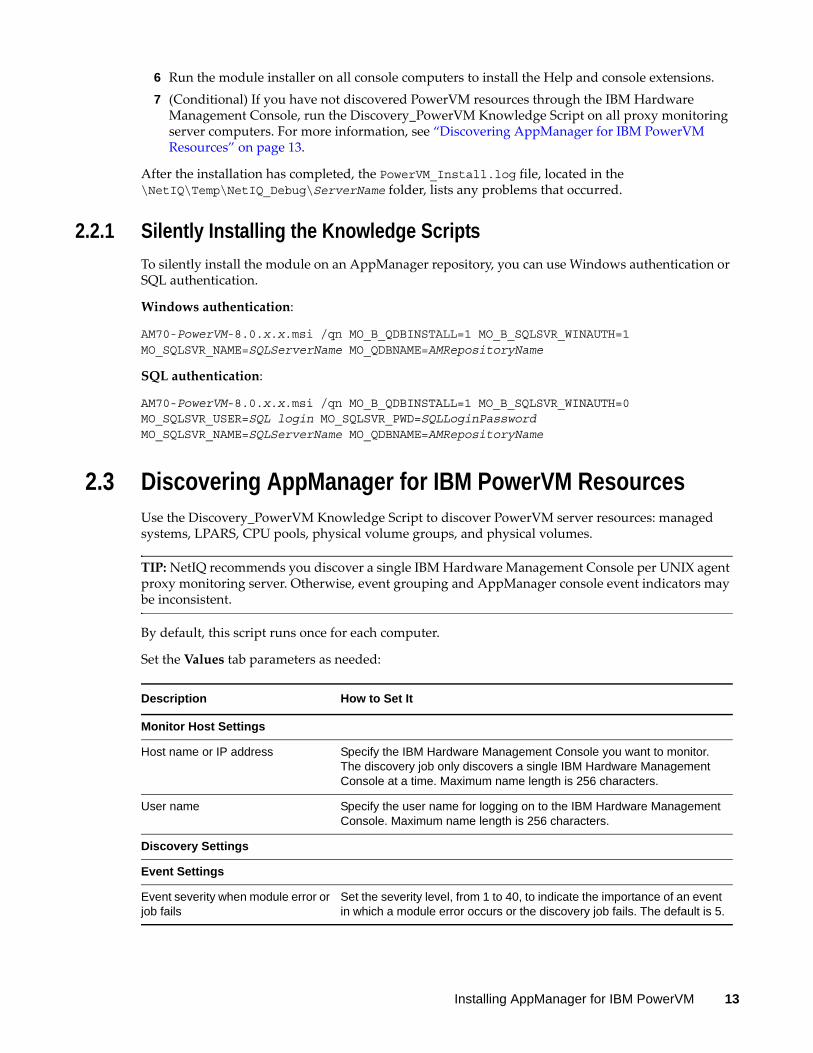
2.3 Discovering AppManager for IBM PowerVM ResourcesUse the Discovery_PowerVM Knowledge Script to discover PowerVM server resources: managed systems, LPARS, CPU pools, physical volume groups, and physical volumes.
TIP: NetIQ recommends you discover a single IBM Hardware Management Console per UNIX agent proxy monitoring server. Otherwise, event grouping and AppManager console event indicators may be inconsistent.
By default, this script runs once for each computer.
Set the Values tab parameters as needed:
Description How to Set It
Monitor Host Settings
Host name or IP address Specify the IBM Hardware Management Console you want to monitor. The discovery job only discovers a single IBM Hardware Management Console at a time. Maximum name length is 256 characters.
User name Specify the user name for logging on to the IBM Hardware Management Console. Maximum name length is 256 characters.
Discovery Settings
Event Settings
Event severity when module error or job fails
Set the severity level, from 1 to 40, to indicate the importance of an event in which a module error occurs or the discovery job fails. The default is 5.
Installing AppManager for IBM PowerVM 13
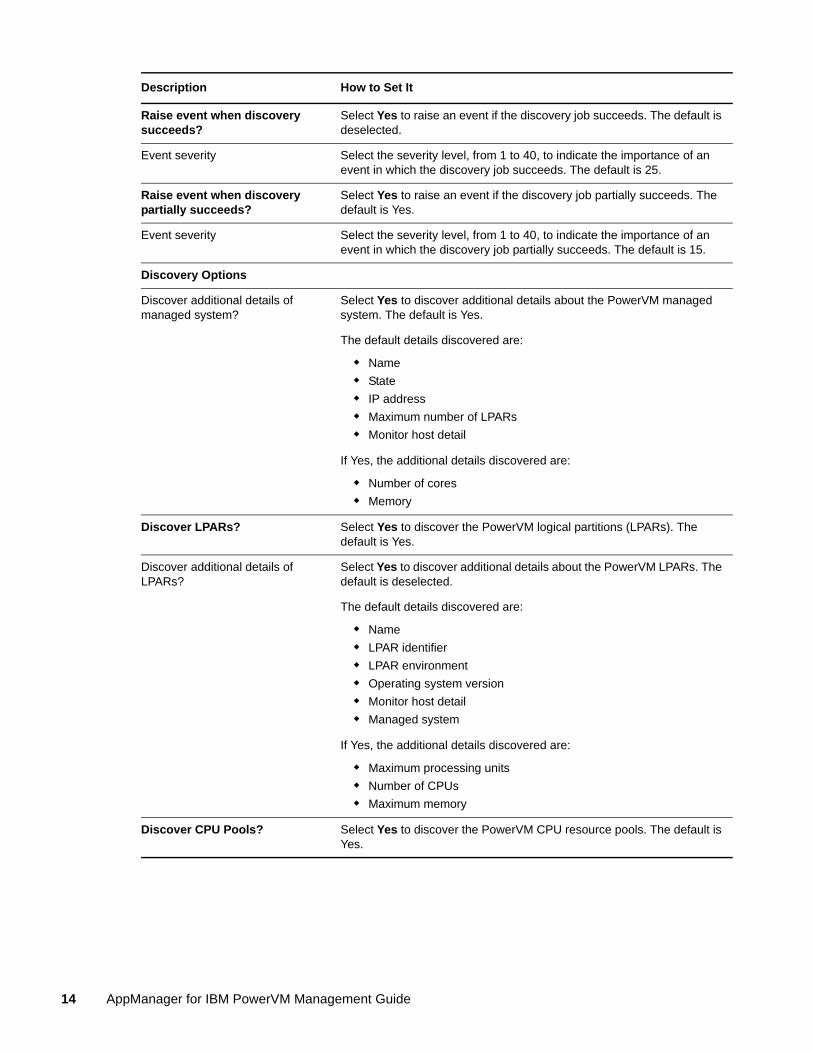
Raise event when discovery succeeds?
Select Yes to raise an event if the discovery job succeeds. The default is deselected.
Event severity Select the severity level, from 1 to 40, to indicate the importance of an event in which the discovery job succeeds. The default is 25.
Raise event when discovery partially succeeds?
Select Yes to raise an event if the discovery job partially succeeds. The default is Yes.
Event severity Select the severity level, from 1 to 40, to indicate the importance of an event in which the discovery job partially succeeds. The default is 15.
Discovery Options
Discover additional details of managed system?
Select Yes to discover additional details about the PowerVM managed system. The default is Yes.
The default details discovered are:
Name
State
IP address
Maximum number of LPARs
Monitor host detail
If Yes, the additional details discovered are:
Number of cores
Memory
Discover LPARs? Select Yes to discover the PowerVM logical partitions (LPARs). The default is Yes.
Discover additional details of LPARs?
Select Yes to discover additional details about the PowerVM LPARs. The default is deselected.
The default details discovered are:
Name
LPAR identifier
LPAR environment
Operating system version
Monitor host detail
Managed system
If Yes, the additional details discovered are:
Maximum processing units
Number of CPUs
Maximum memory
Discover CPU Pools? Select Yes to discover the PowerVM CPU resource pools. The default is Yes.
Description How to Set It
14 AppManager for IBM PowerVM Management Guide
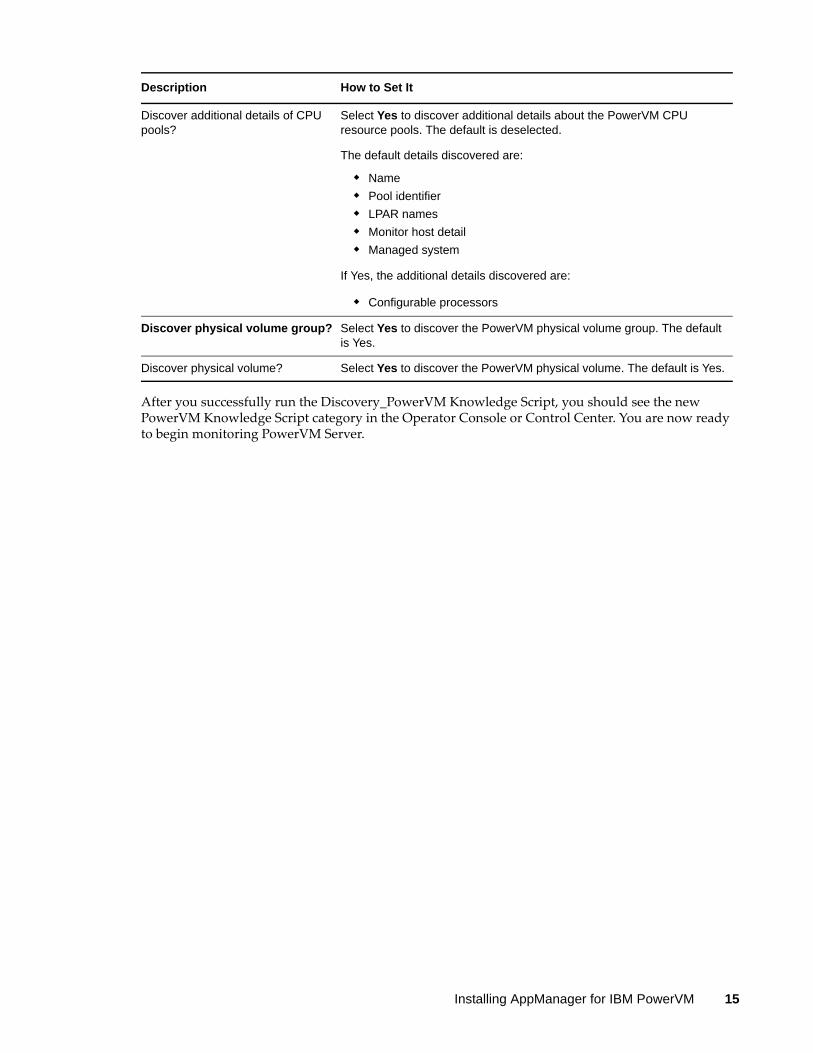
After you successfully run the Discovery_PowerVM Knowledge Script, you should see the new PowerVM Knowledge Script category in the Operator Console or Control Center. You are now ready to begin monitoring PowerVM Server.
Discover additional details of CPU pools?
Select Yes to discover additional details about the PowerVM CPU resource pools. The default is deselected.
The default details discovered are:
Name
Pool identifier
LPAR names
Monitor host detail
Managed system
If Yes, the additional details discovered are:
Configurable processors
Discover physical volume group? Select Yes to discover the PowerVM physical volume group. The default is Yes.
Discover physical volume? Select Yes to discover the PowerVM physical volume. The default is Yes.
Description How to Set It
Installing AppManager for IBM PowerVM 15

16 AppManager for IBM PowerVM Management Guide
3 3PowerVM Knowledge Scripts
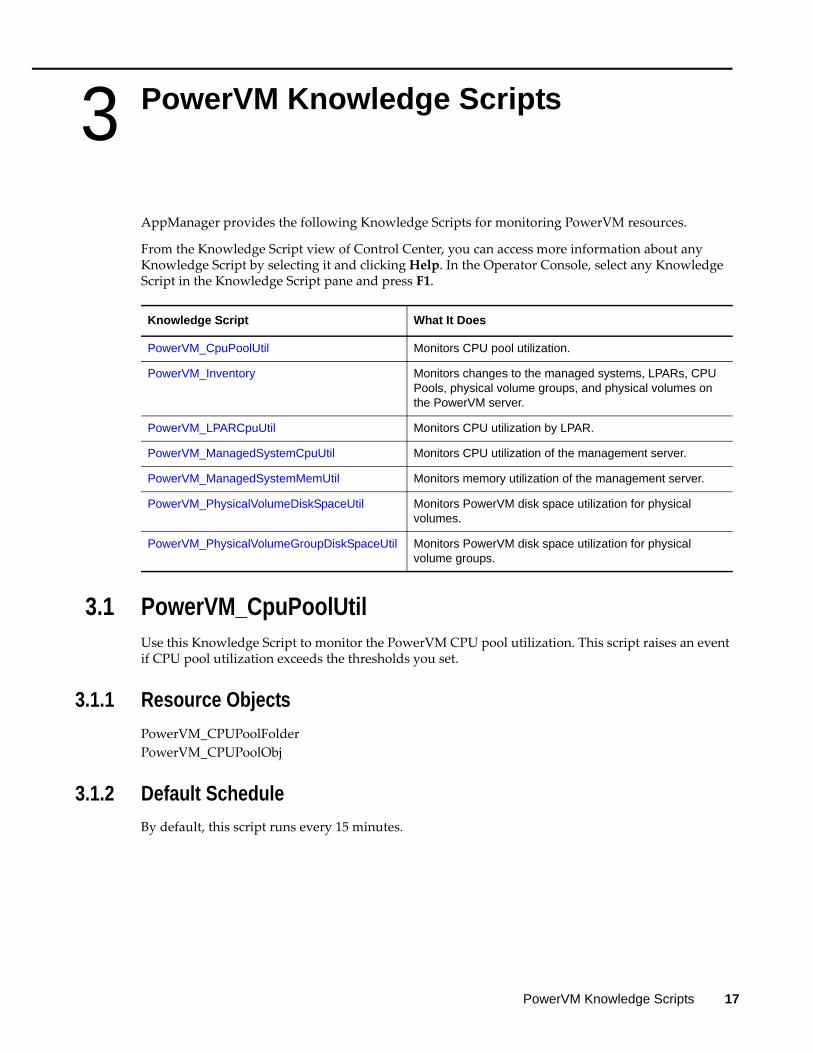
AppManager provides the following Knowledge Scripts for monitoring PowerVM resources.
From the Knowledge Script view of Control Center, you can access more information about any Knowledge Script by selecting it and clicking Help. In the Operator Console, select any Knowledge Script in the Knowledge Script pane and press F1.
3.1 PowerVM_CpuPoolUtilUse this Knowledge Script to monitor the PowerVM CPU pool utilization. This script raises an event if CPU pool utilization exceeds the thresholds you set.
3.1.1 Resource Objects
PowerVM_CPUPoolFolderPowerVM_CPUPoolObj
3.1.2 Default Schedule
By default, this script runs every 15 minutes.
Knowledge Script What It Does
PowerVM_CpuPoolUtil Monitors CPU pool utilization.
PowerVM_Inventory Monitors changes to the managed systems, LPARs, CPU Pools, physical volume groups, and physical volumes on the PowerVM server.
PowerVM_LPARCpuUtil Monitors CPU utilization by LPAR.
PowerVM_ManagedSystemCpuUtil Monitors CPU utilization of the management server.
PowerVM_ManagedSystemMemUtil Monitors memory utilization of the management server.
PowerVM_PhysicalVolumeDiskSpaceUtil Monitors PowerVM disk space utilization for physical volumes.
PowerVM_PhysicalVolumeGroupDiskSpaceUtil Monitors PowerVM disk space utilization for physical volume groups.
PowerVM Knowledge Scripts 17
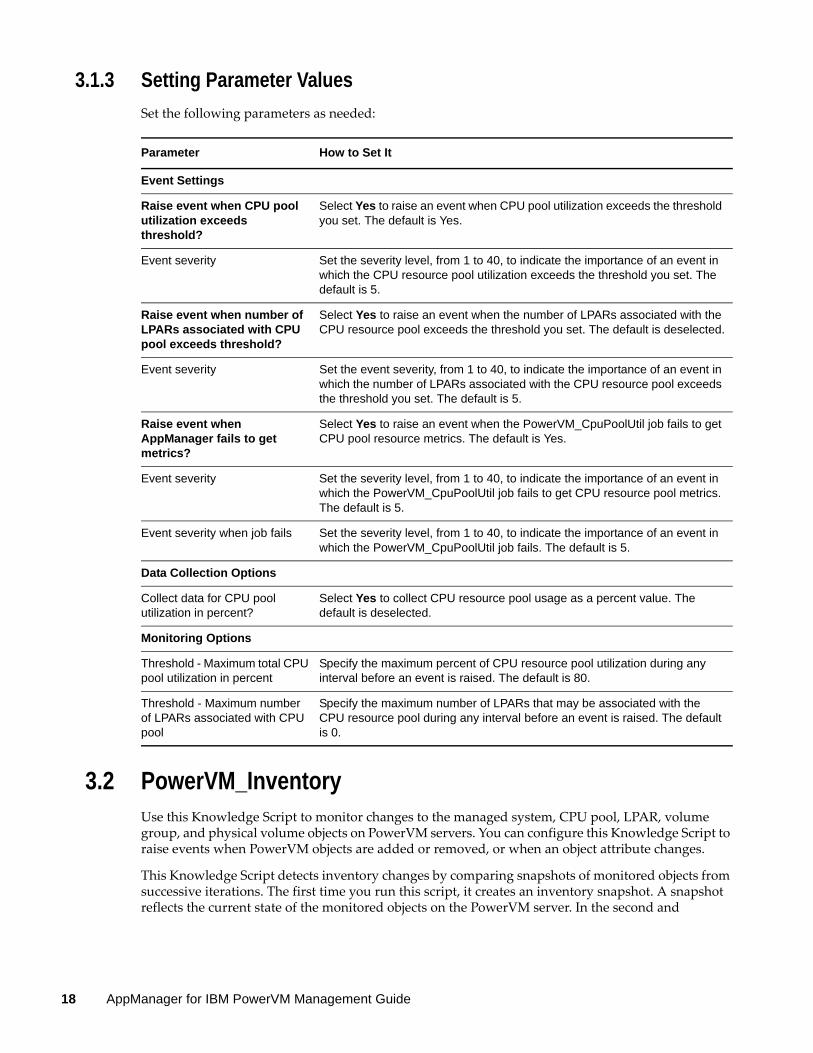
3.1.3 Setting Parameter Values
Set the following parameters as needed:
3.2 PowerVM_InventoryUse this Knowledge Script to monitor changes to the managed system, CPU pool, LPAR, volume group, and physical volume objects on PowerVM servers. You can configure this Knowledge Script to raise events when PowerVM objects are added or removed, or when an object attribute changes.
This Knowledge Script detects inventory changes by comparing snapshots of monitored objects from successive iterations. The first time you run this script, it creates an inventory snapshot. A snapshot reflects the current state of the monitored objects on the PowerVM server. In the second and
Parameter How to Set It
Event Settings
Raise event when CPU pool utilization exceeds threshold?
Select Yes to raise an event when CPU pool utilization exceeds the threshold you set. The default is Yes.
Event severity Set the severity level, from 1 to 40, to indicate the importance of an event in which the CPU resource pool utilization exceeds the threshold you set. The default is 5.
Raise event when number of LPARs associated with CPU pool exceeds threshold?
Select Yes to raise an event when the number of LPARs associated with the CPU resource pool exceeds the threshold you set. The default is deselected.
Event severity Set the event severity, from 1 to 40, to indicate the importance of an event in which the number of LPARs associated with the CPU resource pool exceeds the threshold you set. The default is 5.
Raise event when AppManager fails to get metrics?
Select Yes to raise an event when the PowerVM_CpuPoolUtil job fails to get CPU pool resource metrics. The default is Yes.
Event severity Set the severity level, from 1 to 40, to indicate the importance of an event in which the PowerVM_CpuPoolUtil job fails to get CPU resource pool metrics. The default is 5.
Event severity when job fails Set the severity level, from 1 to 40, to indicate the importance of an event in which the PowerVM_CpuPoolUtil job fails. The default is 5.
Data Collection Options
Collect data for CPU pool utilization in percent?
Select Yes to collect CPU resource pool usage as a percent value. The default is deselected.
Monitoring Options
Threshold - Maximum total CPU pool utilization in percent
Specify the maximum percent of CPU resource pool utilization during any interval before an event is raised. The default is 80.
Threshold - Maximum number of LPARs associated with CPU pool
Specify the maximum number of LPARs that may be associated with the CPU resource pool during any interval before an event is raised. The default is 0.
18 AppManager for IBM PowerVM Management Guide
subsequent iterations, this Knowledge Script creates a new inventory snapshot, compares it to the previous snapshot, and generates events based on selected options and differences between the snapshots.
Running this Knowledge Script once provides no information, you must run it at least twice for it to detect any inventory changes. NetIQ Corporation recommends you run this Knowledge Script immediately after discovery, then continue to run it regularly, either periodically or asynchronously, to monitor inventory changes.
3.2.1 Object and Attribute Event Options
Each inventory object has two event options that can generate an event when:
An object is added or removed An object attribute is changed
The Knowledge Script action depends on the combination of event options you select and the inventory object or attribute change that occurs.
The short and detailed event messages both include the following:
The hierarchy where the change occurred The Knowledge Script iteration count where the change was detected
Each snapshot is given an iteration count, beginning with 1. The iteration count is indicated by a # character. For example, if the Knowledge Script detects an LPAR attribute change when comparing snapshot six to snapshot five, it adds [# 6] to the event short and long messages.
For objects added or removed, the short message contains the object name, its position in the object hierarchy, and the iteration number where the change was detected. For object attribute changes, the short message contains the object name and the attribute that changed.
The detailed message contains the information from the short message, but in natural language. If available, the detailed message also lists the attribute values.
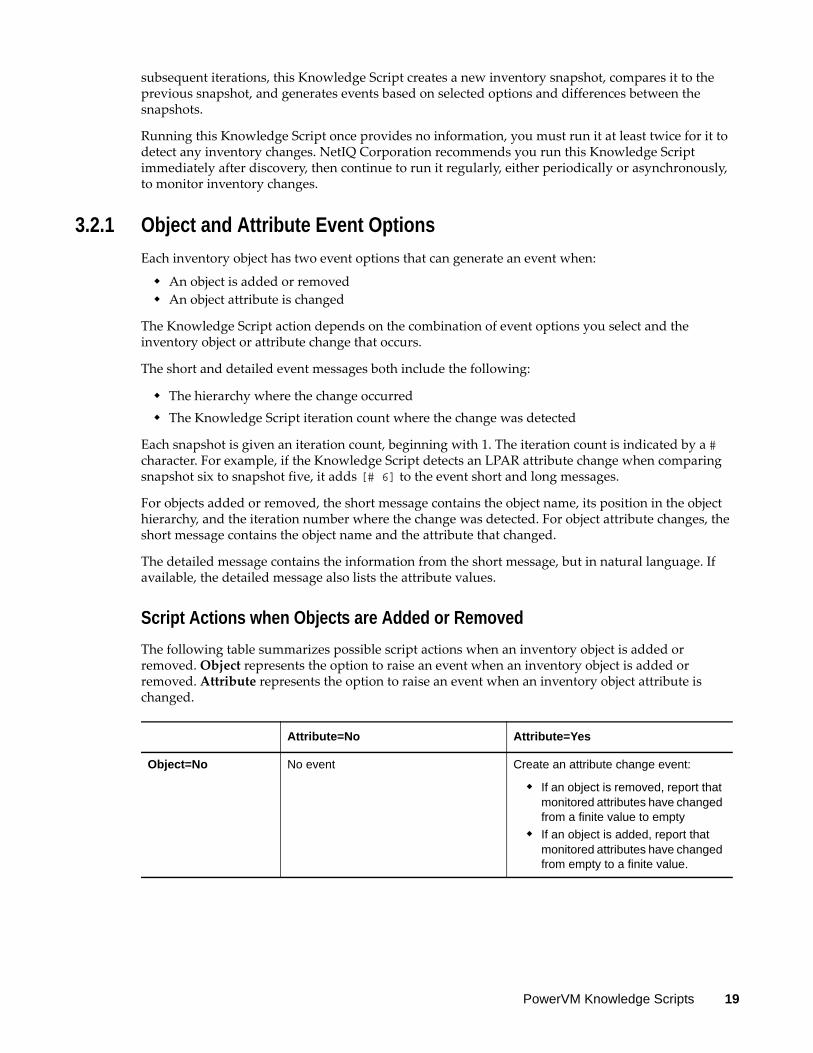
Script Actions when Objects are Added or Removed
The following table summarizes possible script actions when an inventory object is added or removed. Object represents the option to raise an event when an inventory object is added or removed. Attribute represents the option to raise an event when an inventory object attribute is changed.
Attribute=No Attribute=Yes
Object=No No event Create an attribute change event:
If an object is removed, report that monitored attributes have changed from a finite value to empty
If an object is added, report that monitored attributes have changed from empty to a finite value.
PowerVM Knowledge Scripts 19
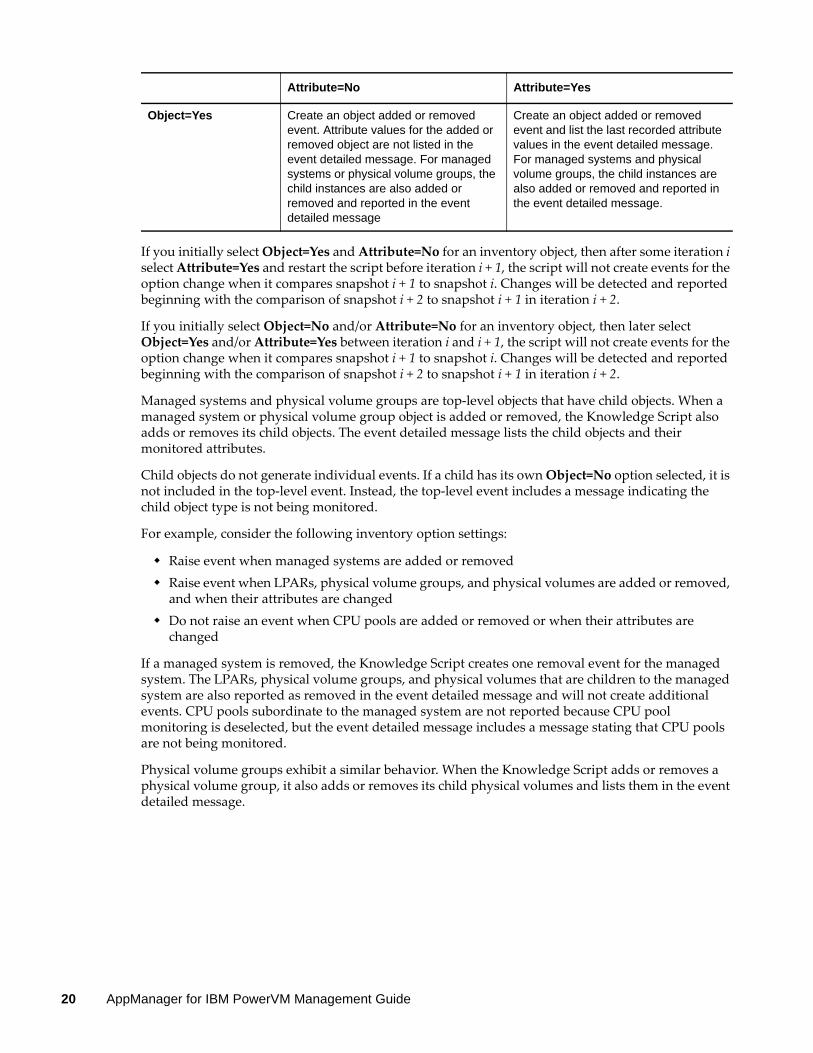
If you initially select Object=Yes and Attribute=No for an inventory object, then after some iteration i select Attribute=Yes and restart the script before iteration i + 1, the script will not create events for the option change when it compares snapshot i + 1 to snapshot i. Changes will be detected and reported beginning with the comparison of snapshot i + 2 to snapshot i + 1 in iteration i + 2.
If you initially select Object=No and/or Attribute=No for an inventory object, then later select Object=Yes and/or Attribute=Yes between iteration i and i + 1, the script will not create events for the option change when it compares snapshot i + 1 to snapshot i. Changes will be detected and reported beginning with the comparison of snapshot i + 2 to snapshot i + 1 in iteration i + 2.
Managed systems and physical volume groups are top-level objects that have child objects. When a managed system or physical volume group object is added or removed, the Knowledge Script also adds or removes its child objects. The event detailed message lists the child objects and their monitored attributes.
Child objects do not generate individual events. If a child has its own Object=No option selected, it is not included in the top-level event. Instead, the top-level event includes a message indicating the child object type is not being monitored.
For example, consider the following inventory option settings:
Raise event when managed systems are added or removed Raise event when LPARs, physical volume groups, and physical volumes are added or removed,
and when their attributes are changed Do not raise an event when CPU pools are added or removed or when their attributes are
changed
If a managed system is removed, the Knowledge Script creates one removal event for the managed system. The LPARs, physical volume groups, and physical volumes that are children to the managed system are also reported as removed in the event detailed message and will not create additional events. CPU pools subordinate to the managed system are not reported because CPU pool monitoring is deselected, but the event detailed message includes a message stating that CPU pools are not being monitored.
Physical volume groups exhibit a similar behavior. When the Knowledge Script adds or removes a physical volume group, it also adds or removes its child physical volumes and lists them in the event detailed message.
Object=Yes Create an object added or removed event. Attribute values for the added or removed object are not listed in the event detailed message. For managed systems or physical volume groups, the child instances are also added or removed and reported in the event detailed message
Create an object added or removed event and list the last recorded attribute values in the event detailed message. For managed systems and physical volume groups, the child instances are also added or removed and reported in the event detailed message.
Attribute=No Attribute=Yes
20 AppManager for IBM PowerVM Management Guide
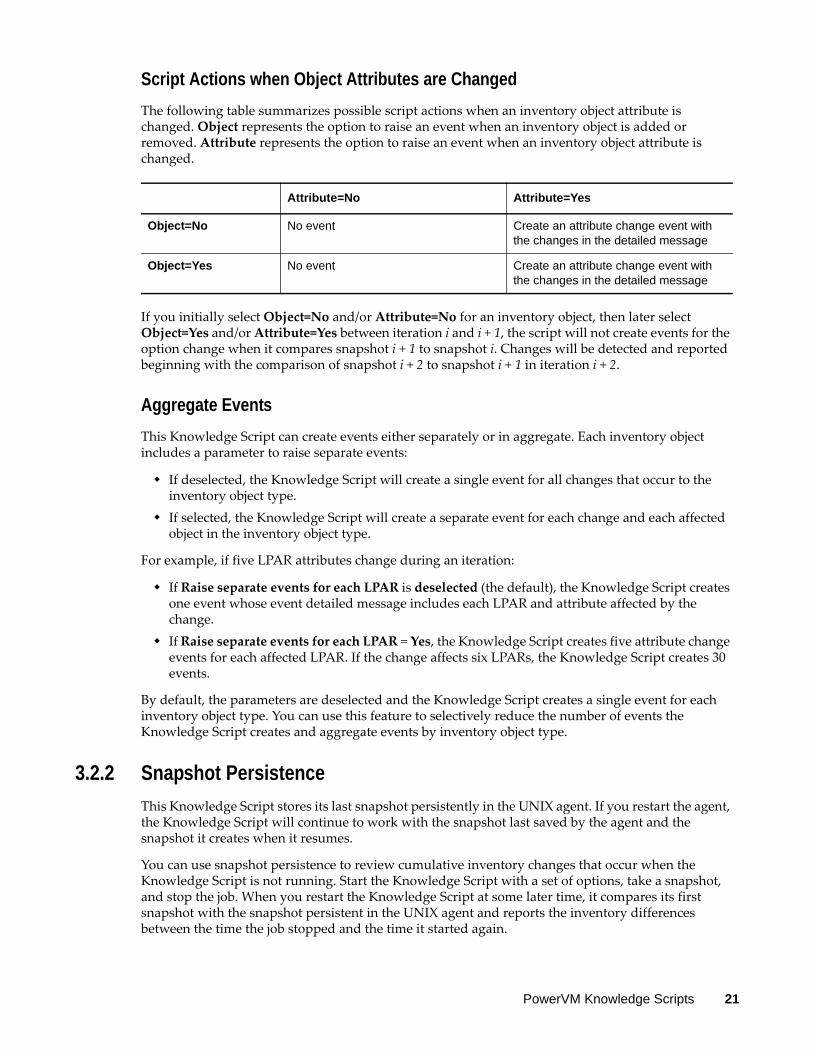
Script Actions when Object Attributes are Changed
The following table summarizes possible script actions when an inventory object attribute is changed. Object represents the option to raise an event when an inventory object is added or removed. Attribute represents the option to raise an event when an inventory object attribute is changed.
If you initially select Object=No and/or Attribute=No for an inventory object, then later select Object=Yes and/or Attribute=Yes between iteration i and i + 1, the script will not create events for the option change when it compares snapshot i + 1 to snapshot i. Changes will be detected and reported beginning with the comparison of snapshot i + 2 to snapshot i + 1 in iteration i + 2.
Aggregate Events
This Knowledge Script can create events either separately or in aggregate. Each inventory object includes a parameter to raise separate events:
If deselected, the Knowledge Script will create a single event for all changes that occur to the inventory object type.
If selected, the Knowledge Script will create a separate event for each change and each affected object in the inventory object type.
For example, if five LPAR attributes change during an iteration:
If Raise separate events for each LPAR is deselected (the default), the Knowledge Script creates one event whose event detailed message includes each LPAR and attribute affected by the change.
If Raise separate events for each LPAR = Yes, the Knowledge Script creates five attribute change events for each affected LPAR. If the change affects six LPARs, the Knowledge Script creates 30 events.
By default, the parameters are deselected and the Knowledge Script creates a single event for each inventory object type. You can use this feature to selectively reduce the number of events the Knowledge Script creates and aggregate events by inventory object type.
3.2.2 Snapshot Persistence
This Knowledge Script stores its last snapshot persistently in the UNIX agent. If you restart the agent, the Knowledge Script will continue to work with the snapshot last saved by the agent and the snapshot it creates when it resumes.
You can use snapshot persistence to review cumulative inventory changes that occur when the Knowledge Script is not running. Start the Knowledge Script with a set of options, take a snapshot, and stop the job. When you restart the Knowledge Script at some later time, it compares its first snapshot with the snapshot persistent in the UNIX agent and reports the inventory differences between the time the job stopped and the time it started again.
Attribute=No Attribute=Yes
Object=No No event Create an attribute change event with the changes in the detailed message
Object=Yes No event Create an attribute change event with the changes in the detailed message
PowerVM Knowledge Scripts 21
3.2.3 Snapshot Error Recovery
If there is an error fetching the snapshot or any part of the snapshot, the Knowledge Script does not compare or raise events for objects affected by the error. Instead, it creates an event for the error it encountered and discards the portion of the snapshot with the error, replacing it with the last known valid information. When the Knowledge Script can successfully fetch the part of the snapshot that previously had an error, it compares the part of the current snapshot to the corresponding part from the last valid snapshot.
For example, if the Knowledge Script successfully collects CPU pool information through iteration i and fails to collect CPU pool information in iteration i + 1 because of an error, it replaces the CPU pool information in snapshot i + 1 with the last valid information from snapshot i. Note that the entire snapshot is not replaced, only the part with the error. If the CPU pool information becomes available at some later iteration i + k, the CPU pool comparison will resume by comparing snapshot i + k to snapshot i + k – 1, which contains the last valid CPU pool information from snapshot i.
3.2.4 Resource Objects
PowerVM_MonitorHostFolder
3.2.5 Default Schedule
By default, this script runs daily.
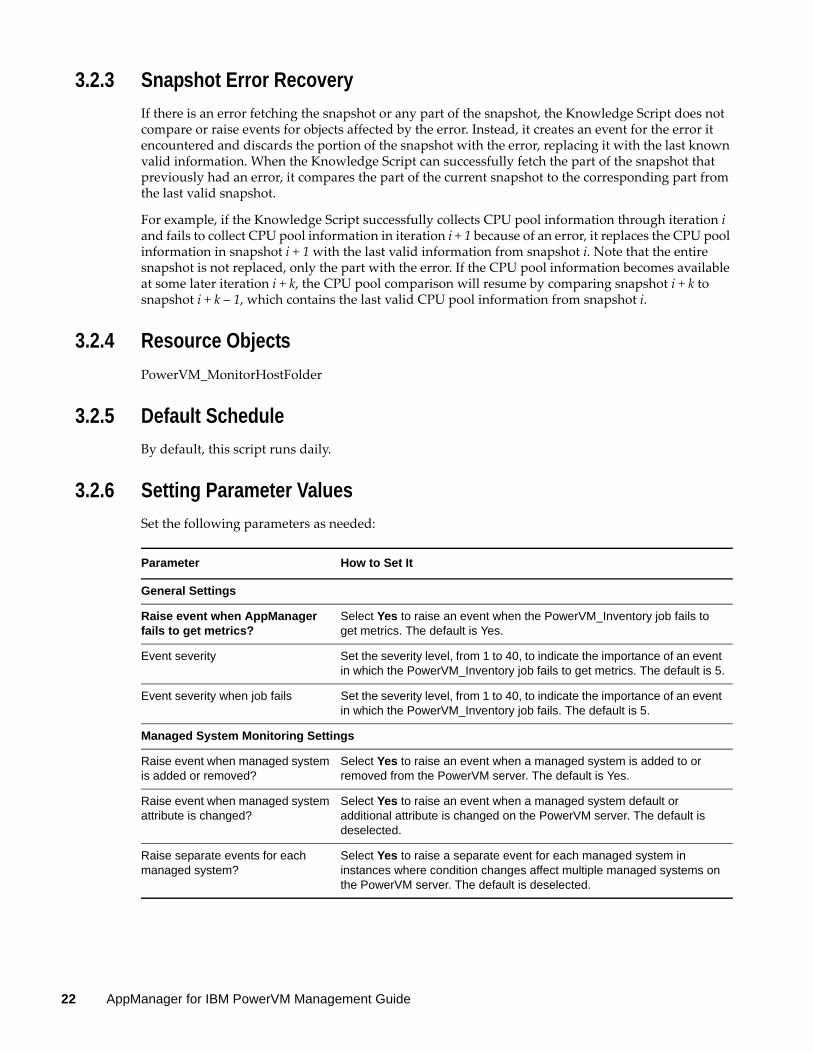
3.2.6 Setting Parameter Values
Set the following parameters as needed:
Parameter How to Set It
General Settings
Raise event when AppManager fails to get metrics?
Select Yes to raise an event when the PowerVM_Inventory job fails to get metrics. The default is Yes.
Event severity Set the severity level, from 1 to 40, to indicate the importance of an event in which the PowerVM_Inventory job fails to get metrics. The default is 5.
Event severity when job fails Set the severity level, from 1 to 40, to indicate the importance of an event in which the PowerVM_Inventory job fails. The default is 5.
Managed System Monitoring Settings
Raise event when managed system is added or removed?
Select Yes to raise an event when a managed system is added to or removed from the PowerVM server. The default is Yes.
Raise event when managed system attribute is changed?
Select Yes to raise an event when a managed system default or additional attribute is changed on the PowerVM server. The default is deselected.
Raise separate events for each managed system?
Select Yes to raise a separate event for each managed system in instances where condition changes affect multiple managed systems on the PowerVM server. The default is deselected.
22 AppManager for IBM PowerVM Management Guide
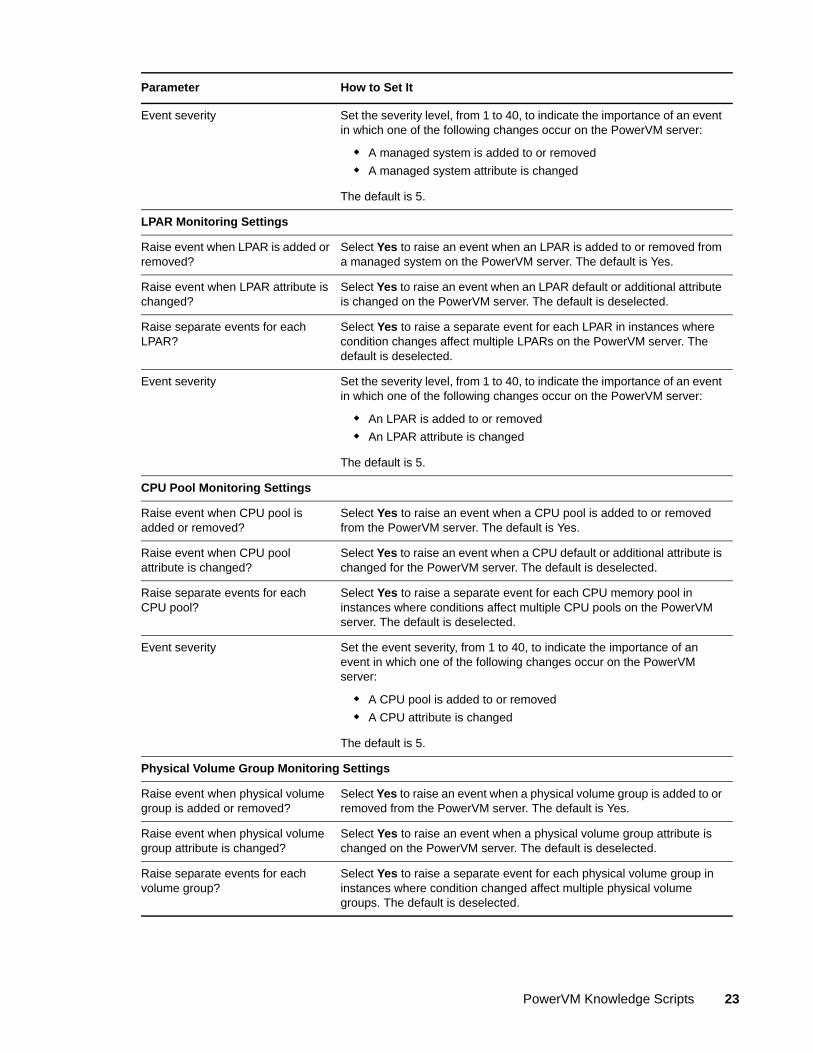
Event severity Set the severity level, from 1 to 40, to indicate the importance of an event in which one of the following changes occur on the PowerVM server:
A managed system is added to or removed
A managed system attribute is changed
The default is 5.
LPAR Monitoring Settings
Raise event when LPAR is added or removed?
Select Yes to raise an event when an LPAR is added to or removed from a managed system on the PowerVM server. The default is Yes.
Raise event when LPAR attribute is changed?
Select Yes to raise an event when an LPAR default or additional attribute is changed on the PowerVM server. The default is deselected.
Raise separate events for each LPAR?
Select Yes to raise a separate event for each LPAR in instances where condition changes affect multiple LPARs on the PowerVM server. The default is deselected.
Event severity Set the severity level, from 1 to 40, to indicate the importance of an event in which one of the following changes occur on the PowerVM server:
An LPAR is added to or removed
An LPAR attribute is changed
The default is 5.
CPU Pool Monitoring Settings
Raise event when CPU pool is added or removed?
Select Yes to raise an event when a CPU pool is added to or removed from the PowerVM server. The default is Yes.
Raise event when CPU pool attribute is changed?
Select Yes to raise an event when a CPU default or additional attribute is changed for the PowerVM server. The default is deselected.
Raise separate events for each CPU pool?
Select Yes to raise a separate event for each CPU memory pool in instances where conditions affect multiple CPU pools on the PowerVM server. The default is deselected.
Event severity Set the event severity, from 1 to 40, to indicate the importance of an event in which one of the following changes occur on the PowerVM server:
A CPU pool is added to or removed
A CPU attribute is changed
The default is 5.
Physical Volume Group Monitoring Settings
Raise event when physical volume group is added or removed?
Select Yes to raise an event when a physical volume group is added to or removed from the PowerVM server. The default is Yes.
Raise event when physical volume group attribute is changed?
Select Yes to raise an event when a physical volume group attribute is changed on the PowerVM server. The default is deselected.
Raise separate events for each volume group?
Select Yes to raise a separate event for each physical volume group in instances where condition changed affect multiple physical volume groups. The default is deselected.
Parameter How to Set It
PowerVM Knowledge Scripts 23
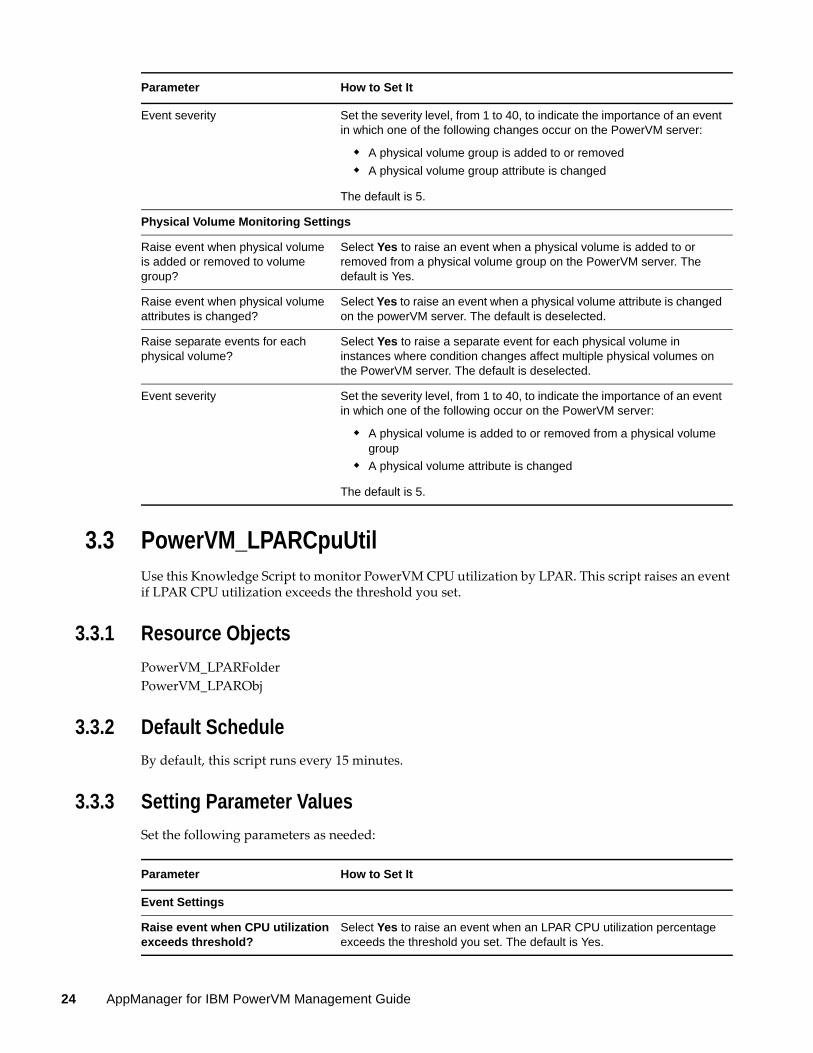
3.3 PowerVM_LPARCpuUtilUse this Knowledge Script to monitor PowerVM CPU utilization by LPAR. This script raises an event if LPAR CPU utilization exceeds the threshold you set.
3.3.1 Resource Objects
PowerVM_LPARFolderPowerVM_LPARObj
3.3.2 Default Schedule
By default, this script runs every 15 minutes.
3.3.3 Setting Parameter Values
Set the following parameters as needed:
Event severity Set the severity level, from 1 to 40, to indicate the importance of an event in which one of the following changes occur on the PowerVM server:
A physical volume group is added to or removed
A physical volume group attribute is changed
The default is 5.
Physical Volume Monitoring Settings
Raise event when physical volume is added or removed to volume group?
Select Yes to raise an event when a physical volume is added to or removed from a physical volume group on the PowerVM server. The default is Yes.
Raise event when physical volume attributes is changed?
Select Yes to raise an event when a physical volume attribute is changed on the powerVM server. The default is deselected.
Raise separate events for each physical volume?
Select Yes to raise a separate event for each physical volume in instances where condition changes affect multiple physical volumes on the PowerVM server. The default is deselected.
Event severity Set the severity level, from 1 to 40, to indicate the importance of an event in which one of the following occur on the PowerVM server:
A physical volume is added to or removed from a physical volume group
A physical volume attribute is changed
The default is 5.
Parameter How to Set It
Parameter How to Set It
Event Settings
Raise event when CPU utilization exceeds threshold?
Select Yes to raise an event when an LPAR CPU utilization percentage exceeds the threshold you set. The default is Yes.
24 AppManager for IBM PowerVM Management Guide
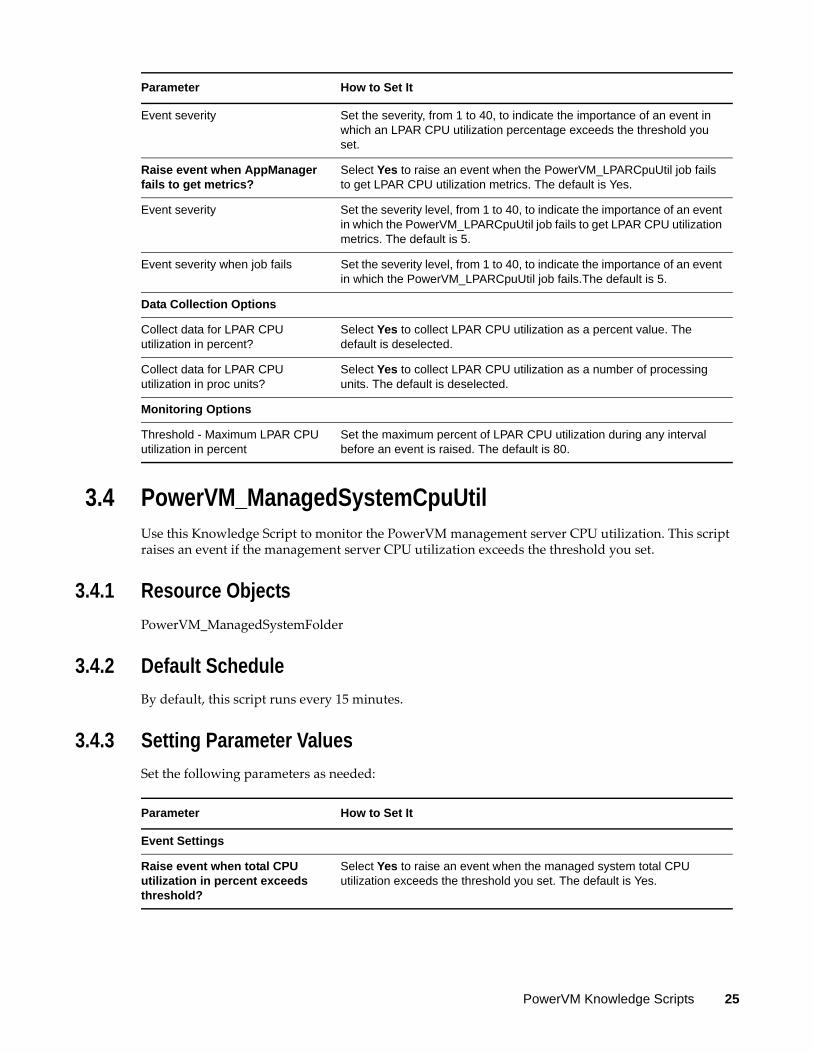
3.4 PowerVM_ManagedSystemCpuUtilUse this Knowledge Script to monitor the PowerVM management server CPU utilization. This script raises an event if the management server CPU utilization exceeds the threshold you set.
3.4.1 Resource Objects
PowerVM_ManagedSystemFolder
3.4.2 Default Schedule
By default, this script runs every 15 minutes.
3.4.3 Setting Parameter Values
Set the following parameters as needed:
Event severity Set the severity, from 1 to 40, to indicate the importance of an event in which an LPAR CPU utilization percentage exceeds the threshold you set.
Raise event when AppManager fails to get metrics?
Select Yes to raise an event when the PowerVM_LPARCpuUtil job fails to get LPAR CPU utilization metrics. The default is Yes.
Event severity Set the severity level, from 1 to 40, to indicate the importance of an event in which the PowerVM_LPARCpuUtil job fails to get LPAR CPU utilization metrics. The default is 5.
Event severity when job fails Set the severity level, from 1 to 40, to indicate the importance of an event in which the PowerVM_LPARCpuUtil job fails.The default is 5.
Data Collection Options
Collect data for LPAR CPU utilization in percent?
Select Yes to collect LPAR CPU utilization as a percent value. The default is deselected.
Collect data for LPAR CPU utilization in proc units?
Select Yes to collect LPAR CPU utilization as a number of processing units. The default is deselected.
Monitoring Options
Threshold - Maximum LPAR CPU utilization in percent
Set the maximum percent of LPAR CPU utilization during any interval before an event is raised. The default is 80.
Parameter How to Set It
Parameter How to Set It
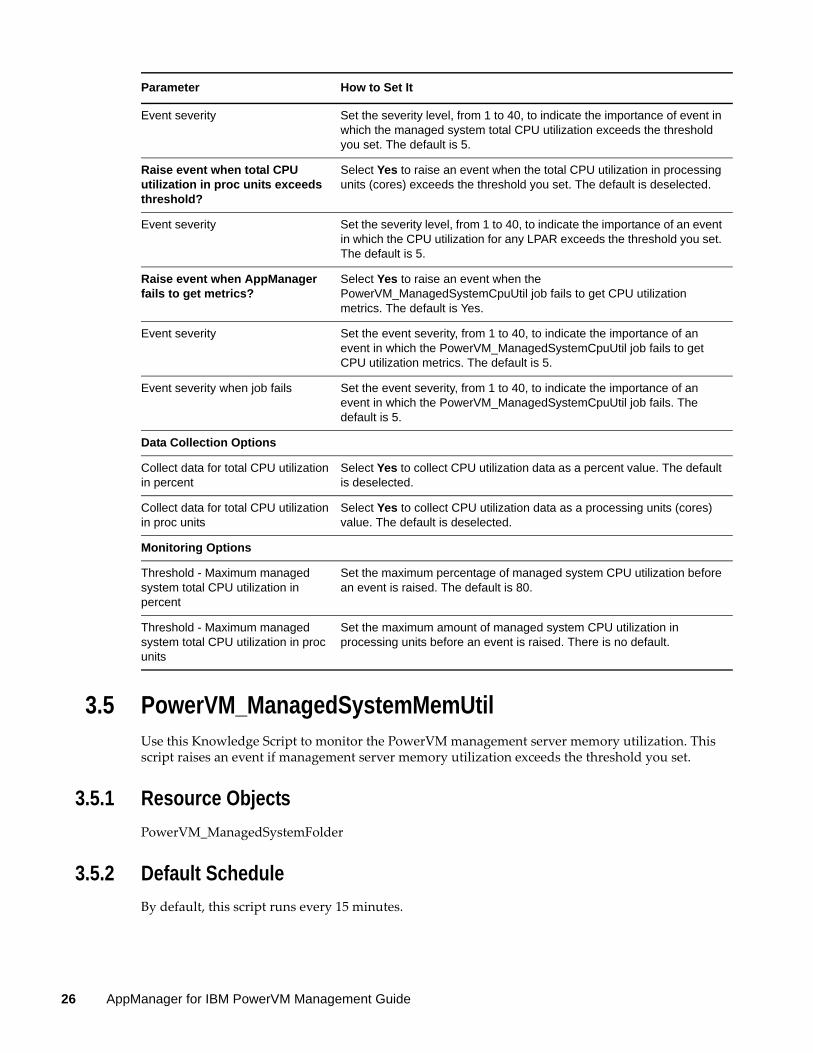
Event Settings
Raise event when total CPU utilization in percent exceeds threshold?
Select Yes to raise an event when the managed system total CPU utilization exceeds the threshold you set. The default is Yes.
PowerVM Knowledge Scripts 25
3.5 PowerVM_ManagedSystemMemUtilUse this Knowledge Script to monitor the PowerVM management server memory utilization. This script raises an event if management server memory utilization exceeds the threshold you set.
3.5.1 Resource Objects
PowerVM_ManagedSystemFolder
3.5.2 Default Schedule
By default, this script runs every 15 minutes.
Event severity Set the severity level, from 1 to 40, to indicate the importance of event in which the managed system total CPU utilization exceeds the threshold you set. The default is 5.
Raise event when total CPU utilization in proc units exceeds threshold?
Select Yes to raise an event when the total CPU utilization in processing units (cores) exceeds the threshold you set. The default is deselected.
Event severity Set the severity level, from 1 to 40, to indicate the importance of an event in which the CPU utilization for any LPAR exceeds the threshold you set. The default is 5.
Raise event when AppManager fails to get metrics?
Select Yes to raise an event when the PowerVM_ManagedSystemCpuUtil job fails to get CPU utilization metrics. The default is Yes.
Event severity Set the event severity, from 1 to 40, to indicate the importance of an event in which the PowerVM_ManagedSystemCpuUtil job fails to get CPU utilization metrics. The default is 5.
Event severity when job fails Set the event severity, from 1 to 40, to indicate the importance of an event in which the PowerVM_ManagedSystemCpuUtil job fails. The default is 5.
Data Collection Options
Collect data for total CPU utilization in percent
Select Yes to collect CPU utilization data as a percent value. The default is deselected.
Collect data for total CPU utilization in proc units
Select Yes to collect CPU utilization data as a processing units (cores) value. The default is deselected.
Monitoring Options
Threshold - Maximum managed system total CPU utilization in percent
Set the maximum percentage of managed system CPU utilization before an event is raised. The default is 80.
Threshold - Maximum managed system total CPU utilization in proc units
Set the maximum amount of managed system CPU utilization in processing units before an event is raised. There is no default.
Parameter How to Set It
26 AppManager for IBM PowerVM Management Guide
3.5.3 Setting Parameter Values
Set the following parameters as needed:
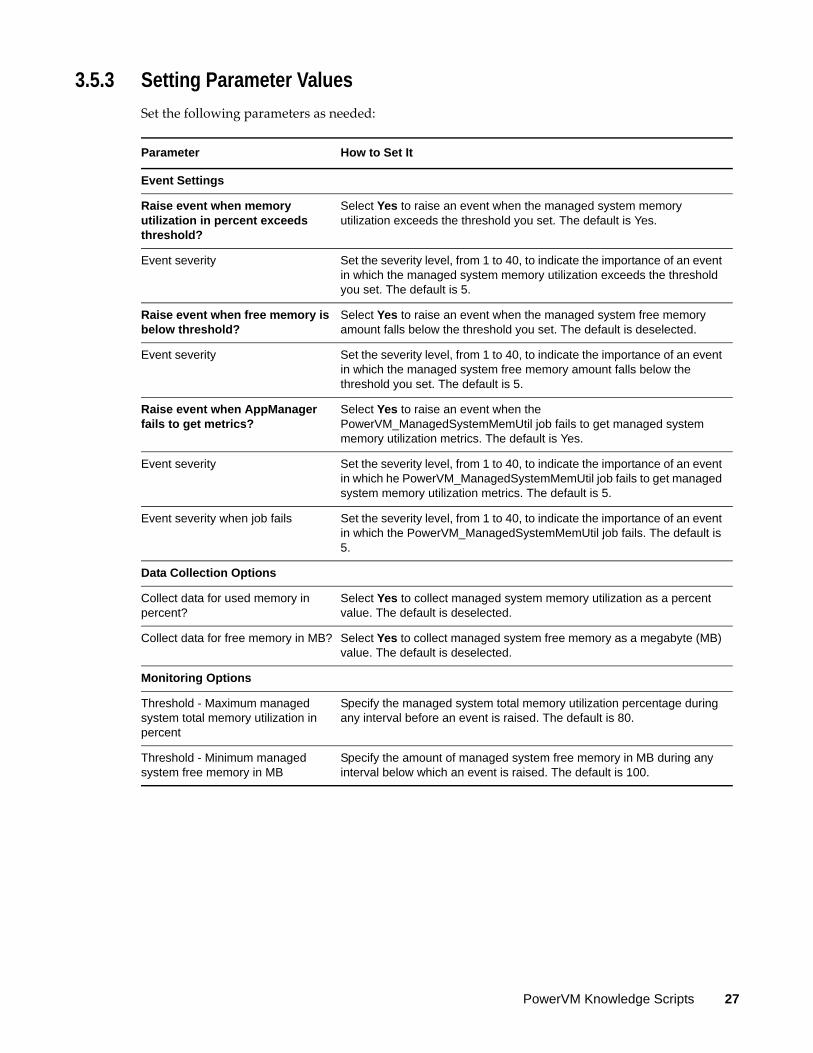
Parameter How to Set It
Event Settings
Raise event when memory utilization in percent exceeds threshold?
Select Yes to raise an event when the managed system memory utilization exceeds the threshold you set. The default is Yes.
Event severity Set the severity level, from 1 to 40, to indicate the importance of an event in which the managed system memory utilization exceeds the threshold you set. The default is 5.
Raise event when free memory is below threshold?
Select Yes to raise an event when the managed system free memory amount falls below the threshold you set. The default is deselected.
Event severity Set the severity level, from 1 to 40, to indicate the importance of an event in which the managed system free memory amount falls below the threshold you set. The default is 5.
Raise event when AppManager fails to get metrics?
Select Yes to raise an event when the PowerVM_ManagedSystemMemUtil job fails to get managed system memory utilization metrics. The default is Yes.
Event severity Set the severity level, from 1 to 40, to indicate the importance of an event in which he PowerVM_ManagedSystemMemUtil job fails to get managed system memory utilization metrics. The default is 5.
Event severity when job fails Set the severity level, from 1 to 40, to indicate the importance of an event in which the PowerVM_ManagedSystemMemUtil job fails. The default is 5.
Data Collection Options
Collect data for used memory in percent?
Select Yes to collect managed system memory utilization as a percent value. The default is deselected.
Collect data for free memory in MB? Select Yes to collect managed system free memory as a megabyte (MB) value. The default is deselected.
Monitoring Options
Threshold - Maximum managed system total memory utilization in percent
Specify the managed system total memory utilization percentage during any interval before an event is raised. The default is 80.
Threshold - Minimum managed system free memory in MB
Specify the amount of managed system free memory in MB during any interval below which an event is raised. The default is 100.
PowerVM Knowledge Scripts 27
3.6 PowerVM_PhysicalVolumeDiskSpaceUtilUse this Knowledge Script to monitor disk space utilization for a PowerVM physical volume. This Knowledge Script raises an event if total physical volume disk space utilization exceeds the threshold you set.
3.6.1 Resource Objects
PowerVM_PhysicalVolumeObj
3.6.2 Default Schedule
By default, this script runs every hour.
3.6.3 Setting Parameter Values
Set the following parameters as needed:
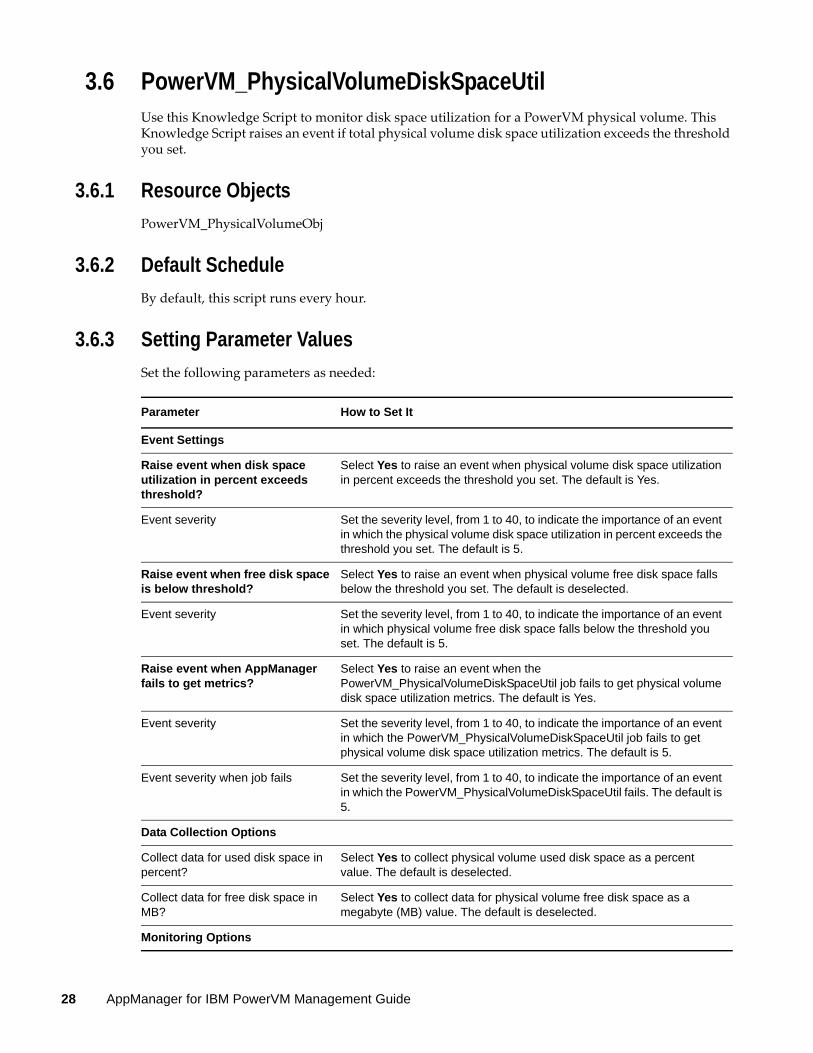
Parameter How to Set It
Event Settings
Raise event when disk space utilization in percent exceeds threshold?
Select Yes to raise an event when physical volume disk space utilization in percent exceeds the threshold you set. The default is Yes.
Event severity Set the severity level, from 1 to 40, to indicate the importance of an event in which the physical volume disk space utilization in percent exceeds the threshold you set. The default is 5.
Raise event when free disk space is below threshold?
Select Yes to raise an event when physical volume free disk space falls below the threshold you set. The default is deselected.
Event severity Set the severity level, from 1 to 40, to indicate the importance of an event in which physical volume free disk space falls below the threshold you set. The default is 5.
Raise event when AppManager fails to get metrics?
Select Yes to raise an event when the PowerVM_PhysicalVolumeDiskSpaceUtil job fails to get physical volume disk space utilization metrics. The default is Yes.
Event severity Set the severity level, from 1 to 40, to indicate the importance of an event in which the PowerVM_PhysicalVolumeDiskSpaceUtil job fails to get physical volume disk space utilization metrics. The default is 5.
Event severity when job fails Set the severity level, from 1 to 40, to indicate the importance of an event in which the PowerVM_PhysicalVolumeDiskSpaceUtil fails. The default is 5.
Data Collection Options
Collect data for used disk space in percent?
Select Yes to collect physical volume used disk space as a percent value. The default is deselected.
Collect data for free disk space in MB?
Select Yes to collect data for physical volume free disk space as a megabyte (MB) value. The default is deselected.
Monitoring Options
28 AppManager for IBM PowerVM Management Guide
3.7 PowerVM_PhysicalVolumeGroupDiskSpaceUtilUse this Knowledge Script to monitor disk space utilization for a PowerVM physical volume group. This knowledge script raises an event if the total disk space utilization exceeds the threshold you set.
3.7.1 Resource Objects
PowerVM_PhysicalVolumeGroupFolderPowerVM_PhysicalVolumeGroupObj
3.7.2 Default Schedule
By default, this script runs every hour.
3.7.3 Setting Parameter Values
Set the following parameters as needed:
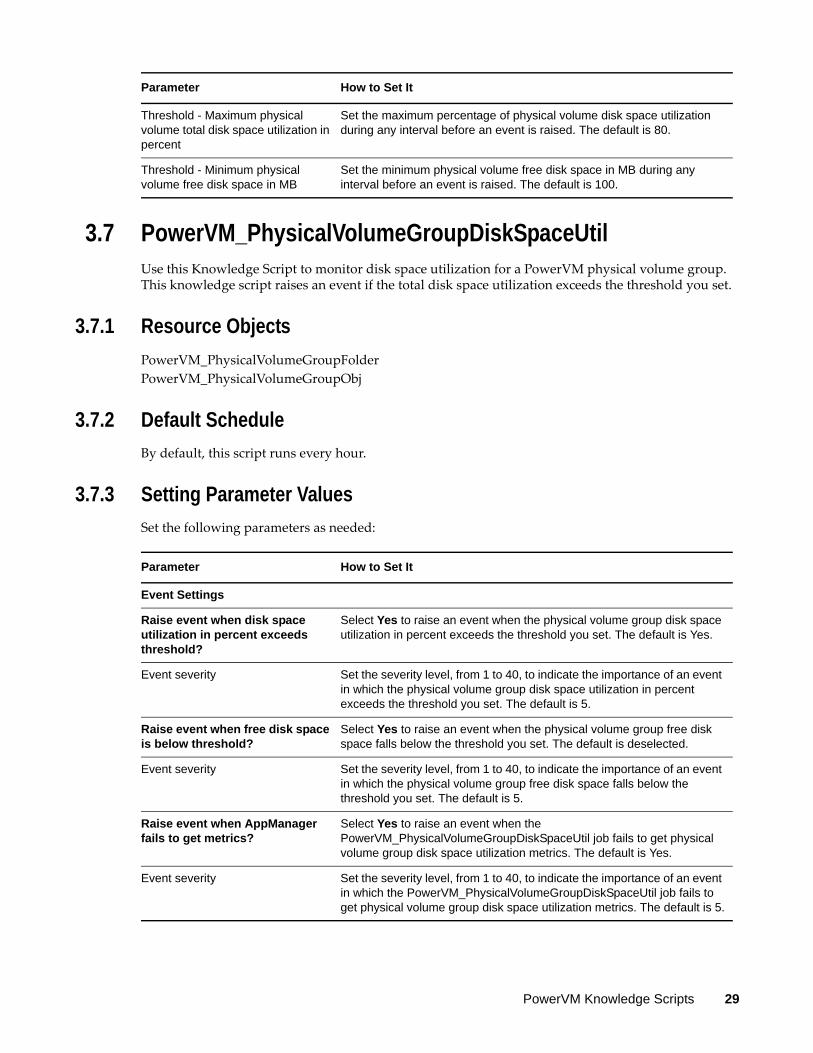
Threshold - Maximum physical volume total disk space utilization in percent
Set the maximum percentage of physical volume disk space utilization during any interval before an event is raised. The default is 80.
Threshold - Minimum physical volume free disk space in MB
Set the minimum physical volume free disk space in MB during any interval before an event is raised. The default is 100.
Parameter How to Set It
Parameter How to Set It
Event Settings
Raise event when disk space utilization in percent exceeds threshold?
Select Yes to raise an event when the physical volume group disk space utilization in percent exceeds the threshold you set. The default is Yes.
Event severity Set the severity level, from 1 to 40, to indicate the importance of an event in which the physical volume group disk space utilization in percent exceeds the threshold you set. The default is 5.
Raise event when free disk space is below threshold?
Select Yes to raise an event when the physical volume group free disk space falls below the threshold you set. The default is deselected.
Event severity Set the severity level, from 1 to 40, to indicate the importance of an event in which the physical volume group free disk space falls below the threshold you set. The default is 5.
Raise event when AppManager fails to get metrics?
Select Yes to raise an event when the PowerVM_PhysicalVolumeGroupDiskSpaceUtil job fails to get physical volume group disk space utilization metrics. The default is Yes.
Event severity Set the severity level, from 1 to 40, to indicate the importance of an event in which the PowerVM_PhysicalVolumeGroupDiskSpaceUtil job fails to get physical volume group disk space utilization metrics. The default is 5.
PowerVM Knowledge Scripts 29
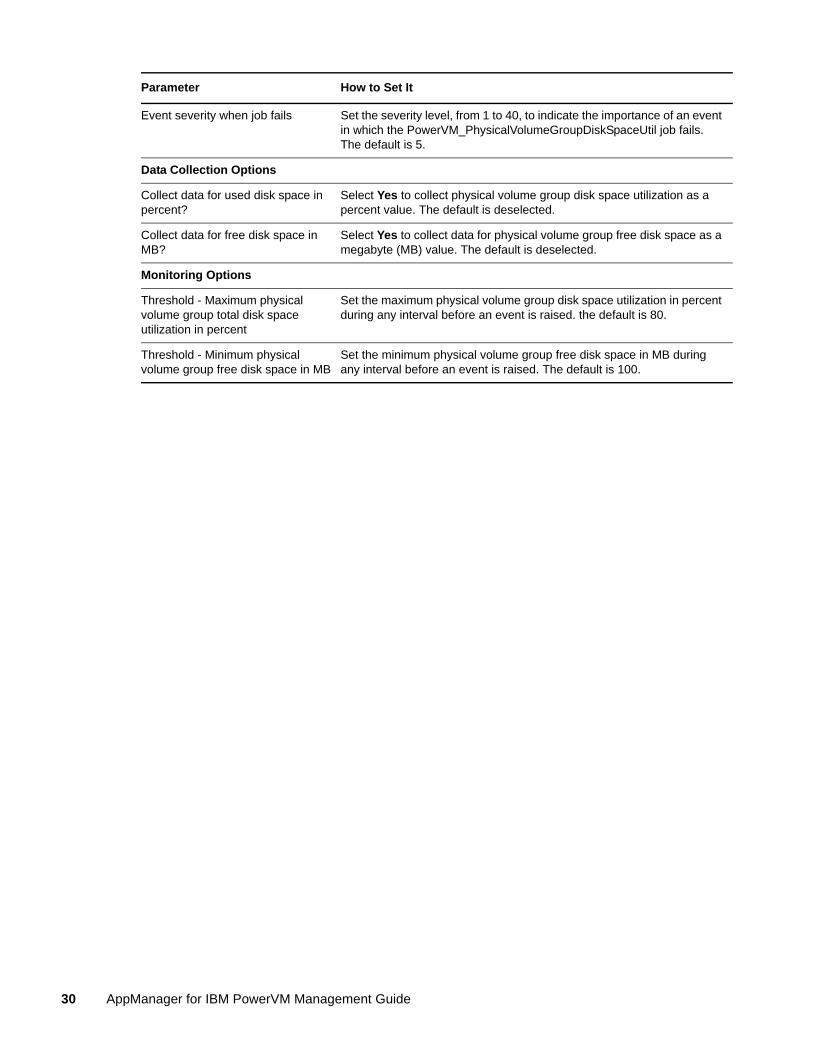
Event severity when job fails Set the severity level, from 1 to 40, to indicate the importance of an event in which the PowerVM_PhysicalVolumeGroupDiskSpaceUtil job fails. The default is 5.
Data Collection Options
Collect data for used disk space in percent?
Select Yes to collect physical volume group disk space utilization as a percent value. The default is deselected.
Collect data for free disk space in MB?
Select Yes to collect data for physical volume group free disk space as a megabyte (MB) value. The default is deselected.
Monitoring Options
Threshold - Maximum physical volume group total disk space utilization in percent
Set the maximum physical volume group disk space utilization in percent during any interval before an event is raised. the default is 80.
Threshold - Minimum physical volume group free disk space in MB
Set the minimum physical volume group free disk space in MB during any interval before an event is raised. The default is 100.
Parameter How to Set It
30 AppManager for IBM PowerVM Management Guide