APPLYING SVMS POST-PROCESSINGSTRATEGIES FOR … · APPLYING SVMS POST-PROCESSINGSTRATEGIES FOR...
8
APPLYING SVMS POST-PROCESSING STRATEGIES FOR DETECTING FAULTS IN CGMS Yenny Leal * , Luis Gonzalez-Abril † , Carol Lorencio ‡ , Cristiano Marcos Agulhari * , Josep Vehi § * Av. Alberto Carazzai, 1640 Universidade Tecnol´ogica Federal do Paran´ a 86300-000 Cornelio Procopio, Paran´ a, Brazil † Av. Ram´ on y Cajal, s/n University of Seville 41018 Seville, Andaluc´ ıa, Spain ‡ Av. de Fran¸ca, s/n University Hospital of Girona Doctor Josep Trueta 17007 Girona, Catalunya, Spain § Av. Llu´ ıs Santal´ o, s/n University of Girona 17071 Girona, Catalunya, Spain Emails: [email protected], [email protected], [email protected], [email protected], [email protected] Abstract— Support vector machines (SVMs) are an attractive option for detecting incorrect measurements in continuous glucose monitoring systems (CGMSs), because their learning mechanism usually considers a small subset of patterns to separate failure from fault-free situations. However, standard SVM is inherently biased towards the majority class when classifying imbalanced datasets. This work is aimed to introduce two SVMs post-processing strategies for imbalanced datasets applying them to improve the reliability of CGMSs. The first approach, called SVM-1, considers improving the geometric mean between specificity and sensitivity. In the second approach, called SVM-2, the priority is to improve sensitivity rather than improving the accuracy of the overall classifier. To test these approaches, a dataset of 537 samples was obtained (372 correct and 165 incorrect measurements classified according to International Standards Organization (ISO) criteria) from 23 critically-ill patients receiving insulin therapy and monitoring over 72 h using a CGMS. The results obtained have shown that new approaches of SVMs are a potential tool to improve the reliability of CGMSs. Keywords— Support vector machines, Fault detection, Continuous glucose monitoring systems, Critically ill patients, Balanced performance. Resumo— M´ aquinas de vetores de suporte (SVMs) s˜ao uma op¸c˜ ao atraente para a detec¸c˜ ao de medi¸c˜ oes incorretas em sistemas de monitoramento cont´ ınua de glicose (CGMSs), porque seu mecanismo de aprendizagem geralmente considera um pequeno subconjunto de padr˜ oes para separar fracassos de situa¸c˜ oes sem falha. No entanto, o SVM padr˜ ao ´ e inerentemente inclinado para a classe majorit´ aria ao classificar conjuntos de dados desbalanceados. Este trabalho tem como objetivo apresentar duas estrat´ egias de p´os-processamento dos SVMs para conjuntos de dados desbalanceados ao aplic´a-las para melhorar a confiabilidade do CGMSs. A primeira abordagem, chamado SVM-1, considera melhorar a m´ edia geom´ etrica entre a especificidade e sensibilidade. Na segunda abordagem, chamado SVM-2, a prioridade ´ e melhorar a sensibilidade em vez de melhorar a precis˜ ao do classificador geral. Para testar estas abordagens, um conjunto de dados de 537 amostras foi obtido (372 corretos e 165 medi¸c˜ oes incorretas classificados de acordo com crit´ erios do International Standards Organization (ISO)) a partir de 23 pacientes criticamente doentes que recebem a terapia de insulina e monitoramento de glicose por 72 horas usando um CGMS. Os resultados obtidos mostraram que as novas abordagens de SVMs podem ser uma ferramenta potencial para melhorar a confiabilidade do CGMSs. Palavras-chave— M´ aquina de vetores de suporte, Detec¸c˜ ao de falhas, Sistemas de monitoramento cont´ ınua de glicose, Pacientes criticamente doentes, Desempenho equilibrado. 1 Introduction Continuous glucose monitoring systems (CGMS) are devices capable of continuously estimating the glucose concentration in interstitial fluid. In re- cent years, there has been an unprecedented tech- nological progress in the development of CGMS, which constitute a field of work of great impor- tance inside of the technological research line that seeks to improve the quality of life in millions of diabetic, and reduce their financial burden. The main goal of CGMS is to estimate blood glucose (BG) concentrations continuously over time (be- tween one to five minutes) to provide detailed real- time information about glucose variability: di- rection, magnitude, duration, and frequency of hypo- or hyper-glycemia. This information per- mits to identify the glucose trends throughout the day, and facilitate in detecting critical glycemic episodes (hypo- and hyper-glycemia). The main advantages of CGMS have been demonstrated Anais do XX Congresso Brasileiro de Automática Belo Horizonte, MG, 20 a 24 de Setembro de 2014 1080
Transcript of APPLYING SVMS POST-PROCESSINGSTRATEGIES FOR … · APPLYING SVMS POST-PROCESSINGSTRATEGIES FOR...

APPLYING SVMS POST-PROCESSING STRATEGIES FOR DETECTING FAULTS
IN CGMS
Yenny Leal∗, Luis Gonzalez-Abril†, Carol Lorencio‡, Cristiano Marcos Agulhari∗, Josep
Vehi§
∗Av. Alberto Carazzai, 1640
Universidade Tecnologica Federal do Parana
86300-000 Cornelio Procopio, Parana, Brazil
†Av. Ramon y Cajal, s/n
University of Seville
41018 Seville, Andalucıa, Spain
‡Av. de Franca, s/n
University Hospital of Girona Doctor Josep Trueta
17007 Girona, Catalunya, Spain
§Av. Lluıs Santalo, s/n
University of Girona
17071 Girona, Catalunya, Spain
Emails: [email protected], [email protected], [email protected],
[email protected], [email protected]
Abstract— Support vector machines (SVMs) are an attractive option for detecting incorrect measurementsin continuous glucose monitoring systems (CGMSs), because their learning mechanism usually considers a smallsubset of patterns to separate failure from fault-free situations. However, standard SVM is inherently biasedtowards the majority class when classifying imbalanced datasets. This work is aimed to introduce two SVMspost-processing strategies for imbalanced datasets applying them to improve the reliability of CGMSs. The firstapproach, called SVM-1, considers improving the geometric mean between specificity and sensitivity. In thesecond approach, called SVM-2, the priority is to improve sensitivity rather than improving the accuracy of theoverall classifier. To test these approaches, a dataset of 537 samples was obtained (372 correct and 165 incorrectmeasurements classified according to International Standards Organization (ISO) criteria) from 23 critically-illpatients receiving insulin therapy and monitoring over 72 h using a CGMS. The results obtained have shownthat new approaches of SVMs are a potential tool to improve the reliability of CGMSs.
Keywords— Support vector machines, Fault detection, Continuous glucose monitoring systems, Critically illpatients, Balanced performance.
Resumo— Maquinas de vetores de suporte (SVMs) sao uma opcao atraente para a deteccao de medicoesincorretas em sistemas de monitoramento contınua de glicose (CGMSs), porque seu mecanismo de aprendizagemgeralmente considera um pequeno subconjunto de padroes para separar fracassos de situacoes sem falha. Noentanto, o SVM padrao e inerentemente inclinado para a classe majoritaria ao classificar conjuntos de dadosdesbalanceados. Este trabalho tem como objetivo apresentar duas estrategias de pos-processamento dos SVMspara conjuntos de dados desbalanceados ao aplica-las para melhorar a confiabilidade do CGMSs. A primeiraabordagem, chamado SVM-1, considera melhorar a media geometrica entre a especificidade e sensibilidade. Nasegunda abordagem, chamado SVM-2, a prioridade e melhorar a sensibilidade em vez de melhorar a precisao doclassificador geral. Para testar estas abordagens, um conjunto de dados de 537 amostras foi obtido (372 corretose 165 medicoes incorretas classificados de acordo com criterios do International Standards Organization (ISO)) apartir de 23 pacientes criticamente doentes que recebem a terapia de insulina e monitoramento de glicose por 72horas usando um CGMS. Os resultados obtidos mostraram que as novas abordagens de SVMs podem ser umaferramenta potencial para melhorar a confiabilidade do CGMSs.
Palavras-chave— Maquina de vetores de suporte, Deteccao de falhas, Sistemas de monitoramento contınuade glicose, Pacientes criticamente doentes, Desempenho equilibrado.
1 Introduction
Continuous glucose monitoring systems (CGMS)are devices capable of continuously estimating theglucose concentration in interstitial fluid. In re-cent years, there has been an unprecedented tech-nological progress in the development of CGMS,which constitute a field of work of great impor-tance inside of the technological research line thatseeks to improve the quality of life in millions ofdiabetic, and reduce their financial burden. The
main goal of CGMS is to estimate blood glucose(BG) concentrations continuously over time (be-tween one to five minutes) to provide detailed real-time information about glucose variability: di-rection, magnitude, duration, and frequency ofhypo- or hyper-glycemia. This information per-mits to identify the glucose trends throughout theday, and facilitate in detecting critical glycemicepisodes (hypo- and hyper-glycemia). The mainadvantages of CGMS have been demonstrated
Anais do XX Congresso Brasileiro de Automática Belo Horizonte, MG, 20 a 24 de Setembro de 2014
1080

in multiple clinical studies: a better glycemiccontrol, reduction of hypo- and hyper-glycemicepisodes and reduced HbA1c. Besides, CGMS isbeing a key element in the development of the so-called “artificial pancreas” (AP) (Bequette, 2012),a close-loop system which are integrated a CGMSdevice, an insulin pump and an algorithm for au-tomatic control of glucose.
In intensive care units (ICUs), BG moni-toring is done intermittently using different self-monitoring of blood glucose (SMBGs), which im-poses an additional burden on the ICU staff.CGMSs allow for better control of glycemia byidentifying real-time fluctuations in BG, permit-ting the staff to anticipate episodes of hypo-and hyper-glycemia, potentially with fewer man-ual measurements. However, the performance ofCGMS is still suboptimal in terms of accuracy, re-liability and robustness against possible failures,and this can significantly limit their use as a re-placement for traditional SMBGs. Thus, improve-ment of the accuracy, reliability and robustness ofthese devices is essential.
The issue of reliability has not been addressedyet, being the current version of CGMSs still notable to detect and compensate for failures that cancorrupt the local reliability of the CGMS trace.The glucose estimations are unreliable, particu-larly in the hypoglycemic range (Luijf et al., 2013),in comparison with SMBG measurements and lab-oratory systems. In order to improve reliabil-ity, self-monitoring capabilities must be embed-ded in the CGMS for detecting abrupt faults.As only a limited number of works about faultdetection methods for CGMSs have been pub-lished to improve the reliability of these devices(Ward et al., 2004; Bondia et al., 2008; Facchinettiet al., 2011; Signal et al., 2012; Leal et al., 2013),significant progress needs to be made in CGMSfault detection (Bequette, 2010).
Support vector machines (SVMs) are learn-ing machines that implement the structural riskminimization inductive principle to obtain gener-alization on a limited number of learning patterns(Vapnik, 1998). Thus, SVMs are an attractiveoption for detecting correct and incorrect mea-surements made by CGMS, because their learningmechanism usually considers a small subset of pat-terns to separate failure from fault-free situations.Recently, standard SVMs have been used for thedetection of therapeutically correct and incorrectmeasurements made by the CGMS Goldr, accord-ing to the clinical criteria (Bondia et al., 2008),to make clinical decisions. However, in CGMSfault detection, there are many examples of cor-rect measurements and a few examples of incor-rect measurements, i.e. the number of bad data islimited. Thus, in the context of this problem, itis very important to obtain models that exhibita high prediction performance on the minority
class, because it usually represents the target ofthe clinical practice, especially whenever the in-correct measurements made by the CGMS corre-spond to the moment when a patient showed highglycemic instability (hypo- and hyper-glycemia).However, standard SVM is inherently biased to-wards the majority class when classifying imbal-anced datasets (Gonzalez-Abril et al., 2014), apremise not considered in (Bondia et al., 2008).
This work is aimed to introduce twoSVMs post-processing strategies for imbalanceddatasets. The first approach, called SVM-1, con-siders improving the geometric mean (Gmean) be-tween specificity and sensitivity. In the second ap-proach, called SVM-2, the priority is to improvethe sensitivity rather than improving the speci-ficity of the overall classifier. To distinguish be-tween correct and incorrect measurements, newSVMs are trained using the data provided bya CGMS (electrical signal and glucose estima-tion) and insulin dose. The readings providedby the monitor have been previously classified ac-cording to a numerical accuracy criteria (Inter-national Standards Organization [ISO] criteria)(ISO, 2003).
The remainder of this paper is organized asfollows: Section 2 describes the SVMs, the met-rics commonly employed in the classification prob-lems, and the methodology developed using SVMspost-processing strategies. Section 3 describes theclinical experimental setup, and the transforma-tion of the CGMS fault detection problem into abi-classification problem. Finally, Sections 4 and5 report the results and conclusions, respectively.
2 Support Vector Machines
2.1 The standard SVM
Let Z = {(x1, y1), . . . , (xN , yN)} be a training setwith xi ∈ X as the input space, yi ∈ {+1,−1}as the output space, and zi = (xi, yi). Let φ :X → F , x = φ(x) be a feature mapping with a dotproduct denoted by 〈·, ·〉. A binary linear classifierf : X → R, defined as f(x) = 〈x,w〉 − b, is soughtwhere w ∈ F , b ∈ R. Outputs are obtained ash(x) = sign(f(x)).
The standard SVM leads to the optimizationproblem (Gonzalez-Abril et al., 2006):
minw∈F ,b∈R
1
2‖w‖2 + C
N∑
i=1
ξi
subject to
{
yi (〈xi,w〉 − b) + ξi ≥ 1, ∀i
ξi ≥ 0, ∀i
(1)where w defines the orientation of the classifier,bias b determines its position, and slack variablesξi measure the error on the instances. The user-defined parameter C is such that if the value of Cis higher, then the focus of the SVM on minimizing
Anais do XX Congresso Brasileiro de Automática Belo Horizonte, MG, 20 a 24 de Setembro de 2014
1081
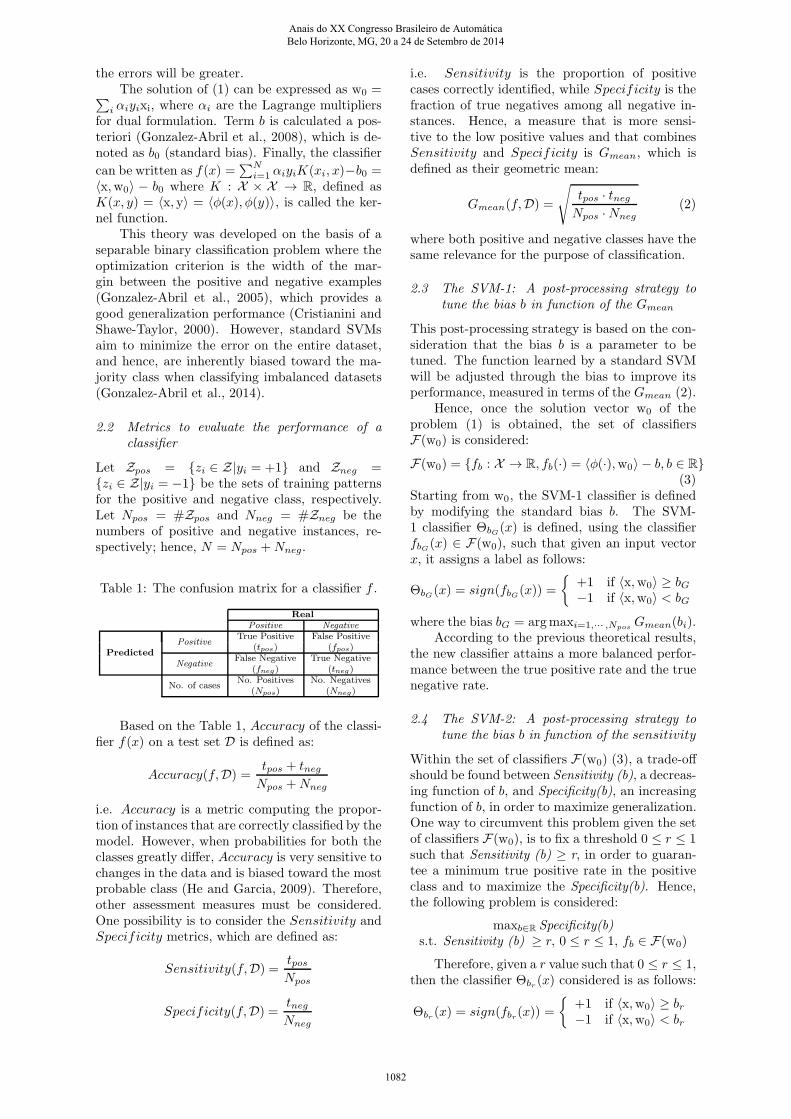
the errors will be greater.The solution of (1) can be expressed as w0 =
∑
i αiyixi, where αi are the Lagrange multipliersfor dual formulation. Term b is calculated a pos-teriori (Gonzalez-Abril et al., 2008), which is de-noted as b0 (standard bias). Finally, the classifier
can be written as f(x) =∑N
i=1αiyiK(xi, x)−b0 =
〈x,w0〉 − b0 where K : X × X → R, defined asK(x, y) = 〈x, y〉 = 〈φ(x), φ(y)〉, is called the ker-nel function.
This theory was developed on the basis of aseparable binary classification problem where theoptimization criterion is the width of the mar-gin between the positive and negative examples(Gonzalez-Abril et al., 2005), which provides agood generalization performance (Cristianini andShawe-Taylor, 2000). However, standard SVMsaim to minimize the error on the entire dataset,and hence, are inherently biased toward the ma-jority class when classifying imbalanced datasets(Gonzalez-Abril et al., 2014).
2.2 Metrics to evaluate the performance of a
classifier
Let Zpos = {zi ∈ Z|yi = +1} and Zneg ={zi ∈ Z|yi = −1} be the sets of training patternsfor the positive and negative class, respectively.Let Npos = #Zpos and Nneg = #Zneg be thenumbers of positive and negative instances, re-spectively; hence, N = Npos +Nneg.
Table 1: The confusion matrix for a classifier f .
Real
Positive Negative
Predicted
PositiveTrue Positive False Positive
(tpos) (fpos)
NegativeFalse Negative True Negative
(fneg) (tneg)
No. of casesNo. Positives No. Negatives
(Npos) (Nneg)
Based on the Table 1, Accuracy of the classi-fier f(x) on a test set D is defined as:
Accuracy(f,D) =tpos + tneg
Npos +Nneg
i.e. Accuracy is a metric computing the propor-tion of instances that are correctly classified by themodel. However, when probabilities for both theclasses greatly differ, Accuracy is very sensitive tochanges in the data and is biased toward the mostprobable class (He and Garcia, 2009). Therefore,other assessment measures must be considered.One possibility is to consider the Sensitivity andSpecificity metrics, which are defined as:
Sensitivity(f,D) =tpos
Npos
Specificity(f,D) =tneg
Nneg
i.e. Sensitivity is the proportion of positivecases correctly identified, while Specificity is thefraction of true negatives among all negative in-stances. Hence, a measure that is more sensi-tive to the low positive values and that combinesSensitivity and Specificity is Gmean, which isdefined as their geometric mean:
Gmean(f,D) =
√
tpos · tneg
Npos ·Nneg
(2)
where both positive and negative classes have thesame relevance for the purpose of classification.
2.3 The SVM-1: A post-processing strategy to
tune the bias b in function of the Gmean
This post-processing strategy is based on the con-sideration that the bias b is a parameter to betuned. The function learned by a standard SVMwill be adjusted through the bias to improve itsperformance, measured in terms of the Gmean (2).
Hence, once the solution vector w0 of theproblem (1) is obtained, the set of classifiersF(w0) is considered:
F(w0) = {fb : X → R, fb(·) = 〈φ(·),w0〉 − b, b ∈ R}
(3)Starting from w0, the SVM-1 classifier is definedby modifying the standard bias b. The SVM-1 classifier ΘbG(x) is defined, using the classifierfbG(x) ∈ F(w0), such that given an input vectorx, it assigns a label as follows:
ΘbG(x) = sign(fbG(x)) =
{
+1 if 〈x,w0〉 ≥ bG
−1 if 〈x,w0〉 < bG
where the bias bG = argmaxi=1,··· ,NposGmean(bi).
According to the previous theoretical results,the new classifier attains a more balanced perfor-mance between the true positive rate and the truenegative rate.
2.4 The SVM-2: A post-processing strategy to
tune the bias b in function of the sensitivity
Within the set of classifiers F(w0) (3), a trade-offshould be found between Sensitivity (b), a decreas-ing function of b, and Specificity(b), an increasingfunction of b, in order to maximize generalization.One way to circumvent this problem given the setof classifiers F(w0), is to fix a threshold 0 ≤ r ≤ 1such that Sensitivity (b) ≥ r, in order to guaran-tee a minimum true positive rate in the positiveclass and to maximize the Specificity(b). Hence,the following problem is considered:
maxb∈R Specificity(b)
s.t. Sensitivity (b) ≥ r, 0 ≤ r ≤ 1, fb ∈ F(w0)
Therefore, given a r value such that 0 ≤ r ≤ 1,then the classifier Θbr (x) considered is as follows:
Θbr (x) = sign(fbr(x)) =
{
+1 if 〈x,w0〉 ≥ br
−1 if 〈x,w0〉 < br
Anais do XX Congresso Brasileiro de Automática Belo Horizonte, MG, 20 a 24 de Setembro de 2014
1082
where the bias br = bir, where ir =max {i, i ≤ 1 +Npos(1− r)}.
3 Database
3.1 Subjects and dataset
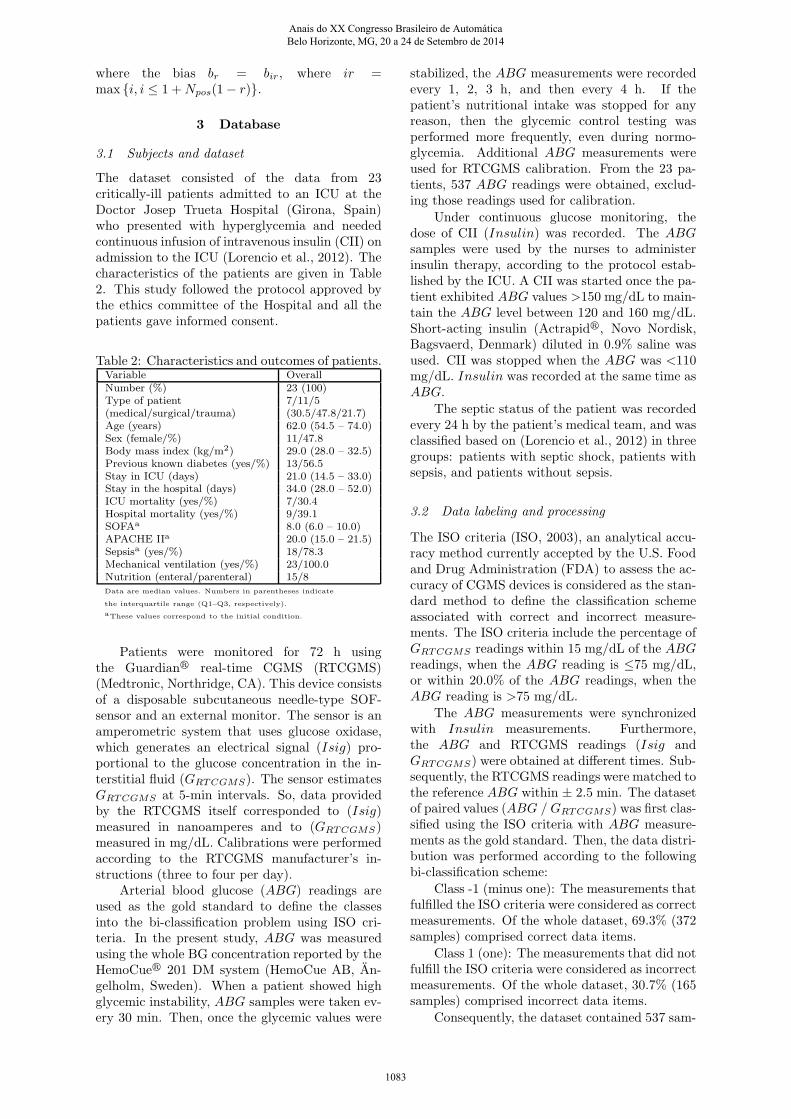
The dataset consisted of the data from 23critically-ill patients admitted to an ICU at theDoctor Josep Trueta Hospital (Girona, Spain)who presented with hyperglycemia and neededcontinuous infusion of intravenous insulin (CII) onadmission to the ICU (Lorencio et al., 2012). Thecharacteristics of the patients are given in Table2. This study followed the protocol approved bythe ethics committee of the Hospital and all thepatients gave informed consent.
Table 2: Characteristics and outcomes of patients.Variable OverallNumber (%) 23 (100)Type of patient 7/11/5(medical/surgical/trauma) (30.5/47.8/21.7)Age (years) 62.0 (54.5 – 74.0)Sex (female/%) 11/47.8Body mass index (kg/m2) 29.0 (28.0 – 32.5)Previous known diabetes (yes/%) 13/56.5Stay in ICU (days) 21.0 (14.5 – 33.0)Stay in the hospital (days) 34.0 (28.0 – 52.0)ICU mortality (yes/%) 7/30.4Hospital mortality (yes/%) 9/39.1SOFAa 8.0 (6.0 – 10.0)APACHE IIa 20.0 (15.0 – 21.5)Sepsisa (yes/%) 18/78.3Mechanical ventilation (yes/%) 23/100.0Nutrition (enteral/parenteral) 15/8Data are median values. Numbers in parentheses indicate
the interquartile range (Q1–Q3, respectively).
aThese values correspond to the initial condition.
Patients were monitored for 72 h usingthe Guardianr real-time CGMS (RTCGMS)(Medtronic, Northridge, CA). This device consistsof a disposable subcutaneous needle-type SOF-sensor and an external monitor. The sensor is anamperometric system that uses glucose oxidase,which generates an electrical signal (Isig) pro-portional to the glucose concentration in the in-terstitial fluid (GRTCGMS). The sensor estimatesGRTCGMS at 5-min intervals. So, data providedby the RTCGMS itself corresponded to (Isig)measured in nanoamperes and to (GRTCGMS)measured in mg/dL. Calibrations were performedaccording to the RTCGMS manufacturer’s in-structions (three to four per day).
Arterial blood glucose (ABG) readings areused as the gold standard to define the classesinto the bi-classification problem using ISO cri-teria. In the present study, ABG was measuredusing the whole BG concentration reported by theHemoCuer 201 DM system (HemoCue AB, An-gelholm, Sweden). When a patient showed highglycemic instability, ABG samples were taken ev-ery 30 min. Then, once the glycemic values were
stabilized, the ABG measurements were recordedevery 1, 2, 3 h, and then every 4 h. If thepatient’s nutritional intake was stopped for anyreason, then the glycemic control testing wasperformed more frequently, even during normo-glycemia. Additional ABG measurements wereused for RTCGMS calibration. From the 23 pa-tients, 537 ABG readings were obtained, exclud-ing those readings used for calibration.
Under continuous glucose monitoring, thedose of CII (Insulin) was recorded. The ABG
samples were used by the nurses to administerinsulin therapy, according to the protocol estab-lished by the ICU. A CII was started once the pa-tient exhibited ABG values >150 mg/dL to main-tain the ABG level between 120 and 160 mg/dL.Short-acting insulin (Actrapidr, Novo Nordisk,Bagsvaerd, Denmark) diluted in 0.9% saline wasused. CII was stopped when the ABG was <110mg/dL. Insulin was recorded at the same time asABG.
The septic status of the patient was recordedevery 24 h by the patient’s medical team, and wasclassified based on (Lorencio et al., 2012) in threegroups: patients with septic shock, patients withsepsis, and patients without sepsis.
3.2 Data labeling and processing
The ISO criteria (ISO, 2003), an analytical accu-racy method currently accepted by the U.S. Foodand Drug Administration (FDA) to assess the ac-curacy of CGMS devices is considered as the stan-dard method to define the classification schemeassociated with correct and incorrect measure-ments. The ISO criteria include the percentage ofGRTCGMS readings within 15 mg/dL of the ABG
readings, when the ABG reading is ≤75 mg/dL,or within 20.0% of the ABG readings, when theABG reading is >75 mg/dL.
The ABG measurements were synchronizedwith Insulin measurements. Furthermore,the ABG and RTCGMS readings (Isig andGRTCGMS) were obtained at different times. Sub-sequently, the RTCGMS readings were matched tothe reference ABG within ± 2.5 min. The datasetof paired values (ABG /GRTCGMS) was first clas-sified using the ISO criteria with ABG measure-ments as the gold standard. Then, the data distri-bution was performed according to the followingbi-classification scheme:
Class -1 (minus one): The measurements thatfulfilled the ISO criteria were considered as correctmeasurements. Of the whole dataset, 69.3% (372samples) comprised correct data items.
Class 1 (one): The measurements that did notfulfill the ISO criteria were considered as incorrectmeasurements. Of the whole dataset, 30.7% (165samples) comprised incorrect data items.
Consequently, the dataset contained 537 sam-
Anais do XX Congresso Brasileiro de Automática Belo Horizonte, MG, 20 a 24 de Setembro de 2014
1083
ples labeled in two imbalanced classes (372/165),and each sample was composed of three variables:Isig, GRTCGMS and Insulin.
3.3 Detection of correct and incorrect measure-
ments in CGMSs by applying post-processing
SVMs
To evaluate the performance of the post-processing strategies SVM-1 and SVM-2, a leave-three-out cross-validation strategy was used, i.e.patients’ data were partitioned into two sets: atraining set (20 patients) and a testing set (thethree remaining patients). First, different classi-fiers SVM-1 and SVM-2 were trained. The train-ing set considered the feature vector X = (Isig,GRTCGMS , Insulin) as the input. The featurevector was autoscaled to have zero mean and unityvariance to prevent problems with outliers. Then,model parameters were tuned from the trainingset previously autoscaled. Second, the classifierswere used to indicate the behavior of the otherthree patients not included in the training set(testing data). Thus, the testing data were au-toscaled accordingly using the mean and standarddeviation obtained from the training set.
The above-mentioned methodology was re-peated for different data partitions, i.e. combi-nations of 20-3 patients (eight partitions in to-tal). In each partition, different classifiers SVMs-1 and SVM-2s using polynomial kernel (SVM-1-Poly and SVM-2-Poly) and radial basis functionkernel (SVM-1-RBF and SVM-2-RBF) were tunedand validated. The criterion employed to esti-mate the performance generalized in the SVMs-1 and SVMs-2 was the five-fold cross-validationon the entire training set, and this procedure wasrepeated 25 times to ensure good statistical be-havior.
In the case of SVMs-1, SVMs-1-Poly weretuned considering 60 possible combinations be-tween the value of C (regularization term)and d (degree polynomial) explored on a two-dimensional grid: C = [2−4
, 2−3 ... 26, 27] andd polynomial = [1, 2 ...5]. Thus, a total of 7500problems were solved. Similarly, SVMs-1-RBFwere tuned considering 132 possible combinationsbetween the value of C and σ (RBF width) ex-plored on a two-dimensional grid: C = [2−4
, 2−3
... 26, 27] and σ = [2−3 ...26, 27]. Thus, a totalof 16500 problems were solved. All models ob-tained from each combination of parameters werevalidated using their corresponding validation set.
In the case of SVMs-2, SVMs-2-Poly weretuned considering 60 possible combinations be-tween the value of C and d explored on a two-dimensional grid: C = [2−4
, 2−3 ... 26, 27] andd polynomial = [1, 2 ...5]. In order to guaran-tee a maxim true positive rate (Sensitivity (b))≥ r), the threshold r was fixed as follows: r =
[0.7, 0.75, 0.8, 0.85, 0.9, 0.95, 0.99]. Thus, for eachr value, a total of 7500 problems were solved. Sim-ilarly, SVMs-2-RBF were tuned considering 132possible combinations between the value of C andσ explored on a two-dimensional grid: C = [2−4
,
2−3 ... 26, 27] and σ = [2−3 ...26, 27]. The thresh-old r was fixed considering seven possible valuesindicated previously. Thus, for each r value, a to-tal of 16500 problems were solved. All models ob-tained from each combination of parameters werevalidated using their corresponding validation set.
4 Results
First, a comparative analysis between different ap-proaches of SVMs (standard SVMs, SVMs-1 andSVMs-2) was carried out. The results are shownin Table 3.
Standard SVM reported the best values of Ac-curacy and Specificity in comparison with SVM-1and SVM-2. However, it also reported the worstvalues of Sensitivity. Sensitivity to low values im-plies the presence of false negatives. False nega-tives lead to the ICU staff to modify the dose ofCII, which would have a significant clinical impactwith regard to the administration of insulin ther-apy to the patient, because these misclassificationswould result in inappropriate treatment.
Although SVM-1 presented a lower Accuracythan standard SVM, it was found to have a bet-ter Sensitivity, which is the priority in the CGMSfault detection problem. As mentioned earlier,this is because the SVM-1 is based on Gmean,which considers both positive and negative classesto be equally relevant for the purpose of classifi-cation, balancing the performance between Sensi-
tivity and Specificity.The SVM-2 improved significantly the Sen-
sitivity regarding to the standard SVM. In con-trast, SVM-2 presented Specificity to low values,which implied a significant number of false pos-itives. The presence of false positives may nothave clinical consequences for patients, becausethey do not lead to the ICU staff modifying the in-sulin therapy. However, false positives lead to theICU staff taking measurements of ABG more fre-quently to ensure patient safety, which is contraryto one of the main benefits of using the CGMS inthe ICU, to avoid the frequent and painful punc-tures. To maximize the Specificity and to main-tain good Sensitivity, the optimal value to adjustr was 0.8. This value ensured a Specificity above50,0% and a good Sensitivity.
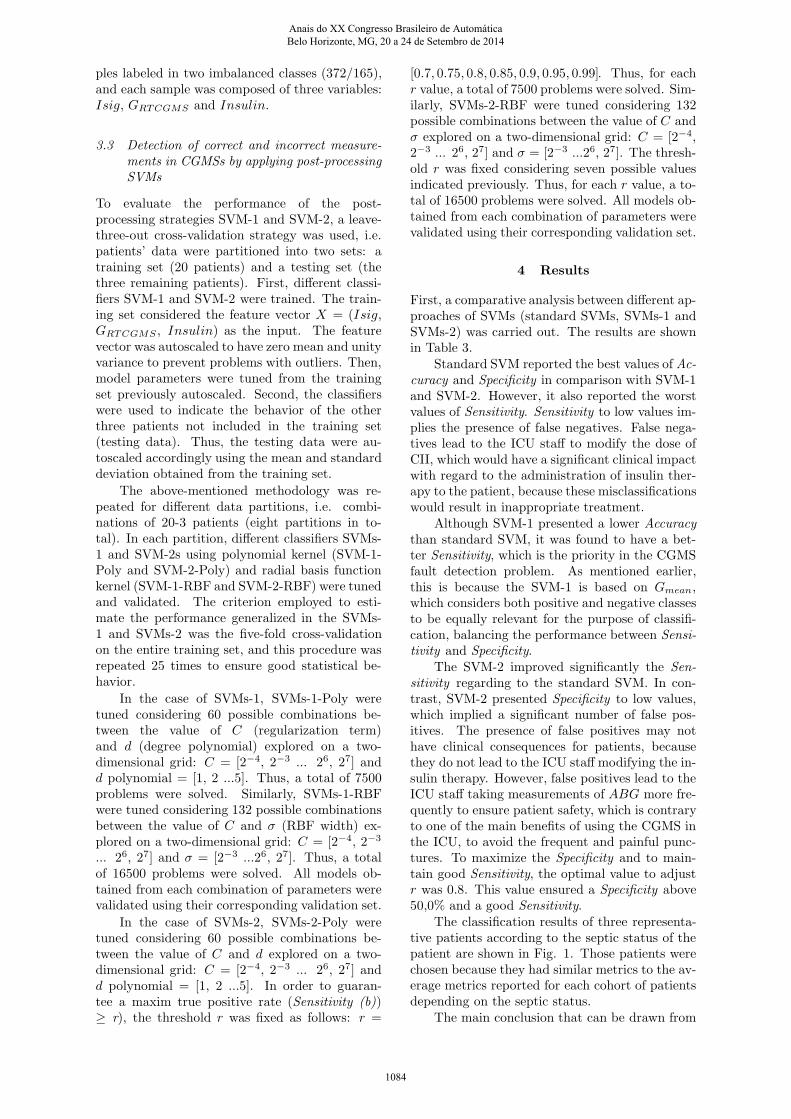
The classification results of three representa-tive patients according to the septic status of thepatient are shown in Fig. 1. Those patients werechosen because they had similar metrics to the av-erage metrics reported for each cohort of patientsdepending on the septic status.
The main conclusion that can be drawn from
Anais do XX Congresso Brasileiro de Automática Belo Horizonte, MG, 20 a 24 de Setembro de 2014
1084

Table 3: Average results of the metrics Accuracy, Specificity, Sensitivity and Gmean.Accuracy (%) Specificity (%) Sensitivity (%) Gmean (%)
SVMs using polynomial kernelSVM-Poly 71.3 89.5 27.4 49.5SVM-1-Poly 68.9 70.3 66.0 68.1
SVM-2-Poly
r = 0.70 68.5 68.3 68.5 68.4r = 0.75 43.1 30.8 73.5 47.6r = 0.80 62.4 56.1 77.8 66.1r = 0.85 55.3 44.4 82.7 60.6r = 0.90 47.2 31.5 86.6 52.2r = 0.95 39.4 18.6 91.7 41.3r = 0.99 32.6 06.7 98.0 25.6
SVMs using RBF kernelSVM-RBF 69.9 76.9 53.5 64.1SVM-1-RBF 69.7 69.7 69.5 69.6
SVM-2-RBF
r = 0.70 67.5 68.2 66.2 67.2r = 0.75 64.9 61.2 73.9 67.3r = 0.80 59.3 51.1 79.6 63.8r = 0.85 54.7 43.0 83.4 59.9r = 0.90 46.5 30.2 87.3 51.3r = 0.95 40.8 20.2 93.1 43.4r = 0.99 32.5 06.4 98.1 25.1
the Fig. 1 is that the SVM-1 provided a balancedand adequate performance for patients with sep-tic shock and with sepsis, but the performancewas poor for the patient without sepsis. Althoughthe patient without sepsis also reported balancedperformance in its metrics with SVM-1, these val-ues were low to be accepted from a clinical pointof view. On the other hand, when the SVM-2was applied a significant improvement of the Sen-sitivity was reported in the three patients, andthe values obtained in this metric were high tobe accepted from a clinical point of view. How-ever, although the SVM-2 guarantees a maximumrate in the detection of incorrect measurements,the Specificity values achieved were too low to beclinically accepted.
Let us illustrate the specific case of a patientwith septic shock, using a standard SVM-Poly (seeFig. 2, upper). This figure shows that the stan-dard SVM was highly specific (91.3%). However,its low Sensitivity (37.5%) implies a significantnumber of false negatives, which may lead to theICU staff to modify the dose of CII. In this partic-ular case, false negatives would have a significantclinical impact regarding to the administration ofinsulin therapy to the patient, which would causean inappropriate treatment.
Likewise, for the same patient, using a SVM-1-Poly (see Fig. 2, middle), it can be observed inthe figure that this patient presented a good Sen-
sitivity (75.0%). Similarly, this patient presenteda slight Specificity (69.6%). In this case, threefalse hyperglycemic states estimate by CGMS(GRTCGMS over 160 mg/dL when ABG is below160 mg/dL) were correctly detected as incorrectmeasurements by the classifier. According to thephysician’s opinion, the correct detection of thesecond false hyperglycemic episode by the pro-posed classifier is of great importance. For this
case, GRTCGMS was 178 mg/dL, while ABG was109 mg/dL. If the physician considered the glucosemeasurement indicated by the RTCGMS as reli-able, a dose of CII may be started to maintain theABG between 120 and 160 mg/dL. This decisionmay subsequently cause a severe hypoglycemicevent in the patient. Additionally, two rele-vant hypoglycemic events (ABG below 80 mg/dL)were correctly detected by the classifier. In theseevents, while ABG measurements indicated hypo-glycemic events, the RTCGMS estimated in theeuglycemic range (GRTCGMS between 80 and 160mg/dL). The correct detection of the second hy-poglycemic episode allowed for detecting a mea-surement of glucose erroneously estimated by theCGMS (highlighted with a blue dashed circle).
Finally, for the same patient, using a SVM-2-Poly (see Fig. 2, lower), it can be noted in thefigure that this patient presented a high Sensitiv-
ity (87.5%). However, an important number offalse positives were reported in this case (Speci-ficity = 43.5%). Although false positives do nothave clinical consequences for patients, these mis-classifications may lead to the ICU staff to tak-ing uncomfortable and painful punctures of ABG
more frequently to ensure patient safety, increas-ing the workload of nurses and the risk of acciden-tal punctures.
5 Conclusions
CGMSs are not sufficiently accurate and reliableat present to be used for therapeutic decisions.This study has shown that new approaches ofSVMs are a potential tool for developing a self-monitoring fault detection system from the infor-mation provided by the monitor itself and by in-corporating the dose of CII.
SVM-1 can be a good alternative for detecting
Anais do XX Congresso Brasileiro de Automática Belo Horizonte, MG, 20 a 24 de Setembro de 2014
1085

Figure 1: Classification results of three represen-tative patients according to the septic status.
(a) Accuracy
(b) Specificity
(c) Sensitivity
(d) Gmean
correct and incorrect CGMS measurements, be-cause a more balanced performance between Sen-
sitivity and Specificity could be attained owing tothe use of the Gmean metric. The obtained resultscan be considered as reliable and promising forpatients with septic shock or sepsis, but cannotbe considered as good for patients without sep-sis. This greater reliability in patients with septicshock and sepsis, could be explained by the in-crease in capillary permeability observed in thesetwo cohorts of patients. This increase in capillarypermeability would result in an increase in the dif-fusion of the intravascular glucose to the intersti-tial space. Consequently, for these two cohorts ofpatients, the information provided by the moni-tor itself (Isig and GRTCGMS), which is propor-tional to the glucose concentration in the intersti-tial space, would be more reliable. Patients withseptic shock or sepsis are those most frequently ad-mitted to the ICU. In this type of ICU patients,the glycemic control is often more difficult than inthose without sepsis.
Further studies with a larger sample size arerequired to confirm the benefits previously de-
scribed. These samples should be focused on hy-poglycemias due to the importance of the correctand timely detection of these events. Further re-search will include a temporal analysis in whichthe previous diagnosis is also considered.
6 Acknowledgements
This work was supported by the Spanish Ministryof Science and Innovation through grant DPI-2010-20764-C02, and it was partially supported bythe Andalusian Regional Ministry of Economy, In-novation and Science through Simon (TIC-8052).Y. Leal is grateful for the CAPES-PNPD grant.
References
Bequette, W. B. (2010). Continuous glucose mon-itoring: real-time algorithms for calibration,filtering, and alarms, J Diabetes Sci Technol
4: 404–418.
Bequette, W. B. (2012). Challenges and re-cent progress in the development of a closed-loop artificial pancreas, Annu. Rev. Control36: 255–266.
Bondia, J., Tarin, C., Garcia-Gabin, W., Es-teve, E., Fernandez-Real, J. M., Ricart, W.and Vehı, J. (2008). Using support vectormachines to detect therapeutically incorrectmeasurements by the minimed cgms, J Dia-
betes Sci Technol 2: 622–629.
Cristianini, N. and Shawe-Taylor, J. (2000). An
introduction to Support Vector Machines and
other kernel-based learning methods, Cam-bridge University.
Facchinetti, A., Del Favero, S., Sparacino, G.and Cobelli, C. (2011). Detecting failures ofthe glucose sensor-insulin pump system: im-proved overnight safety monitoring for type-1diabetes., Proc. Engineering in Medicine and
Biology Society, EMBC., pp. 4947–4950.
Gonzalez-Abril, L., Angulo, C., Velasco, F. andCatala, A. (2005). Unified dual for bi-class SVM approaches, Pattern Recognition
38: 1772–1774.
Gonzalez-Abril, L., Angulo, C., Velasco, F. andCatala, A. (2006). Dual unification of bi-class support vector machine formulations,Pattern Recognition 39: 1325–1332.
Gonzalez-Abril, L., Angulo, C., Velasco, F. andOrtega, J. A. (2008). A note on the biasin SVMs for multiclassification, IEEE Trans.
Neural Netw. 19: 723–725.
Anais do XX Congresso Brasileiro de Automática Belo Horizonte, MG, 20 a 24 de Setembro de 2014
1086
Figure 2: Profiles of a patient with septic shock using standard SVM-Poly, SVM-1-Poly and SVM-2-Poly,respectively.
12:00 AM 12:00 AM 12:00 AM
50
100
150
200
250
Time [Hours]
SVM Patient with septic shock
Glu
cose
leve
l [m
g/dL
]
RTCGMS Valid Measurement RTCGMS Invalid Measurement ABG tneg tpos fneg
12:00 AM 12:00 AM 12:00 AM60
80
100
120
140
160
180
200
220
240
260
Time [Hours]
Glu
cose
leve
l [m
g/dL
]
SVM−1 Patient with septic shock
RTCGMS Valid Measurement RTCGMS Invalid Measurement ABG tneg tpos fpos fneg
ABG = 109 mg/dLRTCGMS = 178 mg/dL
ABG = 74 mg/dLRTCGMS = 90 mg/dL
ABG = 131 mg/dLRTCGMS = 180 mg/dL
ABG = 145 mg/dLRTCGMS = 245 mg/dL
ABG = 63 mg/dLRTCGMS = 81 mg/dL
12:00 AM 12:00 AM 12:00 AM60
80
100
120
140
160
180
200
220
240
260
Time [Hours]
Glu
cose
leve
l [m
g/dL
]
SVM−2 Patient with septic shock
RTCGMS Valid Measurement RTCGMS Invalid Measurement ABG tneg tpos fpos fneg
Gonzalez-Abril, L., Nunez, H., Angulo, C. and Ve-lasco, F. (2014). Gsvm: An svm for handlingimbalanced accuracy between classes inbi-classification problems, Applied Soft Comput-
ing 17: 23–31.
He, H. and Garcia, E. A. (2009). Learning fromimbalanced data, IEEE Trans. Know. and
Data Eng 21: 1263–1284.
ISO (2003). International organization for stan-dardization. in vitro diagnostic test systemsrequirements for blood-glucose monitoringsystems for self-testing in managing diabetesmellitus. iso 15197.
Leal, Y., Ruiz, M., Lorencio, C., Bondia, J., Mu-jica, L. and Vehı, J. (2013). Principal compo-nent analysis in combination with case-basedreasoning for detecting therapeutically cor-rect and incorrect measurements in continu-ous glucose monitoring systems., Biomedical
Signal Processing and Control 8(6): 603–614.
Lorencio, C., Leal, Y., Bonet, A., Bondia, J.,Palerm, C. C., Tache, A., Sirvent, J.-M. andVehı, J. (2012). Real-time continuous glucosemonitoring in an intensive care unit: Better
accuracy in patients with septic shock, Dia-
betes Technol Ther 14: 568–575.
Luijf, Y., Mader, J., Doll, W., Pieber, T., Far-ret, A., Place, J., Renard, E., Bruttomesso,D., Filippi, A., Avogaro, A., Arnolds, S., Be-nesch, C., Heinemann, L. and Devries, J.(2013). Accuracy and reliability of contin-uous glucose monitoring systems: A head-to-head comparison., Diabetes Technol Ther
15: 722–727.
Signal, M., Le Compte, A., Harris, D., Weston,P., Harding, J. and Chase, J. (2012). Usingstochastic modelling to identify unusual con-tinuous glucose monitor measurements andbehaviour, in newborn infants, BioMedical
Engineering OnLine 11: doi:10.1186/1475–925X–11–45.
Vapnik, V. (1998). Statistical Learning Theory,John Wiley & Sons, New York.
Ward, W. K., Casey, H. M., Quinn, M. J., Fed-eriuk, I. F. and Wood, M. D. (2004). A fullyimplantable subcutaneous glucose sensor ar-ray: Enhanced accuracy from multiple sens-ing units and a median-based algorithm, Di-
abetes Technol Ther 5: 943–952.
Anais do XX Congresso Brasileiro de Automática Belo Horizonte, MG, 20 a 24 de Setembro de 2014
1087