APPLYING SCIENTIFIC CONSIDERATIONS AND … · product including strength and formulation ... •...
20
CASSS CMC STRATEGY FORUM EUROPE 2017, MAY 22-24 JENNIFER LIU APPLYING SCIENTIFIC CONSIDERATIONS AND STATISTICAL APPROACHES IN ANALYTICAL SIMILARITY ASSESSMENT
Transcript of APPLYING SCIENTIFIC CONSIDERATIONS AND … · product including strength and formulation ... •...

CASSS CMC STRATEGY FORUM EUROPE 2017, MAY 22-24JENNIFER LIU
APPLYING SCIENTIFIC CONSIDERATIONS AND STATISTICAL APPROACHES IN ANALYTICAL SIMILARITY ASSESSMENT

2 Amgen Proprietary—For Internal Use Only
BIOSIMILAR DEVELOPMENT BEGINS WITH THOROUGH KNOWLEDGE OF THE REFERENCE PRODUCT
Reference product
knowledge
Define critical quality
attributes
Establish Biosimilar’s
QTPP ranges
Refine QTPP as knowledge
increases
• Based on known mechanism of actions, safety and efficacy profiles
• Based on knowledge for the same class of molecules
• Characterize reference product for attribute profiles
• Establish QTPP based on reference product profiles
• Increase reference product knowledge over time with more lots
• Understand impact of attributes to bioactivity, pharmacokinetics, safety and immunogenicity
• Determine critical quality attributes to risk rank attributes
Clinical safety and efficacy
Human PK and PD
Nonclinical PK/PD and toxicology as appropriate
Match biological functions and pharmacological properties
Demonstrate analytical similarity

3 Amgen Proprietary—For Internal Use Only
COMPREHENSIVE ANALYTICAL SIMILARITY ASSESSMENT IS THE FOUNDATION FOR APPROVABLE BIOSIMILARS
Impurities from host cellsand downstream process
Amino acid sequence and post-translational modifications, eg. glycans
Secondary, tertiary, and quaternary structure
Subvisible, submicron particles and aggregates
of various sizes
Quantitative levels of product variants and their identities
Degradation profiles denoting stability
Properties of the finished drug product including strength and
formulation attributes
Target binding and immunochemical
properties
Liu, BioDrugs (2016)
Stability
Primary structure
Biological function
Particles and
aggregates
General properties
and excipients
Process-related
impurities
Higher order structure
Product-related substances and
impurities
4 Amgen Proprietary—For Internal Use Only
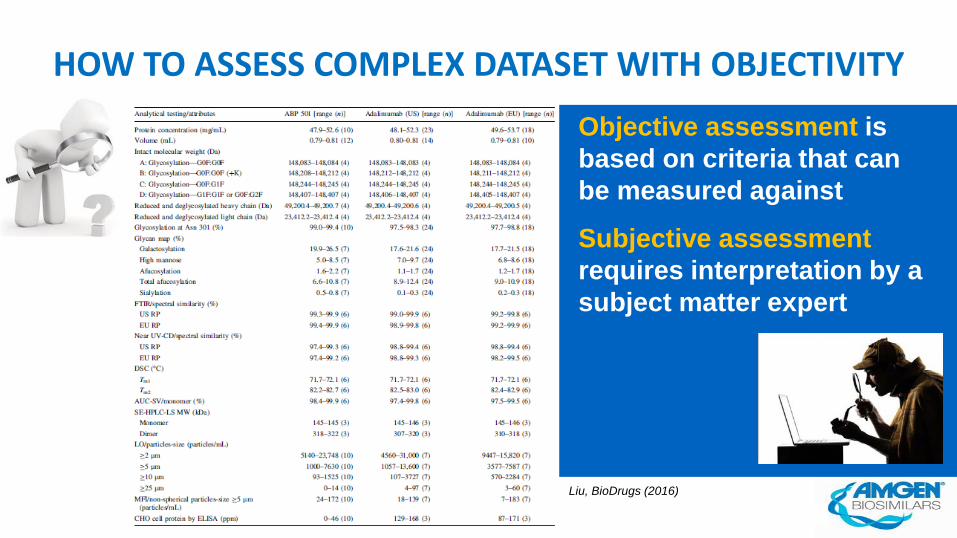
Objective assessment is based on criteria that can be measured against
Subjective assessment requires interpretation by a subject matter expert
HOW TO ASSESS COMPLEX DATASET WITH OBJECTIVITY
Liu, BioDrugs (2016)

5 Amgen Proprietary—For Internal Use Only
• Quantitative results from reference product lots• Qualitative (profile) comparison with reference product side-by-side
Reference product data dependent
• Based on theoretical values of the reference product (chemical formula)• Consider reference product label information
Reference product attribute knowledge
• Stability trends of each product should be part of the assessment• Material ages at testing need to be considered
Stability-indicating product attributes
• Attributes and methods unique to individual manufacturing process• Attributes important for safety and routinely controlled by specifications
Manufacturing process controls in place
SCIENTIFIC CONSIDERATIONS FOR ASSESSMENT CRITERIA

6 Amgen Proprietary—For Internal Use Only
Factors considered for assessment criteria
Reference product data dependent
Reference product attribute knowledge
Stability-indicating product attributes
Manufacturing process controls in place
Approaches to establish assessment criteria
Statistically derived
Scientifically justified (non-statistical)
Qualitatively compared(Visual)
STATISTICAL COMPARISON MAY INCREASE OBJECTIVITY IN SIMILARITY ASSESSMENT
Objectivity
Subjectivity

7 Amgen Proprietary—For Internal Use Only
COMPARISON OF EMA AND FDA EXPECTATIONS FOR USE OF STATISTICS IN ANALYTICAL SIMILARITY ASSESSMENT
EURanges should be based primarily on the measured quality attribute ranges of the reference medicinal product and should not be wider than the range of variability of the representative reference medicinal product batches, unless otherwise justified.
A descriptive statistical approach to establish ranges for quality attributes could be used, if appropriately justified.
EMA/CHMP/BWP/247713/2012 Committee for Medicinal Products for Human Use (CHMP) Guideline on similar biological medicinal products containing biotechnology-derived proteins as active substance: quality issues (revision 1)
US Recommends a three-tier system with statistical assessments, where appropriate
1. Equivalence testing for some high risk attributes Based on 90% confidence interval for the difference in means of the biosimilar and RP being within 1.5 standard deviation based on the reference product
2. Quality ranges (mean ± X SD) for other high to low risk attributes, with >90% of the biosimilar lots falling with the quality range
3. Raw/graphical comparisons for other attributes
FDA presentation for ODAC meeting (Jan 2015)
8 Amgen Proprietary—For Internal Use Only
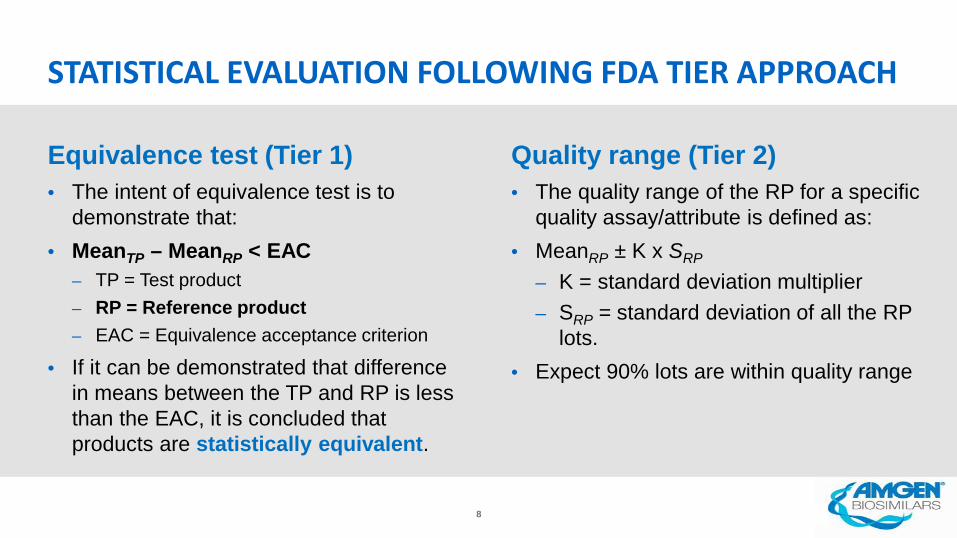
Quality range (Tier 2)• The quality range of the RP for a specific
quality assay/attribute is defined as:• MeanRP ± K x SRP
– K = standard deviation multiplier – SRP = standard deviation of all the RP
lots.• Expect 90% lots are within quality range
STATISTICAL EVALUATION FOLLOWING FDA TIER APPROACH
Equivalence test (Tier 1)• The intent of equivalence test is to
demonstrate that: • MeanTP – MeanRP < EAC
– TP = Test product– RP = Reference product– EAC = Equivalence acceptance criterion
• If it can be demonstrated that difference in means between the TP and RP is less than the EAC, it is concluded that products are statistically equivalent.

9 Amgen Proprietary—For Internal Use Only
Power of the equivalence test depends on number of lots
EAC = 1.5 times the standard deviation of the reference product lots tested
EQUIVALENCE TEST CONFIRMS VISUAL (MIN-MAX) TESTEU Min -Max US Min -Max
Number of lots Assigned Power
10 85%
15 90%
25 95%ABP vs EU EU vs US ABP vs US
EAC
- EAC
Circle represent the difference between the means. Vertical bar represents the 90% 2-sided confidence interval
Yi Tsong, Journal of Biopharmaceutical Statistics (2017)

10 Amgen Proprietary—For Internal Use Only
Quality Range = mean ± 3 times standard deviation of the reference product lots
QR may underestimate RP variability• DP lots from same DS lot• Impossible to sample all
lots to cover RP clinical experience
Expect 90% lots fall within the quality range
ABP vs EU EU vs US ABP vs US
EU Min -Max US Min -Max
QUALITY RANGE CONFIRMS VISUAL (MIN-MAX) TEST
11 Amgen Proprietary—For Internal Use Only
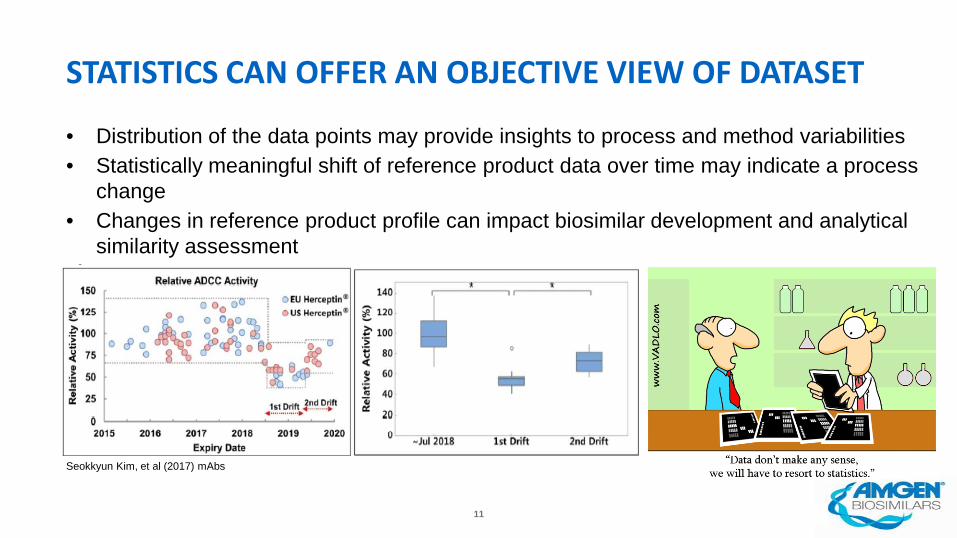
STATISTICS CAN OFFER AN OBJECTIVE VIEW OF DATASET
Seokkyun Kim, et al (2017) mAbs
• Distribution of the data points may provide insights to process and method variabilities• Statistically meaningful shift of reference product data over time may indicate a process
change• Changes in reference product profile can impact biosimilar development and analytical
similarity assessment

12 Amgen Proprietary—For Internal Use Only
A symmetrical dataset should have close mean and median values
Median may be better suited for comparison for a skewed distribution.
SELECTION OF STATISTICAL METHOD MAY BASED ON THE REFERENCE DATA DISTRIBUTION
Comparison of mean, median and mode of two distributions with different skewness. (Wikipedia)

13 Amgen Proprietary—For Internal Use Only
Incorporating proper statistical tools in the data analysis can increase confidence in the overall assessment
Sufficiently large dataset and extensive investigation may be required to identify outliers
OUTLIERS CAN INFLATE PRODUCT ATTRIBUTE RANGE
Boxplot with whiskers from minimum to maximum
100% data point(Min-Max range)
Same Boxplot with whiskers with maximum 1.5 IQR
90% data point(60% of the Min-Max range)
third quartile
first quartile
maximum
minimum
median
14 Amgen Proprietary—For Internal Use Only
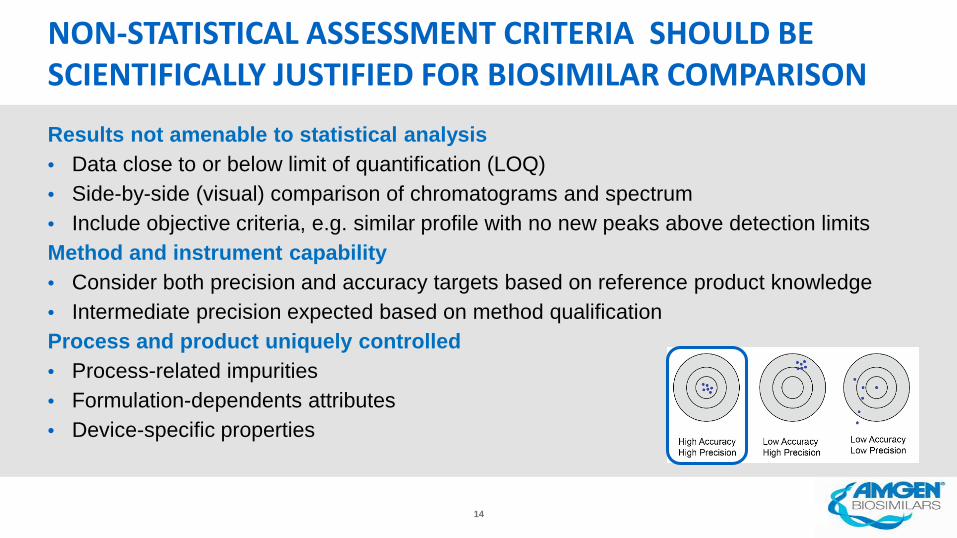
Results not amenable to statistical analysis• Data close to or below limit of quantification (LOQ)• Side-by-side (visual) comparison of chromatograms and spectrum • Include objective criteria, e.g. similar profile with no new peaks above detection limitsMethod and instrument capability• Consider both precision and accuracy targets based on reference product knowledge• Intermediate precision expected based on method qualificationProcess and product uniquely controlled• Process-related impurities• Formulation-dependents attributes • Device-specific properties
NON-STATISTICAL ASSESSMENT CRITERIA SHOULD BE SCIENTIFICALLY JUSTIFIED FOR BIOSIMILAR COMPARISON

15 Amgen Proprietary—For Internal Use Only
Qualitative criteria for profile comparison: No new peak or absence of major peaks compared to reference product
Scientific criteria for intact molecular weight: Conform to theoretical value within instrument precision
EXAMPLES OF NON-STATISTICAL CRITERIA
Peak Label: A B C D E
Glycosylation: A2G0F:A2G0F A2G0F:A2G0F+K* A2G0F:A2G1F A2G1F:A2G1FA2G0F:A2G2F A2G1F:A2G2F
Theoretical Mass (Da): 148080.6 148208.7 148242.7 148404.8 148567.0
Assessment Criterion (ppm): ± 50 ± 50 ± 50 ± 50 ± 50
Lot
EU 17 14 13 9 ND
ABP 19 15 18 15 11
US 20 23 14 16 ND
0.20.40.60.8
1
0.20.40.60.8
1
0.20.40.60.8
1
D l t d M (D )147800 148000 148200 148400 148600
A
B DC
E
x10 2
x10 2
x10 2
Co
unts
Deconvoluted Mass (Da)
AC
D EB
EU
ABP
USLiu, BioDrugs (2016)
16 Amgen Proprietary—For Internal Use Only
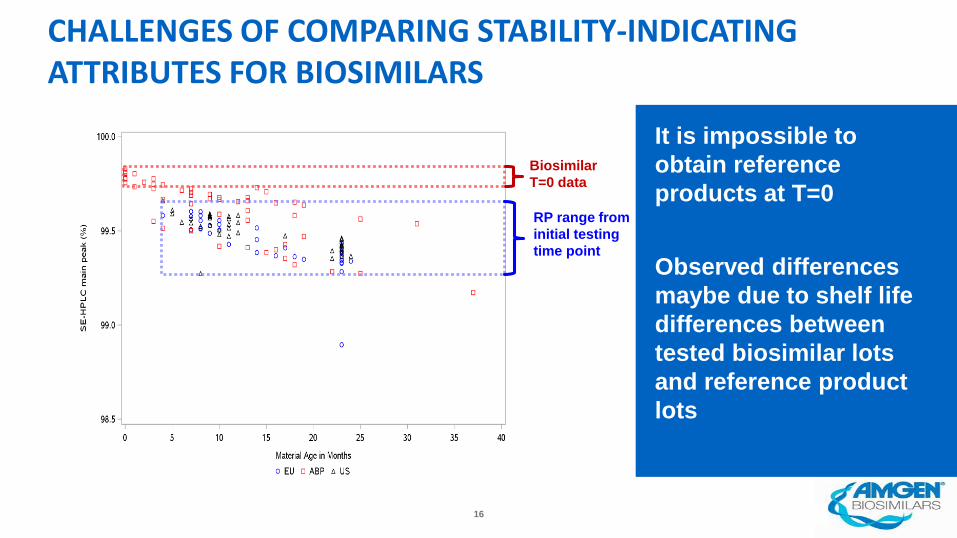
It is impossible to obtain reference products at T=0
Observed differences maybe due to shelf life differences between tested biosimilar lots and reference product lots
CHALLENGES OF COMPARING STABILITY-INDICATING ATTRIBUTES FOR BIOSIMILARS
RP range from initial testing time point
Biosimilar T=0 data
17 Amgen Proprietary—For Internal Use Only
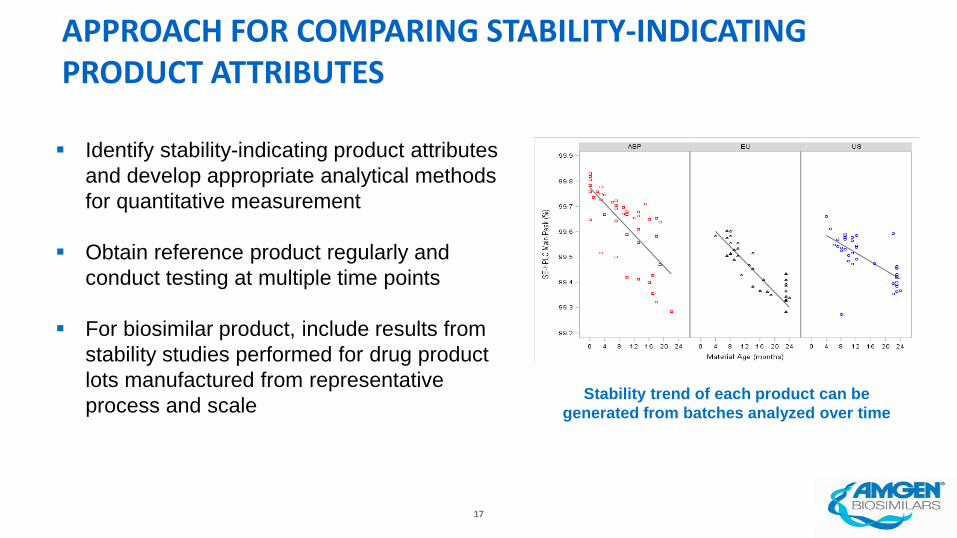
APPROACH FOR COMPARING STABILITY-INDICATING PRODUCT ATTRIBUTES
Identify stability-indicating product attributes and develop appropriate analytical methods for quantitative measurement
Obtain reference product regularly and conduct testing at multiple time points
For biosimilar product, include results from stability studies performed for drug product lots manufactured from representative process and scale Stability trend of each product can be
generated from batches analyzed over time

18 Amgen Proprietary—For Internal Use Only
STATISTICS HELP NORMALIZE DATA TO THE SAME TIMEPOINT
Comparing biosimilar T=0 to
RP first timepoints
Comparing biosimilar EoSto
RP EoS
Comparisons performed at end of shelf life represent worse case of both biosimilar and reference product
T= EoST=0
Overlapping age
19 Amgen Proprietary—For Internal Use Only
SUMMARY
• Incorporating statistical tools in analytical similarity assessment can increase objectivity and confidence for the overall conclusion
• Selection of the appropriate statistical method for assessment should consider both product attribute and the data size and distribution
• Non-statistical criteria can be scientifically justified and should consider product knowledge and method capability
• Stability-indicating product attributes need to normalize to the same material age for meaningful comparisons
science statistics

20 Amgen Proprietary—For Internal Use Only
ACKNOWLEDGEMENT
Jose Ramirez
Brad Jordan
Simon Hotchin