Applying Network Analysis for Insights into the ... Network Analysis for Insights into the...
24
Robert Cross and Deborah Zehner 2008 Applying Network Analysis for Insights into the Decentralization Strategy at the International Finance Corporation
Transcript of Applying Network Analysis for Insights into the ... Network Analysis for Insights into the...

Robert Cross and Deborah Zehner2008
Applying Network Analysis for Insights into the Decentralization Strategy at the International Finance Corporation

Page 2© 2008 The Network Roundtable LLC
Agenda
• About the International Finance Corporation• Situation Overview• Opportunity Areas
– Improve Information Flow in the Network– Build Connectivity Across Silos and Reduce Overload– Identify Experts and “Go-To” People– Develop Personal Networks
• Specific Recommendations• Questions Raised as Decentralization Begins• Appendix
– Why Network Analysis is Important– How to Interpret a Network Diagram– Key SNA Terms
Note: The initials of all people cited in this document are disguised.

Page 3© 2008 The Network Roundtable LLC
About the International Finance Corporation (IFC): Reducing Poverty, Improving Lives
• The IFC, a member of the World Bank Group, was created in 1956, representing the first step by the global community to foster private sector investment in developing nations.
• IFC’s vision is that poor people have the opportunity to escape poverty and improve their lives.
• IFC provides loans, equity, structured finance and risk management products as well as advisory services to promote sustainable private sector development in developing countries.
• IFC has over 3,100 staff, of whom 51% work in field offices and 49% at headquarters in Washington, D.C.
• Sustainability is at the core of IFC’s strategy and environmental and social expertise are a key differentiator for the organization.

Page 4© 2008 The Network Roundtable LLC
The IFC’s Environmental and Social Development Department (CES) Applied Organizational Network Analysis to Help
Develop Their Decentralization Strategy
Project Objectives for the Environmental and Social Development Department (CES)
Provide baseline data against which to monitor the impact of the decentralization process. Map current network flows/communities that will need to be maintained regardless of geographical location of staff.Identify key experts and connectors that need to be provided with special support to maintain their influencing role. Provide insights to structure KM incentives.Identify potential information blockages and strategies to improve connectivity.Recommend knowledge management priority areas.
ContextThe IFC is currently undergoing a process of decentralization which will see a progressive delegation of responsibilities to regional hubs.

Page 5© 2008 The Network Roundtable LLC
Build Connectivity Across Silos &
Reduce Overload
Develop Personal Networks
Identify Experts and
“Go-To” People
Our Analysis Suggested Four Opportunity Areas (examples of major findings with each area are included)
Build awareness of expertise at the right junctures- On average people are not aware of 48 others.
Improve network balance - Network measures reveal one of the most connected networks examined to date.
Address fragmentation and improve cross- unit ties- People in hierarchical levels 2 and 3 are the least known and sought out. - People are not well established until after three years.- Awareness of regional expertise is low.
Identify experts and “go-to” people, areas where expertise should be better balanced, and areas where it is unclear.- In several cases there is just one, sometimes two clear experts. In several others areas (particularly the regions) it is unclear who to turn to for information.
Improve personal networks- Compared to other analyses, people rely more heavily on external relationships (although almost one-third are with WBG).
- Reliance on clients and regional facilities in personal networks is low.• People rely heavily on peers or those higher in the hierarchy and not those below them.
Improve Information
Flow In Network

Page 6© 2008 The Network Roundtable LLC
Information Flow: There are many effective information relationships, however the number varies greatly (from 2-97 relationships per person).
= UNIT A= UNIT B
Unit
= UNIT C= UNIT D
Somewhat Effec & Effec
Effective
Density 36.2% 25.3%
Cohesion 1.7 1.8
Avg. Centrality
47(SD=21.4)
33(SD=18.1)
Network Measures
Those in the middle have the highest
number of effective relationships. The most central people are from Unit B within at the HQ
location.
Awareness of people on the outer edge is low. Most of these people
have been with the IFC for less than 3 years.
Zooming in on roles within Unit B shows the central role played by officers (yellow nodes).
Network measures remain unusually strong when targeting “Effective” information sharing relationships
compared to “Somewhat Effective” ones. (See appendix for network definitions.)
Question: Please indicate the extent to which the following people are effective in providing you with info or advice. Response: Effective (timely, meaningful or relevant info)

Page 7© 2008 The Network Roundtable LLC
Information Flow: The leaders, experts and gatekeepers (upper right quadrant) are in critical roles.
Leaders, Experts or Gatekeepers
Niche Experts, Peripheral People
D.N.
V.C.
M.Z.R.S.
S.T.
B.A.H.G.
Information Effectiveness: Response of Effective
Tim
e Sp
ent:
Res
pons
e of
4-8
hou
rs a
mon
th o
r mor
e
A.M.
The people in the upper right-hand quadrant are in key positions. To reduce overload and vulnerability to their departure consider:
• Re-allocating information access and decision rights;
• Using staffing or internal projects to help train others to fill portions of their role;
• Using exit interviews to define key relationships that must be replaced (both external and internal ties) should one of these people leave.
Hierarchical LevelLevel 1Level 2Level 3Level 4
Higher

Page 8© 2008 The Network Roundtable LLC
Information Flow: Removing the 10% most central people who effectively collaborate reduces the number of relationships by a disproportionate 20%.
Question: Please indicate the extent to which the following people are effective in providing you with info or advice. Response: Effective (timely, meaningful or relevant info)
0%
10%
20%
30%
40%
50%
60%
70%
80%
% People Removed
% D
ecre
ase
in #
of
Rel
atio
nshi
ps
% Decrease in Ties 0% 12.2% 20.2% 28.8% 36.5% 42.8% 49.6% 56.1% 61.3% 66.9% 72.2%
% People Removed 0% 5% 10% 15% 20% 25% 30% 35% 40% 45% 50%
1 2 3 4 5 6 7 8 9 10 11
The impact of removing the central people is not as high within this network as other
networks we’ve studied, due its high number of connections
overall.

Page 9© 2008 The Network Roundtable LLC
Information Flow: The aggregate personal network data depicts the tendency for people, except the most senior level, to rely on people
higher in the hierarchy.
0%
10%
20%
30%
40%
50%
60%
Higher-Supervisor
Higher-Otherthan
Supervisor
Equal to mine Lower thanmine
Does notapply
GA-GDGE-GFGGGH and above
Aggregate Personal Network Responses by Hierarchy
Please indicate each person’s hierarchical level relative to your own – by level
Hierarchical Level
Level 1Level 2Level 3Level 4

Page 10© 2008 The Network Roundtable LLC
Brokers Removed
Question: Please indicate the extent to which the following people are effective in providing you with info or advice. Response: Somewhat Effective (somewhat timely, meaningful or relevant info) or Effective (timely, meaningful or relevant info)
Build Connectivity: Brokers are high-leverage employees who connect people across boundaries, such as functions, and geography. They are
extremely effective when driving change or innovation.
Removing the top 5% of brokers decreases the number of cross-unit ties by 27%.
These 7 brokers represent the top 5% of brokers within this IFC group.
With Brokers
= UNIT B= UNIT C= UNIT D
Unit= UNIT A

Page 11© 2008 The Network Roundtable LLC
Build Connectivity: Brokers within this particular hierarchical level can influence changes and connect the more peripheral employees.
= UNIT A= UNIT B
Unit
= UNIT C= UNIT D
Question: Please indicate the extent to which the following people are effective in providing you with info or advice. Response: Effective (timely, meaningful or relevant info)
ConnectorLevis 1Watson 2Capone 3Eskin 4King 5Robbins 6Sackman 7Sheehy 8
BrokerCapone 1Sackman 2Feeney 3Watson 4Giampalmi 5King 6Hing 7Gladish 8
Density 23%
Cohesion 1.9
Avg. Centrality
11.2(SD=6.4)
Network Measures
Top 5 Brokers• A.M.• C.D. • E.G. • H.G. • R.I.
By connecting a peripheral person such as this one to a broker responsible for mentoring their relationships, the
peripheral person’s network will grow dramatically.
Page 12© 2008 The Network Roundtable LLC
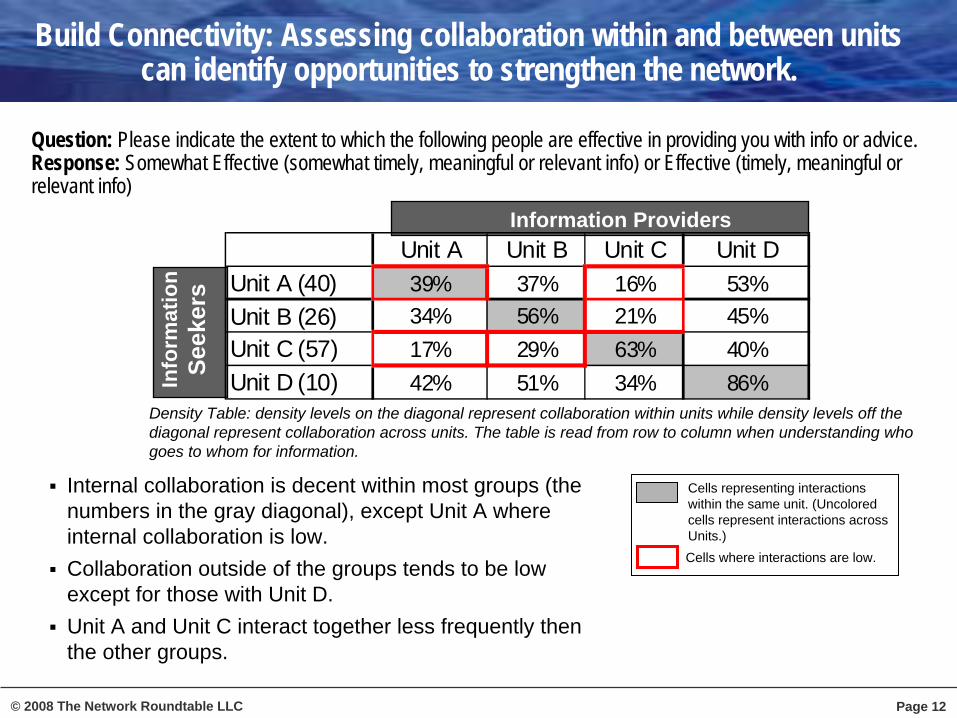
Build Connectivity: Assessing collaboration within and between units can identify opportunities to strengthen the network.
Internal collaboration is decent within most groups (the numbers in the gray diagonal), except Unit A where internal collaboration is low.Collaboration outside of the groups tends to be low except for those with Unit D. Unit A and Unit C interact together less frequently then the other groups.
Information Providers
Info
rmat
ion
Seek
ers
Question: Please indicate the extent to which the following people are effective in providing you with info or advice. Response: Somewhat Effective (somewhat timely, meaningful or relevant info) or Effective (timely, meaningful or relevant info)
Density Table: density levels on the diagonal represent collaboration within units while density levels off the diagonal represent collaboration across units. The table is read from row to column when understanding who goes to whom for information.
Cells representing interactions within the same unit. (Uncolored cells represent interactions across Units.) Cells where interactions are low.
Unit A Unit B Unit C Unit DUnit A (40) 39% 37% 16% 53%Unit B (26) 34% 56% 21% 45%Unit C (57) 17% 29% 63% 40%Unit D (10) 42% 51% 34% 86%

Page 13© 2008 The Network Roundtable LLC
Sectors Technical Areas
46
2117
3217
111
Experts: A summary of responses to questions on experts reveals that in most cases, expertise resides in one or two people only. However, there
are many areas where people don’t know who to seek out.
UNIT C
In addition to ensuring expertise is balanced, it is important for people to have a means of identifying the right “go-to” person (particularly for newcomers).
UNIT A
54%35%
12%
5%
19%
43%
33%
40% 60%43%
29%
19%
10%
Sectors Technical Areas
I do not knowOne clear expert1
Two expertsMore than two experts
1 Where at least 50% of people turned to one person for expertise in this area and where fewer than 20% of people turned to a second person.
Question: Please identify the primary person within CES that you have or would seek out for information in each respective area. (An example of a sector is Chemicals or Financial Markets; an example of a technical area is Carbon Finance or Fundraising.)

Page 14© 2008 The Network Roundtable LLC
Experts: Drilling Down on “Go-To” People Within Unit C *The top two or sometimes three selections are shown here.
In some cases, such as Agribusiness: Animal Production, there are two people who are clearly
known experts.
However, in the majority of cases, such as Transport and Logistics Infrastructure, people
only know of one expert.
Who to turn to for work information isn’t as clear in the General Manufacturing:
Light Industries area.
Agribusiness: Animal ProductionPerson # SelectedP.R. 24H.S. 22I DO NOT KNOW who I would seek out. 3
Transport and Logistics InfrastructurePerson # SelectedA.D. 33J.C. 7
General Mnftg (light industries): CeramicPerson # SelectedR.G. 30E.V. 10
General Mnftg (light industries): ElectronicsPerson # SelectedR.G. 31I DO NOT KNOW 10
General Mnftg (light industries): Glass MnftgPerson # SelectedR.G. 33I DO NOT KNOW 9
General Mnftg (light industries): PrintingPerson # SelectedR.G. 31I DO NOT KNOW 12
General Mnftg (light industries): TextilesPerson # SelectedV.Q. 24I DO NOT KNOW 10

Page 15© 2008 The Network Roundtable LLC
Personal Networks: Characteristics of personal networks can be examined for higher performance.
High Performers (i.e., top 20%) Have Non-Insular Networks:
• Select ties up in the hierarchy (to your boss and others) provides a breadth of information, context, resources and political support for your initiatives.
• Lateral connections to peers within the organization are important for brainstorming and best practice transfer as these people face similar issues.
• High quality (i.e., energizing) relations to those lower in the hierarchy creates reputation and draws emerging high performers to you over time.
• Select ties to experts outside of the organization yield innovations and novel opportunities not circulating within company.
• Quality relationships with clients help ensure relevance and profitable work.
Reaching Up Provides Info and Support
Internal Peer Networks For B-Storming
Energized Subordinates Give Greater Effort and Attract High Performers
External Peer or SME Networks For Process or Product Innovation
Client (Internal or External) Ensures Satisfied and Profitable Relationships

Page 16© 2008 The Network Roundtable LLC
Personal Networks: An examination of aggregate responses shows that people balance reliance on people across several boundaries.
Of the people identified as outside of IFC, 70% are “Other” (family, friends,
etc.) or WBG.Reliance on clients is very low, but that may be due to
the nature of the work.
42%
29%
15%
3%3%7%
1%
OtherWorld Bank GroupConsultantNGOClientIFIsSupplier
0%
5%
10%
15%
20%
25%
Member ofteam
Outside team,within unit
Outside unit,within
department
Oustidedepartment,within IFC
Outside IFC
Please indicate where each of these people work
There is a good balance of relationships across
working groups and higher external connections then
people in most organizations.
Where People Reside Who are “Outside IFC”

Page 17© 2008 The Network Roundtable LLC
Personal Networks: The primary benefits people currently receive and would like to receive are information and problem-solving. Early in people’s career, they’d prefer more information and later in their career more problem solving.
0%5%
10%15%20%25%30%35%40%
Inform
ation
Acces
s to d
ecision-m
akers
Politic
al su
pport
Problem-so
lving
Career a
dvice
Person
al sup
port
Sense
of pu
rpose
Less
ons l
earne
d
GA-GDGE-GFGGGH & above
Level 1Level 2Level 3Level 4
0%5%
10%15%20%25%30%35%40%45%
Inform
ation
Acces
s to d
ecision-m
akers
Politic
al su
pport
Problem-so
lving
Career a
dvice
Person
al sup
port
Sense
of pu
rpose
Less
ons l
earne
d
GA-GDGE-GFGGGH & above
Level 1Level 2Level 3Level 4
Primary benefit that you CURRENTLY receive – by hierarchical level
Primary benefit that you WOULD LIKE to receive – by hierarchical level

Page 18© 2008 The Network Roundtable LLC
Build Connectivity Across Silos &
Reduce Overload
Develop Personal Networks
Identify Experts and
“Go-To” People
Recommendations Across the Four Opportunity Areas
Improve Information
Flow In Network
Shifts in staffing, rotations, internal committees with an eye to building connectivity across roles and locations.On-boarding which includes communicating expertise.Problem-solving and visioning sessions.Skill profiling that includes professional content for legitimacy and personal information for connections.
Leverage Brokers• Position brokers (highly
effective ambassadors) on change and/or implementation teams.
• Connect brokers with one or two peripheral people (as a mentor).
• Form communities of practice around brokers for best practice transfer.
Bridge Disconnects• Create communities of
practice at intersections.• Identify causes of lack of
collaboration by interviews on either side of fragmentation points and define ways to promote integration
Create secondary “go to” people in areas where core expertise is critical to success.Encourage use of collaborative tools and knowledge repositories.Profile expertise through the intranet, brown-bag lunches, and Webinars. Implement an exit process which assists in capturing key knowledge when experts depart.
Employ on-boarding practices which help to build out networks systematically ( structured introductions, making a newcomers expertise available to others, short rotations and smart mentoring programs).Leadership training and career development.Staffing and rotation practices. Experiential processes such as the after action review.Review individual skills to provide a sense of what skills are needed and where expertise lies.

Page 19© 2008 The Network Roundtable LLC
The Following Questions Were Raised Based on ONA Findings
How can we improve awareness of expertise across the department and the sustainability network?
• How do we reduce the lack of awareness number of 48 by half?• How do we raise awareness of expertise of staff in regional offices?• How do we capitalize on staff’s expertise prior to joining IFC?
How do we collaborate more effectively across the department and the network?
• How do we increase collaboration across units on cross-cutting issues that are corporate priorities (e.g. climate change, water)?
• How do we support the key brokers in the network, particularly as we decentralize?• How do we increase collaboration with regional facilities on common priorities?
How can we effectively on-board new hires into the department and the sustainability network?
• How do we reduce the current 3-year period it takes for a new department/network member to establish themselves to 1 year?
• How do we improve awareness of expertise across “new” and “old” staff?

Page 20© 2008 The Network Roundtable LLC
Network Analysis Has Helped to Inform the IFC’s Decentralization Strategy
As the IFC started to move towards a decentralised structure, the Environment and Social Development department decided
to investigate the implications of moving from a traditional department model to a "network". Through this network analysis project, we were able to hone in on a number of strategic areas, such as awareness of expertise, the on-
boarding of staff and cross-unit collaboration, and define priorities for action accordingly.
Network analysis was most helpful in translating the sometimes abstract concepts of collaboration and knowledge management
into concrete, measurable dimensions. The results of this process will inform the Department's strategy moving forward.
—Giulio Quaggiotto, Programme Officer, IFC

Appendix

Page 22© 2008 The Network Roundtable LLC
Where People Engage• Join and commit to
people• Trust accrues in
networks of relations
Why We Should Focus Our Attention on Organizational Networks
Where Work Happens• Lack of boundaries• Informal networks
increasingly important
BUT…• Invisible• Complements formal structure
Where Knowledge Lives• Rely on people for
information• People can provide more
than databases
Key Reasons Why Organizational Networks Are Important

Page 23© 2008 The Network Roundtable LLC
• Central People– Are an important source of expertise– May become bottlenecks
• Peripheral People– Are underutilized resources– Feel isolated from the network – Have a higher likelihood of leaving
• External Connectivity– Provides balanced and appropriate sources of
learning– Holds relevant influence with key
stakeholders
Knowledge Broker; Boundary Spanner
Peripheral Person
Central
Person
Centra
l Pers
on
• Brokers– Are critical connectors between diverse
information sources and specific kinds of expertise. High leverage points.
• Fragmentation Points– Affect information flow across boundaries (e.g.,
cross functional, hierarchical, geographical, or expertise)
– Provide targeted opportunities• Personal Connectivity
– Improves community leader effectiveness– Enables grass roots network development efforts
Fragmentation Point
How to Interpret a Network Diagram

Page 24© 2008 The Network Roundtable LLC
Key SNA Terms—Quantitative Metrics
Centrality: Identifies influential people (individual measure)• Number of direct connections (ties) that individuals have with others in the group.• Bottom Line: Individuals with more ties to others may be in more advantaged
positions and may have access to more of the information or knowledge in the network.
Density: Robustness of network (group measure)• Number of connections that exist in the group out of 100% possible in that network.• Bottom Line: More points connected means quicker and more accurate
information flow.
Cohesion (Distance): Ease with which a network can connect• Shows average distance for people to get to all other people. • Bottom Line: Shorter distances mean faster, more certain, more accurate
transmission/ sharing.