
Applying MW Scale Energy Storage Solutions for Continuous ...
48
John Wood Applying MW Scale Energy Storage Solutions for Continuous Variability Management
Transcript of Applying MW Scale Energy Storage Solutions for Continuous ...

John Wood
Applying MW Scale Energy Storage Solutions for Continuous Variability Management

RETURN

Separator
PbPbO2
Lead-Acid Cell
+ -Separator
PbO2CarbonElectrode
Ultracapacitor
-+
UltraBattery® Technology
i i1i2+ -
i
UltraBattery Carbon Electrode
Pb
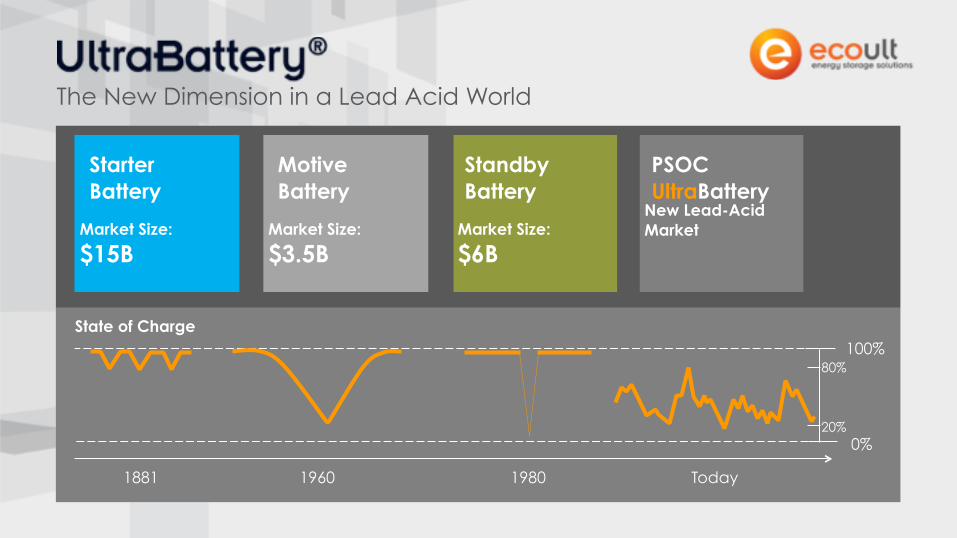
Market Size: $3.5B
Motive Battery
Market Size: $6B
Standby Battery
New Lead-Acid Market
PSOC UltraBattery
Market Size: $15B
Starter Battery
State of Charge
1881
0%
100%80%
20%
1960 1980 Today
The New Dimension in a Lead Acid World

State of Charge
The New Dimension in a Lead Acid World
High Efficiency in Partial State of Charge Use
UltraBattery®: highly efficient & high longevity
Lower Efficiency & higher rate of degradation
Lower Efficiency and higher rate of degradation.
20%
80%
93% – 95% DC to DC
100%
0%


Wind Smoothing
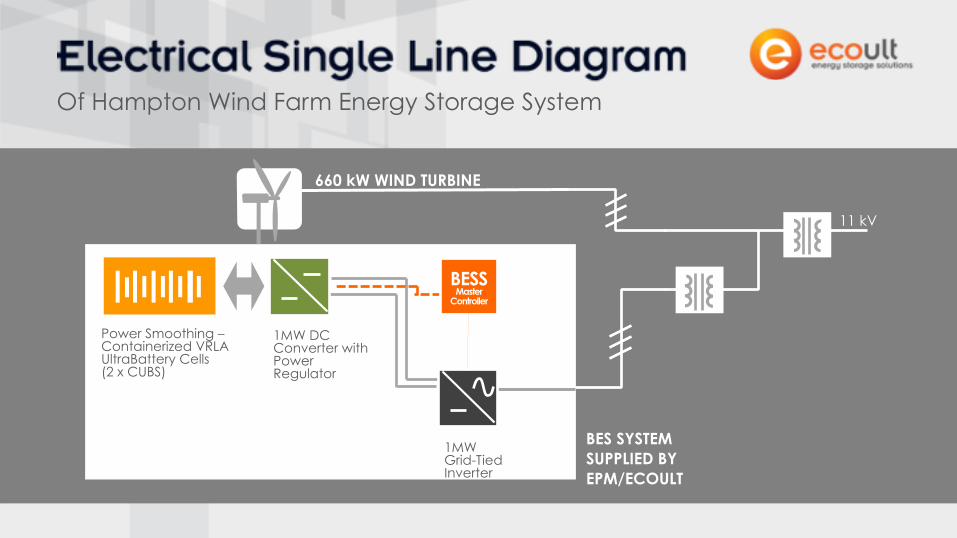
Power Smoothing –Containerized VRLA UltraBattery Cells (2 x CUBS)
1MW DC Converter with Power Regulator
1MW Grid-Tied Inverter
BESSMaster
Controller
BES SYSTEM SUPPLIED BY EPM/ECOULT
660 kW WIND TURBINE
11 kV
Of Hampton Wind Farm Energy Storage System

Of Wind Output and Ramp Rate Reduction

Solar Smoothing & Shifting/Firming

2 Clear Days & 1 Cloudy Day
4 Hour Window
15 Minute Window
PV Output
Battery Output
System Output
Cloudy Day

Clear DayBlue – PV Yellow – Battery Red – Primary Meter
Magnified
Cloudy Day - Altocumulus
Stored PV Energy
Firm PM Energy OutputFirm AM Output
Manual Shifting
Firm PM Energy Output
Automated Shifting Service Starts
Firmed PV - Clear Days Firmed PV - Cloudy Days with Simultaneous Smoothing
Refined Automated Shifting Service Starts
Stored PV Energy
PV Output
Battery Output
System Output


Typical Diesel Generator Efficiency Curve
Source: XXX

24 hours
Fuel Efficiency Curve
Load
24 hours
Fuel Efficiency Curve
Load
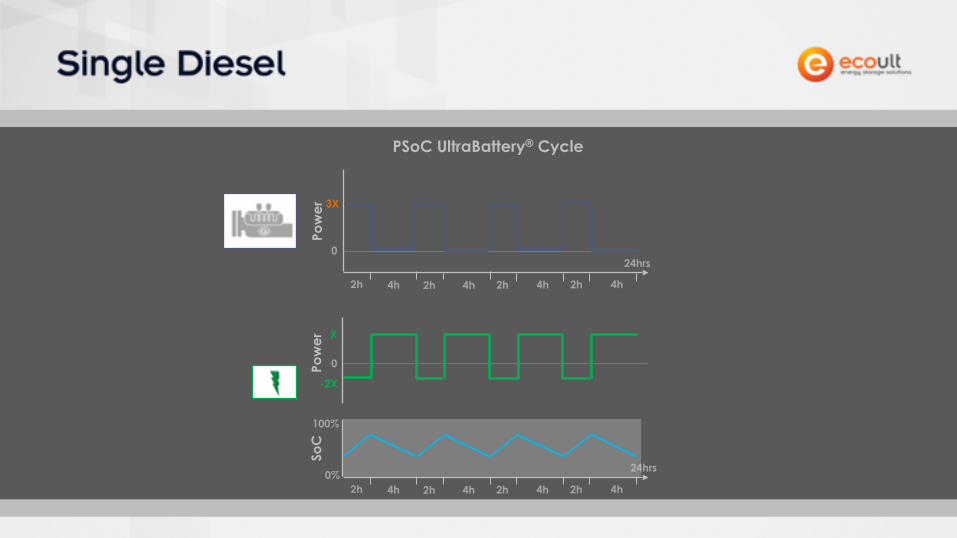
PSoC UltraBattery® Cycle
Pow
erPo
wer
0
3X
2h
24hrs
24hrs
0
X
-2X
SoC
4h 2h 4h 2h 4h 2h 4h
2h 4h 2h 4h 2h 4h 2h 4h0%
100%

24 hours
Fuel Efficiency Curve
LoadDiesel Efficiency – Using Diesel in the Efficient Band
Diesel Consumption
LCOE
CO2
PSoC Cycle
- 10% to - 50%
- 10% to – 30%
- 10% to - 50%
Diesel Longevity 2.0X

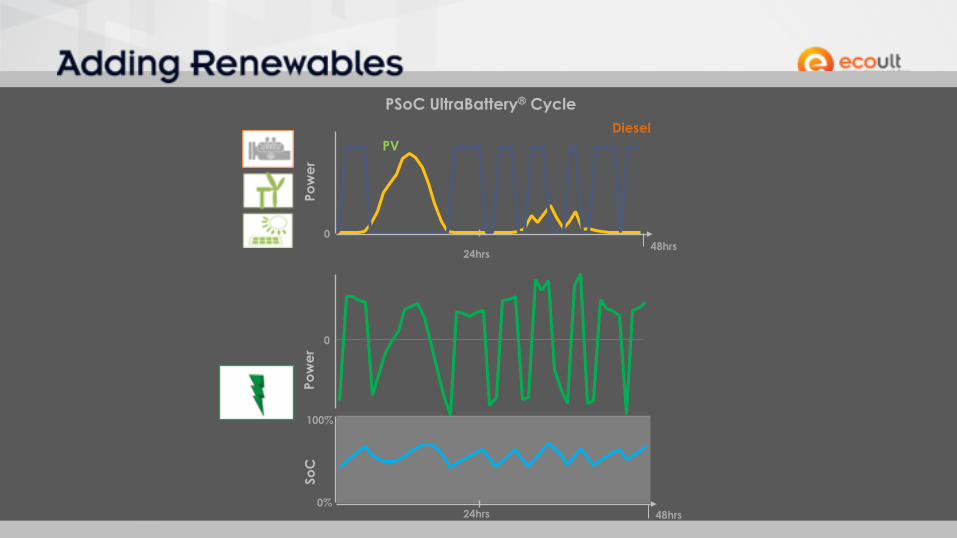
48 hours
Fuel Efficiency Curve
PVLoad
48 hours
Fuel Efficiency Curve
PVLoadPo
wer
Pow
er
048hrs
0
SoC
DieselPV
24hrs
48hrs24hrs
PSoC UltraBattery® Cycle
0%
100%

Fuel Efficiency Curve
48 hours
VRLA Cycle PSoC CyclePV
Load
Match Renewable Power
Diesel Consumption
LCOE
CO2
- 50%+
- 30%
- 50%+
Manage Renewable Variability
Diesel Longevity 2.5X
Battery Replacement 2.5X
PSoC Cycle

7 Days
Fuel Efficiency Curve
PV
Load

7 Days
Fuel Efficiency Curve
PV
Load
Pow
er
Pow
er
0
7 days
0
SoC
PSoC UltraBattery® Cycle
7 days
Gas 1
Gas 5
Total Renewable Power
0%
100%

7 Days
Fuel Efficiency Curve
PV
LoadDiesel Efficiency – Using Diesel in the Efficient Band
Diesel Consumption
LCOE
CO2
- 20%+
- 5% to – 25%
- 20%+
PSoC Cycle

Frequency Regulation
VAR Correction
Spinning Reserve

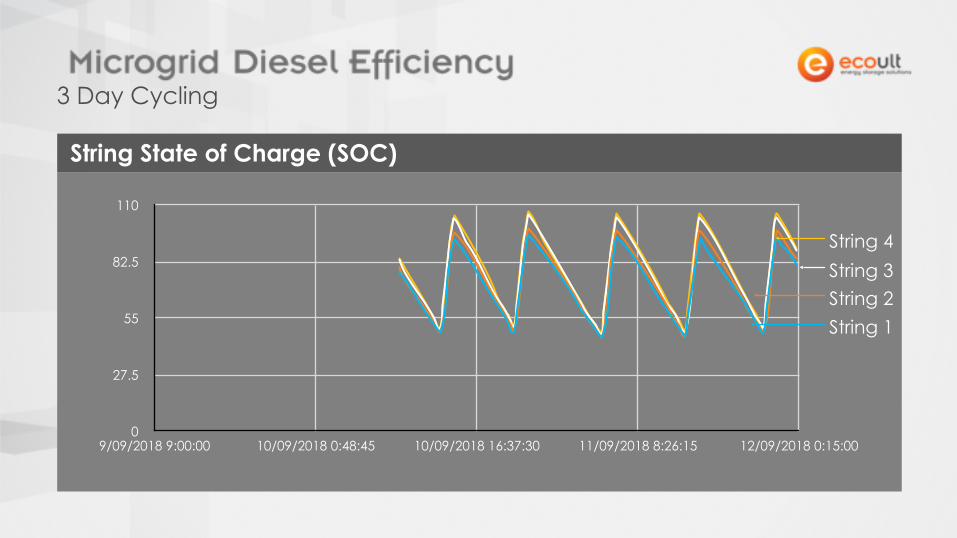
0
27.5
55
82.5
110
9/09/2018 9:00:00 10/09/2018 0:48:45 10/09/2018 16:37:30 11/09/2018 8:26:15 12/09/2018 0:15:00
String 1
3 Day Cycling
String State of Charge (SOC)
String 2String 3String 4

45
48
51
54
57
9/09/2018 9:00:00 10/09/2018 0:48:45 10/09/2018 16:37:30 11/09/2018 8:26:15 12/09/2018 0:15:00
String 1, 2, 3, 4 Voltage
3 Day Cycling
String Voltage

-50
-37.5
-25
-12.5
0
12.5
9/09/2018 9:00:00 10/09/2018 0:48:45 10/09/2018 16:37:30 11/09/2018 8:26:15 12/09/2018 0:15:00
String 1
3 Day Cycling
String Current
String 2
String 3
String 4
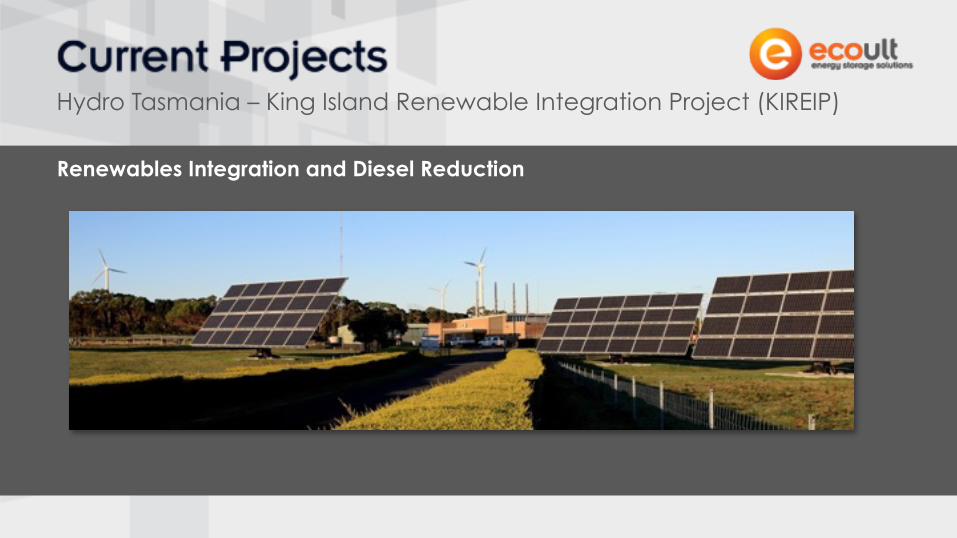
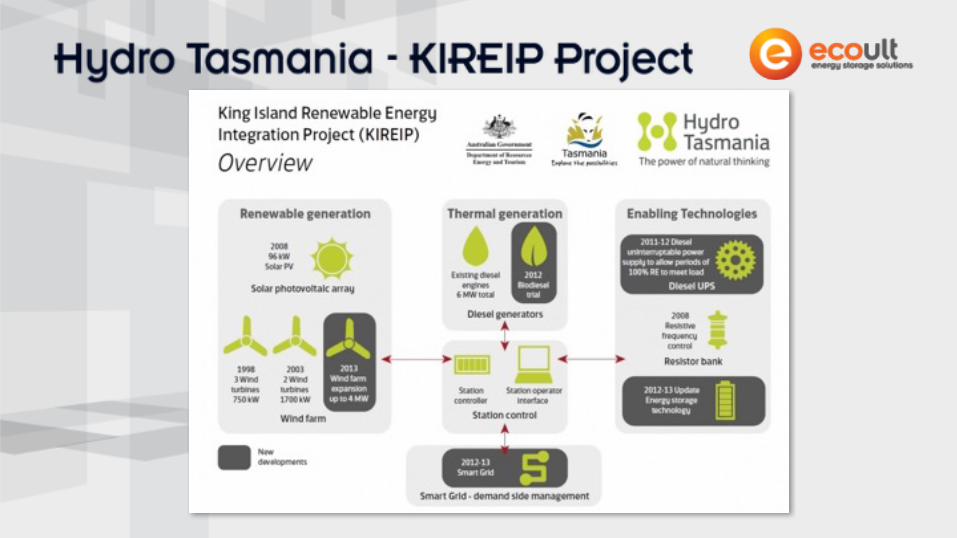
Renewables Integration and Diesel Reduction
Hydro Tasmania – King Island Renewable Integration Project (KIREIP)

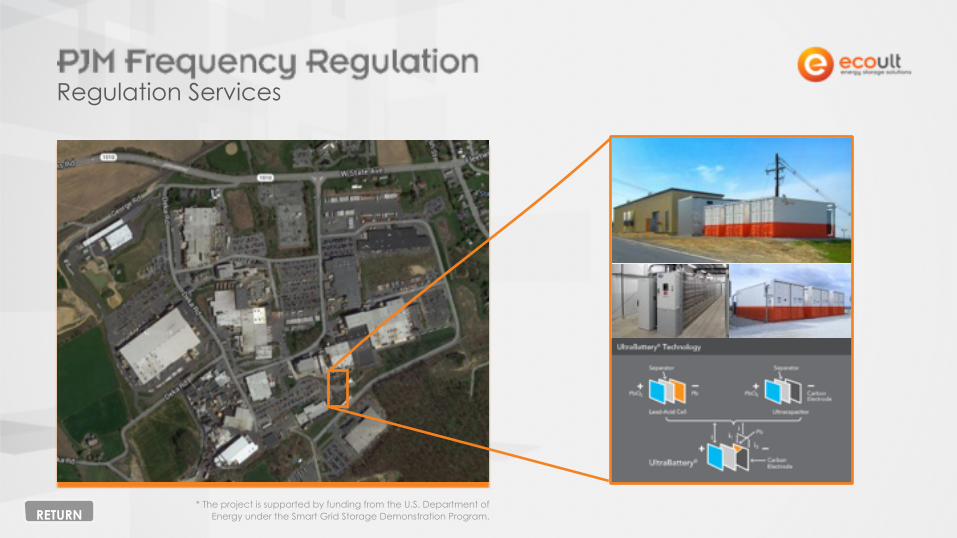
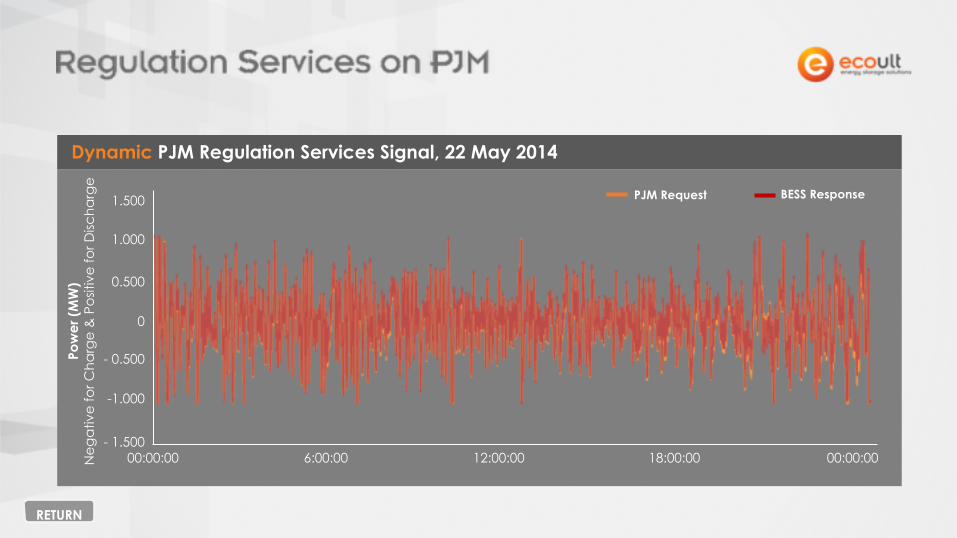
Regulation Services
* The project is supported by funding from the U.S. Department of Energy under the Smart Grid Storage Demonstration Program.RETURN
Pow
er (M
W)
Neg
ativ
e fo
r Cha
rge
& P
ositi
ve fo
r Disc
harg
e
00:00:00 6:00:00 12:00:00 18:00:00 00:00:00
1.500
1.000
0.500
0
- 0.500
-1.000
- 1.500
Dynamic PJM Regulation Services Signal, 22 May 2014
BESS ResponsePJM Request
RETURN

Dynamic Regulation
Traditional Regulation 141.7
MW
Daily Mileage
434.3MW
Daily Mileage
3.1Mileage Ratio
1.0Mileage Ratio
RETURN

00
$ 30,000.00
$ 60,000.00
$ 90,000.00
$ 120,000.00
Jul-16 Sept-16 Nov-16 Jan-17 Mar-17 May-17 Jul-17 Sept-17 Nov-17 Jan-18 Mar-18
Regulation Market Performance Clearing Price (RMPCP)
Regulation Market Capability Clearing Price (RMCCP)
Revenue of 1MW Regulation Plant Operated Continuously With 100% PJM Performance Score
PJM introduces performance payments
PJM introduces performance mileage modifier
RETURN


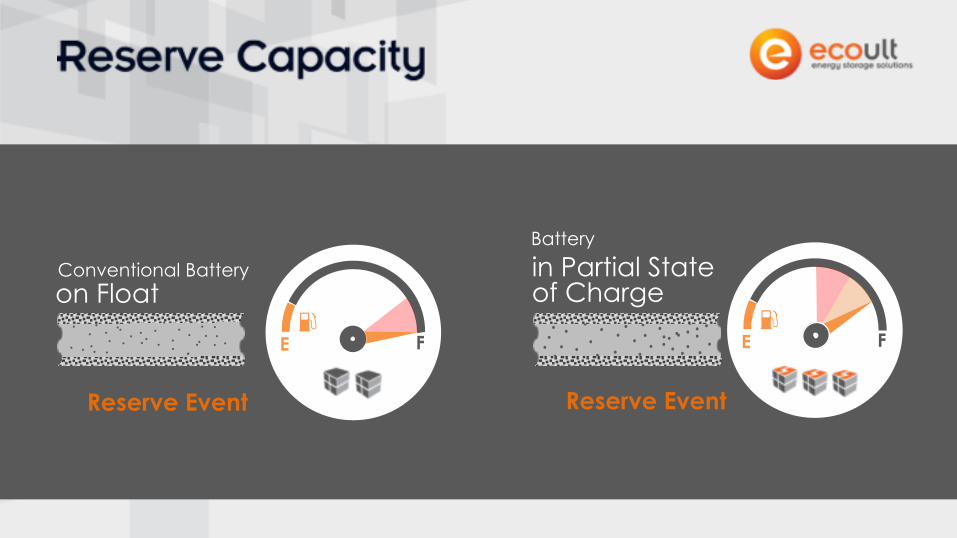
E FE F
on FloatConventional Battery in Partial State
of Charge
Battery
Reserve Event Reserve Event

Storage Facility #1:
3MWFrequency Regulation
2x Power
Regulation Services
RETURN
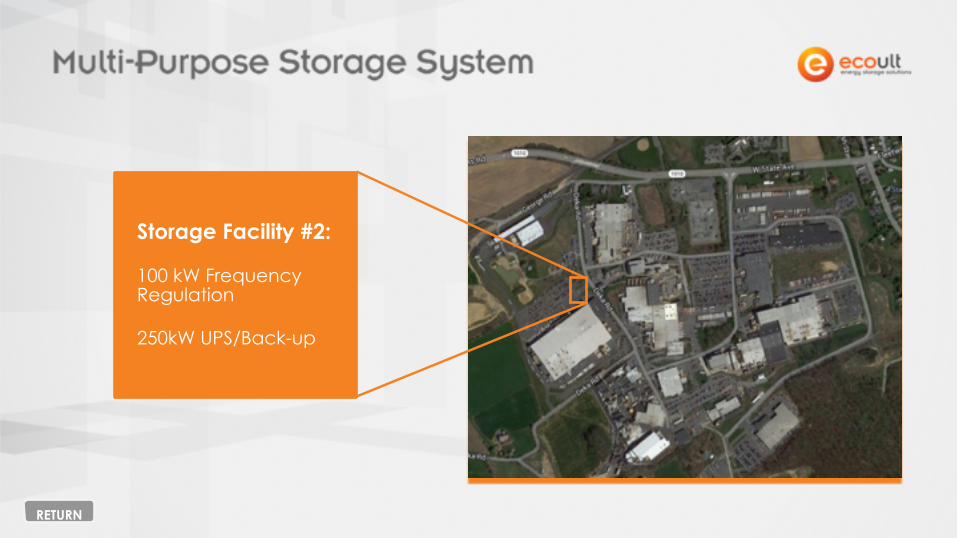
Storage Facility #2:
100 kW Frequency Regulation
250kW UPS/Back-up
RETURN

Storage Facility #3:
200 kW Frequency Regulation
200 kWh Demand Management
200 kW UPS/Back-up
RETURN

PURE REGULATION SERVICES
MULTI PURPOSE $ $ $
PJM RMCP$38MW/hr
PJM RMCP$38MW/hr
15.0%IRR
45.0%IRR
Multi Purpose vs. Regulation Service
$
Payback Initial Capital5.0years
Payback Initial Capital3.0years
RETURN

MULTI PURPOSE
Marginal cost to increase size of battery store + slightly larger footprint2IRR based on marginal cost of UltraBatteries and additional space required3
1 Infrastructure and connection costs in place
RETURN

Partners
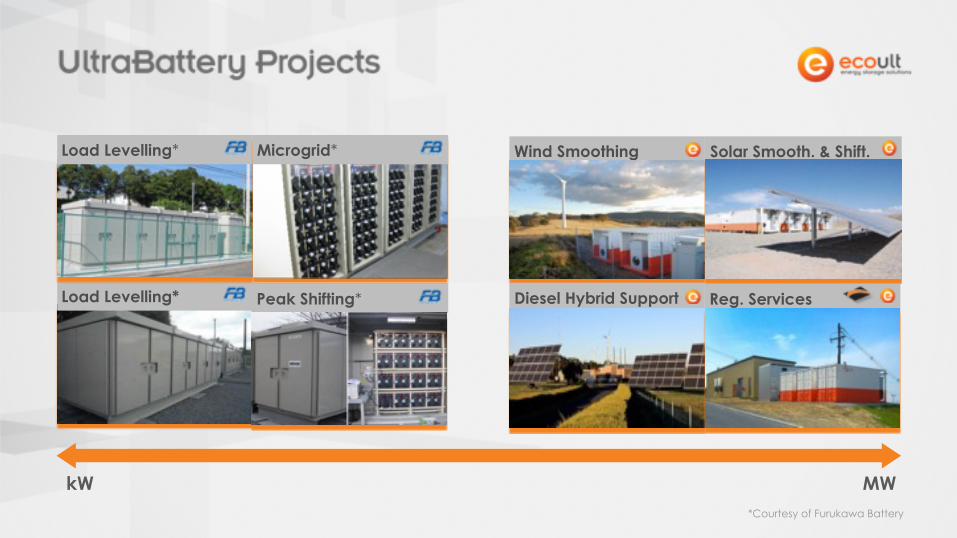
Load Levelling*
Load Levelling*
Peak Shifting*
Wind Smoothing Solar Smooth. & Shift.
Diesel Hybrid Support Reg. Services
MWkW
Microgrid*
*Courtesy of Furukawa Battery

MWkWIndoor
Outdoor

John Wood, CEOwww.ecoult.com www.ultrabattery.com

John Wood
Applying MW Scale Energy Storage Solutions for Continuous Variability Management