Applying Extended Theory of Planned Behavior to ...
90
Applying Extended Theory of Planned Behavior to Investigate Energy Drink Consumption Behavior among General Public in the United States by Yujia Wang A thesis submitted to the Graduate Faculty of Auburn University in partial fulfillment of the requirements for the Degree of Master of Science Auburn, Alabama May 7, 2016 Keywords: Energy drinks, Theory of Planned Behavior, Knowledge, Consumption Intention Copyright 2016 by Yujia Wang Approved by Yee Ming Lee, Chair, Associate Professor of Nutrition, Dietetics, and Hospitality Management David Martin, Associate Professor of Nutrition, Dietetics, and Hospitality Management Imran Rahman, Assistant Professor of Nutrition, Dietetics, and Hospitality Management
Transcript of Applying Extended Theory of Planned Behavior to ...
Applying Extended Theory of Planned Behavior to Investigate Energy Drink Consumption Behavior among General Public in the United States
by
Yujia Wang
A thesis submitted to the Graduate Faculty of Auburn University
in partial fulfillment of the requirements for the Degree of
Master of Science
Auburn, Alabama May 7, 2016
Keywords: Energy drinks, Theory of Planned Behavior, Knowledge, Consumption Intention
Copyright 2016 by Yujia Wang
Approved by
Yee Ming Lee, Chair, Associate Professor of Nutrition, Dietetics, and Hospitality Management
David Martin, Associate Professor of Nutrition, Dietetics, and Hospitality Management
Imran Rahman, Assistant Professor of Nutrition, Dietetics, and Hospitality Management
ii
Abstract
The sales of energy drinks will reach $21.5 billion in 2017. Energy drinks could boost
energy but also bring some side effects. This study explored consumers’ energy drink
consumption behavior based on extended Theory of Planned Behavior. Specific objectives were
to 1) examine current energy drinks consumption among consumers, 2) investigate consumers’
attitudes, subjective norms, perceived behavior control and knowledge about energy drinks, and
3) identify variables that influenced consumers’ energy drinks consumption intention. The
survey instrument was developed based on previous researches, pilot-tested, and revised based
on feedback received. A total of 539 usable questionnaires were collected through
Amazon Mechanical Turk. Descriptive statistics, logistic regression and one-way Analysis of
Variance were used for data analysis. The results indicated that energy drinks consumption was
more prevalent among young adults aged 21 to 40 (n=430, 79.8%) mainly to increase energy
level (n=517, 95.9%) and compensate for insufficient sleep (n=439, 81.0%). Overall, consumers
demonstrated slightly positive attitudes toward energy drinks (3.6±0.7). Friends mainly
influenced participants’ consumption of energy drinks (3.6±1.3). Barriers of consuming energy
drinks were taste (4.34±0.9) and cost (4.34±0.9). The mean energy drink knowledge score was
4.63±1.30 of 9 points. Gender (p<0.01), educational level (p<0.01), income (p<0.05), attitude
(p<0.001) and perceived behavior control (p<0.01) were significant predictors of future
consumption intention.
iii
Acknowledgments
First, and most of all, I would like to thank my major professor, Dr. Yee Ming Lee, for
her expertise, guidance, assistance and patience throughout the process of writing this thesis.
Without her unreserved supports and encouragement, I could not have completed this work. It is
a great honor to learn from such a respected and beloved professor. I would like to express my
appreciations to my committee members, Dr. Martin and Dr. Rahman, for their generous and
helpful suggestions. Their comments and feedbacks improved this project and added more value
to it. I would like to extend my sincere gratitude to my parents for their love and supports from
every aspect. Last, but not the least, I would like to thank my best friends, Mr. Kenghin Cheong
Ms. Yining Deng and Ms. Jiali Tang for keeping me company on long walk; and to everyone
else who helped contributed to this project.
iv
Table of Contents
Abstract ......................................................................................................................................... ii
Acknowledgments ....................................................................................................................... iii
List of Tables ............................................................................................................................... vi
List of Figures ............................................................................................................................. vii
List of Abbreviations ................................................................................................................. viii
Chapter 1 Introduction .................................................................................................................. 1
Background .............................................................................................................................. 1
Statement of Problem .............................................................................................................. 2
Statement of Purpose .............................................................................................................. 3
Specific Objectives ................................................................................................................. 3
Research Questions .................................................................................................................. 4
Significance of study ................................................................................................................ 4
Assumptions ............................................................................................................................. 5
Limitations ............................................................................................................................... 5
Definition of Terms .................................................................................................................. 6
References ................................................................................................................................ 8
Chapter 2 Literature Review ....................................................................................................... 10
Global Market ........................................................................................................................ 10
U.S. Market and Leading Brands ........................................................................................... 11
ii
Active Ingredients and related Side Effects ........................................................................... 17
Function of Energy Drinks ..................................................................................................... 24
Consumers’ Profile ................................................................................................................ 26
Consumption Pattern and Reason for Use ............................................................................. 27
Theory of Planned Behavior ................................................................................................. 28
Attitude .......................................................................................................................... 30
Subjective Norms .......................................................................................................... 30
Perceived Behavior Control ........................................................................................... 31
Theory of Planned Behavior in Beverage Consumption……………………………… 32
Knowledge…………………………………………………………………………….. 33
Model of Extended Theory of Planned Behavior ……………………………………...35
References ...................................................................................................................... 36
Chapter 3 Methodology .............................................................................................................. 39
Sampling and Recruitment ........................................................................................... 40
Survey Development ..................................................................................................... 40
Pilot Study ...................................................................................................................... 44
Data Collection ............................................................................................................... 45
Data Analysis ................................................................................................................. 46
Reference ....................................................................................................................... 47
Chapter 4 Results ...................................................................................................................... 48
Demographics ............................................................................................................... 48
Energy Drinks Consumption .......................................................................................... 50
Reasons for Consumption ............................................................................................... 51
iii
Attitudes .......................................................................................................................... 52
Subjective Norms ........................................................................................................... 53
Perceived Behavioral Control ......................................................................................... 54
Knowledge ...................................................................................................................... 56
Side Effects ..................................................................................................................... 57
Future Consumption Intentions ...................................................................................... 58
Chapter 5 Discussion, Implication and Limitations ................................................................... 62
Conclusion ...................................................................................................................... 72
References .................................................................................................................... 73
Appendix 1 Online Questionnaire ............................................................................................. 75
Appendix 2 Inform Consent ...................................................................................................... 81
ii
List of Tables
Table 2.1 Brands, Product Line and Caffeine Content ............................................................... 16
Table 2.2 Summary of Active Ingredients in Energy Drinks and Their Side Effects ............... 24
Table 3.1 Statements to Measure Attitudes towards Energy Drinks .......................................... 42
Table 3.2 Items Included to Measure Participant’s Knowledge about Energy Drinks .............. 43
Table 3.3 Measures included in Online Survey .......................................................................... 45
Table 3.4 The Results of Cronbach’s Alpha Test………………………………………………46
Table 4.1 Characteristics of the Respondents ............................................................................. 49
Table 4.2 Energy Drinks Consumption: Brands, Frequency and Amount ................................. 50
Table 4.3 Attitudes of Respondents about Consuming Energy Drink ....................................... 53
Table 4.4 Subjective Norms of Respondents about Consuming Energy Drink………………...54
Table 4.5 Perceived Behavioral Control of Respondents about Consuming Energy Drink……55
Table 4.6 Respondents' Answers to Knowledge Questions…………………………………….57
Table 4.7 Distribution of Total knowledge Score………………………………………………57
Table 4.8 Side Effects of Consuming Energy Drink……………………………………………58
Table 4.9 Future consumption Intentions of Energy Drink……………………………………..59
Table 4.10 Logistic Regression………………………………………………………………….61
iii
List of Figures
Figures 2.1 Top 5 Leading Energy Drink Brands Worldwide .................................................. 11
Figures 2.2 Leading Energy drink Brands in the United States ................................................. 12
Figures 2.3 Model of Theory of Planned Behavior .................................................................... 29
Figures 2.4 Model of Extended Theory of Planned Behavior .................................................... 36
Figures 3.1 Research Flow Chart .............................................................................................. 39
Figures 4.1 Reasons for Energy Drinks Consumption ............................................................... 51
iv
List of Abbreviations
TPB Theory of Planned Behavior
MTurk Amazon Mechanical Turk
1
CHAPTER 1 INTRODUCTION
Background
Energy drinks continue to gain its popularity since Red Bull, currently a leading brand in
the energy drinks market, first introduced its products in 1997. There are more than 500 energy
drink brands available worldwide, reaping the financial rewards of $5.7 billion (Reissig et al.,
2009) in year 2006. Global energy drinks sales, within the functional beverage category, reached
$49.9 billion in 2014 with 5% growth rate as compared to 2013. There are more than 200 brands
of energy drinks in the United States. The sales of energy drink and shots are estimated to
approach to $21.5 billion by 2017 (Facts, 2013).
Energy drinks are produced mainly to boost energy and concentration, decrease feelings
of tiredness and enhance mental alertness. In order to achieve the goal of enhancing level of
energy, many energy drinks typically contain high dosages of caffeine and glucose, as well as
other active ingredients such as taurine, guarana, carnitine, ginseng and various vitamins and
minerals. Energy drinks could be classified as sugar-containing and sugar-free versions and
typically contain 80 to 141 mg of caffeine per 8 ounces, the equivalent of five ounces of coffee
or two 12-ounce cans of caffeinated soft drink such as Mountain Dew, Coca Cola or Pepsi Cola
(Malinauskas et al., 2007).
It is reported that about 30 to 50 percent of adolescents and young adults are consuming
energy drinks on a regular basis (Attila et al., 2011). Also, as described by Red Bull, their target
markets are younger population ranging from 14 to 34 years old, gamers, sports enthusiasts and
the Hip-pop crowd, based on the fact that they are especially vulnerable to exhaustion and
insufficient energy. With the popularity of energy drinks increasing quickly, health-related
concerns associated with energy drinks consumption arises as well. Notable side effects caused
2
by excessive amount of active ingredients include but not limited to shaking, agitation, insomnia,
anxiety, high blood pressure and addiction (Heckman et al., 2010).
Theory of Planned Behavior was adopted as the framework of this study. The concept
was proposed by Icek Ajzen to improve the validity of prediction of behavioral intentions based
on the theory of reasoned action by including perceived behavioral control. According to this
theory, human behavioral intentions are determined by attitudes, subjective norms and perceived
behavioral control (Ajzen, 1991). Moreover, knowledge will be added as an additional attribute
to form the extended model in this research.
Statement of Problem
Previous articles have profoundly discussed the health-related problems associated with
energy drink consumption among young people, yet little investigation has been done to
investigate the energy drinks consumption other than this group of population. For instance,
Kristina and Timothy (2010) investigated drinking patterns and risk behaviors associated with
combined alcohol and energy drink consumption in college drinkers in Canada. Their results
indicated that more frequent drinker, compared to less frequent drinkers, had twice the chances
of experiencing one or more negative consequences from alcohol mixed with energy drink use. It
remains unknown if other consumers who are not categorized as “young people” demonstrated
the same behavior.
Similarly, Attila and Banu (2010) performed a cross-sectional study to investigate the
frequency of energy-drink consumption and associated factors in a group of fourth-year students
studying at Hacettepe University in Turkey. Based on their findings, consumption of energy
drinks was very common in college students despite the variation in the reason for choosing such
drinks. Frequency of energy-drink consumption was higher in students of arts and sports and in
3
those who tend to skip breakfast on a regular basis. Common reasons for consuming energy
drinks included increasing level of energy, staying awake, boosting performance while doing
sports, or mixing with alcoholic beverages. Notably, most students could not correctly define the
ingredients of energy drinks or potential hazardous health effects. Both of these researches were
conducted overseas and among younger populations and limited studies have been conducted in
the United States. Therefore there is a need to expand the scopes of investigation of energy
drinks, to include broader populations with various demographics, and also in the United States
to better under the energy drinks market in this country.
Statement of Purpose
The purpose of this study was to investigate consumers’ energy drink consumption
behavior based on extended theory of planned behavior.
Objectives
The specific objectives of this study were to:
• Examine current energy drinks consumption among general consumers in the United States.
• Investigate general public’s attitudes, subjective norms and perceived behavior control toward
energy drinks.
• Assess general public’s knowledge about energy drinks.
• Investigate the relationships between demographics, attitudes, subjective norms and perceived
barriers, general public’s knowledge, previous side effects experienced and future intention of
energy drinks consumption.
• Evaluate the differences in attitude, subjective norms, perceived behavior control, and
knowledge based on the demographic characteristics of respondents.
4
Research questions
In order to achieve the goals, several research questions were investigated.
1. What is the current energy drinks consumption trend and pattern in the United States,
including the age group, top brands, and frequency of consumption?
2. What is the attitude of general public towards energy drinks?
3. Who are the individuals that influence general public’s consumption of energy drinks?
4. What barriers preventing consumers from consuming energy drinks?
5. How knowledgeable are consumers about energy drinks?
6. How attitudes, subjective norms, perceived barriers and knowledge influence energy drink
consumption intention?
Significance of study
The market of energy drinks continues to expand over the years. With more than 500
brands of energy drinks in the market, the competition could be intense. This study identified
who the energy drinks consumers were, in addition to the target market that has already been
identified, their preferred brands, frequency of consumption, and reasons for consumption, which
help to uncover customers consuming habits and behaviors. Further, by recognizing customers’
attitudes toward energy drink consumption, manufacturers might implement strategies to change
the attitudes of consumers about this product. In addition, understanding which individual brings
obvious influence on consumers’ energy drink consumption is very crucial to promote product
more effectively. For instance, if celebrities are the influential individuals, company might
consider appointing them as a spokesperson of the product, so to increase its product popularity.
Moreover, identifying perceived barriers of consuming energy drinks could help
companies to identify strategies to remove those barriers. For example, if product designs (i.e.,
5
size and packaging) are found to discourage consumers from buying and consuming energy
drinks, the manufacturers can adjust the serving size in each bottle or change the appearance of
the products to be more appealing. Moreover, the energy drink manufacturers can also
ameliorate their marketing strategies if price and convenience are perceived as the main barriers
by majority of consumers. Investigating consumers’ knowledge of energy drinks plus associated
side effects reveals a potential need to elevate awareness of health related issues causing by
energy drink consumption. Overall, the findings of this research are also expected to provide
theoretical implications and novel research ideas for future studies.
Assumptions
This study assumes that the respondents answered all the questions truthfully and to the
best of their knowledge. It also assumes that each construct is measurable and the instrument
developed based on an elicitation study is adequate to assess each construct.
Limitations
This study has some limitations. The participants were recruited through an online
platform Amazon Mechanical Turk (MTurk), which has gained its popularity as one of the
common tools for data collection. MTurk is a desirable outlet for any researcher looking for a
random sample of the general population, which becomes more and more popular among
scholars due to its efficiency and validity (Paolacci et al., 2010). MTurk workers can complete
the tasks anonymously and without contact with the researchers thus the results are generally
more representative. Also, researchers at Princeton, New York University and University of
Venice conducted an experimental study in 2010 to compared responses from MTurk users to
responses from students at a major Midwestern university and found no obvious differences
between them, indicating the high validity MTurk has significant validity. However, Amazon
6
Mechanical Turk is not able to offer requesters the opportunity to define their populations.
Moreover, since all the responses are anonymous, there generally is no punishment for falsifying
information in order to qualify to complete a task. The study was conducted in the energy drinks
market in the U.S. alone. Therefore, the results cannot be generalized beyond the territory of the
U.S.
Definition of Terms
Energy drinks: Energy drinks are drinks designed to boost energy as well as offer metabolic or
central nervous system stimulation. Those products are marketed to increase one’s real or
perceived physiological performance. Energy drinks typically contain various ingredients,
including caffeine, taurine (an amino acid that assists with neurological development), sugar,
guarana (provides 250 mg of caffeine in usage of 3-5g), and Vitamins B complex (Higgins,
2010).
Theory of Planned Behavior: The Theory of Planned Behavior is a theory that links beliefs and
behavior. The concept was developed from the Theory of Reasoned Action in 1980 to predict an
individual's intention to engage in a behavior at a specific time and place (Ajzen, 1991)
Attitudes: An attitude is defined as a positive or negative evaluation of people, objects, event,
activities, ideas, or just about anything in your environment (Zimbardo, Ebbesen & Maslach,
1999, p. 745)
Subjective Norm: A broad definition of perceived or subjective norm is "the perceived social
pressure to perform or not to perform the behavior" in question (Ajzen, 1991, p. 188)
Perceived Behavioral Control: Perceived behavioral control refers to people's perceptions of
their ability to perform a given behavior (Ajzen, 1991, p. 188)
7
Behavioral intention: Behavioral intention is defined as a person's perceived likelihood or
"subjective probability that he or she will engage in a given behavior" (Committee on
Communication for Behavior Change in the 21st Century, 2002, p. 31)
Guarana: Guarana is a dried paste that is made from the seeds of a South American
climbing shrub (Paullinia cupana) of the soapberry family, that contains caffeine and
tannin, and that is used as a stimulant (Gardiner & Heuer, 2011)
Carnitine: Carnitine is a compound derived from an amino acid that functions in fatty acid
metabolism by transporting fatty acids into mitochondria for energy production (Shils & Shike,
2006)
Ginseng: Ginseng is defined as herbs consist of a light-colored, forked-shaped root, a relatively
long stalk and green leaves with an oval shape. Ginseng is believed to provide an energy boost,
lower blood sugar and cholesterol levels, reduce stress, promote relaxation, treat diabetes, and
treat sexual dysfunction in men (Matthews, Lucier & Fisher, 1999)
Taurine: Taurine is an amino acid involved in cell volume regulation found in the brain, retina,
muscle tissue, and organs throughout the body. Taurine provides a substrate for the formation of
bile salts and plays a role in the modulation of intracellular free calcium concentration (Ripps &
Shen, 2012)
Caffeine: Caffeine is defined as a drug that is most commonly found in coffee beans, tea, soft
drinks, cocoa and chocolate. It is also found in some prescription and non-prescription drugs,
including cold, allergy and pain relievers. Caffeine acts as a stimulant, causing increased
alertness exerting an effect on the central nervous system. Caffeine can also be produced
artificially and added to certain foods in order to give most people a temporary energy boost and
elevates mood (Barone & Roberts, 1996)
8
References
Ajzen, I. (1991). The theory of planned behavior. Organizational behavior and human decision
processes, 50(2), 179-211.
Amy, Frotienelle. (February 23, 2015). The Energy Drink Industry. Investopedia, Retrieved from
http://www.investopedia.com/articles/investing/022315/energy-drinks-industry.asp
Attila, S., & Çakir, B. (2011). Energy-drink consumption in college students and associated
factors. Nutrition, 27(3), 316-322.
Barone, J. J., & Roberts, H. R. (1996). Caffeine consumption. Food and Chemical
Toxicology, 34(1), 119-129.
Committee on Communication for Behavior Change in the 21st Century (2002). Speaking of
Health: Assessing Health Communication Strategies for Diverse Populations.
Washington, DC: National Academies Press.
Facts, P. (2013). Energy drinks and shots: US market trends. Retrieved from
http://www.packagedfacts.com/Energy-Drinks-Shots-7124908/
Gardiner, P. T., & Heuer, M. A. (2011). U.S. Patent No. 7,943,183. Washington, DC: U.S. Patent
and Trademark Office.
Heckman, M. A., Sherry, K., Mejia, D., & Gonzalez, E. (2010). Energy drinks: an assessment of
their market size, consumer demographics, ingredient profile, functionality, and
regulations in the United States. Comprehensive Reviews in food science and food
safety, 9(3), 303-317.
Higgins, J. P., Tuttle, T. D., & Higgins, C. L. (2010, November). Energy beverages: content and
safety. In Mayo Clinic Proceedings (Vol. 85, No. 11, pp. 1033-1041). Elsevier.
9
Malinauskas, B. M., Aeby, V. G., Overton, R. F., Carpenter-Aeby, T., & Barber-Heidal, K.
(2007). A survey of energy drink consumption patterns among college students. Nutrition
Journal, 6(1), 1.
Matthews, H. B., Lucier, G. W., & Fisher, K. D. (1999). Medicinal herbs in the United States:
research needs. Environmental Health Perspectives, 107(10), 773.
Reissig, C. J., Strain, E. C., & Griffiths, R. R. (2009). Caffeinated energy drinks—a growing
problem. Drug and Alcohol Dependence, 99(1), 1-10.
Ripps, H., & Shen, W. (2012). Review: taurine: a “very essential” amino acid. Website?
Retrieved <http://www.molvis.org/molvis/v18/a275>
Shils, M. E., & Shike, M. (Eds.). (2006). Modern nutrition in health and disease. Lippincott
Williams & Wilkins.
10
Chapter 2 Literature Review
Introduction
This chapter provided background information about market trends of energy drinks and
the products by analyzing companies’ revenue and their market share both worldwide and in the
United State. It described the functions, active ingredients and potential side effects of the major
energy drinks as well. Moreover, the target consumers of energy drinks, their consumption
patterns and reason for use were also discussed in this chapter. Lastly, Theory of Planned
Behavioral and its application in beverage consumption were introduced as the framework to
develop theoretical model of current study.
Global Market
The popularity of energy drink is continuously increasing worldwide since the first
energy drink product has been launched in Japan in 1960. In 1970’s, energy drink was marketed
in Thailand. After that, in 1987, energy drink was first introduced in Europe and then quickly
expanded throughout the rest of Europe before entering the market of the United States (U.S.) in
1997 (Breda, 2015). According to BeverageDaily.com, an online news service covering the food
and beverage industry, global energy drink sales has reached $49.9 billion in 2014 with an
increase rate of 5% compared to the sales in 2013. Research and Market, the world’s largest
market research store, has released a report titled “Global Energy Drink Market: Insights, Market
Size, Share, Growth, Trends Analysis and Forecast to 2021” in Dublin on September 3rd, 2015.
Their results indicated that the total global energy drink market in 2013 was 39760.8 million
USD and it is expected to reach 61707.5 million USD by 2021 with a compound annual growth
rate at 5.8% over the forecast period. Based on a market research carried out by American
Beverage Association, a trade association that represents America’s non-alcoholic beverage
11
industry, the markets that will be most important for energy drink growth through 2017 are the
U.S., China and Brazil. In 2006, almost 500 new brands of energy drink were released
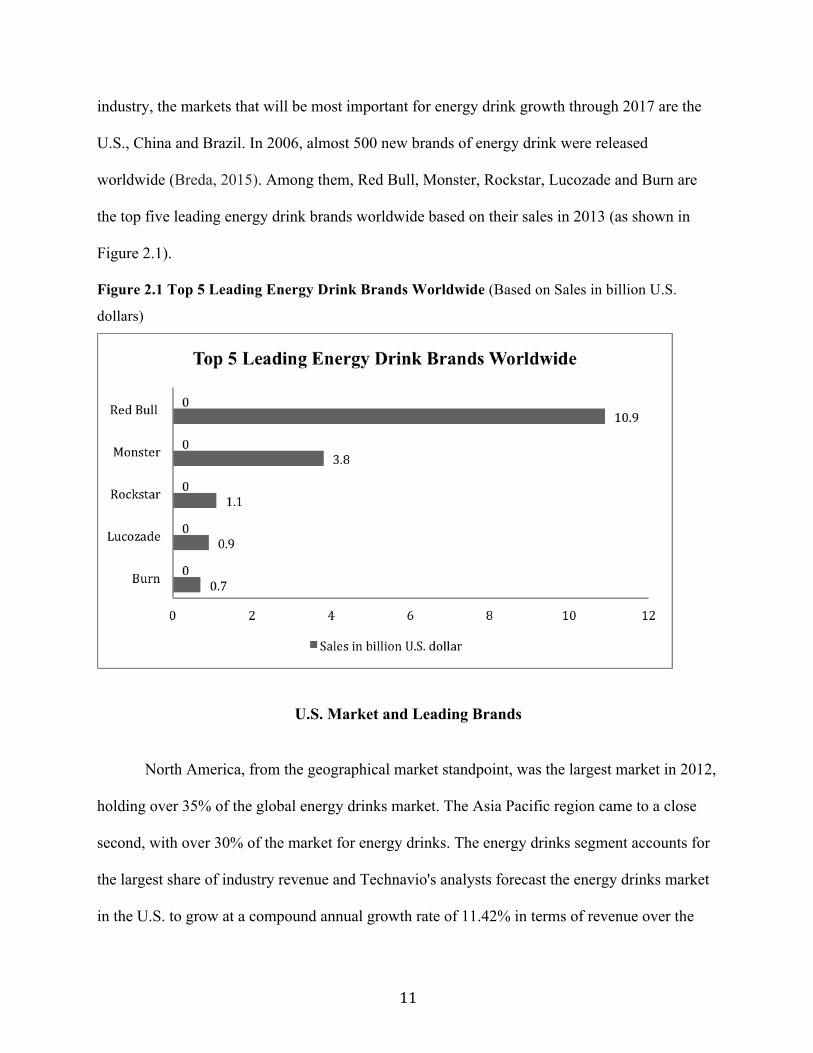
worldwide (Breda, 2015). Among them, Red Bull, Monster, Rockstar, Lucozade and Burn are
the top five leading energy drink brands worldwide based on their sales in 2013 (as shown in
Figure 2.1).
Figure 2.1 Top 5 Leading Energy Drink Brands Worldwide (Based on Sales in billion U.S.
dollars)
U.S. Market and Leading Brands
North America, from the geographical market standpoint, was the largest market in 2012,
holding over 35% of the global energy drinks market. The Asia Pacific region came to a close
second, with over 30% of the market for energy drinks. The energy drinks segment accounts for
the largest share of industry revenue and Technavio's analysts forecast the energy drinks market
in the U.S. to grow at a compound annual growth rate of 11.42% in terms of revenue over the
12
period from 2014 to 2019.There are more than 200 energy drink brands in U.S. market. Based on
the market research, the top five most popular energy drink brands in U.S. that occupying up to
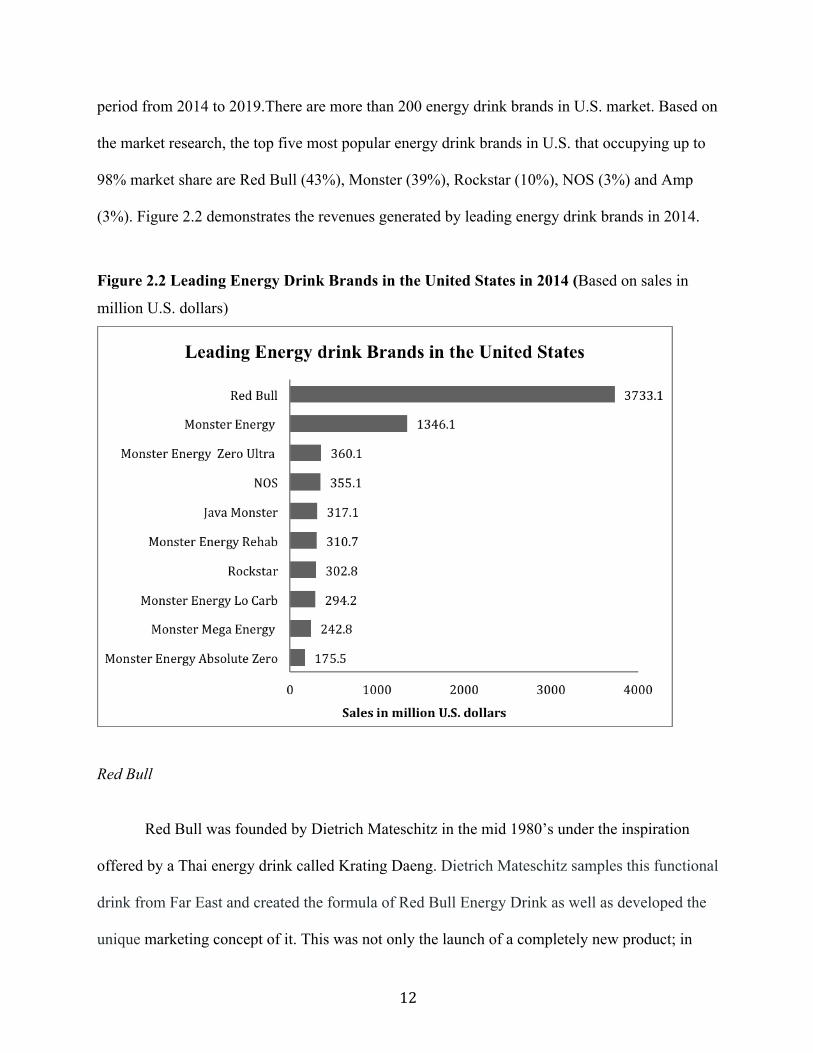
98% market share are Red Bull (43%), Monster (39%), Rockstar (10%), NOS (3%) and Amp
(3%). Figure 2.2 demonstrates the revenues generated by leading energy drink brands in 2014.
Figure 2.2 Leading Energy Drink Brands in the United States in 2014 (Based on sales in
million U.S. dollars)
Red Bull
Red Bull was founded by Dietrich Mateschitz in the mid 1980’s under the inspiration
offered by a Thai energy drink called Krating Daeng. Dietrich Mateschitz samples this functional
drink from Far East and created the formula of Red Bull Energy Drink as well as developed the
unique marketing concept of it. This was not only the launch of a completely new product; in

13
fact it was the birth of a totally new product category. The Red Bull headquarters are based in
Fuschl Am See, not far from Salzburg, Austria. On April 1, 1987, Red Bull Energy Drink was
initially sold in its home market. After that, Red Bull's distribution expanded into neighboring
countries, Hungary and Slovenia, in 1992. Right after that, Red Bull was introduced in Germany
and the United Kingdom in March 1994. Although it was priced about three times as much as a
can of Coca-Cola, Red Bull marketed successfully in the United Kingdom. In 1997, Red Bull
energy drink entered the U.S. market via California, focusing at first on four western states:
California, Oregon, Texas, and Colorado. In 2000, Red Bull has successfully launched in the
Middle East. Today Red Bull is available in more than 165 countries and more than 35 billion
cans of Red Bull have been consumed so far (energydrink.redbull.com).
In addition, Red bull has recently experienced strong sales growth in India, Japan,
Turkey, Scandinavia, Russia, and Brazil. It plans to focus on continued expansion in the United
States, Western Europe, and the East. According to the report generated by the company, Red
Bull sold 5.387 billion cans of their products worldwide in 2013, a 3.1% increase over 2012. In
the US market, the drink had sales of $3.433 million from July 2012 through June 2013. Market
research firm IRI announced Red Bull the leader in US energy drink sales. Furthermore, Forbes
estimated the company’s market value at $20 billion last December (Amy, 2015). Red Bull’s
advertising strategy relies heavily on sporting events and extreme sports sponsorship. Its secret to
success appears to be its early involvement in bars and clubs for the purpose of mixing with
alcohol drinks plus its early sponsorship of extreme sports with their famous slogan: "Red Bull
Gives You Wings”.
14
Monster
Monster Beverage Corporation was found in 1990 and began selling Monster Energy
drinks in 2002. The company’s subsidiaries market and distribute different product lines of
energy drink beverages. Monster energy promotes itself as “way more than an energy drink . . . a
lifestyle in a can”. The company associates itself with action sports, punk rock music, partying,
hanging with the girls, and living life on the edge. The main ingredients of original Monster
Energy are carbonated water, sucrose, glucose, taurine, ginseng, L-Carnitine, caffeine, B
vitamins and guarana, though ingredients vary somewhat by flavor. Monster drinks come in 36
varieties and has been sold in 114 countries, ranging from its flagship Monster Energy drink to
double-strength, coffee-flavored, fruit flavored, no calorie, protein-enhanced, and other varieties
(Amy, 2015). With U.S. sales of $3.147 million from July 2012 through June 2013, Monster
Energy is a close second to Red Bull. Together, these two brands captured more than 80% of the
US energy drink market in 2013. In 2008, Monster Beverage Corporation entered an agreement
with the Coca-Cola Company, which is also its proffered distribution channel. Coca-Cola’s
distribution network reaches more than 200 countries therefore should help increase Monster’s
sales internationally (Amy, 2015).
Rockstar
Russ Weiner, founder and owner, introduced Rockstar Energy in San Francisco in 2001.
Rockstar Energy Drink is designed for those who lead active lifestyles such as athletes and rock
stars, supporting the Rockstar lifestyle across the globe through Action Sports, Motor Sports and
Live Music. Their products, come in 8.4-ounce, 16-ounce, and 24-ounce cans, are available in
more than 20 flavors and mainly sold at convenience and groceries in over 30 countries. The
main ingredients include carbonated water, sucrose, glucose, taurine, caffeine, L-Carnitine, milk
15
thistle extract, ginkgo leaf extract, guarana, and ginseng root extract (Amy, 2015). Rockstar had
$821 million in U.S. sales in 2013 and approximately $670 million in revenue. It makes up about
10% of the US energy drink market.
NOS
NOS energy drink is from Coca-Cola product line. Coca-Cola is the world’s largest
beverage company, refreshing consumers with more than 500 sparkling and still brands (The
Cocacola Company, 2016). NOS energy drink is named after nitrous oxide, and is often
distributed in a bottle designed to look like a Nitrous Oxide Systems cartridge. The containers
have three different sizes, including 16 fl. oz, 22 fl. oz and 12 fl. oz for 6 bottles per package.
The product line is relatively simple, however, compare to other brands NOS contains high level
of taurine and caffeine (Heckman et al, 2010).
Amp
Amp energy is an energy drink brand produced and owned by PepsiCo. PepsiCo products
are consumed 1 billion times a day in more than 200 countries and territories. PepsiCo generated
more than $66 billion in net revenue in 2013. Amp energy was initially distributed under the
Mountain Dew soft drink brand when at the time of its introduction in 2001(Heckman et.al.,
2010). In 2009, it has been produced and labeled under its own trademark. The beverage is
packaged in 16-ounce or 24-ounce cans and sold in United States, Canada and United Kingdom
with five different flavors, including lemon (original), cherry, strawberry, passion fruit, blueberry
with grape and watermelon. Amp energy drink is also fully involved in many sponsorship of
activities and have a famous slogan to advertise their products: “Amp energy --- the Energy You
Need, Flavors You Crave” (Heckman et al., 2010). The product lines of each leading brands and
their caffeine contents are shown in Table 2.1 as below.
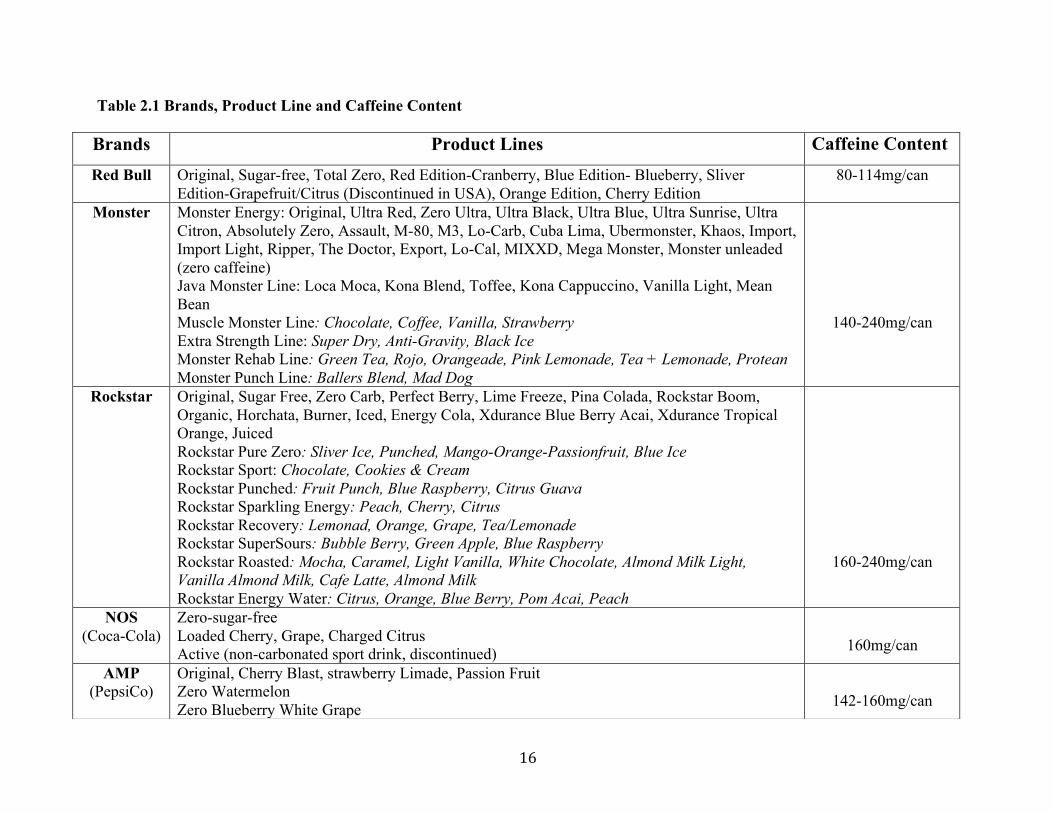
16
Table 2.1 Brands, Product Line and Caffeine Content
Brands Product Lines Caffeine Content Red Bull Original, Sugar-free, Total Zero, Red Edition-Cranberry, Blue Edition- Blueberry, Sliver
Edition-Grapefruit/Citrus (Discontinued in USA), Orange Edition, Cherry Edition 80-114mg/can
Monster Monster Energy: Original, Ultra Red, Zero Ultra, Ultra Black, Ultra Blue, Ultra Sunrise, Ultra Citron, Absolutely Zero, Assault, M-80, M3, Lo-Carb, Cuba Lima, Ubermonster, Khaos, Import, Import Light, Ripper, The Doctor, Export, Lo-Cal, MIXXD, Mega Monster, Monster unleaded (zero caffeine) Java Monster Line: Loca Moca, Kona Blend, Toffee, Kona Cappuccino, Vanilla Light, Mean Bean Muscle Monster Line: Chocolate, Coffee, Vanilla, Strawberry Extra Strength Line: Super Dry, Anti-Gravity, Black Ice Monster Rehab Line: Green Tea, Rojo, Orangeade, Pink Lemonade, Tea + Lemonade, Protean Monster Punch Line: Ballers Blend, Mad Dog
140-240mg/can
Rockstar Original, Sugar Free, Zero Carb, Perfect Berry, Lime Freeze, Pina Colada, Rockstar Boom, Organic, Horchata, Burner, Iced, Energy Cola, Xdurance Blue Berry Acai, Xdurance Tropical Orange, Juiced Rockstar Pure Zero: Sliver Ice, Punched, Mango-Orange-Passionfruit, Blue Ice Rockstar Sport: Chocolate, Cookies & Cream Rockstar Punched: Fruit Punch, Blue Raspberry, Citrus Guava Rockstar Sparkling Energy: Peach, Cherry, Citrus Rockstar Recovery: Lemonad, Orange, Grape, Tea/Lemonade Rockstar SuperSours: Bubble Berry, Green Apple, Blue Raspberry Rockstar Roasted: Mocha, Caramel, Light Vanilla, White Chocolate, Almond Milk Light, Vanilla Almond Milk, Cafe Latte, Almond Milk Rockstar Energy Water: Citrus, Orange, Blue Berry, Pom Acai, Peach
160-240mg/can
NOS (Coca-Cola)
Zero-sugar-free Loaded Cherry, Grape, Charged Citrus Active (non-carbonated sport drink, discontinued)
160mg/can
AMP (PepsiCo)
Original, Cherry Blast, strawberry Limade, Passion Fruit Zero Watermelon Zero Blueberry White Grape
142-160mg/can
17
Active Ingredients and Related Side Effects
There are several active ingredients found in most of the energy drinks available in the
market, including caffeine, guarana, taurine, sugar, ginseng, and bitter orange. An active
ingredient is the ingredient in a pharmaceutical drug or a pesticide that is biologically active, that
has clear effect on living being in small amount (Perva-Uzunalić et al., 2006). The Food and
Drug Administration (FDA) does not approve or review energy drinks since they are marketed as
dietary supplements. Also, FDA currently has no regulation for caffeine content in energy drink
(Reissig et al., 2009). Therefore, many drink claims have not been proven, the amount of added
ingredients is neither standardized nor identified on the label and their safety is not known.
Norway, Uruguay and Denmark have banned Red Bull because of its negative health effects
(Buxton & Hagan, 2012).
Caffeine
Caffeine content and caffeine concentration vary widely among different energy drink
brands. It is the most commonly used behaviorally active substance in the world. Daily caffeine
intake averages 170 to 210 milligrams per day in the United States, United Kingdom, and
Canada (Giles et al., 2012). Caffeine has been widely studied in a variety of areas regarding
human health and performance and it is evident that caffeine consumption can increase energy
utilization (Smit & Rogers, 2002) and enhance mood and alertness (Kaplan et al., 1997; Lorist &
Tops, 2003; Smit & Rogers, 2002). More specifically, caffeine performs many critical functions,
including enhancing executive control and working memory, increasing information-processing
time and awareness, improving exercise performance and attention, reducing reaction time and
reducing feelings of fatigue (Cysneiros et al., 2007; Doherty & Smith, 2004; Graham, 2001). It
18
has also be proven that caffeine could enhance vigilance and psychomotor performance of
individuals (Smith, 2011). Bonnet et al. (2005) also concluded that caffeine can contribute to
improved alertness and performance at doses of 75 to 150 mg after acute sleep loss and doses of
200 to 600 mg after a night or more without sleep (Bonnet et al., 2005).
Caffeine, as an active ingredient, is widely used on the majority of energy drinks due to
its stimulatory effect on the central nervous system. A review regarding caffeine consumption
concluded that a moderate daily caffeine intake of ≤400 mg was not associated with any adverse
effects among the healthy adult population (Nawrot et al., 2003). Common energy drinks contain
approximately 80 milligrams caffeine per 8 ounce serving, yet they are also commercially
available in 16-ounce containers and therefore can contain up to 505 milligrams of caffeine.
Hence, caffeine toxicity and poisoning caused by consuming excessive amount of caffeine are
great concerns. Studies indicated that caffeine doses of 78 mg/kg have demonstrated serious
adverse effects in young children (Yew & Laczek, 2007). Common symptoms that are seen with
caffeine intoxication include nervousness, anxiety, restlessness, insomnia, gastrointestinal upset,
tremors, tachycardia, psychomotor agitation, and in rare cases, even death. Symptoms of caffeine
toxicity can be similar to those experienced with anxiety and mood disorders (Reissig et al.,
2008).
Guarana
Guarana comes from the Paullinia cupana plant, known for its small-berry like fruit it
produces, which contains 1 to 3 dark seeds as the only edible part. It originated in the Amazon
basin in Brazil and has been used by a long history (Angelo et al., 2008). The seeds contain a
significant amount of caffeine, with 1 g of guarana being equivalent to about 40 mg caffeine
(Finnegan, 2003). However, it has been showed that the caffeine from guarana is released at a
19
slower rate compared to pure caffeine, giving off a more subtle and lengthier stimulatory effect
(Scholey & Haskell, 2008). In addition to the caffeine content, guarana also contains relatively
high amounts of saponins, flavonoids, and tannins, all contributing to its bioactive properties
including antioxidant activity (Heckman et al., 2010).
Guarana has become an increasingly common natural additive in energy drinks in recent
years largely for its stimulatory effect (Scholey & Haskell 2008). Several research studies
indicated that guarana, at physiologically relevant dosages, has a function of improving cognitive
performance, mental fatigue, and mood (Haskell et al., 2007; Kennedy et al., 2008; Scholey &
Haskell 2008). Another clinical study also showed that guarana is lipid metabolism, probably
due to its methylxanthine content (Lima et al., 2005). Although guarana has been shown to exert
no toxic effects when consumed both in acute high dosages as well as in chronic lower dosages,
certain population still have chances to experience side effects such as insomnia, nervousness,
restlessness, shaking, anxiety, chest pain and dysrhythmias (Barbosa, 2011).
Ginseng
Ginseng is an herb that has been used for over 2000 years by people in East Asian
countries, including China, Japan, and Korea as a remedy for various diseases and for promoting
longevity (Lee et al., 2005; Nam et al., 2005). Ginsenosides is the active constituent in ginseng.
The entire ginseng plant has been used for medicinal purposes; however, the root is the most
prominent and dominates the commercial sales. The roots are typically not harvested until after
the 5th or 6th year of growth when their ginsenoside concentrations are at their peak (Heckman
et al., 2010)
There are several studies have reported the health benefits of ginseng, including
supporting the functions of immune systems and producing improved physical and mental
20
conditions (Coon & Ernst 2002; Lu et al., 2009; Reay et al., 2005). More specifically, ginseng
has certain pharmacological properties such as anti-aging, antioxidant, and anti-inflammatory
(Coon &Ernst 2002; Lu et al., 2009). Although a randomized placebo-controlled clinical has
claimed that ginseng has no beneficial effect on mood or memory in young healthy subjects
(Cardinal & Engels 2001), Reay et al. have proved the improvements in mental fatigue after the
consumption of 200 mg ginseng (Reay et al., 2005). Despite the increasing popularity of ginseng
and its reported pharmacological effects, it is crucial to know whether there are any health risks
for the consumer or not. Ginseng is generally considered safe, however excessive amount of
ginseng has resulted in some side effects such as hypertension, diarrhea, and sleep disturbances
(Coon & Ernst 2002).
Sugar
Scholey and Kennedy (2004) assessed the influence of energy drink ingredients including
caffeine, glucose, ginseng and ginkgo, as well as a whole energy drink on multiple measures of
cognition and mood. They found that whole energy drink intake improved attention and memory
abilities such as immediate and delayed recall. Energy drinks contain approximately 27 g glucose
per 8-oz serving for its energizing effects. Glucose is believed to improve some aspects of
cognitive performance, notably spatial, logical, short- term and long-term memory yet the results
are controversial. Adan et al. (2010) showed that caffeine and glucose, alone and together,
reduced reaction time and together improved sustained attention and verbal memory (Adan et al.,
2010) However Serra found no effect of caffeine and glucose, taken together, on sustained
attention (Serraet et al., 2010). Glucose has greater enhancing effect in older adults than younger
adults and in tasks with high levels of difficulty or that require divided attention. Nonetheless,
21
excessive amount of sugar in energy drinks is highly possible to cause dental erosion, cavities,
diabetes and obesity (Meikle et al., 2004).
Taurine
Taurine is a is a sulfur containing amino acid, derived from diet or synthesized from
cysteine, mainly in the liver (Bouckenooghe et al., 2006). It is the most abundant amino acid
(basic unit of proteins) found naturally in our bodies, primarily in the retina and skeletal and
cardiac muscle tissue (Heckman et al., 2010). Also, it is highly concentrated in the heart and liver
as well as the central nervous system including the brain stem and hippocampus (Giles et al.,
2012). Taurine can be obtained from meat, fish and some diary products. Average daily human
intake of taurine is between 40 and 400 mg (Shao & Hathcock 2008). Recently, energy drinks
such as Red Bull, Monster, and Rockstar are considered as the sources of taurine as well because
they generally contain 1000 mg taurine per 8 oz. serving. Actually, energy drinks launched
between 2004 and 2008 were evaluated for the presence of taurine. The results showed that 1 in
4 (27%) energy drinks in 2004 contained taurine, whereas it was reduced to 1 in 5 (21%) in 2008
(Mintel, 2009). This reduction could be due to a cost saving initiative or the incorporation of
alternative ingredients in the product formulation.
Taurine plays very significant role in osmoregulation, membrane stabilization,
neuroprotection and regulation of cellular calcium level (Ripps et al., 2012). Additionally,
taurine has been seen to enhance endurance performance and to aid in the reduction of lactic acid
buildup after exercise (Imagawa et al., 2009). Many researchers start to investigate the cognitive
effects of taurine, suggesting that taurine may prevent or reverse neurotoxin-induced deficits in
learning, memory, and long-term potentiation, but does not enhance cognitive performance in
healthy, intact animals (Giles et al., 2012). Based on a report analyzing taurine content of 80
22
different energy drinks, the result demonstrates that the average concentration of taurine in
energy drinks is 3180 mg/L which is equivalent to 753 mg/8 oz. (Triebel et al., 2007). Moreover,
several studies have been conducted to determine the effect of taurine at various dosages ranging
from 375 to 8000 mg/d and resulting in no adverse effects (Heckman et al., 2010). Other studies
(Brons er al., 2004; Sirdah er al., 2002; Zhang et al., 2004) have also investigated the safety of
taurine in humans and found no adverse effects. Although there is insufficient evidence to
conclude that taurine will cause any adverse health effects, health-related concern still existed
due to not enough research has been conducted on the effects of large quantities of taurine in
combination with other ingredients commonly found in energy drinks.
Yerba Mate
Yerba mate is native to South America where its main function is for the production of
yerba mate tea. Yerba mate tea is a commonly consumed beverage in South American countries
and has been used for centuries. It continuously become more and more popular in global due to
its content of a variety of bioactive components such as polyphenols, xanthines, flavonoids,
saponins, amino acids, minerals, and vitamins and their associated health benefits. Yerba mate
possesses anti-inflammatory and antidiabetic properties as well as acts as an inhibitor to
oxidative stress. In addition, yerba mate is a central nervous system stimulant due to its high
caffeine concentration, which is the primary reason for yerba mate to be incorporated into energy
drink formulations. The caffeine concentration in 8 oz. of yerba mate tea is equivalent to about
78 mg, which is very comparable to 8 oz. of Red Bull, which contains 80 mg (Heck & Mejia,
2007). Health concerns have been raised since yerba mate consumption has been detected to be
associated with occurrence of certain types of cancer, specifically oral, esophageal, lung,
bladder, and renal. However, there lacks conclusive evidence that this association is a result of
23
the consumption of yerba mate but rather due to various lifestyle choices including smoking and
excessive alcohol consumption (Heck & Mejia, 2007).
B Vitamins
B vitamins are a group of 8 individual water-soluble vitamins, usually referred to as the B
complex when grouped together, and all play essential roles in cellular processes. Vitamin B
deficiencies are rare since they can be found in various types of food, such as bananas, lentils,
potatoes, tuna, and turkey. B vitamins are incorporated into many of the mainstream energy
drinks, especially B2 (riboflavin), B3 (niacin), B6 and B12. Vitamin B2 is a coenzyme in the
metabolism of carbohydrates. Vitamin B3 plays a major role as a coenzyme in energy
metabolism, fat synthesis, and fat breakdown. Vitamin B6 is a group of 3 structurally similar
compounds that all can be converted into the vitamin B6 coenzyme which aids in the utilization
of carbohydrates, fats, and proteins (Wardlaw & Smith 2009). Vitamin B12 assists in folate
metabolism and in nerve function. The container size varies among different brands and it may
hold multiple servings. A typical can of 250 mL may contain 360% of the recommended daily
allowance of B6, 120% of B12, and 120% of B3 (niacin). The addition of excess amounts of B
vitamins is also observed in the more extreme energy drinks like 5-Hour Energy, which contains
8333% of the recommendation daily allowance for vitamin B12 and 2000% of the
recommendation daily allowance for B6. It is claimed that the consumption of these large
amounts of B vitamins increases mental alertness and focus, as well as improves mood (Wardlaw
& Smith 2009). Since all of the B vitamins are water soluble, once the recommended daily
allowance has been met, the excess vitamins are excreted from the body via urine. Although
theoretically the consumption of a large amount of B vitamins does not possess any adverse
health effects, healthy concerns related to extreme amounts of B vitamins in these beverages
24
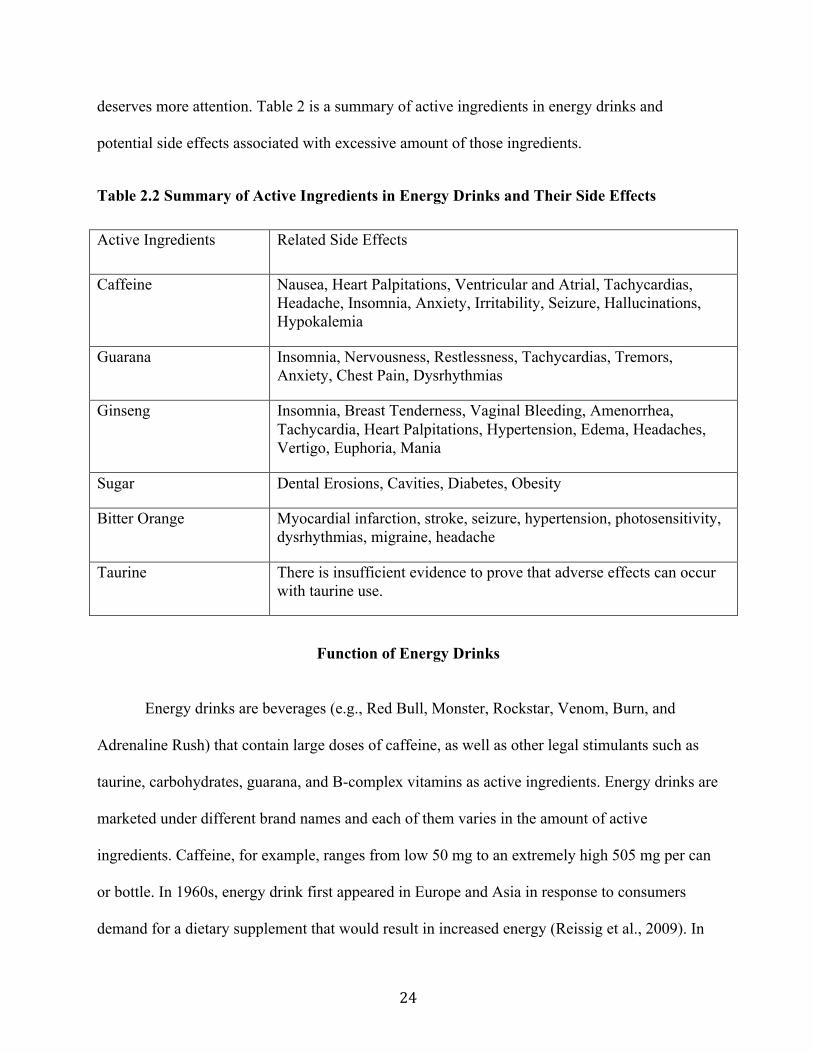
deserves more attention. Table 2 is a summary of active ingredients in energy drinks and
potential side effects associated with excessive amount of those ingredients.
Table 2.2 Summary of Active Ingredients in Energy Drinks and Their Side Effects
Active Ingredients Related Side Effects
Caffeine Nausea, Heart Palpitations, Ventricular and Atrial, Tachycardias, Headache, Insomnia, Anxiety, Irritability, Seizure, Hallucinations, Hypokalemia
Guarana Insomnia, Nervousness, Restlessness, Tachycardias, Tremors, Anxiety, Chest Pain, Dysrhythmias
Ginseng Insomnia, Breast Tenderness, Vaginal Bleeding, Amenorrhea, Tachycardia, Heart Palpitations, Hypertension, Edema, Headaches, Vertigo, Euphoria, Mania
Sugar Dental Erosions, Cavities, Diabetes, Obesity
Bitter Orange Myocardial infarction, stroke, seizure, hypertension, photosensitivity, dysrhythmias, migraine, headache
Taurine There is insufficient evidence to prove that adverse effects can occur with taurine use.
Function of Energy Drinks
Energy drinks are beverages (e.g., Red Bull, Monster, Rockstar, Venom, Burn, and
Adrenaline Rush) that contain large doses of caffeine, as well as other legal stimulants such as
taurine, carbohydrates, guarana, and B-complex vitamins as active ingredients. Energy drinks are
marketed under different brand names and each of them varies in the amount of active
ingredients. Caffeine, for example, ranges from low 50 mg to an extremely high 505 mg per can
or bottle. In 1960s, energy drink first appeared in Europe and Asia in response to consumers
demand for a dietary supplement that would result in increased energy (Reissig et al., 2009). In
25
1962, a Japanese company, Taisho Pharmaceuticals, launched one of the very 1st energy drinks
called Lipovitan D, which is nowadays still dominating the Japanese market. Lipovitan D
contains B vitamins, taurine, and ginseng, which are all frequent components of mainstream
energy drinks with the purpose of providing sustained energy and reducing mental and physical
fatigue (Taisho Pharmaceutical Co. Ltd., 2009).
Whether energy drinks have specific impacts on human physiological and psychological
performance or not has already been actively debated for years. Several researchers presented
conflicting results based on their previous works. Some studies reported no significant
differences in either the physiological or cognitive performance of individuals who have and
have not consumed energy drinks (Alvarado & Jimenez 2004; Sancho & Jimenez 2005).
However, many researchers are devoted to determine the behavioral effects brought by energy
drinks to consumers, specifically to their mood, concentration, reaction time, alertness,
endurance, physical performance, and risk taking. More specifically, a clinical study showed that
individuals’ secondary memory and speed of attention were significantly improved after
consuming energy drink (Scholey & Kennedy 2004).
A number of studies especially investigated the effects of Red Bull on human cognitive
performance and well being, suggesting that energy drink consumption brought positive impacts
on consumers’ behaviors (Alford et al., 2001; Seidl et al., 2000). Moreover, it has also been
approved that the consumption of Red Bull is beneficial in improving aerobic endurance and
anaerobic performance. Based on Geiss et al.’s (1994) study, there was a significant increase in
overall physical endurance of trained athletes after the consumption of 250 mL of the Red Bull
product (Alford et al., 2001). Furthermore, Smith et al. have reported that energy drinks had an
energizing effect with the strongest effect between 30 to 60 minutes after consumption (Smith et
26
al., 2004). In addition, other evidence also supported that visual information processing,
attention, and verbal reasoning have been improved after the consumption of energy drinks
(Warburton et al., 2001). A study investigated the effect of an energy blend containing caffeine,
taurine, glucuronolactone, vitamins and sugar on counteracting driver sleepiness and found that
this blend was effective in reducing sleepiness and sleep-related driving incidents (Reyner &
Horne, 2002).
Consumers’ Profile
Energy drinks were initially consumed by athletes. However, as the energy drink market
grows rapidly, athletes are no longer the primary targets. The majority of the consumers
nowadays are teenagers and young adults aged from 18 to 34 years old due to their on-the-go
lifestyles and receptiveness to advertisements for these types of products (Lal, 2007).
In addition to market reports, several researches also confirmed that young adults are more likely
to consume energy drinks (Mintel, 2009; O’Brien et al., 2008). According to O’Brien et al
(2008) and Mintel (2009), energy drink was popular among 34% of the younger population from
18 to 24 years old who also consider themselves as the regular energy drink users (O’Brien et al.,
2008). Another study found that about 50% of college students consume at least 1 energy drink
per month in order to increase their energy level, to compensate for a lack of sleep or to mix with
alcohol (Mintel, 2009). Moreover, Experian Simmons Analysis provided the evidence to show
that energy drink usage among adults rising from nearly 13% in 2006 to 17% in 2012.
Furthermore, there was a modest segment of heavy users: about 5% of adults consume energy
drinks 5-7 times per month and less than 2% of them consume energy drinks 10 or more times
per month.
27
The target market for energy drinks is broadening as new products are developed to reach
certain submarkets and the energy drink companies are trying to differentiate themselves from
their competitors. For example, in 2007, Del Monte Foods launched its first energy drink called
Bloom Energy, claiming that it was formulated specifically with women in mind (Heckman, et
al., 2010). Another brand, Energy Fizz, mainly focus on improving consumers’ convenience by
launching creative products such as a powder that is packaged in a small portable tube that can
be easily added to water on the go to boost energy. Moreover, other energy drinks promote the
unique qualities such as being all natural, organic, or gluten-free, as well as diabetic-friendly or
vegetarian-friendly to make them stand out from the rest.
Consumption Pattern and Reasons for Use
Previous researches have investigated energy drink consumption patterns particularly
among college students, due to the fact that the use of energy drink is quite common among
younger generation. In general, the most common reasons for consuming energy drinks are to
enjoy leisure time with friends, keep the individuals awake, increase level of energy and for
better performance in driving, sports or exams (Alsunni & Badar, 2011). Malinauskas (2007)
conducted a study to determine energy drink consumption patterns among 253 college students
in several state universities in the Central Atlantic region of the United States. The result
indicated that consuming energy drinks is a popular practice among college students for a variety
of reasons. About 51% percent of the participants reported consuming more than one energy
drinks each month in an average month for the current semester. The majority of users consumed
energy drinks to compensate insufficient sleep (67%), increase energy (65%), and paired with
another alcoholic beverages while partying (54%). Mixing energy drinks with alcohol was
28
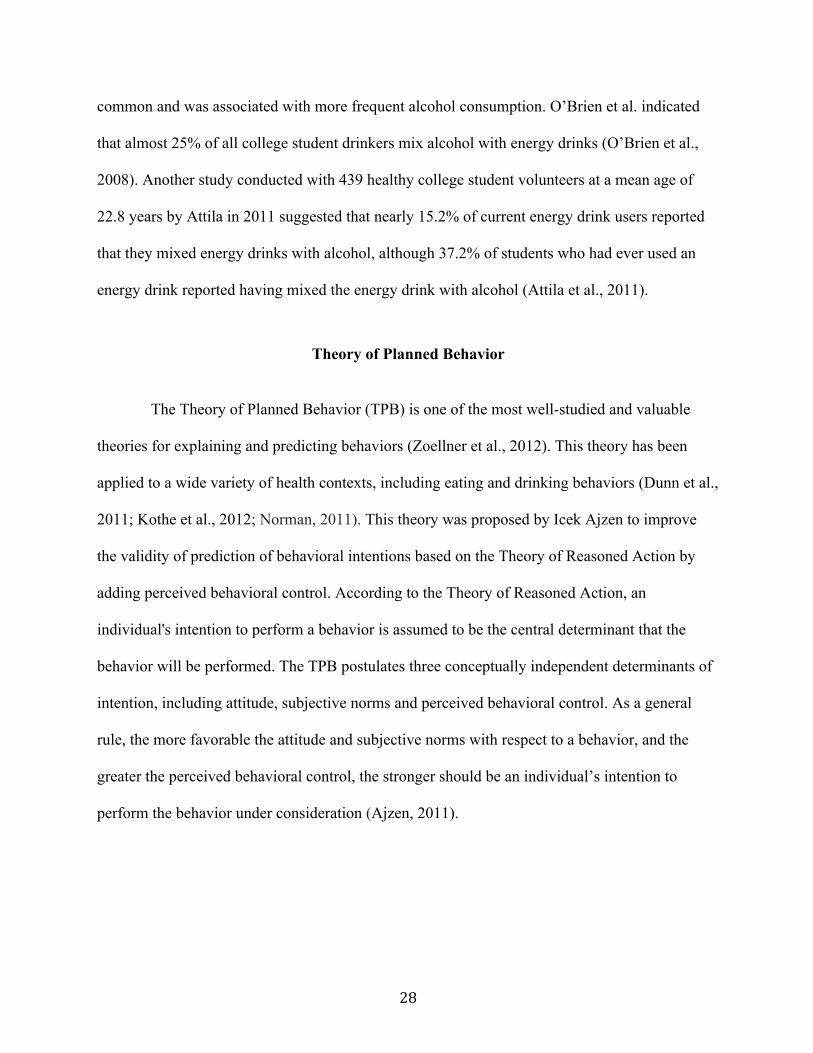
common and was associated with more frequent alcohol consumption. O’Brien et al. indicated
that almost 25% of all college student drinkers mix alcohol with energy drinks (O’Brien et al.,
2008). Another study conducted with 439 healthy college student volunteers at a mean age of
22.8 years by Attila in 2011 suggested that nearly 15.2% of current energy drink users reported
that they mixed energy drinks with alcohol, although 37.2% of students who had ever used an
energy drink reported having mixed the energy drink with alcohol (Attila et al., 2011).
Theory of Planned Behavior
The Theory of Planned Behavior (TPB) is one of the most well-studied and valuable
theories for explaining and predicting behaviors (Zoellner et al., 2012). This theory has been
applied to a wide variety of health contexts, including eating and drinking behaviors (Dunn et al.,
2011; Kothe et al., 2012; Norman, 2011). This theory was proposed by Icek Ajzen to improve
the validity of prediction of behavioral intentions based on the Theory of Reasoned Action by
adding perceived behavioral control. According to the Theory of Reasoned Action, an
individual's intention to perform a behavior is assumed to be the central determinant that the
behavior will be performed. The TPB postulates three conceptually independent determinants of
intention, including attitude, subjective norms and perceived behavioral control. As a general
rule, the more favorable the attitude and subjective norms with respect to a behavior, and the
greater the perceived behavioral control, the stronger should be an individual’s intention to
perform the behavior under consideration (Ajzen, 2011).
29
Model
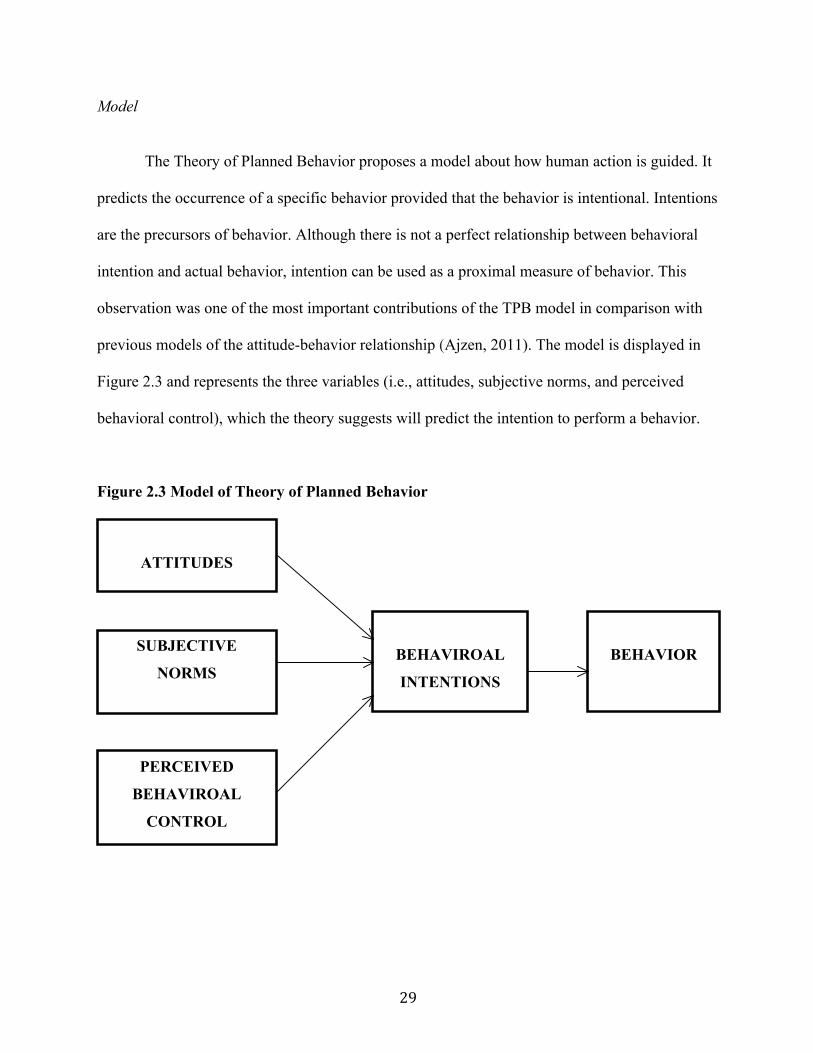
The Theory of Planned Behavior proposes a model about how human action is guided. It
predicts the occurrence of a specific behavior provided that the behavior is intentional. Intentions
are the precursors of behavior. Although there is not a perfect relationship between behavioral
intention and actual behavior, intention can be used as a proximal measure of behavior. This
observation was one of the most important contributions of the TPB model in comparison with
previous models of the attitude-behavior relationship (Ajzen, 2011). The model is displayed in
Figure 2.3 and represents the three variables (i.e., attitudes, subjective norms, and perceived
behavioral control), which the theory suggests will predict the intention to perform a behavior.
Figure 2.3 Model of Theory of Planned Behavior
ATTITUDES
SUBJECTIVE
NORMS
BEHAVIROAL
INTENTIONS
PERCEIVED
BEHAVIROAL
CONTROL
BEHAVIOR
30
Attitudes
Attitude toward the behavior is a person’s overall evaluation of the behavior, which can
be either positive or negative. More favorable attitudes towards a behavior should increase
behavioral intentions. Attitude construct comprises of two components: beliefs about
consequences of the behavior (behavioral beliefs) and the corresponding positive or negative
judgments about the behavior (outcome evaluations).
Nada et al. (2003) conducted a study to investigate soft drink consumption among female
adolescents by using the Theory of Planned Behavior in 2003. Their results showed that attitude,
subjective norm and perceived behavioral control had statistically significant positive
associations with intention and together explained 64% of its variance. Although all attributes
were significant predictors, attitude was detected to be the strongest predictor, followed by
perceived behavioral control and subjective norms. More specifically, their regression explained
49% of the variance in attitude towards regular soda consumption. All the variables measured in
their study associated with attitudes were considered to have predictive power, including “good
taste”, it quenched thirst, “make them feel healthy”, “to gain weight” and “it had too much
caffeine” (Nada et al., 2003). In addition, previous study confirmed that accessibility, modeling,
attitudes and preferences were all strong determinants of adolescents’ regular and diet soft drink
consumption. Among them, preferences, accessibility, modeling and attitudes were the strongest
determinants (Bere et al., 2008).
Subjective Norms
Subjective norms are a person’s own estimate of the social pressure to perform or not
perform the target behavior. Subjective norms are assumed to have two components which work
in interaction: beliefs about how other people, who may be in some way important to the person,
would like them to behave (normative beliefs) and the positive or negative judgments about each
31
belief (outcome evaluations). Many studies suggested that subjective norms have certain power
to predict behavioral intentions (Nada et al., 2003; Bere, et al., 2008; Jamie et al., 2012). For
example, Nada et al. concluded that parents and friends were very likely to influence
adolescents’ beverage consumptions. They further explained that both adolescent male and
female consumed soft soda in order to enjoy leisure time with friends and participants were
highly possible to prefer soft drink than other alternatives if sodas were available at home (Nada
et al., 2003). Moreover, Kit et al. indicated that health professionals nowadays tend to have
certain influence on sugar-sweetened beverages among youth and young adults in the United
States (Kit et al., 2013).
Perceived Behavioral Control
The Theory of Reasoned Action was expanded to include the construct of perceived
behavioral control based upon the premise that an individual's degree of confidence in one's own
ability to engage in a behavior is a strong determinant of the behavioral intention (Ajzen, 2002).
Perceived behavioral control is the extent to which a person feels able to enact the behavior. It
has two aspects: how much a person has control over the behavior and how confident a person
feels about being able to perform or not perform the behavior. It is determined by control beliefs
about the power of both situational and internal factors to inhibit or facilitate the performing of
the behavior. Previous studies related to food and beverage consumption concluded several
possible factors affecting consumers’ intentions of purchasing or consuming certain products,
including availability, price, accessibility, taste, uncertainty, lack of information (Vermeir et al.,
2006; Aertsens et al., 2009; Kassem et al., 2004; Zoellner et al., 2012)
32
Theory of Planned Behavior in Beverage Consumption
An increasing number of researchers have devoted their efforts into investigating
beverage consumptions by using Theory of Planned Behavior (TPB) as the framework (Bere,
Glomnes, Velde & Klepp, 2008; Horst, Kremers, Ferreira, Singh, Oenema & Brug, 2007;
Kassem, Lee, Modeste & Johnston, 2003; Kassem, & Lee, 2004; Zoellner, Estabrooks, Davy,
Chen & You, 2012). Cooke and Norman (2014) examined how well the Theory of Planned
Behavior in predicting alcohol consumption by conducting a systematic review and meta-
analysis. They analyzed 40 eligible studies in total to quantify correlations between variables of
TPB, including attitude, subjective norms and perceived behavioral control, and intentions to
consume alcohol. They also include other variables, such as pattern of consumption, gender and
age of participants and their moderating effects on theory of planned behavior. According to
their results, intentions had the strongest relationship with attitudes followed by subjective norms
and perceived behavioral control. Perceived behavioral control had negative relationships with
alcohol consumption. All moderators such as gender and age affected Theory of Planned
Behavior relationships. For example, females reported stronger attitude–intention relations than
males, and adults reported stronger attitude–intention (Cooke & Norman, 2014).
Bere, Glomnes, Velde and Klepp (2008) have conducted a study with 2870 9th and 10th
grade students within 33 Norwegian schools to identify determinants of adolescents’
consumption of carbonated soft drinks. They found a large gender differences in soft drink
consumption and boys were tend to drink more often than girls. Also, educational, dieting,
accessibility, modeling, attitudes and preferences all seem to be strong determinants of
adolescents’ soft drink consumption. For example, parents, as models of the behavior and as the
ones deciding what foods and drinks should be available and accessible at home, clearly had
33
important influence on adolescents’ soft drink consumption behaviors. Also, Grimm et al. (2004)
found that soft drink intake in school-aged children was significantly correlated to taste
preferences, habits of parents and friends, availability at home and school and social media such
as television viewing (Grimm et al., 2004).
In 2012, Zoellner, Estabrooks, Davy, Chen and You explored the Theory of Planned
Behavior to explain sugar-sweetened beverage consumption among adolescents, aiming to figure
out which attribute has the most significant influence on beverage consumption behavior. The
researchers conducted a cross-sectional study with 119 southwest Virginia participants. They
found that behavioral intentions had the strongest relationships with sugar-sweetened beverage
consumption, followed by attitudes, perceived behavioral control, and subjective norms. In a
subsequent analysis, the authors controlled for age, sex, and education level. However, results
indicated that the overall explained variance slightly increased yet these demographic variables
were not significant in interpretation of the TPB coefficients (Zoellner et al., 2012). The authors
claimed that this study was a preliminarily step to expand investigation of sugar sweetened
beverage consumption and they also suggested future scholars to repeat this study with larger
and more diverse population.
Knowledge
According to Brucks (1985), there are three distinct categories of consumer knowledge
relevant to consumer behavior, including subjective knowledge, objective knowledge and prior
experience. Subjective knowledge refers to what individuals perceive that they know, also
indicated as perceived or self-rated knowledge, incorporating the individual’s degree of
confidence in his/her own knowledge (Brucks, 1985). A low level of subjective knowledge,
resulting from a lack of confidence in current knowledge, may motivate the search for additional
34
information, whereas a high level of subjective knowledge increases reliance on previously
stored information (Brucks, 1985; Ruddell, 1979). Objective knowledge refers to what an
individual actually knows, facilitating deliberation and the use of newly acquired information
(Ruddell, 1979; Selnes & Gronhaug, 1986). Objective knowledge positively affects the number
of attributes considered by an information-searching consumer (Brucks, 1985; Park & Lessig,
1981).
Knowledge was found to have certain influence on food consumption. Worsley (2002)
conducted a study among 1040 participants, between18–75 years old from England to explore
whether nutrition knowledge change food behavior. Their results indicated that nutrition
knowledge was significantly associated with healthy eating pattern such as regular fruit and
vegetable intake. More specifically, knowledgeable individuals were 25 times more likely to
consume adequate amounts of fruit and vegetables daily (Worsley, 2002). Another study carried
out by Kim, Shin and Moon (2004) found that frequent-users for fast food had comparatively
low knowledge score (15 out of 20) than the non-users (15.5 out of 20) and they were less aware
of the fat type in food and the importance of breakfast (Kim, Shin, & Moon, 2004). Moreover,
Kang, Park and Lee (2006) also conducted a research with 920 middle and high-school students
in Korea to investigate beverage consumption and related factors among adolescents. They
confirmed that drinking frequency for carbonated drinks decreased as the nutritional knowledge
increased (Kang, Park, Cho, & Lee, 2006).
In addition, Aertsens et al. (2011) have found that knowledge influence the degree of
attitude. They concluded that higher levels of objective and subjective knowledge about organic
food are positively related to a more positive attitude towards organic food, greater experience of
it and a more frequent use of information. For example, participants indicated that knowledge
35
helped them to differentiate the attributes of organic food from conventional food. By
understanding those factors, consumers previewed organic food to be more environmental
friendly and healthier and thus form positive attitude towards organic food (Aertsens et al.,
2011). Moreover, House et al. (2004) found that knowledge was important in the process of
attitude-building towards genetically modified food food among U.S., U.K. and French
consumers. Higher levels of subjective knowledge were significantly and positively related to the
willingness of consumers to intake genetically modified food, yet they did not observe this
relationship for objective knowledge (House et al., 2004). The findings indicate that subjective
knowledge is not only positively related to an individual’s confidence in their knowledge, but
also with stronger attitudes towards a product or behavior.
Furthermore, knowledge also directly influences the degree of perceived behavioral
control toward behavior. Demeritt (2002) reported that lack of knowledge and awareness was
considered to be the main reason for consumers not buying organic food in the U.S. The majority
of respondents (59%) indicated that they have never considered organic products because they
were not aware of these products. Moreover, it was also reported that 14% of non-buyers of
organic food mentioned that there was not sufficient information to justify why they should pay
premium price for organic products (Organic Centre Wales, 2004).
Extended Theory of Planned behavior
As mentioned above, attitudes, subjective norms, perceived behavioral control and
knowledge are all perceived to bring influence consumers’ consumption intentions. Those four
attributes are included to form extended theory of planned behavior (Figure 2.4) as the
framework for current study.
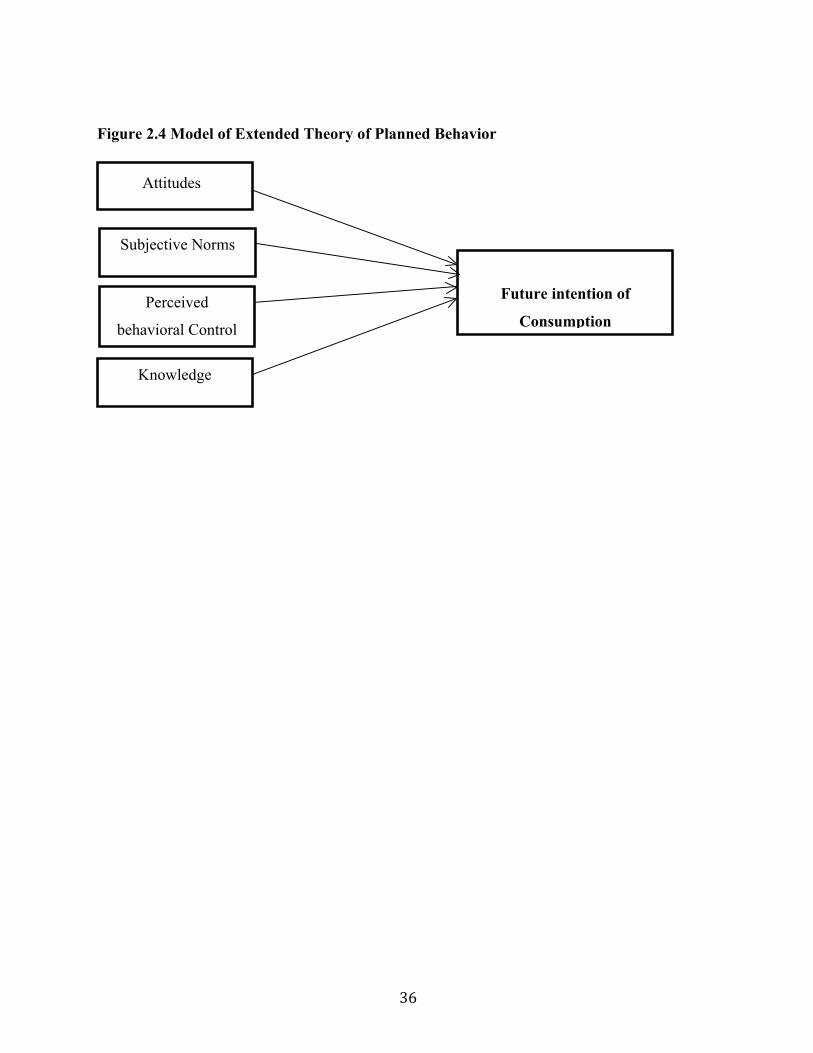
36
Figure 2.4 Model of Extended Theory of Planned Behavior
Subjective Norms
Knowledge
Attitudes
Perceived
behavioral Control
Future intention of
Consumption
37
References
Ajzen, I. (2011). Theory of planned behavior. Handbook of Theory of Socio Psychology, 1, 4.
Barbosa, C. S., Kato, M. T., & Buzalaf, M. A. R. (2011). Effect of supplementation of soft
drinks with green tea extract on their erosive potential against dentine. Australian Dental
Journal, 56(3), 317-321.
Bere, E., Glomnes, E. S., te Velde, S. J., & Klepp, K. I. (2008). Determinants of adolescents’
soft drink consumption. Public Health Nutrition, 11(01), 49-56.
Bouckenooghe, T., Remacle, C., & Reusens, B. (2006). Is taurine a functional nutrient?. Current
Opinion in Clinical Nutrition & Metabolic Care, 9(6), 728-733.
Breda, J. J., Whiting, S. H., Encarnação, R., Norberg, S., Jones, R., Reinap, M., & Jewell,
J. (2015). Energy Drink Consumption in Europe: a review of the risks, adverse health
effects, and policy options to respond.
Buxton, C., & Hagan, J. E. (2012). A survey of energy drinks consumption practices among
student-athletes in Ghana: lessons for developing health education intervention
programmes. Journal of International Socio Sports Nutrition, 9(1), 9.
Giles, G. E., Mahoney, C. R., Brunyé, T. T., Gardony, A. L., Taylor, H. A., & Kanarek, R. B.
(2012). Differential cognitive effects of energy drink ingredients: caffeine,
taurine, and glucose. Pharmacology Biochemistry and Behavior, 102(4), 569-577.
Grimm, G. C., Harnack, L., & Story, M. (2004). Factors associated with soft drink
consumption in school-aged children. Journal of the American Dietetic
Association, 104(8), 1244-1249.
Heckman, M. A., Sherry, K., Mejia, D., & Gonzalez, E. (2010). Energy drinks: an
assessment of their market size, consumer demographics, ingredient profile,
38
functionality, and regulations in the United States. Comprehensive Reviews in food
Science and Food Safety, 9(3), 303-317.
Imagawa, T. F., Hirano, I., Utsuki, K., Horie, M., Naka, A., Matsumoto, K., & Imagawa, S.
(2009). Caffeine and taurine enhance endurance performance. International Journal
of Sports Medicine, 30(7), 485-488.
Kit, B. K., Fakhouri, T. H., Park, S., Nielsen, S. J., & Ogden, C. L. (2013). Trends in sugar-
sweetened beverage consumption among youth and adults in the United States: 1999–
2010. The American Journal of Clinical Nutrition, 98(1):180–188
98/1/180 Perva-Uzunalić, A., Škerget, M., Knez, Ž., Weinreich, B., Otto, F., & Grüner, S.
(2006). Extraction of active ingredients from green tea (Camellia sinensis): Extraction
efficiency of major catechins and caffeine. Food Chemistry, 96(4), 597-605.
Reissig, C. J., Strain, E. C., & Griffiths, R. R. (2009). Caffeinated energy drinks—a
growing problem. Drug and Alcohol Dependence, 99(1), 1-10.
Ripps, H., & Shen, W. (2012). Review: taurine: a “very essential” amino acid.
Shao, A., & Hathcock, J. N. (2008). Risk assessment for the amino acids taurine, l-glutamine and
l-arginine. Regulatory Toxicology and Pharmacology, 50(3), 376-399.
Van der Horst, K., Kremers, S., Ferreira, I., Singh, A., Oenema, A., & Brug, J. (2007).
Perceived parenting style and practices and the consumption of sugar-sweetened
beverages by adolescents. Health Education Research, 22(2), 295-304.
Zoellner, J., Estabrooks, P. A., Davy, B. M., Chen, Y. C. Y., & You, W. (2012). Exploring the
theory of planned behavior to explain sugar-sweetened beverage consumption. Journal
of Nutrition Education and Behavior, 44(2), 172-177.
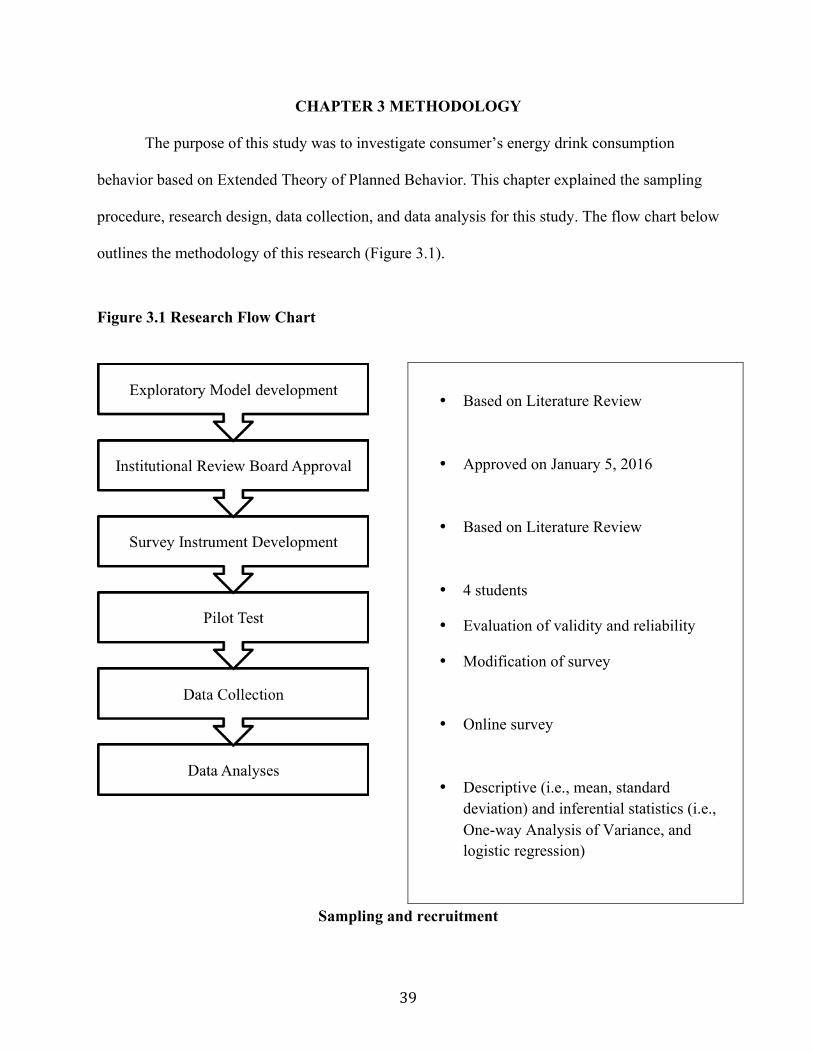
39
CHAPTER 3 METHODOLOGY
The purpose of this study was to investigate consumer’s energy drink consumption
behavior based on Extended Theory of Planned Behavior. This chapter explained the sampling
procedure, research design, data collection, and data analysis for this study. The flow chart below
outlines the methodology of this research (Figure 3.1).
Figure 3.1 Research Flow Chart
Sampling and recruitment
• Based on Literature Review
• Approved on January 5, 2016
• Based on Literature Review
• 4 students
• Evaluation of validity and reliability
• Modification of survey
• Online survey
• Descriptive (i.e., mean, standard deviation) and inferential statistics (i.e., One-way Analysis of Variance, and logistic regression)
40
The target population included in this study was the general public above 21 years old in
the United States. A link accessed to the online questionnaire was posted on Amazon Mechanical
Turk (MTurk). Amazon Mechanical Turk is a crowdsourcing Internet marketplace enabling
individuals and business to coordinate the use of human intelligence (Paolacci et al., 2010). The
functions include but not limited to recruiting participants for social science experiments and
educational research, collecting and processing data. Mturk users are the general publics who
have registered accounts that allow them to login and access the survey links. The targeted
sample size was 500. Based on calculations, in order to narrow the margin of error to ±5%, the
sample population should include at least 500 randomly selected participants (Creative Research
Systems, 2003).
Survey development
A cross-sectional design was applied for this study to collect data. Baumgartner and
Hensley (2006) described a cross-sectional design as a “method for testing many groups and
assuming each group is representative of all other groups when they are at the point in time (p.
181).” (Buchanan, 2012). The designed survey consisted of seven sections and the components
of each section were described in details as the following.
Section 1: Demographic information
Basic demographic information of participants was collected in this section to describe
the characteristics of the participants. There were five questions in total regarding to gender, age,
educational level, occupation and yearly household income. All questions except occupation
were formulated as multiple choices questions. Given the vast majority of previous researches
related to energy drink consumption were conducted among college students; there was no
reference for occupation category. Thus occupation was designed as the open-ended format,

41
allowing participants to specify their job titles. Age groups were classified into five categories,
including 21-30 years old, 31-40 years old, 41-50 years old, 51-60 years old and 61 or older.
Educational levels were categorized into six groups, including high school or GED, some
college, associated degree, bachelor’s degree and graduate’s degree. The last question in this
section asked about participants’ yearly household income level.
Section 2: Product Information and Consumption Patterns
This section was deigned to collect information regarding consumers’ preferred brands of
energy drinks and their habits of consuming energy drinks. A total of four questions were
included, including preferred energy drink brands, reasons for use, frequency of consumption per
week and amount of each consumption. Some of the examples of these questions were “Which
energy drink brand do you consume the most?”, “What are top three most important reasons that
affect your energy drinks consumption?”, “How frequently do you consume energy drink per
week?”, “What is the amount of each consumption of energy drink?”
Section 3: Attitudes towards Energy drinks
This section measured consumers’ attitudes towards energy drinks. Eight items were
adopted from a previous research titled “Qualitative Application of the Theory of Planned
Behavior to Understand Beverage Consumption” (Zoellner et. al., 2012). The participants were
asked to indicate how healthy energy drinks are and perceived benefits associated with
consuming energy drink by rating all statements based on a 5-point Likert Scale, ranging from 1
being “disagree” to 5 “agree”. These attitude statements are summarized in Table 3.1.
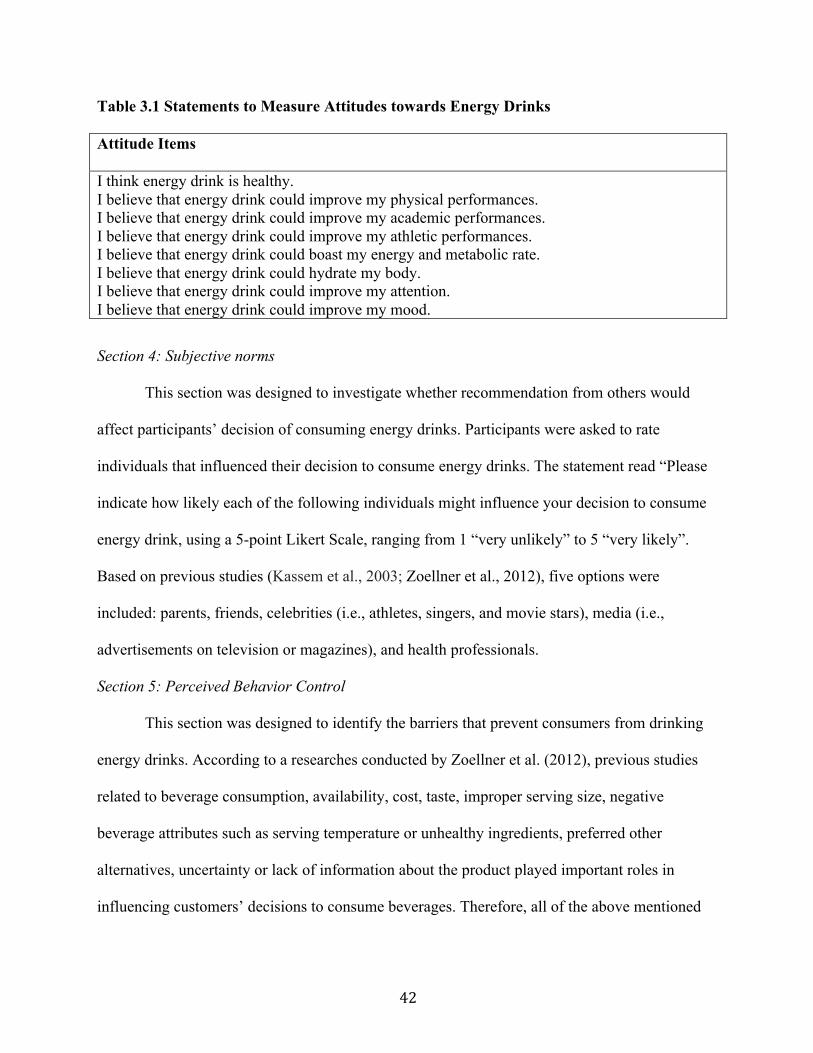
42
Table 3.1 Statements to Measure Attitudes towards Energy Drinks
Attitude Items
I think energy drink is healthy. I believe that energy drink could improve my physical performances. I believe that energy drink could improve my academic performances. I believe that energy drink could improve my athletic performances. I believe that energy drink could boast my energy and metabolic rate. I believe that energy drink could hydrate my body. I believe that energy drink could improve my attention. I believe that energy drink could improve my mood.
Section 4: Subjective norms
This section was designed to investigate whether recommendation from others would
affect participants’ decision of consuming energy drinks. Participants were asked to rate
individuals that influenced their decision to consume energy drinks. The statement read “Please
indicate how likely each of the following individuals might influence your decision to consume
energy drink, using a 5-point Likert Scale, ranging from 1 “very unlikely” to 5 “very likely”.
Based on previous studies (Kassem et al., 2003; Zoellner et al., 2012), five options were
included: parents, friends, celebrities (i.e., athletes, singers, and movie stars), media (i.e.,
advertisements on television or magazines), and health professionals.
Section 5: Perceived Behavior Control
This section was designed to identify the barriers that prevent consumers from drinking
energy drinks. According to a researches conducted by Zoellner et al. (2012), previous studies
related to beverage consumption, availability, cost, taste, improper serving size, negative
beverage attributes such as serving temperature or unhealthy ingredients, preferred other
alternatives, uncertainty or lack of information about the product played important roles in
influencing customers’ decisions to consume beverages. Therefore, all of the above mentioned
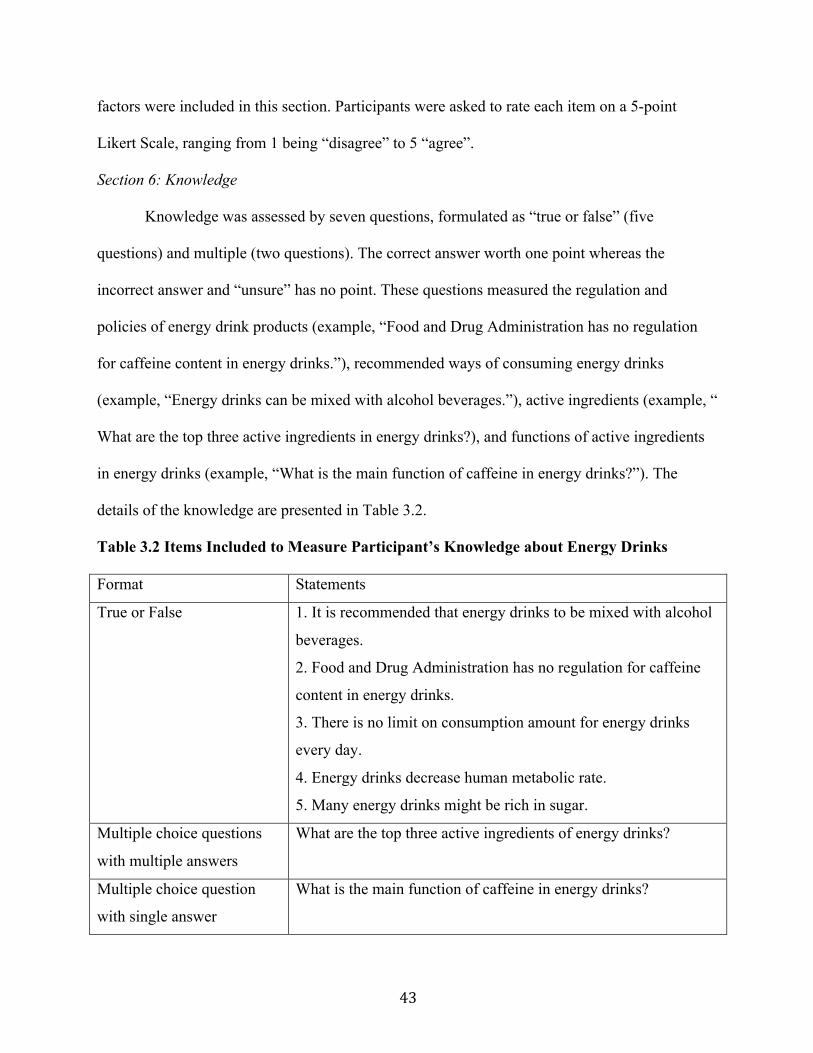
43
factors were included in this section. Participants were asked to rate each item on a 5-point
Likert Scale, ranging from 1 being “disagree” to 5 “agree”.
Section 6: Knowledge
Knowledge was assessed by seven questions, formulated as “true or false” (five
questions) and multiple (two questions). The correct answer worth one point whereas the
incorrect answer and “unsure” has no point. These questions measured the regulation and
policies of energy drink products (example, “Food and Drug Administration has no regulation
for caffeine content in energy drinks.”), recommended ways of consuming energy drinks
(example, “Energy drinks can be mixed with alcohol beverages.”), active ingredients (example, “
What are the top three active ingredients in energy drinks?), and functions of active ingredients
in energy drinks (example, “What is the main function of caffeine in energy drinks?”). The
details of the knowledge are presented in Table 3.2.
Table 3.2 Items Included to Measure Participant’s Knowledge about Energy Drinks
Format Statements
True or False 1. It is recommended that energy drinks to be mixed with alcohol
beverages.
2. Food and Drug Administration has no regulation for caffeine
content in energy drinks.
3. There is no limit on consumption amount for energy drinks
every day.
4. Energy drinks decrease human metabolic rate.
5. Many energy drinks might be rich in sugar.
Multiple choice questions
with multiple answers
What are the top three active ingredients of energy drinks?
Multiple choice question
with single answer
What is the main function of caffeine in energy drinks?

44
Section 7: Prior Experience and Consumption Intention
Participants were asked to indicate whether they have experienced any side effect
associated with energy drink consumption and specify exact symptoms. Two questions were
included in this section with one in “Yes or No” question format and one in multiple-answer
format. Sample questions include “Have you ever experienced any side effects after consuming
energy drinks?” and “What side effects have you experienced after consuming energy drinks?”.
The last two questions in the questionnaire aimed to investigate participants’ future
intention of energy drink consumption. One “Yes or No” question asked participants to indicate
whether they planned to consume energy drink in next week. Another multiple-choice question
allowed them to indicate how frequently they intend to consume energy drink in next week.
Pilot study
Pilot study was conducted among four students, with the purpose of ensuring each
question in the survey was understandable and to assess the clarity of words used, as well as the
instructions. After the pilot study, three questions including “Do you think there is any benefit
associated with consuming energy drinks?”, “Do you think there is any detrimental effect
associated with consuming energy drinks?” and “Please indicate how much you agree with the
following statements that related to potential detrimental effects associated with consuming
energy drinks.” were omitted due to redundancy and confusion. The final survey contained 20
questions in total. Instruments included in online questionnaire were illustrated in Table 3.3.
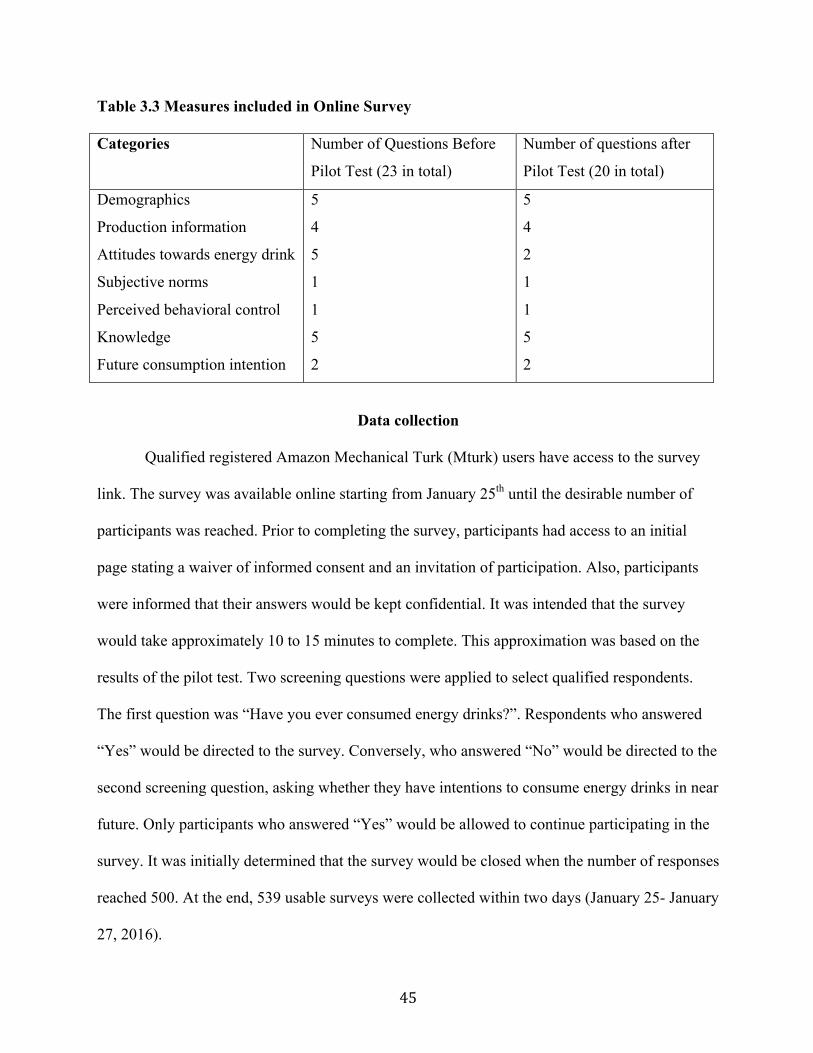
45
Table 3.3 Measures included in Online Survey
Categories Number of Questions Before
Pilot Test (23 in total)
Number of questions after
Pilot Test (20 in total)
Demographics
Production information
Attitudes towards energy drink
Subjective norms
Perceived behavioral control
Knowledge
Future consumption intention
5
4
5
1
1
5
2
5
4
2
1
1
5
2
Data collection
Qualified registered Amazon Mechanical Turk (Mturk) users have access to the survey
link. The survey was available online starting from January 25th until the desirable number of
participants was reached. Prior to completing the survey, participants had access to an initial
page stating a waiver of informed consent and an invitation of participation. Also, participants
were informed that their answers would be kept confidential. It was intended that the survey
would take approximately 10 to 15 minutes to complete. This approximation was based on the
results of the pilot test. Two screening questions were applied to select qualified respondents.
The first question was “Have you ever consumed energy drinks?”. Respondents who answered
“Yes” would be directed to the survey. Conversely, who answered “No” would be directed to the
second screening question, asking whether they have intentions to consume energy drinks in near
future. Only participants who answered “Yes” would be allowed to continue participating in the
survey. It was initially determined that the survey would be closed when the number of responses
reached 500. At the end, 539 usable surveys were collected within two days (January 25- January
27, 2016).
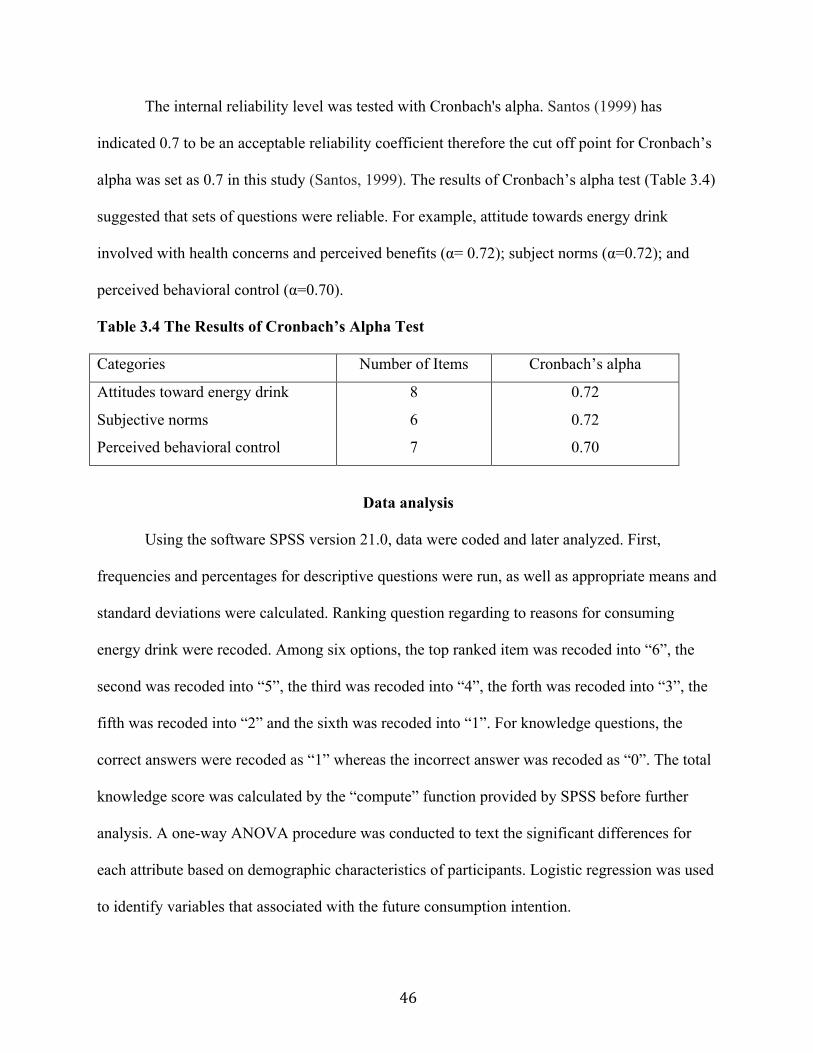
46
The internal reliability level was tested with Cronbach's alpha. Santos (1999) has
indicated 0.7 to be an acceptable reliability coefficient therefore the cut off point for Cronbach’s
alpha was set as 0.7 in this study (Santos, 1999). The results of Cronbach’s alpha test (Table 3.4)
suggested that sets of questions were reliable. For example, attitude towards energy drink
involved with health concerns and perceived benefits (α= 0.72); subject norms (α=0.72); and
perceived behavioral control (α=0.70).
Table 3.4 The Results of Cronbach’s Alpha Test
Categories Number of Items Cronbach’s alpha
Attitudes toward energy drink
Subjective norms
Perceived behavioral control
8
6
7
0.72
0.72
0.70
Data analysis
Using the software SPSS version 21.0, data were coded and later analyzed. First,
frequencies and percentages for descriptive questions were run, as well as appropriate means and
standard deviations were calculated. Ranking question regarding to reasons for consuming
energy drink were recoded. Among six options, the top ranked item was recoded into “6”, the
second was recoded into “5”, the third was recoded into “4”, the forth was recoded into “3”, the
fifth was recoded into “2” and the sixth was recoded into “1”. For knowledge questions, the
correct answers were recoded as “1” whereas the incorrect answer was recoded as “0”. The total
knowledge score was calculated by the “compute” function provided by SPSS before further
analysis. A one-way ANOVA procedure was conducted to text the significant differences for
each attribute based on demographic characteristics of participants. Logistic regression was used
to identify variables that associated with the future consumption intention.

47
References
Buchanan, J. K. (2012). Energy drink consumption (with and without alcohol) and its
relationship to risky behavior, risk awareness, and behavioral intention in college
students.
Creative Research Systems. (2003). Sample Size Calculator. Retrieved
from http://www.surveysystem.com/sscalc.htm.
Kassem, N. O., Lee, J. W., Modeste, N. N., & Johnston, P. K. (2003). Understanding soft drink
consumption among female adolescents using the Theory of Planned Behavior. Health
Education Research, 18(3), 278-291.
Paolacci, G., Chandler, J., & Ipeirotis, P. G. (2010). Running experiments on amazon mechanical
turk. Judgment and Decision making, 5(5), 411-419.
Santos, J. R. A. (1999). Cronbach’s alpha: A tool for assessing the reliability of scales. Journal
of Extension, 37(2), 1-5.
Zoellner, J., Krzeski, E., Harden, S., Cook, E., Allen, K., & Estabrooks, P. A. (2012). Qualitative
application of the theory of planned behavior to understand beverage consumption
behaviors among adults. Journal of the Academy of Nutrition and Dietetics, 112(11),
1774-1784.
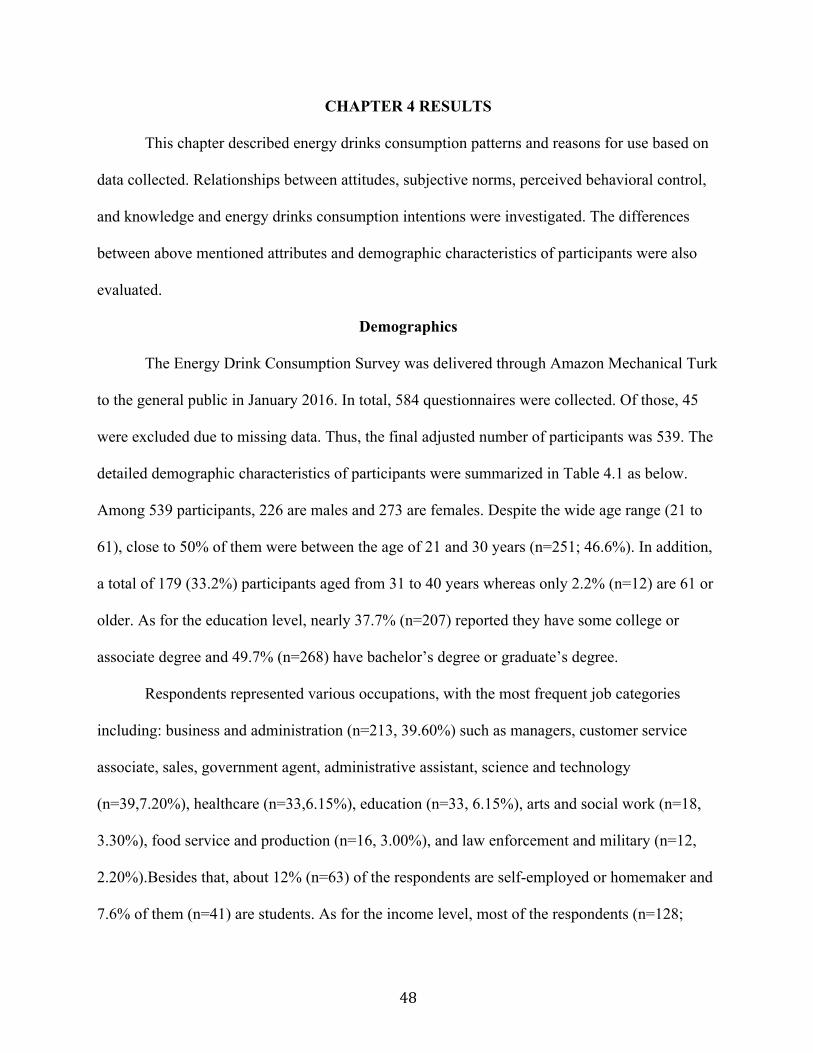
48
CHAPTER 4 RESULTS
This chapter described energy drinks consumption patterns and reasons for use based on
data collected. Relationships between attitudes, subjective norms, perceived behavioral control,
and knowledge and energy drinks consumption intentions were investigated. The differences
between above mentioned attributes and demographic characteristics of participants were also
evaluated.
Demographics
The Energy Drink Consumption Survey was delivered through Amazon Mechanical Turk
to the general public in January 2016. In total, 584 questionnaires were collected. Of those, 45
were excluded due to missing data. Thus, the final adjusted number of participants was 539. The
detailed demographic characteristics of participants were summarized in Table 4.1 as below.
Among 539 participants, 226 are males and 273 are females. Despite the wide age range (21 to
61), close to 50% of them were between the age of 21 and 30 years (n=251; 46.6%). In addition,
a total of 179 (33.2%) participants aged from 31 to 40 years whereas only 2.2% (n=12) are 61 or
older. As for the education level, nearly 37.7% (n=207) reported they have some college or
associate degree and 49.7% (n=268) have bachelor’s degree or graduate’s degree.
Respondents represented various occupations, with the most frequent job categories
including: business and administration (n=213, 39.60%) such as managers, customer service
associate, sales, government agent, administrative assistant, science and technology
(n=39,7.20%), healthcare (n=33,6.15%), education (n=33, 6.15%), arts and social work (n=18,
3.30%), food service and production (n=16, 3.00%), and law enforcement and military (n=12,
2.20%).Besides that, about 12% (n=63) of the respondents are self-employed or homemaker and
7.6% of them (n=41) are students. As for the income level, most of the respondents (n=128;
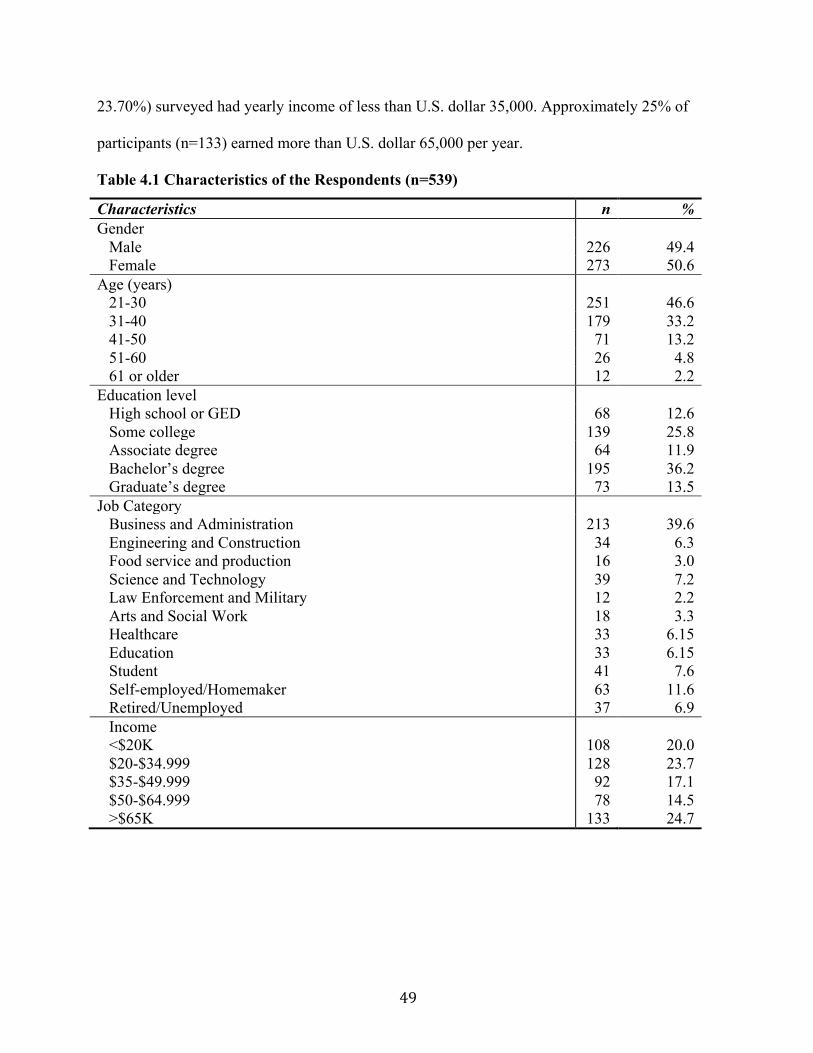
49
23.70%) surveyed had yearly income of less than U.S. dollar 35,000. Approximately 25% of
participants (n=133) earned more than U.S. dollar 65,000 per year.
Table 4.1 Characteristics of the Respondents (n=539)
Characteristics n % Gender
Male 226 49.4 Female 273 50.6
Age (years) 21-30 251 46.6 31-40 179 33.2 41-50 71 13.2 51-60 26 4.8 61 or older 12 2.2
Education level High school or GED 68 12.6 Some college 139 25.8 Associate degree 64 11.9 Bachelor’s degree 195 36.2 Graduate’s degree 73 13.5
Job Category Business and Administration 213 39.6 Engineering and Construction Food service and production Science and Technology Law Enforcement and Military Arts and Social Work Healthcare Education Student Self-employed/Homemaker Retired/Unemployed
34 16 39 12 18 33 33 41 63 37
6.3 3.0 7.2 2.2 3.3
6.15 6.15 7.6
11.6 6.9
Income <$20K $20-$34.999 $35-$49.999 $50-$64.999 >$65K
108 128 92 78
133
20.0 23.7 17.1 14.5 24.7
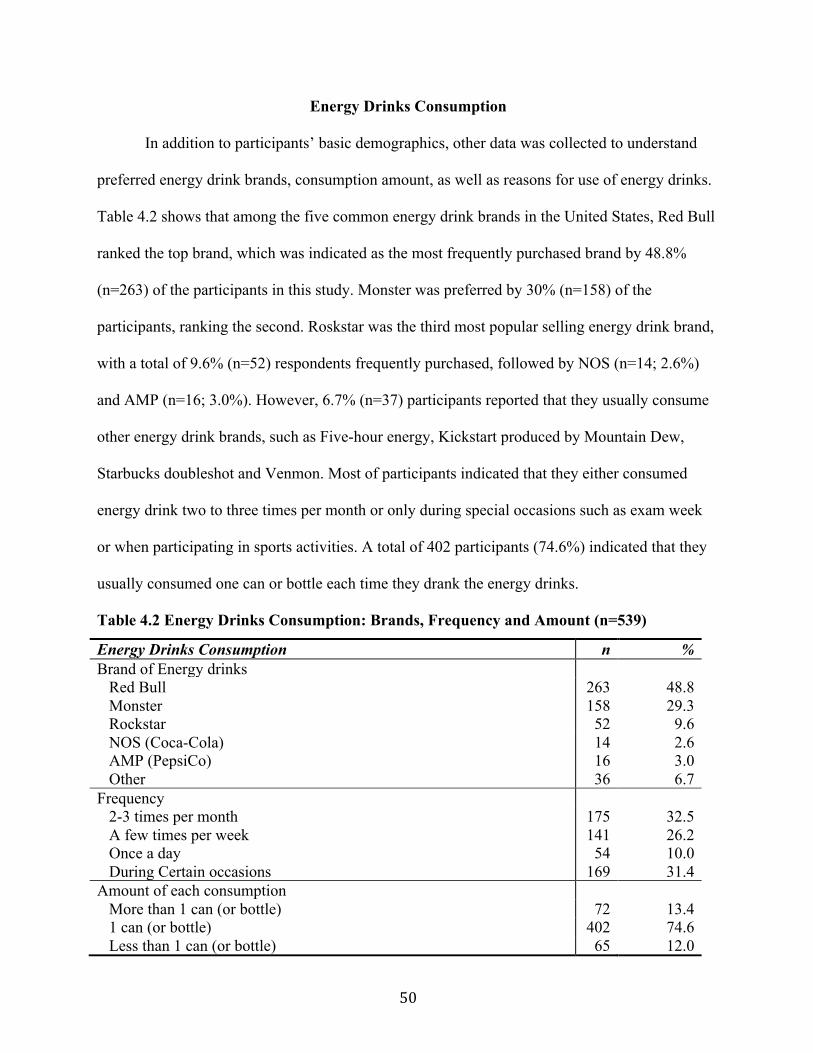
50
Energy Drinks Consumption
In addition to participants’ basic demographics, other data was collected to understand
preferred energy drink brands, consumption amount, as well as reasons for use of energy drinks.
Table 4.2 shows that among the five common energy drink brands in the United States, Red Bull
ranked the top brand, which was indicated as the most frequently purchased brand by 48.8%
(n=263) of the participants in this study. Monster was preferred by 30% (n=158) of the
participants, ranking the second. Roskstar was the third most popular selling energy drink brand,
with a total of 9.6% (n=52) respondents frequently purchased, followed by NOS (n=14; 2.6%)
and AMP (n=16; 3.0%). However, 6.7% (n=37) participants reported that they usually consume
other energy drink brands, such as Five-hour energy, Kickstart produced by Mountain Dew,
Starbucks doubleshot and Venmon. Most of participants indicated that they either consumed
energy drink two to three times per month or only during special occasions such as exam week
or when participating in sports activities. A total of 402 participants (74.6%) indicated that they
usually consumed one can or bottle each time they drank the energy drinks.
Table 4.2 Energy Drinks Consumption: Brands, Frequency and Amount (n=539)
Energy Drinks Consumption n % Brand of Energy drinks
Red Bull Monster Rockstar
263 158 52
48.8 29.3 9.6
NOS (Coca-Cola) AMP (PepsiCo) Other
14 16 36
2.6 3.0 6.7
Frequency 2-3 times per month A few times per week Once a day During Certain occasions
175 141 54
169
32.5 26.2 10.0 31.4
Amount of each consumption More than 1 can (or bottle) 72 13.4 1 can (or bottle) 402 74.6 Less than 1 can (or bottle) 65 12.0
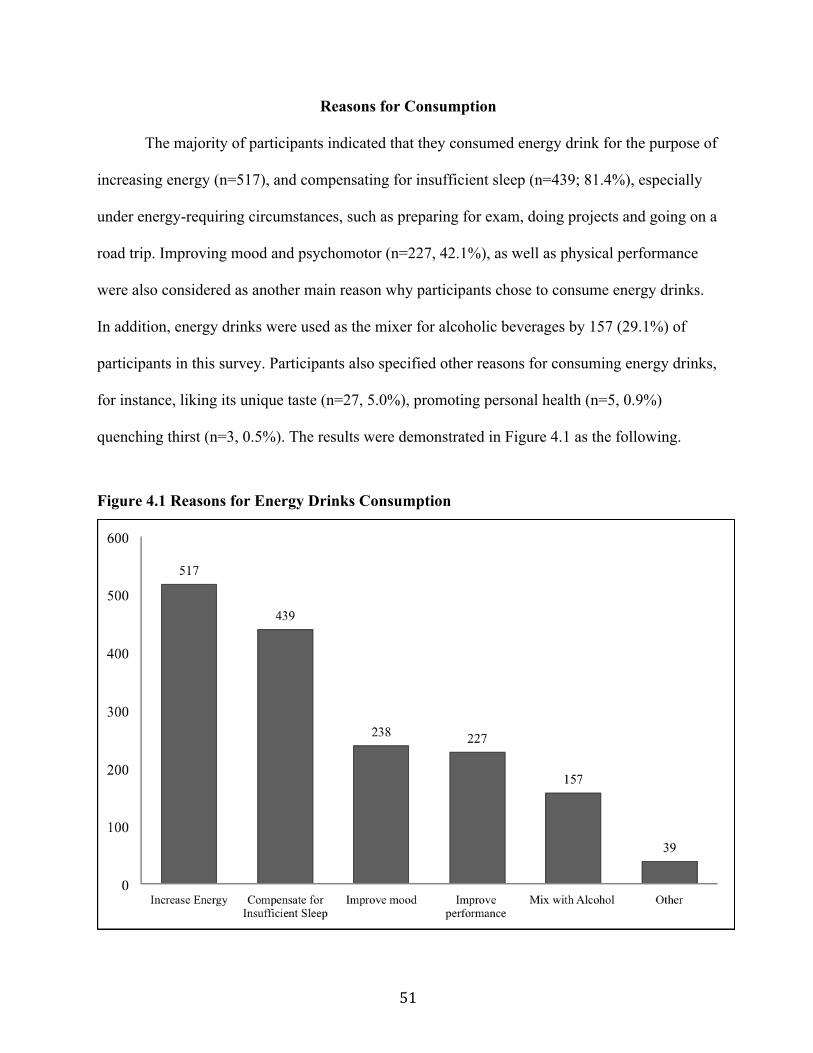
51
Reasons for Consumption
The majority of participants indicated that they consumed energy drink for the purpose of
increasing energy (n=517), and compensating for insufficient sleep (n=439; 81.4%), especially
under energy-requiring circumstances, such as preparing for exam, doing projects and going on a
road trip. Improving mood and psychomotor (n=227, 42.1%), as well as physical performance
were also considered as another main reason why participants chose to consume energy drinks.
In addition, energy drinks were used as the mixer for alcoholic beverages by 157 (29.1%) of
participants in this survey. Participants also specified other reasons for consuming energy drinks,
for instance, liking its unique taste (n=27, 5.0%), promoting personal health (n=5, 0.9%)
quenching thirst (n=3, 0.5%). The results were demonstrated in Figure 4.1 as the following.
Figure 4.1 Reasons for Energy Drinks Consumption
52
Attitudes towards Energy Drink Consumption
All participants were asked to rate their agreement on overall attitude towards energy
drink regarding to whether energy drink is healthy, and also if there was any benefits associated
with consuming energy drink. These ratings were based on a five-point Likert scale, ranging
from 1 being “Disagree” to 5 being “Agree”. Table 4.3 summarizes how strongly participants
agreed that energy drinks is healthy and their perceived benefits of drinking energy drink. The
majority (n=368, 68.7%) of participants either somewhat disagreed or disagreed that energy
drink is healthy. However, as for the benefits of consuming energy drinks, close to 51% (n=196)
of the participants were somewhat agreed that drinking energy drinks could improve their
metabolic rate. Moreover, slightly more than 82% (n=315) and 72% (n=273) of participants
believed that energy drinks improves their attention and mood respectively. In addition, other
benefits such as improving physical, athletic and academic performances were also perceived by
respondents, yet nearly half of them (54.6%, n=209) expressed disagreement with the statement
that energy drinks help body to get hydrated. There is no difference in attitude towards energy
drinks based on demographic characteristics of respondents.
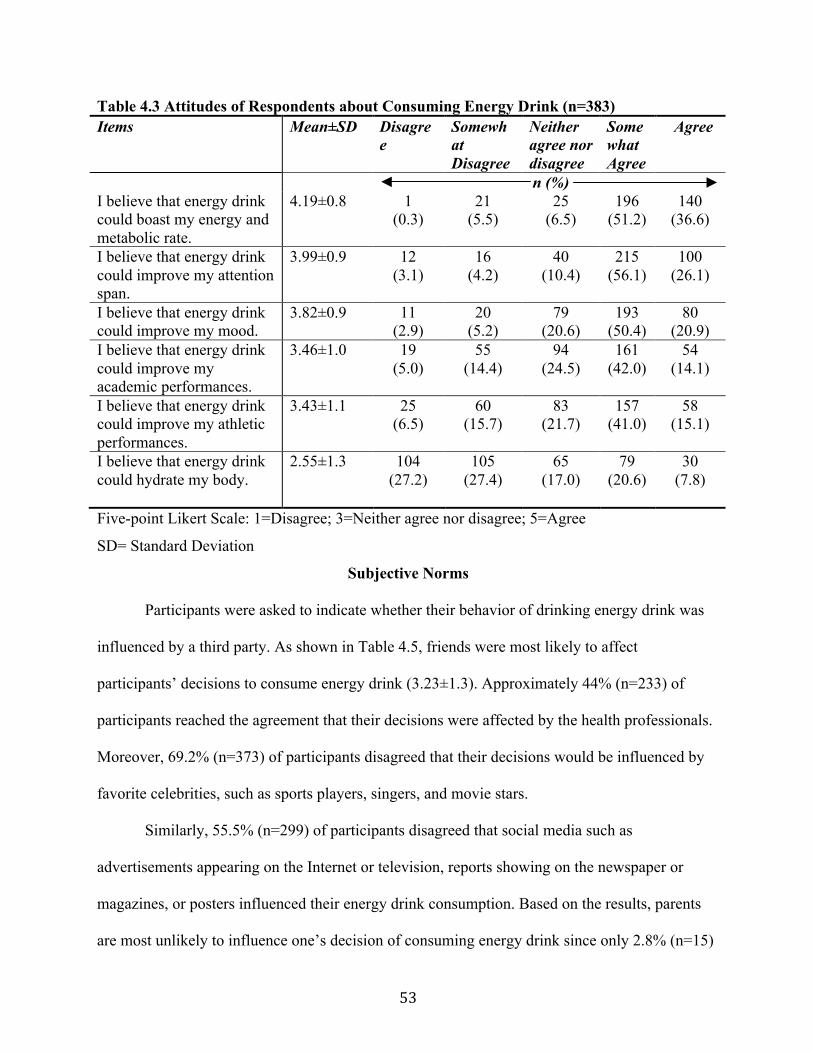
53
Table 4.3 Attitudes of Respondents about Consuming Energy Drink (n=383) Items Mean±SD Disagre
e Somewhat Disagree
Neither agree nor disagree
Somewhat Agree
Agree
n (%) I believe that energy drink could boast my energy and metabolic rate.
4.19±0.8 1 (0.3)
21 (5.5)
25 (6.5)
196 (51.2)
140 (36.6)
I believe that energy drink could improve my attention span.
3.99±0.9 12 (3.1)
16 (4.2)
40 (10.4)
215 (56.1)
100 (26.1)
I believe that energy drink could improve my mood.
3.82±0.9 11 (2.9)
20 (5.2)
79 (20.6)
193 (50.4)
80 (20.9)
I believe that energy drink could improve my academic performances.
3.46±1.0 19 (5.0)
55 (14.4)
94 (24.5)
161 (42.0)
54 (14.1)
I believe that energy drink could improve my athletic performances.
3.43±1.1 25 (6.5)
60 (15.7)
83 (21.7)
157 (41.0)
58 (15.1)
I believe that energy drink could hydrate my body.
2.55±1.3
104
(27.2)
105 (27.4)
65 (17.0)
79 (20.6)
30 (7.8)
Five-point Likert Scale: 1=Disagree; 3=Neither agree nor disagree; 5=Agree
SD= Standard Deviation
Subjective Norms
Participants were asked to indicate whether their behavior of drinking energy drink was
influenced by a third party. As shown in Table 4.5, friends were most likely to affect
participants’ decisions to consume energy drink (3.23±1.3). Approximately 44% (n=233) of
participants reached the agreement that their decisions were affected by the health professionals.
Moreover, 69.2% (n=373) of participants disagreed that their decisions would be influenced by
favorite celebrities, such as sports players, singers, and movie stars.
Similarly, 55.5% (n=299) of participants disagreed that social media such as
advertisements appearing on the Internet or television, reports showing on the newspaper or
magazines, or posters influenced their energy drink consumption. Based on the results, parents
are most unlikely to influence one’s decision of consuming energy drink since only 2.8% (n=15)
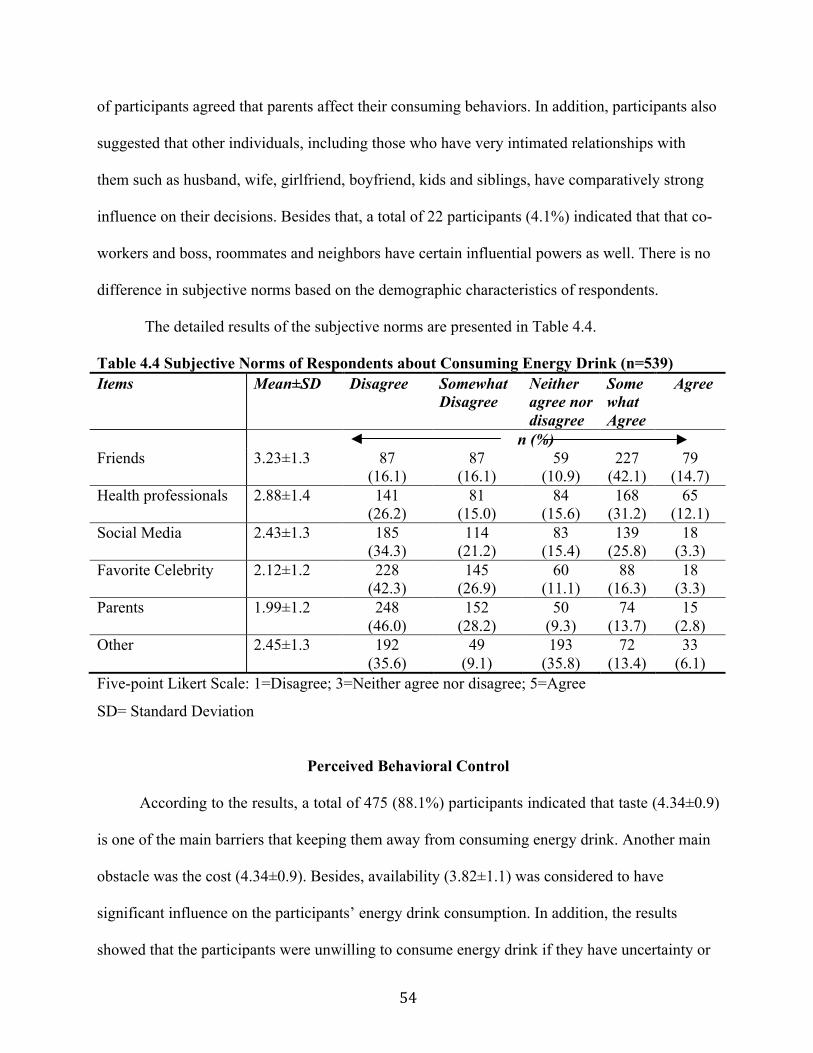
54
of participants agreed that parents affect their consuming behaviors. In addition, participants also
suggested that other individuals, including those who have very intimated relationships with
them such as husband, wife, girlfriend, boyfriend, kids and siblings, have comparatively strong
influence on their decisions. Besides that, a total of 22 participants (4.1%) indicated that that co-
workers and boss, roommates and neighbors have certain influential powers as well. There is no
difference in subjective norms based on the demographic characteristics of respondents.
The detailed results of the subjective norms are presented in Table 4.4.
Table 4.4 Subjective Norms of Respondents about Consuming Energy Drink (n=539) Items Mean±SD Disagree Somewhat
Disagree Neither agree nor disagree
Somewhat Agree
Agree
n (%) Friends 3.23±1.3 87
(16.1) 87
(16.1) 59
(10.9) 227
(42.1) 79
(14.7) Health professionals 2.88±1.4 141
(26.2) 81
(15.0) 84
(15.6) 168
(31.2) 65
(12.1) Social Media
2.43±1.3
185 (34.3)
114 (21.2)
83 (15.4)
139 (25.8)
18 (3.3)
Favorite Celebrity 2.12±1.2 228 (42.3)
145 (26.9)
60 (11.1)
88 (16.3)
18 (3.3)
Parents 1.99±1.2 248 (46.0)
152 (28.2)
50 (9.3)
74 (13.7)
15 (2.8)
Other 2.45±1.3 192 (35.6)
49 (9.1)
193 (35.8)
72 (13.4)
33 (6.1)
Five-point Likert Scale: 1=Disagree; 3=Neither agree nor disagree; 5=Agree
SD= Standard Deviation
Perceived Behavioral Control
According to the results, a total of 475 (88.1%) participants indicated that taste (4.34±0.9)
is one of the main barriers that keeping them away from consuming energy drink. Another main
obstacle was the cost (4.34±0.9). Besides, availability (3.82±1.1) was considered to have
significant influence on the participants’ energy drink consumption. In addition, the results
showed that the participants were unwilling to consume energy drink if they have uncertainty or
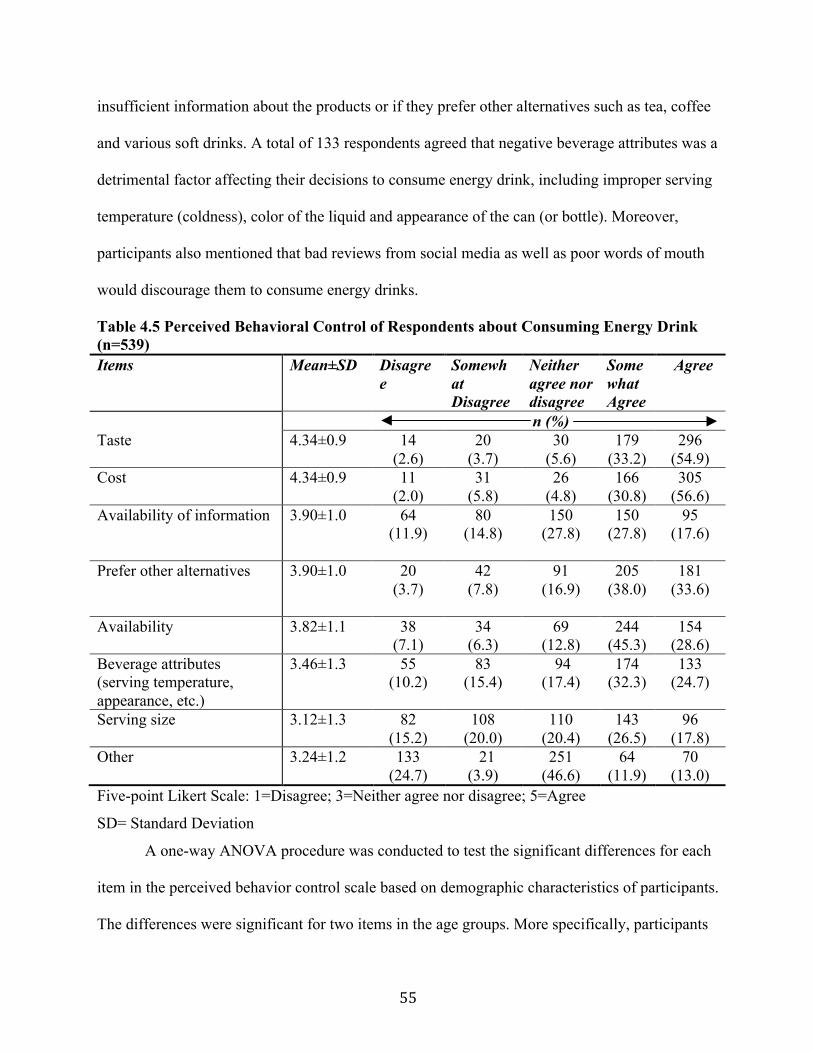
55
insufficient information about the products or if they prefer other alternatives such as tea, coffee
and various soft drinks. A total of 133 respondents agreed that negative beverage attributes was a
detrimental factor affecting their decisions to consume energy drink, including improper serving
temperature (coldness), color of the liquid and appearance of the can (or bottle). Moreover,
participants also mentioned that bad reviews from social media as well as poor words of mouth
would discourage them to consume energy drinks.
Table 4.5 Perceived Behavioral Control of Respondents about Consuming Energy Drink (n=539) Items Mean±SD Disagre
e Somewhat Disagree
Neither agree nor disagree
Somewhat Agree
Agree
n (%) Taste 4.34±0.9 14
(2.6) 20
(3.7) 30
(5.6) 179
(33.2) 296
(54.9) Cost 4.34±0.9
11
(2.0) 31
(5.8) 26
(4.8) 166
(30.8) 305
(56.6) Availability of information 3.90±1.0
64
(11.9)
80 (14.8)
150 (27.8)
150 (27.8)
95 (17.6)
Prefer other alternatives
3.90±1.0
20
(3.7) 42
(7.8)
91 (16.9)
205 (38.0)
181 (33.6)
Availability 3.82±1.1 38
(7.1) 34
(6.3) 69
(12.8) 244
(45.3) 154
(28.6) Beverage attributes (serving temperature, appearance, etc.)
3.46±1.3 55 (10.2)
83 (15.4)
94 (17.4)
174 (32.3)
133 (24.7)
Serving size 3.12±1.3 82 (15.2)
108 (20.0)
110 (20.4)
143 (26.5)
96 (17.8)
Other
3.24±1.2
133
(24.7) 21 (3.9)
251 (46.6)
64 (11.9)
70 (13.0)
Five-point Likert Scale: 1=Disagree; 3=Neither agree nor disagree; 5=Agree
SD= Standard Deviation
A one-way ANOVA procedure was conducted to test the significant differences for each
item in the perceived behavior control scale based on demographic characteristics of participants.
The differences were significant for two items in the age groups. More specifically, participants
56
aged from 21 to 30 years old considered availability as one of the barriers (3.88 ± 1.1), yet elder
respondents at 61 or older did not (2.83 ± 1.5, p <. 05). In addition, compared to young adults at
an age group of 21 to 30, participants at 51 to 61 showed that they preferred to consume other
drinks instead of energy drinks (4.27 ± 1.0, p <. 05). Moreover, participants at 41 to 50 age group
indicated agreed more that improper serving size, such as improper size (3.48±1.3) was barrier
for consuming energy drinks than younger participants in the 21 to 30 age group (3.03± 1.3).
Knowledge
To assess the knowledge of participants about energy drinks, they were asked to answer a
series of questions (shown as Table 4.6) related to energy drink, such as ingredients of energy
drink, as well as their functions and regulation policies about energy drink products. The
maximum knowledge score was nine points. As presented in Table 4.8, the highest score by the
entire participant was eight points, while the lowest score was zero point. The average score was
4.63±1.30, with 45.3% of participants (n=150) and 31.2% (n=168) have a total knowledge scores
of 4 points and 5 points respectively. A total of 467 (86.6%) participants provided correct answer
for “Energy drinks decrease human metabolic rate”, indicating they have basic knowledge of
functions of energy drinks. However, 70.5% (n=380) of participants provided a wrong answer
for “Food and Drug Administration has no regulation for caffeine content in energy drinks”,
indicating that participants were unfamiliar with the regulation policies of energy drink products.
The participants were also asked to select the top three active ingredients in an energy drink. A
large number of participants were able to correctly select one or two items out of seven items
provided but not all three of the active ingredients, including caffeine, taurine, and guarana. Thus
only 7.2% (n=40) of the participants answered all three ingredients correctly. The last question
examined the main function of caffeine in energy drink. Based on the results, about 95% (n=511)
participants were able of identifying the main function of caffeine in energy drinks.
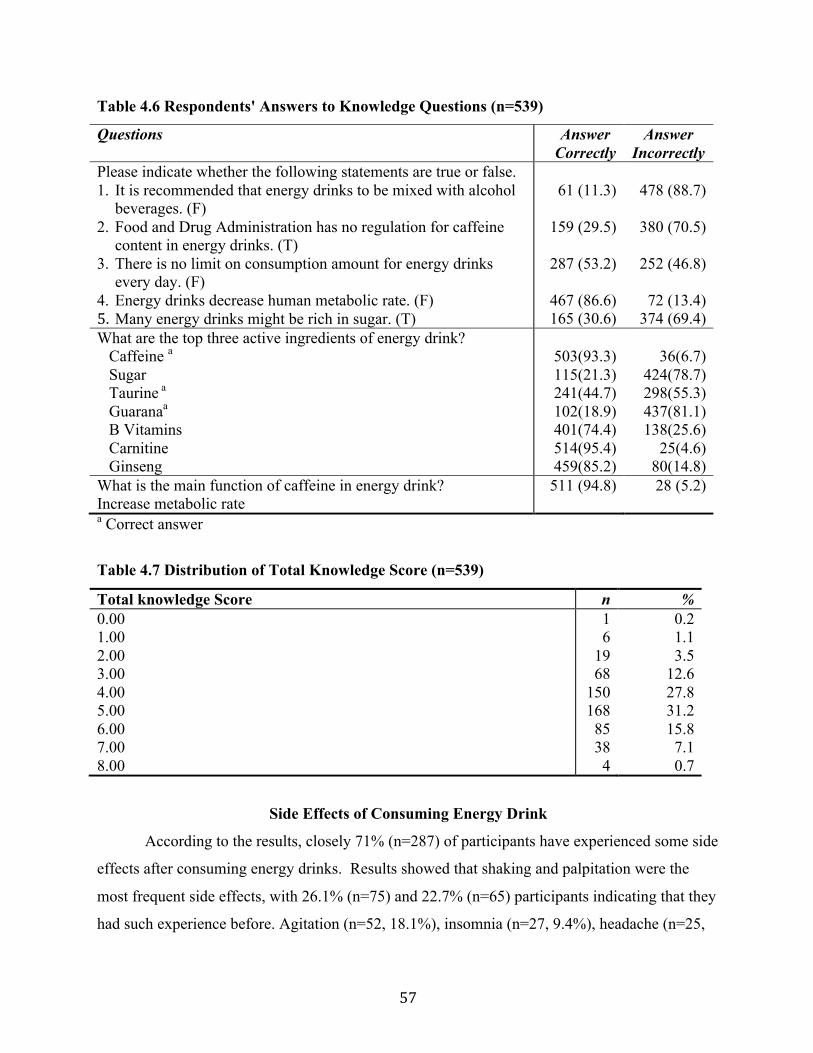
57
Table 4.6 Respondents' Answers to Knowledge Questions (n=539)
Questions Answer Correctly
Answer Incorrectly
Please indicate whether the following statements are true or false. 1. It is recommended that energy drinks to be mixed with alcohol
beverages. (F) 2. Food and Drug Administration has no regulation for caffeine
content in energy drinks. (T) 3. There is no limit on consumption amount for energy drinks
every day. (F) 4. Energy drinks decrease human metabolic rate. (F) 5. Many energy drinks might be rich in sugar. (T)
61 (11.3)
159 (29.5)
287 (53.2)
467 (86.6) 165 (30.6)
478 (88.7)
380 (70.5)
252 (46.8)
72 (13.4)
374 (69.4) What are the top three active ingredients of energy drink?
Caffeine a Sugar
Taurine a Guaranaa B Vitamins Carnitine
Ginseng
503(93.3) 115(21.3) 241(44.7) 102(18.9) 401(74.4) 514(95.4) 459(85.2)
36(6.7)
424(78.7) 298(55.3) 437(81.1) 138(25.6)
25(4.6) 80(14.8)
What is the main function of caffeine in energy drink? Increase metabolic rate
511 (94.8) 28 (5.2)
a Correct answer
Table 4.7 Distribution of Total Knowledge Score (n=539)
Total knowledge Score n % 0.00 1.00 2.00 3.00 4.00 5.00 6.00 7.00 8.00
1 6
19 68
150 168 85 38 4
0.2 1.1 3.5
12.6 27.8 31.2 15.8 7.1 0.7
Side Effects of Consuming Energy Drink
According to the results, closely 71% (n=287) of participants have experienced some side
effects after consuming energy drinks. Results showed that shaking and palpitation were the
most frequent side effects, with 26.1% (n=75) and 22.7% (n=65) participants indicating that they
had such experience before. Agitation (n=52, 18.1%), insomnia (n=27, 9.4%), headache (n=25,
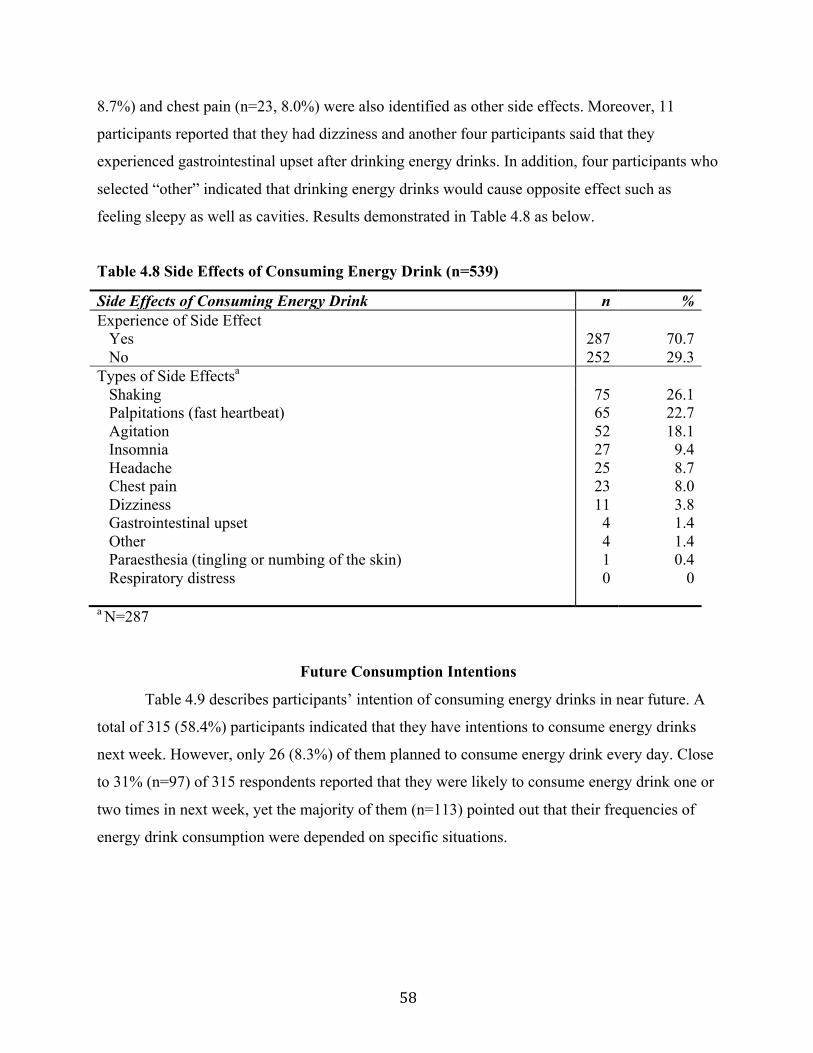
58
8.7%) and chest pain (n=23, 8.0%) were also identified as other side effects. Moreover, 11
participants reported that they had dizziness and another four participants said that they
experienced gastrointestinal upset after drinking energy drinks. In addition, four participants who
selected “other” indicated that drinking energy drinks would cause opposite effect such as
feeling sleepy as well as cavities. Results demonstrated in Table 4.8 as below.
Table 4.8 Side Effects of Consuming Energy Drink (n=539)
Side Effects of Consuming Energy Drink n % Experience of Side Effect
Yes No
287 252
70.7 29.3
Types of Side Effectsa Shaking
Palpitations (fast heartbeat) Agitation Insomnia Headache Chest pain Dizziness Gastrointestinal upset Other Paraesthesia (tingling or numbing of the skin) Respiratory distress
75 65 52 27 25 23 11 4 4 1 0
26.1 22.7 18.1 9.4 8.7 8.0 3.8 1.4 1.4 0.4
0
a N=287
Future Consumption Intentions
Table 4.9 describes participants’ intention of consuming energy drinks in near future. A
total of 315 (58.4%) participants indicated that they have intentions to consume energy drinks
next week. However, only 26 (8.3%) of them planned to consume energy drink every day. Close
to 31% (n=97) of 315 respondents reported that they were likely to consume energy drink one or
two times in next week, yet the majority of them (n=113) pointed out that their frequencies of
energy drink consumption were depended on specific situations.
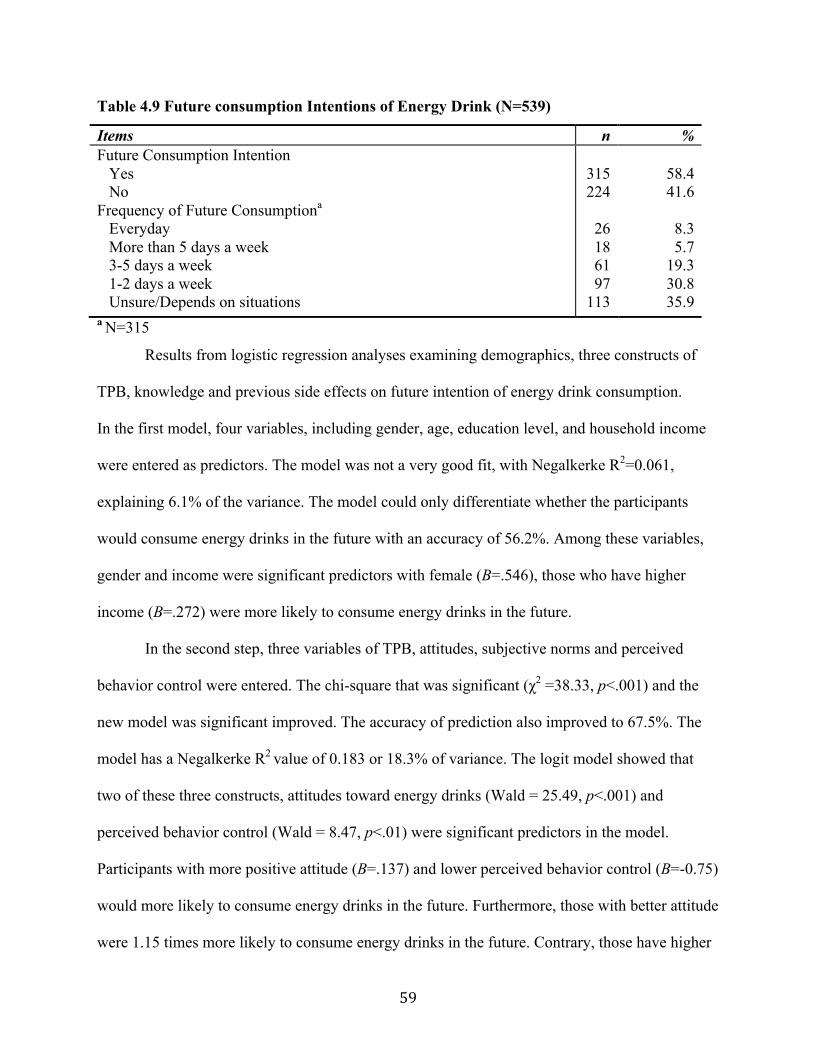
59
Table 4.9 Future consumption Intentions of Energy Drink (N=539)
Items n % Future Consumption Intention
Yes No
Frequency of Future Consumptiona
Everyday More than 5 days a week 3-5 days a week 1-2 days a week Unsure/Depends on situations
315 224
26 18 61 97
113
58.4 41.6
8.3 5.7
19.3 30.8 35.9
a N=315
Results from logistic regression analyses examining demographics, three constructs of
TPB, knowledge and previous side effects on future intention of energy drink consumption.
In the first model, four variables, including gender, age, education level, and household income
were entered as predictors. The model was not a very good fit, with Negalkerke R2=0.061,
explaining 6.1% of the variance. The model could only differentiate whether the participants
would consume energy drinks in the future with an accuracy of 56.2%. Among these variables,
gender and income were significant predictors with female (B=.546), those who have higher
income (B=.272) were more likely to consume energy drinks in the future.
In the second step, three variables of TPB, attitudes, subjective norms and perceived
behavior control were entered. The chi-square that was significant (χ2 =38.33, p<.001) and the
new model was significant improved. The accuracy of prediction also improved to 67.5%. The
model has a Negalkerke R2 value of 0.183 or 18.3% of variance. The logit model showed that
two of these three constructs, attitudes toward energy drinks (Wald = 25.49, p<.001) and
perceived behavior control (Wald = 8.47, p<.01) were significant predictors in the model.
Participants with more positive attitude (B=.137) and lower perceived behavior control (B=-0.75)
would more likely to consume energy drinks in the future. Furthermore, those with better attitude
were 1.15 times more likely to consume energy drinks in the future. Contrary, those have higher
60
barriers were slightly less likely (odd ratio= 0.93) to consume energy drinks in the future. In
addition, income was detected to have significant influence on consumption intentions in this
step, indicating those who have higher income (B=.83) were more likely to consume energy
drinks in near future.
In the third model, two other variables, knowledge scores and past experience of having
side effects ensued consuming energy drinks were entered. These two variables have
insignificant contribution to the entire model (p=.82), even though the entire model was
significant (p<.001).
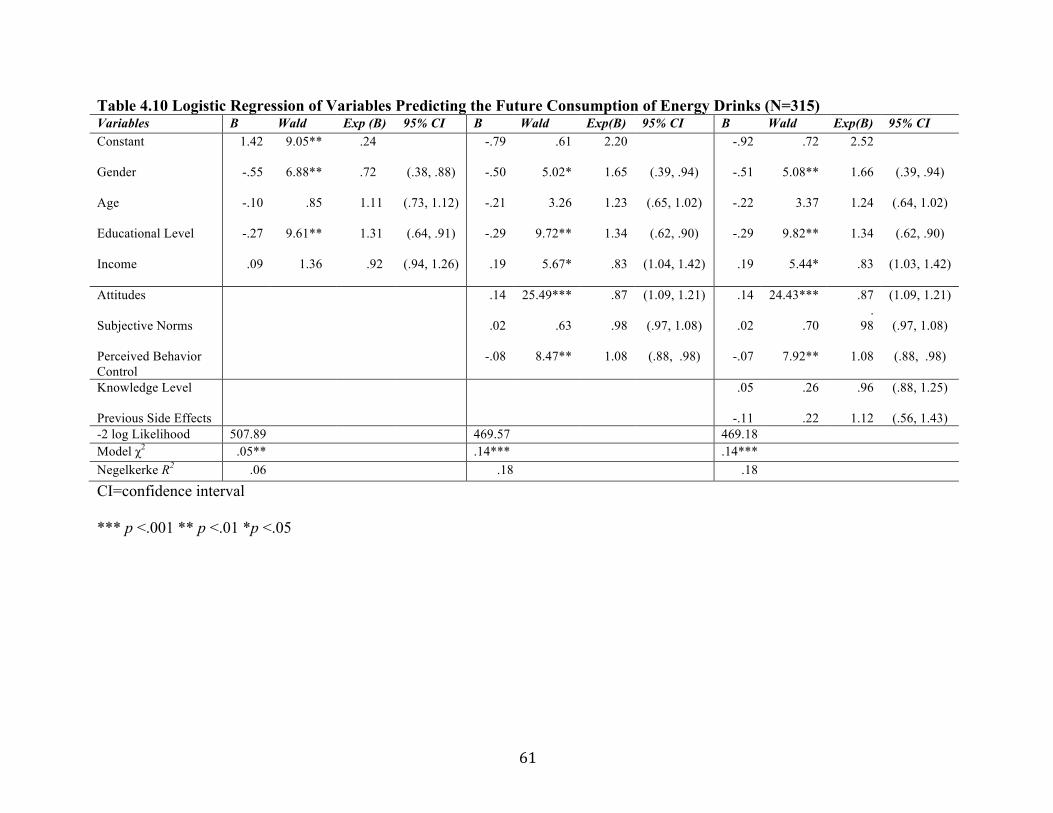
61
Table 4.10 Logistic Regression of Variables Predicting the Future Consumption of Energy Drinks (N=315) Variables B Wald Exp (B) 95% CI B Wald Exp(B) 95% CI B Wald Exp(B) 95% CI Constant Gender Age Educational Level Income
1.42
-.55
-.10
-.27
.09
9.05**
6.88**
.85
9.61**
1.36
.24 .72 1.11 1.31 .92
(.38, .88)
(.73, 1.12)
(.64, .91)
(.94, 1.26)
-.79
-.50
-.21
-.29
.19
.61
5.02*
3.26
9.72**
5.67*
2.20
1.65
1.23
1.34
.83
(.39, .94)
(.65, 1.02)
(.62, .90)
(1.04, 1.42)
-.92
-.51
-.22
-.29
.19
.72
5.08**
3.37
9.82**
5.44*
2.52
1.66
1.24
1.34
.83
(.39, .94)
(.64, 1.02)
(.62, .90)
(1.03, 1.42)
Attitudes Subjective Norms Perceived Behavior Control
.14
.02
-.08
25.49***
.63
8.47**
.87
.98
1.08
(1.09, 1.21) (.97, 1.08)
(.88, .98)
.14
.02
-.07
24.43***
.70
7.92**
.87 .
98
1.08
(1.09, 1.21)
(.97, 1.08)
(.88, .98)
Knowledge Level Previous Side Effects
.05
-.11
.26
.22
.96
1.12
(.88, 1.25)
(.56, 1.43) -2 log Likelihood 507.89 469.57 469.18 Model χ2 .05** .14*** .14*** Negelkerke R2 .06 .18 .18
CI=confidence interval *** p <.001 ** p <.01 *p <.05
62
CHAPTER 5 DISCUSSION AND IMPLICATIONS
The purpose of this study was to investigate factors affecting consumption intentions of
energy drinks based on Extended Theory of Planned Behavior. This discussion section compared
the results of current study with similar studies previously conducted by other researchers and
also discussed the theoretical and practical implications of the study.
Discussion of Results
The participants of this study revealed that energy drinks consumption was more
prevalent among young adults and slightly more popular in females (n=273, 50.6%) than males
(n=226, 49.4%). The most frequently consumed energy drink brands reported were: Red Bull
(48.8%), Monster (29.3%) and Rockstar (9.6%). These findings are consistent with previous
studies (Brenda et al., 2007; Cayley et al., 2012). For example, Cayley et al. (2012) reported that
nearly 40% of 585 college students (n=234) consuming energy drinks in the past month and the
most common energy drink brands selected by the participants were Red Bull (18.6%), Monster
(18.1%), Rockstar (9.8%), AMP (8.1%) and 5-h energy (7.8%). Also, Brenda et al. (2007)
pointed out that about 51% of 496 participants aging from 21 to 25 years old consumed more
than one energy drinks each month.
Although evidence is lacking on explaining why Red Bull is more popular than other
brands, but Red Bull seems to be very successful in implementing appropriate marketing
strategies, such as precisely targeting their primary customers and promoting their products
through various social media platforms including YouTube, Facebook, Twitter and Instagram. It
also carefully design its distribution and communication strategies and do things differently
compared to its competitors (Mint Innovation, n.d.). In addition, Red Bull also demonstrates its
general sprit of being active and energetic by sponsoring extreme sporting events and athletes all
63
over the world as well as establishing a research foundation called Wings for Life to support
spinal cord research (Mint Innovation, n.d.). Future studies could explore and compare marketing
strategies for each of energy drinks companies to understand which techniques are the most cost-
effective ways to gain popularity and market shares.
Because of the amounts and types of active ingredients, such as caffeine, taurine,
guarana, ginseng and B vitamins in the products, energy drinks are especially effective in
boasting energy and stimulating human metabolic rates. Individuals consume energy drinks for
various reasons and under different circumstances. Previous studies conducted among college
students suggested that, the majority of students (67%) consumed energy drinks in order to
compensate for insufficient sleep and about 65% of energy drink users in college drank energy
drinks when they needed extra energy (Brenda et al., 2007). Results from this study were
consistent with previous findings, indicating that increasing energy (n=517) and compensating
for insufficient sleep (n=439) were the main reasons for participants to consume energy drinks.
In addition to this, many researches examined the effects of energy drinks on
psychomotor and athletic performance. Alford et al. (2001) provided clinical evidences that Red
Bull energy drink brought positive effects on participants’ physical performance. This particular
brand of energy drinks also enhanced both aerobic and anaerobic endurance and improved
mental performance, cognitive level and alertness (Alford et al., 2001). In this study, a total
number of 465 participants also pointed out that they consumed energy drinks to improve mood
as well as athletic performances. Moreover, a few participants (n=157) indicated that they would
mix energy drinks with other alcoholic beverages. Similarly, Malinauskas et al. (2007) found that
approximately 54% of energy drink consumers (n=268) reported drinking energy drinks mixed
with alcohol, with nearly 49% of them used more than three energy drinks per occasion. Notably,
64
college students were found to be frequent users who ingest energy drinks with alcohol. In a
survey conducted with 496 college students, about 27% of participants reported mixing alcohol
and energy drinks in the past month (Chad, 2008). Mixing energy drinks with alcohol was
associated with alcohol dependence (Arria et al., 2011) and greater amount of alcohol
consumption (Peacock et al., 2013), resulting in injuries and hurts caused risky behaviors. The
practice of mixing energy drinks with alcohol seems to be common, despite the fact that this
practice is not encouraged. This might be due to the lack of education, knowledge, and
regulatory requirements by the government. Regulation of energy drinks such as content labeling
and health warnings vary across the countries worldwide. For example, according to
australianbeverages.org, energy drinks are regulated by the Australia New Zealand Food
Standards Code and are abided to the same regulations as the formulated caffeinated beverages
The code specifies maximum levels of substances can be added to an energy drink and also states
that a formulated caffeinated beverage must not be mixed with a non-alcoholic soft drink to form
a product.
Furthermore, Australia also has specific labeling requirements, stating that declarations of
the average quantities, per serving size and per 100mL, of caffeine must be posted. Additionally,
it must be stated that the drinks are not recommended for children, pregnant or lactating women,
or caffeine sensitive persons. In Canada, energy drinks are classified and regulated as
conventional food products under the Food and Drugs Act and Food and Drug Regulations.
Other countries such as Norway, Uruguay and Denmark have even banned Red Bull because of
its negative health effects.
However, a fact sheet provided by Francis King Carey School of Law at University of
Maryland points out that U.S. Food and Drug Administration (FDA) does not require but
65
encourage manufacturers to disclose the amount of caffeine, the primary active ingredient in
energy drinks, in their products. Although Red Bull indicates that it voluntarily places the
caffeine content on its products, for other manufactures, this action is voluntary. Moreover, The
FDA does not currently regulate other ingredients frequently used in energy drinks, so levels of
these ingredients may vary between brands. Since the United States is the largest market for
energy drinks in the word, the federal agencies such as Food and Drug Administrations (FDA)
should address the potential risks of combining energy drinks with alcohol. Existing clinical
evidences suggested that consumers should restrict their combined guarana and caffeine intake to
less than 300 mg per day to avoid harmful effects (Clauson, 2008). Similarly, future clinical
researches could focus on figuring out the proper amount of energy drinks that could be used to
mix with alcohol. In addition, while energy drinks are safe for the majority of consumers when
used in moderation, the high caffeine content causes serious health risks for certain populations
include pregnant or lactating women, patients with diabetes, peptic ulcer disease, or pre-existing
cardiovascular conditions, such as hypertension and congestive heart failure. Thus, a health
warning should be place on the products to limit vulnerable populations to consumer energy
drinks.
Researchers have devoted much effort in investigating the relationships between attitudes
and food choice. Research showed that both an individual’s personal attitudes and environmental
factors affected the food choice of individuals (Urala, & Lähteenmäki, 2004). Additionally, Nina
and Liisa conducted a study to quantify the attitudes behind consumers’ willingness to use
functional foods. They concluded that the perceived reward from using functional food and the
confidence in functional foods were the most significant factors to determine consumers'
willingness to use functional foods (Nina & Liisa, 2004). In this study, participants were asked to
66
indicate their opinions of whether energy drinks are healthy and their attitudes towards the
perceived rewards from consuming energy drinks. Overall, they had slightly positive attitudes
towards energy drinks (3.6±0.7). Participants demonstrated more positive attitudes toward
certain perceived rewards, for example, increase energy and metabolic rate (4.19±0.8), improve
attention (3.99±0.9), and mood (3.82±0.9). Positive attitudes were showed to positively influence
consumers’’ purchasing intentions by Vermeir and Verbeke in their study titled “Sustainable
Food Consumption: Exploring the Consumer ‘attitude–behavioral intention’ Gap” (Vermeir &
Verbeke 2006). Their study concluded that consumers holding more positive attitudes tended to
have higher involvement and less uncertainty towards sustainable food. They also were more
likely to have intentions to purchase the products. Thus, by recognizing consumers’ attitude
towards to energy drinks, manufacturers can effectively promote their products. About 69% of
the participants (n=368) in this research indicated that they either somewhat disagreed or
disagreed with the statement “I think energy drinks are healthy”. Based on this fact, this is
imperative to identify variables that affect consumers’ attitudes and the relationship between
attitudes and tangible outcome (i.e., actual consumption).
Result from logistic regression was correspondent with previous studies, suggesting that
participants with positive attitudes were more likely to consume energy drinks in the future. As
suggested by previous studies (Nina & Liisa, 2004; Shepherd, 1990), in order to recognize
consumers’ attitudes in depth, future studies could examine consumers’ confidence in energy
drink products by asking how individuals trust the information and how strongly they believe in
the scientific basis of promised health effects of energy drinks. Also, people might hold different
attitudes under specific circumstances such as in special occasions or sports events, thus other
studies could investigate necessity for energy drinks perceived by consumers.
67
This study found that friends, followed by health professional and social media, were
most likely to influence consumers’ decisions of consuming energy drinks. Miller et al. (2001)
concluded that young people tended to eat with friends rather than eating at home, and therefore
their food choice were influenced by their friends. Besides, many participants also identified that
health professionals play very crucial roles in influencing their decisions of consuming energy
drinks. Similarly, as indicated by The European Food Information Council, the level of education
and suggestions provided by physicians and heath professionals can affect dietary behaviors
during adulthood (Kearney et al., 2000). Based on this conclusion, health professionals should
convey accurate and consistent messages of potential benefits and detrimental effects of energy
drink products, as well as recommended amounts and precautions through social media, such as
television, radio, magazine, newspaper, food packaging and advertisement.
Several studies reported that adolescents’ choices of food were largely influenced by
parents (Story et al., 2002; Kirk & Gillespie, 1990). Researchers further explained that the
influence of parents on adolescents’ food consumption behavior was important because parents
provide a home environment for teenage children (Kirk & Gillespie, 1990) and they also acted as
role models to the children (Feunekes et al., 1998). In addition, parents determined the cooking
and eating behaviors at home such as foods and snacks to purchase and the frequency of dining
out (Frank, 1997). Therefore, the involvement of parents in adopting healthy eating behavior
among adolescents is very important. However, parents were found to have least influence on
consumption behavior in this study. Possible reason could be because the sample populations in
this research were all adults above 21, and thus they were considered as more independent than
adolescents.
68
Previous researches related to beverage consumption revealed that many barriers could
influence consumption patterns of the customers. For example, Nada et al. (2003) conducted two
studies with male adolescents and female adolescents respectively regarding to soft drink
consumption by using the Theory of Planned Behavior in 2003. Their results suggested that lack
of availability, high cost and insufficient knowledge about the health risks of products were
identified as main barriers by female adolescents to consume soft drinks, whereas limited
availability and no interest to try the products due to poor marketing methods were perceived as
barriers by male adolescents (Nada et al., 2003).
This research reported that poor taste, high cost, uncertainty or lack of information and
limited availability were the main obstacles for participants to consume energy drinks. Thus, the
research and development (R&D) team of the energy drink companies should devote into
improving the taste of the energy drinks. To address the concern of lack of information, the
Public Relations (PR) of the energy drink companies should work with media to build brand
awareness and favorable images among the public. They should also communicate with content
of the information available to public relevant and credible. To remove the barrier about limited
availability, the energy drink companies need to identify the right place to sell the products, for
instance report showed that many convenience stores, quick-service restaurants, and fast-food
chains (e.g., Carl’s Junior and Hardee’s) would be adding energy drinks to their menus (Barrie,
2016).
The marketing department should also implement more strategic marketing strategies to
attract more customers through various channels, with one of the common one being social
media The 2013 Green Hasson Janks Food & Beverage Industry Survey showed that majority of
the executive staff reported that social media have significant impacts on their businesses and

69
nearly 50% of them said that they used social media to gather customer feedback and engage
consumers (Todd et al., 2013). Statistics showed that as of September 2014, approximately 71%
of online adults use Facebook, 28% of online adults use Pinterest and 26% use Instagram. Also,
nearly 41% of adult Internet users take photos or videos that they have found online and repost
them for sharing images with many people (Duggan & Brenner, 2013). Thus, energy drink
companies could take advantages of social media for their product promotions.
An energy drink consumption study conducted among medical students at Marmara
University Medical School showed that knowledge about the ingredients and health risks of
energy drinks among these students was unsatisfactory (Seyhan et al., 2011). The researchers
claimed that the medical students were thought to have more knowledge about nutrition and
health, and therefore should have better knowledge scores about energy drinks, but their
assumptions were not supported. It was not surprising that the average knowledge score of the
participants in this study was 4.63±1.30 with the highest possible score of 9 points. Overall, the
results showed that the majority of the participants demonstrated a low to medium knowledge
level about energy drinks. More specifically, the vast majority of participants (n=478) agreed
that energy drinks could be mixed with alcohol beverages, which is considered as an
inappropriate way to consume energy drinks. About 70%of the participants were unaware of the
high content of sugar in energy drinks. Misunderstanding this fact could cause false assumptions
about the healthfulness of the consuming energy drinks. Hence, this study suggests that there is a
potential need to increase awareness of general consumers in order to eliminate their uncertainty
of the products.
This study showed that among three attributes of the Theory of Planned Behavior,
attitudes toward energy drinks was the strongest predictor of intention to consume energy drinks,

70
followed by perceived behavioral control. However, subjective norms were not a significant
predictor in the model. This finding was consistent with a previous study which suggested that
attitude, subjective norms, and perceived behavioral control were each significant of intention to
drink soda as well as together showed 61% of its variance (Nada et al., 2003). Although Sohyun
et al., 2013 showed that knowledge about sugar sweetened beverages was significantly
associated with sugar sweetened beverages intake, this study did not have enough evidence to
support that knowledge could have influence on future consumption intention of energy drinks.
No significant relationship between past experience and consumption intentions was found in
this study. However, no previous research has investigated the relationship between past
experience of side effects and future consumption intentions specifically on energy drinks.
Future studies could investigate these variables more in depth to identify any possible
relationship between them.
As for the demographic characteristics, the result suggested that gender (P<. 01),
educational level (P<. 01) and income (P<. 05) were all associated with future consumption
intention. Similarity, previous study confirmed that gender, age, education, economic factors and
general knowledge were found to have influence on organic food consumption (Aertsens et al.,
2009). For example, Stobbelaar et al. (2007) indicated that women were generally more
concerned about health and healthy food. In addition, Lea and Worsley (2005) and Lockie et al.
(2004) found that a higher proportion of women than men hold positive attitudes towards organic
food. The influence of education on food consumption seemed to be controversial. Yue et al.,
2008 identified a positive relation between education and organic food consumption. However,
Lea and Worsley (2005) concluded that the impact of education on organic food beliefs was
71
insignificant. Arbindra et al. (2005) also reported that the level of education has no statistically
significant effect on organic food purchase patterns.
Income was also identified to be associated with food consumptions. Cunningham (2002)
pointed out that income played a significant positive role in explaining organic food purchases in
Europe. A study in Canada reported a positive relationship between income and willingness to
buy organic products. Lockie et al. (2002) found that the proportion of Australians consuming
organic food rises when income increased. As mentioned before, cost was perceived by
participants as one of the main barriers that keeping them from consuming energy drinks. It is
known that energy drinks are typically more expensive than soft drinks and Red Bull is the most
expensive non-alcoholic drink available in any convenience store. Hence, energy drink
companies should consider adjusting the prices for their products in order to expand the markets
and make them more affordable to consumers.
Results also showed that the R2 (.18) of this model is relatively low, indicating the
variables identified were not strong predictors of future consumption intention. The possible
reason might be because other situational factors, such as social events, sporting events, and
physical activities are also likely to bring certain influences on consumers’ intention. Therefore,
future studies could include situational factors as mentioned when investigating consumption
intention.
Limitations
The current study has several limitations. First, the participants were recruited through
Amazon Mechanical Turk (Mturk), which is a popular online data collection platform. Although
Mturk is generally recognized as a reliable source for data collection, respondents from Mturk
was not truly representative for the general public in the U.S as they are all registered users only
72
for Mturk. Also, when asking about past experience about energy drinks and side effect
experienced, participants recalled those events retrospectively. . Retrospective self-report may be
affected by memory consolidation or poor recall (Marx et al., 1996). As a result, the results
might not be extremely precise. In addition, this study was only conducted in the United States
and therefore cannot represent the large population outside of this geographic location. Besides
that, the future intention to consume energy drinks was only formulated as a single question
item, which limits the types of statistical analysis that can be performed on this data set. For
instance, more complicated data analysis method, such as Structure Equation Modeling (SEM)
could have been used to investigate the relationship between independent variables and future
consumption intention if it is formulated as multi-item questions.
Conclusion
As conclusion, the study found that energy drinks consumption was more prevalent
among younger generations aging from 21 to 40 in United States. People with higher education
level and higher income were more likely to consume energy drinks. Among common energy
drink brands, Red Bull, Monster and Rockstar are the most popular as well as preferred brands as
indicated by participants in this study. They also reported that typically consuming 1 bottle (can)
when needed during special occasions. Although the majority of the participants did not
considered energy drinks as healthy beverages, they still perceived certain benefits of its
functions, resulting in slight positive overall attitudes towards energy drinks. Friends, health
professionals and social media were determined to have most powerful influences on energy
drink consumption intentions. Poor taste, high cost and lack of information, or uncertainty, were
perceived as the main barriers leading to lower future consumption intentions. The general public
has relatively limited knowledge about energy drinks, especially regarding to recommended way
to consume, and regulations and policies for energy drink products. Among all the attributes
73
were measured, attitudes and perceived behavioral control were found to significantly influence
energy drink consumption intention whereas subjective norms and knowledge did not. More
specifically, positive attitude and lower perceived barrier were associated with higher energy
drink consumption intention.
References
Aertsens, J., Mondelaers, K., Verbeke, W., Buysse, J., & Van Huylenbroeck, G. (2011). The
influence of subjective and objective knowledge on attitude, motivations and
consumption of organic food. British Food Journal, 113(11), 1353-1378.
Aertsens, J., Verbeke, W., Mondelaers, K., & Van Huylenbroeck, G. (2009). Personal
determinants of organic food consumption: a review. British Food Journal, 111(10),
1140-1167.
Alford, C., Cox, H., & Wescott, R. (2001). The effects of red bull energy drink on human
performance and mood. Amino Acids, 21(2), 139-150.
Barrier, L. (2016). Energy Drinks to Amp Up Fast-Food Chains. Retrieved from
http://www.health.com/health/article/0,,20410594,00.html
Clauson, K. A., Shields, K. M., McQueen, C. E., & Persad, N. (2008). Safety issues
associated with commercially available energy drinks. Pharmacy Today, 14(5), 52-64.
Hidiroglu, S., Tanriover, O., Unaldi, S., Sulun, S., & Karavus, M. (2013). A survey of
energy-drink consumption among medical students. J Pak Med Assoc, 63(7), 842- 5.
Kassem, N. O., & Lee, J. W. (2004). Understanding soft drink consumption among male
adolescents using the theory of planned behavior. Journal of Behavioral
Medicine, 27(3), 273-296.
74
Malinauskas, B. M., Aeby, V. G., Overton, R. F., Carpenter-Aeby, T., & Barber-Heidal, K.
(2007). A survey of energy drink consumption patterns among college
students. Nutrition Journal, 6(1), 35-41.
Mint Innovation. (n.d.). Red Bull: A success story. Retrieved from
http://www.mintinnovation.com/links/docs/Marketing/Red%20Bull%20Success%20story
Peacock, A., Bruno, R., Martin, F. H., & Carr, A. (2013). The impact of alcohol and energy drink
consumption on intoxication and risk‐taking behavior. Alcoholism: Clinical and
Experimental Research, 37(7), 1234-1242.
Reissig, C. J., Strain, E. C., & Griffiths, R. R. (2009). Caffeinated energy drinks—a
growing problem. Drug and Alcohol Dependence, 99(1), 1-10.
Story, M., Neumark-Sztainer, D., & French, S. (2002). Individual and environmental
influences on adolescent eating behaviors. Journal of the American Dietetic
Association, 102(3), S40-S51.
Urala, N., & Lähteenmäki, L. (2004). Attitudes behind consumers' willingness to use
functional foods. Food Quality and Preference, 15(7), 793-803.
Vermeir, I., & Verbeke, W. (2006). Sustainable food consumption: Exploring the consumer
“attitude–behavioral intention” gap. Journal of Agricultural and Environmental
ethics, 19(2), 169-194.
Worsley, A. (2002). Nutrition knowledge and food consumption: can nutrition knowledge
change food behaviour?. Asia Pacific Journal of Clinical Nutrition, 11(s3), S579-S585.
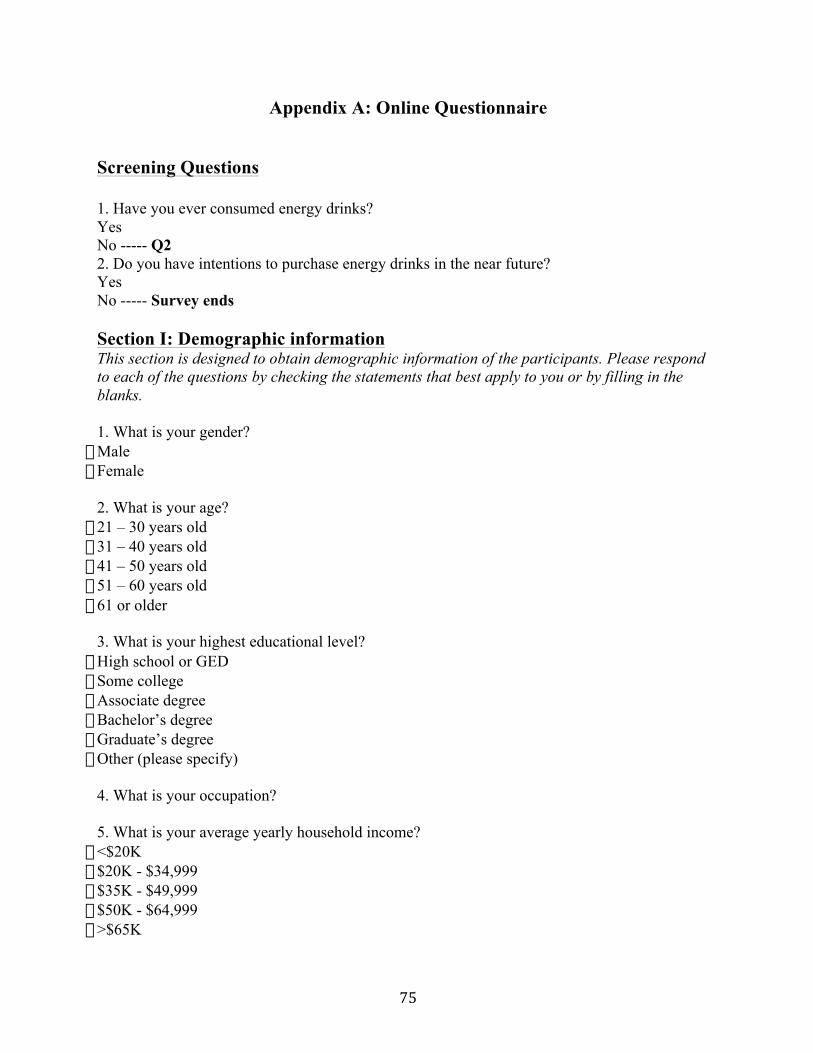
75
Appendix A: Online Questionnaire
Screening Questions 1. Have you ever consumed energy drinks? Yes No ----- Q2 2. Do you have intentions to purchase energy drinks in the near future? Yes No ----- Survey ends Section I: Demographic information This section is designed to obtain demographic information of the participants. Please respond to each of the questions by checking the statements that best apply to you or by filling in the blanks. 1. What is your gender?
� Male � Female
2. What is your age?
� 21 – 30 years old � 31 – 40 years old � 41 – 50 years old � 51 – 60 years old � 61 or older
3. What is your highest educational level?
� High school or GED � Some college � Associate degree � Bachelor’s degree � Graduate’s degree � Other (please specify)
4. What is your occupation? 5. What is your average yearly household income?
� <$20K � $20K - $34,999 � $35K - $49,999 � $50K - $64,999 � >$65K
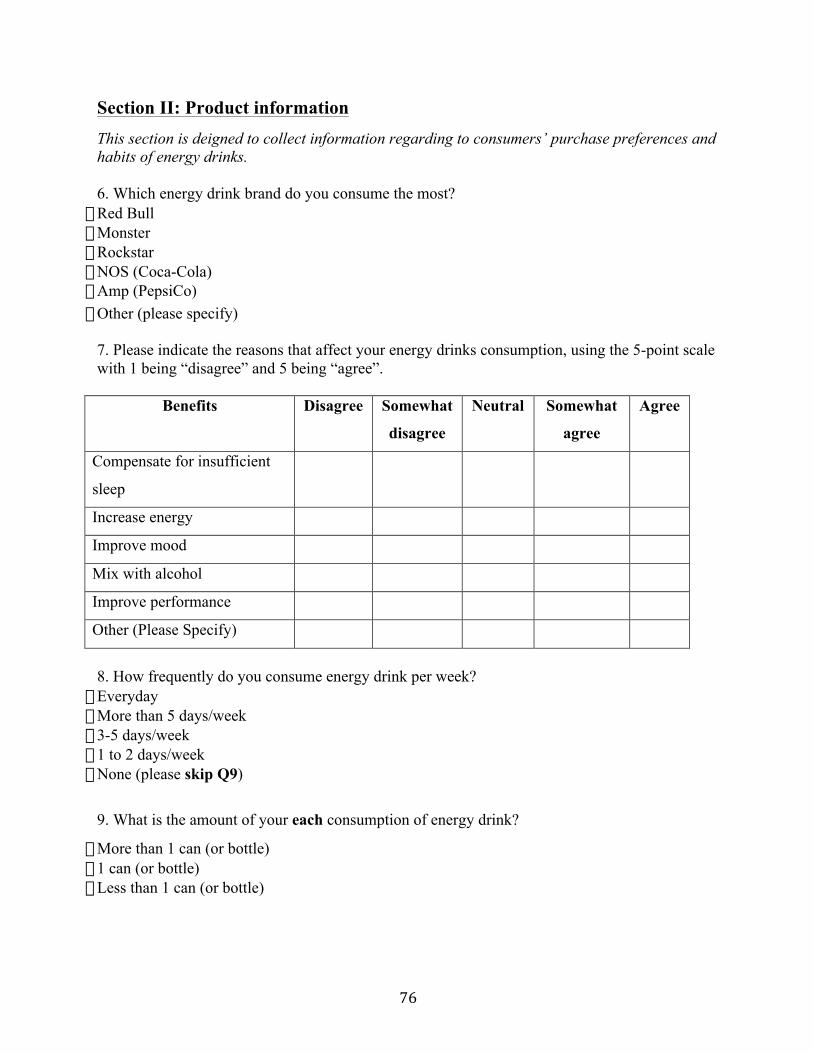
76
Section II: Product information This section is deigned to collect information regarding to consumers’ purchase preferences and habits of energy drinks. 6. Which energy drink brand do you consume the most?
� Red Bull � Monster � Rockstar � NOS (Coca-Cola) � Amp (PepsiCo) � Other (please specify)
7. Please indicate the reasons that affect your energy drinks consumption, using the 5-point scale with 1 being “disagree” and 5 being “agree”.
Benefits Disagree Somewhat
disagree
Neutral Somewhat
agree
Agree
Compensate for insufficient
sleep
Increase energy
Improve mood
Mix with alcohol
Improve performance
Other (Please Specify)
8. How frequently do you consume energy drink per week?
� Everyday � More than 5 days/week � 3-5 days/week � 1 to 2 days/week � None (please skip Q9)
9. What is the amount of your each consumption of energy drink?
� More than 1 can (or bottle) � 1 can (or bottle) � Less than 1 can (or bottle)
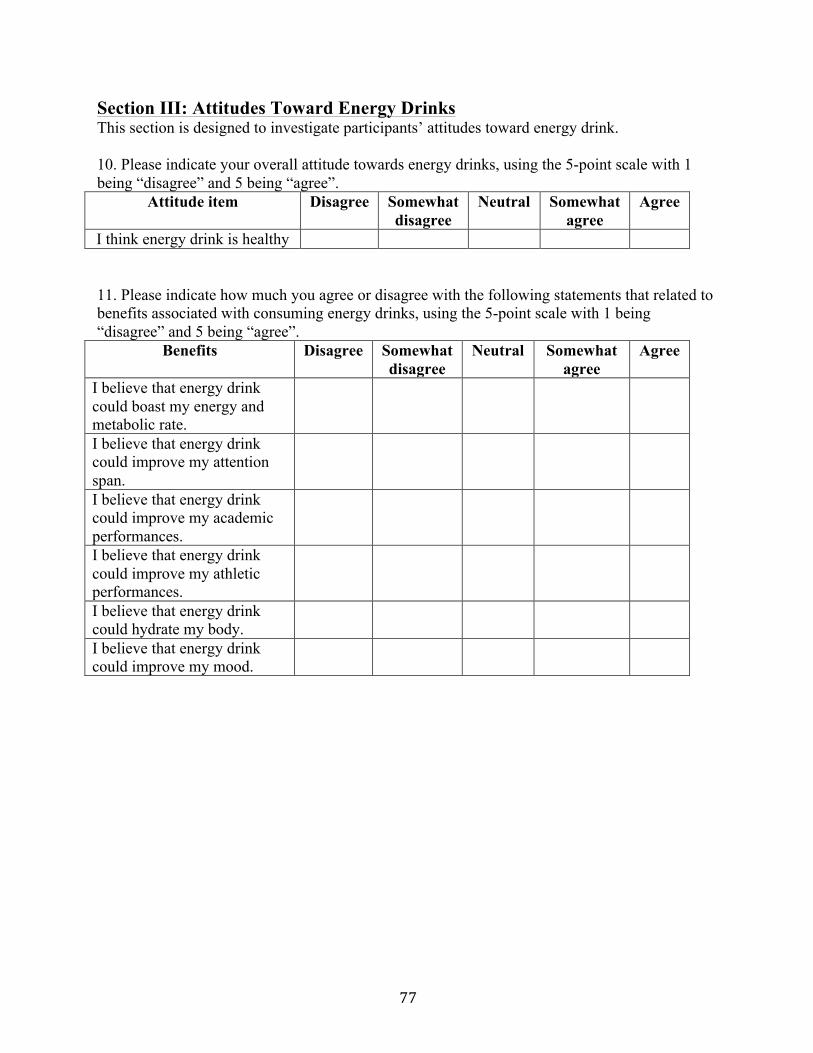
77
Section III: Attitudes Toward Energy Drinks This section is designed to investigate participants’ attitudes toward energy drink. 10. Please indicate your overall attitude towards energy drinks, using the 5-point scale with 1 being “disagree” and 5 being “agree”.
Attitude item Disagree Somewhat disagree
Neutral Somewhat agree
Agree
I think energy drink is healthy
11. Please indicate how much you agree or disagree with the following statements that related to benefits associated with consuming energy drinks, using the 5-point scale with 1 being “disagree” and 5 being “agree”.
Benefits Disagree Somewhat disagree
Neutral Somewhat agree
Agree
I believe that energy drink could boast my energy and metabolic rate.
I believe that energy drink could improve my attention span.
I believe that energy drink could improve my academic performances.
I believe that energy drink could improve my athletic performances.
I believe that energy drink could hydrate my body.
I believe that energy drink could improve my mood.

78
Section IV: Subjective Norms This section is designed to investigate participants’ subjective norms of consuming energy drink. 12. Please indicate how likely each of the following individuals might influence your decision to consume energy drink, using the 5-point scale with 1 being “Very Unlikely” and 5 being “Very Likely”.
Section V: Perceived Behavior Control This section is designed to investigate barriers that affect participants’ decision to consume energy drink.
13. Please indicate what reasons make it difficult to consume energy drink, using the 5-point scale with 1 being “disagree” and 5 being “agree”.
Individuals Very Unlikely
Unlikely Neither likely or unlikely
Likely Very Likely
Parents Friends
Favorite Celebrity (sports player/singer/movie
star/etc.)
Social Media (Internet/Television/Newspaper/M
agazine/Poster/etc.)
Health professionals Other (Please Specify)
Factors Disagree Somewhat disagree
Neutral Somewhat agree
Agree
Availability Taste Cost
Improper serving size (too much)
Negative beverage attributes (Severing temperature)
Prefer other alternatives Uncertainty or lack of
information
Other (please specify)
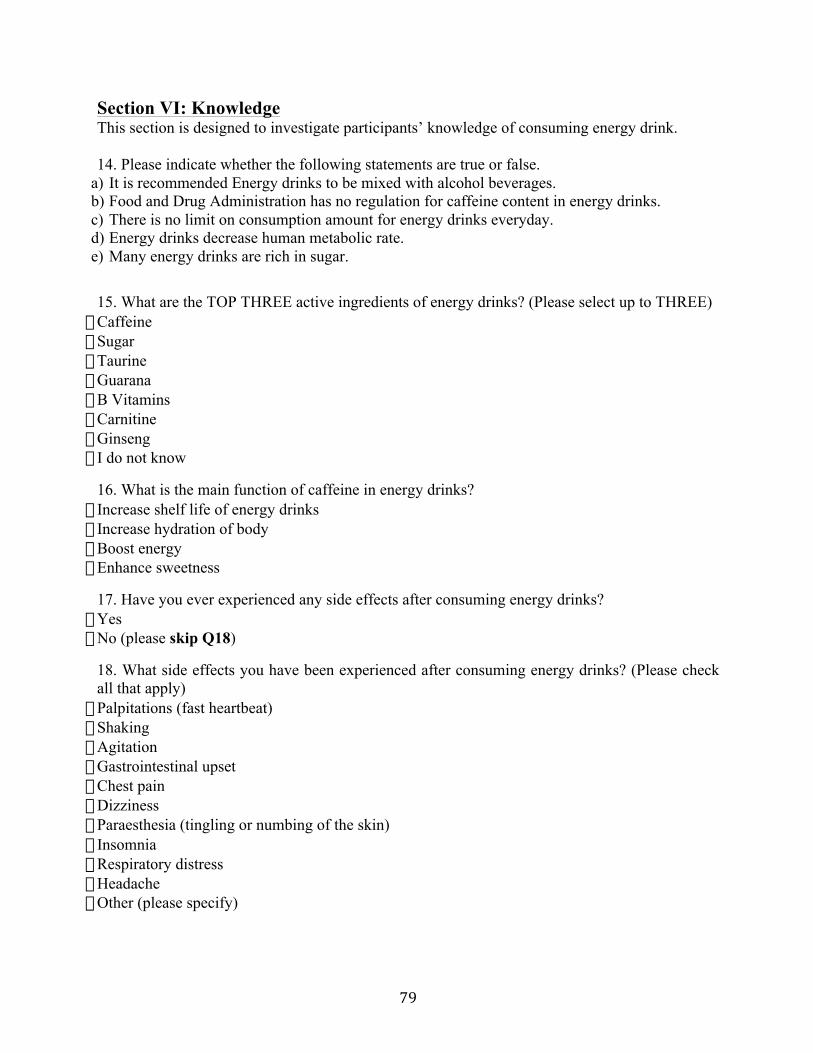
79
Section VI: Knowledge This section is designed to investigate participants’ knowledge of consuming energy drink. 14. Please indicate whether the following statements are true or false.
a) It is recommended Energy drinks to be mixed with alcohol beverages. b) Food and Drug Administration has no regulation for caffeine content in energy drinks. c) There is no limit on consumption amount for energy drinks everyday. d) Energy drinks decrease human metabolic rate. e) Many energy drinks are rich in sugar.
15. What are the TOP THREE active ingredients of energy drinks? (Please select up to THREE) � Caffeine � Sugar � Taurine � Guarana � B Vitamins � Carnitine � Ginseng � I do not know
16. What is the main function of caffeine in energy drinks? � Increase shelf life of energy drinks � Increase hydration of body � Boost energy � Enhance sweetness
17. Have you ever experienced any side effects after consuming energy drinks? � Yes � No (please skip Q18)
18. What side effects you have been experienced after consuming energy drinks? (Please check all that apply)
� Palpitations (fast heartbeat) � Shaking � Agitation � Gastrointestinal upset � Chest pain � Dizziness � Paraesthesia (tingling or numbing of the skin) � Insomnia � Respiratory distress � Headache � Other (please specify)
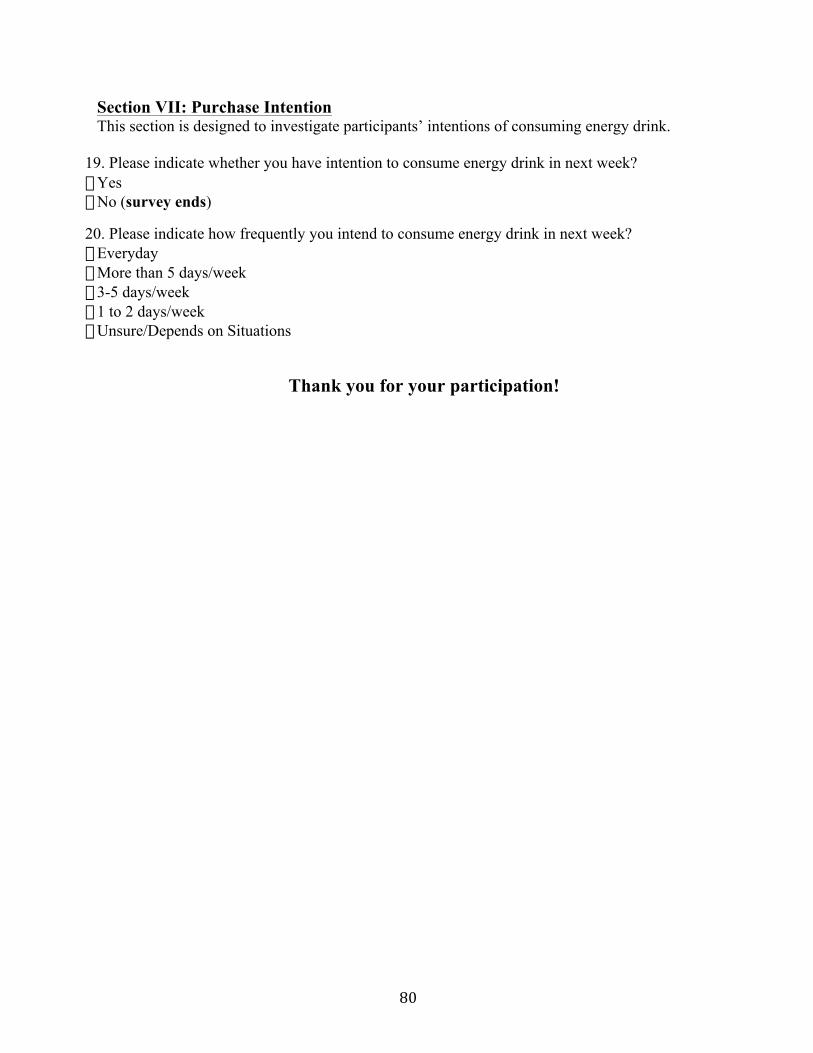
80
Section VII: Purchase Intention This section is designed to investigate participants’ intentions of consuming energy drink.
19. Please indicate whether you have intention to consume energy drink in next week? � Yes � No (survey ends)
20. Please indicate how frequently you intend to consume energy drink in next week? � Everyday � More than 5 days/week � 3-5 days/week � 1 to 2 days/week � Unsure/Depends on Situations
Thank you for your participation!
81
Appendix 2 Inform Consent Date: Jan 25, 2016 Dear Sir/Madam: You are invited to a survey titled, “Applying Extended Theory of Planned Behavior to Investigate Energy Drink Consumption”. Many articles have revealed that drinking energy drink has potential health related risks. However, the popularity of energy drinks continues to rise despite the problems caused by side effects. It is necessary to understand what are the intentions for people to consume energy drinks and what are the factors affecting their intentions. The purpose of the survey is to investigate consumer purchase intentions of energy drink based on modified Theory of Planned Behavior. This survey is intended for the general U.S. population above 19 years old. Completion of the survey will take 10-15 minutes of your time. Your participation is completely voluntary. Your response will remain completely confidential. Only the summary of the results will be reported in manuscripts or abstracts. The survey is anonymous. You will be offered $0.50 to fill out the survey through Amazon Mechanical Turk. The Auburn University Institutional Review Board has approved this document for use from January 5, 2016 to January 4, 2019. Protocol #15-527 EP 1601.If you have any question regarding this study, please feel free to contact Yujia Wang at (612) 868-6608 (email: [email protected]). For questions about your rights as a participant or the manner in which the study is conducted, you may contact Auburn University Office of Human Subjects Research or the Institutional Review Board by phone (334)-844-5966 or e-mail at [email protected] or [email protected]. I appreciate for your time and effort in participation of this survey. Sincerely, Yujia Wang Graduate Student Department of Nutrition, Dietetics, and Hospitality Management Phone: 612-868-6608 Email: [email protected]