Applying Data Mining Techniques to Address Disaster
9
Applying Data Mining Techniques to Address Disaster Information Management Challenges on Mobile Devices Li Zheng, Chao Shen, Liang Tang, Tao Li, Steve Luis, Shu-Ching Chen School of Computing and Information Sciences, Florida International University 11200 S.W. 8 th Street, Miami, Florida, 33199, U.S.A. {lzhen001, cshen001, ltang002, taoli, luiss, chens}@cs.fiu.edu ABSTRACT The improvement of Crisis Management and Disaster Recovery techniques are national priorities in the wake of man-made and nature inflicted calamities of the last decade. Our prior work has demonstrated that the efficiency of sharing and managing information plays an important role in business recovery efforts after disaster event. With the proliferation of smart phones and wireless tablets, professionals who have an operational responsibility in disaster situations are relying on such devices to maintain communication. Further, with the rise of social media, technology savvy consumers are also using these devices extensively for situational updates. In this paper, we address several critical tasks which can facilitate information sharing and collaboration between both private and public sector participants for major disaster recovery planning and management. We design and implement an All-Hazard Disaster Situation Browser (ADSB) system that runs on Apple’s mobile operating system (iOS) and iPhone and iPad mobile devices. Our proposed techniques create a collaborative solution on a mobile platform using advanced data mining and information retrieval techniques for disaster preparedness and recovery that helps impacted communities better understand the current disaster situation and how the community is recovering. Specifically, hierarchical summarization techniques are used to generate brief reviews from a large collection of reports at different granularities; probabilistic models are proposed to dynamically generate query forms based on user’s feedback; and recommendation techniques are adapted to help users identify potential contacts for report sharing and community organization. Furthermore, the developed techniques are designed to be all-hazard capable so that they can be used in earthquake, terrorism, or other unanticipated disaster situations. Categories and Subject Descriptors H.2.8 [Database Applications]: Data mining; H.3.3 [Information Search and Retrieval]: Clustering; H.3.5 [Online Information Services]: Web-based services; H.4 [Information Systems Applications]: Miscellaneous. General Terms Algorithms, Design, Management. Keywords Data Mining, Disaster Information Management, Hierarchical Summarization, Dynamic Query Form, User Recommendation 1. INTRODUCTION Business closures caused by disasters can cause millions of dollars in lost productivity and revenue. A study in Contingency Planning and Management shows that 40% of companies that were shut down by a disaster for three days failed within 36 months. Thin margins and lack of a well-designed and regularly tested disaster plan make companies, particularly small businesses, especially vulnerable [1]. We believe that the solution to better disaster planning and recovery is one where the public and private sectors work together to apply world class computing tools to deliver the right information to the right people at the right time facilitating the work of those feverishly restoring a community’s sense of normalcy. Over the last four years, our disaster management team at Florida International University has cooperated closely with experts and participants from South Florida Emergency Management and industry partnership, such as Wal-Mart, Office Depot, Wachovia, T-Mobile, Ryder Systems and IBM among others. The collaboration provides us with the opportunity to gain the insight of the way South Florida public and private sector entities manage and exchange information in a disaster situation. We have designed and implemented a web-based prototype of a Business Continuity Information Network (BCIN) system (www.bizrecovery.org) utilizing the data processing power of advanced information technologies for disaster planning and recovery under hurricane scenarios. It can largely help people discover, collect, organize, search and disseminate real-time disaster information [5,6]. 1.1 Assimilating Information Exchange Needs in Major Disasters Our study of the hurricane disaster information management domain has revealed two interesting yet crucial information management issues that present similar challenges in other disaster management domains. The first issue is that reconstructing or creating information flow becomes intractable in domains where the stability of information networks is fragile and can change frequently. On the other hand, important information networks often carry and store critical information between parties, which dominates the flow of resources and information exchanges. The consequence is that the ability and the efficiency of communication degrade once critical networks are disrupted under disaster impact and people may not have alternative path to pursue so that they can consume information or restore their connections. For instance, once power is disabled and uninterruptable power supplies are drained after Permission to make digital or hard copies of all or part of this work for personal or classroom use is granted without fee provided that copies are not made or distributed for profit or commercial advantage and that copies bear this notice and the full citation on the first page. To copy otherwise, or republish, to post on servers or to redistribute to lists, requires prior specific permission and/or a fee. KDD’11, August 21–24, 2011, San Diego, California, USA. Copyright 2011 ACM 978-1-4503-0813-7/11/08...$10.00. 283
Transcript of Applying Data Mining Techniques to Address Disaster

Applying Data Mining Techniques to Address Disaster Information Management Challenges on Mobile Devices
Li Zheng, Chao Shen, Liang Tang, Tao Li, Steve Luis, Shu-Ching Chen School of Computing and Information Sciences, Florida International University
11200 S.W. 8th Street, Miami, Florida, 33199, U.S.A. {lzhen001, cshen001, ltang002, taoli, luiss, chens}@cs.fiu.edu
ABSTRACT The improvement of Crisis Management and Disaster Recovery techniques are national priorities in the wake of man-made and nature inflicted calamities of the last decade. Our prior work has demonstrated that the efficiency of sharing and managing information plays an important role in business recovery efforts after disaster event. With the proliferation of smart phones and wireless tablets, professionals who have an operational responsibility in disaster situations are relying on such devices to maintain communication. Further, with the rise of social media, technology savvy consumers are also using these devices extensively for situational updates. In this paper, we address several critical tasks which can facilitate information sharing and collaboration between both private and public sector participants for major disaster recovery planning and management. We design and implement an All-Hazard Disaster Situation Browser (ADSB) system that runs on Apple’s mobile operating system (iOS) and iPhone and iPad mobile devices. Our proposed techniques create a collaborative solution on a mobile platform using advanced data mining and information retrieval techniques for disaster preparedness and recovery that helps impacted communities better understand the current disaster situation and how the community is recovering. Specifically, hierarchical summarization techniques are used to generate brief reviews from a large collection of reports at different granularities; probabilistic models are proposed to dynamically generate query forms based on user’s feedback; and recommendation techniques are adapted to help users identify potential contacts for report sharing and community organization. Furthermore, the developed techniques are designed to be all-hazard capable so that they can be used in earthquake, terrorism, or other unanticipated disaster situations.
Categories and Subject Descriptors H.2.8 [Database Applications]: Data mining; H.3.3 [Information Search and Retrieval]: Clustering; H.3.5 [Online Information Services]: Web-based services; H.4 [Information Systems Applications]: Miscellaneous.
General Terms Algorithms, Design, Management.
Keywords Data Mining, Disaster Information Management, Hierarchical Summarization, Dynamic Query Form, User Recommendation
1. INTRODUCTION Business closures caused by disasters can cause millions of dollars in lost productivity and revenue. A study in Contingency Planning and Management shows that 40% of companies that were shut down by a disaster for three days failed within 36 months. Thin margins and lack of a well-designed and regularly tested disaster plan make companies, particularly small businesses, especially vulnerable [1]. We believe that the solution to better disaster planning and recovery is one where the public and private sectors work together to apply world class computing tools to deliver the right information to the right people at the right time facilitating the work of those feverishly restoring a community’s sense of normalcy.
Over the last four years, our disaster management team at Florida International University has cooperated closely with experts and participants from South Florida Emergency Management and industry partnership, such as Wal-Mart, Office Depot, Wachovia, T-Mobile, Ryder Systems and IBM among others. The collaboration provides us with the opportunity to gain the insight of the way South Florida public and private sector entities manage and exchange information in a disaster situation. We have designed and implemented a web-based prototype of a Business Continuity Information Network (BCIN) system (www.bizrecovery.org) utilizing the data processing power of advanced information technologies for disaster planning and recovery under hurricane scenarios. It can largely help people discover, collect, organize, search and disseminate real-time disaster information [5,6].
1.1 Assimilating Information Exchange Needs in Major Disasters Our study of the hurricane disaster information management domain has revealed two interesting yet crucial information management issues that present similar challenges in other disaster management domains.
The first issue is that reconstructing or creating information flow becomes intractable in domains where the stability of information networks is fragile and can change frequently. On the other hand, important information networks often carry and store critical information between parties, which dominates the flow of resources and information exchanges. The consequence is that the ability and the efficiency of communication degrade once critical networks are disrupted under disaster impact and people may not have alternative path to pursue so that they can consume information or restore their connections. For instance, once power is disabled and uninterruptable power supplies are drained after
Permission to make digital or hard copies of all or part of this work for personal or classroom use is granted without fee provided that copies are not made or distributed for profit or commercial advantage and that copies bear this notice and the full citation on the first page. To copy otherwise, or republish, to post on servers or to redistribute to lists, requires prior specific permission and/or a fee. KDD’11, August 21–24, 2011, San Diego, California, USA. Copyright 2011 ACM 978-1-4503-0813-7/11/08...$10.00.
283
hurricane, computing and networking equipment will fail unless preventative measures are taken. However, maintaining a fuel-consuming generator is not always available in advance or after such events.
Another issue we observe is the human need to consume a large volume of disaster situational information. Reading and assimilating situational information is very time consuming and has a high probability of exposure to redundant information. For instance, it is very common for multiple information channels to publish the same situational information in a repetitive fashion.
Therefore, to quickly re-assemble or create information flow for multi-party coordination activities during disaster situations, technologies that are able to extract information of recent updates, deliver information without conflicts or irrelevance and represent information of preference are needed.
Based on our long-standing collaboration with Miami-Dade County Emergency Management and private sector business continuity planners, we understand that professionals from both sides have those needs not only under hurricane scenarios but also under many other major disaster situations. To summarize, in disaster situations, the information delivery should be able to support users’ complex information needs and approximately tailored to the situation and the tasks. As a result, the information should be synthesized from heterogeneous sources, be tailored to specific contexts or tasks at hand, and be summarized for effective delivery, and be immediately useful for making decision.
1.2 Motivation for Developing on a Mobile Platform In January 2009, a few months after Hurricane Ike (the third most costly hurricane in US history [2]) impacted the city of Houston, TX, our team was invited by FEMA to attend a meeting of public and private sector stakeholders. At that meeting, we asked emergency managers and business continuity professionals about the role technology played in the recovery process of the city. Most attendees agreed that mobile phones where being used extensively for voice, SMS and data based services despite the spotty coverage by various cellular carriers. At the National Hurricane Conference that same year, technical staff of the American Red Cross conveyed their use of mobile phones in the wake of mid-west river floods. The Red Cross shipped cell phones to affected areas so that staff had communication capabilities to address logistical needs. Despite the flooding impact, cellular carriers were capable of providing adequate cellular service. In both cases we heard similar reasons for using mobile phones:
1. The devices are portable (pocket sized) and do not have to be hand carried like a laptop which is considered a burden in the field.
2. The devices can operate without electrical power for long periods of time making it easier to operate in areas with limited access to power.
3. The devices can be used for different modalities of communication. For example, an SMS message can be sent to someone who has actionable information that is needed urgently to solicit an immediate response versus an email that can be replied at the convenience of the receiver.
4. Native mobile apps make it easy to enter information from the phone instead of having to use phone’s web browser to access a website.
Recent consumer trends suggest that mobile phones are being used extensively for situational updates to social networking services like Facebook, Twitter, and many other photo sharing, blogging, location aware services [22]. From the information services perspective, acquiring data from a mobile phone can be more media rich since the phone has image, video and sound recording capabilities. Data acquired from the mobile phone is typically transmitted with geo-location data that makes it easy to organize data spatially.
In summary, professionals who have an operational responsibility in disaster situations are relying on mobile phones to maintain communications, update status and share situational information. Consumers, too, are finding mobile devices convenient for sharing information about themselves and what is going on in their lives. By using a mobile platform we can build native applications which utilize onboard sensors, rich media, and simplified user interface to engage users in a way they feel most comfortable to share such information in a disaster situation.
In this paper, built on our previous work, we design and implement an All-Hazard Disaster Situation Browser (ADSB) system running on mobile platforms which uses advanced data mining and information retrieval techniques to address the important information management needs in major disaster situations.
1.3 Research Challenges and Proposed Solutions During prototyping ADSB to integrate those critical features into the mobile platform, we have identified the following three key tasks to fully utilize the advantages and overcome the limitations of major mobile devices.
1. Design and develop effective and interactive information summarization methods to help users understand large collection of reports. It is typically difficult for readers to extract useful information from a large quantity of documents. Multi-document summarization provides users with a tool to effectively extract important and related ideas of current situations. However, previous text summarization techniques gave users a set of sentences based on user query. The summarization is fixed once the query is determined. Note that mobile devices are generally with a small display and limited input capabilities. An interactive summarization interface is needed to help users navigate collected information at different granularities, and locate their target information more efficiently.
2. Design and develop intelligent information delivery techniques to help users quickly identify the information they need. The data is collected through many different channels and belongs to different categories. During disaster preparation and recovery, users do not have the time and patience to go through the system to find the information they want. Structured information can be of important value to help people make decisions by providing them with actionable and concrete information representation and exploration. However, navigating the large result set on the mobile device is particularly inefficient. An interactive tabular interface can largely help users filter useful information by adapting changing query conditions and user feedbacks.
3. Design and develop dynamic community generation techniques for reports recommendation and user group organization. In information sharing tasks, identifying a group of
284
recipients to which a certain type of information is conveyed to can highly improve the efficiency of communication and gain valuable feedback. But on mobile device, managing the groups of friends within the limited display often makes user miss highly related friends. User recommendation techniques can offer a user such convenience by automatically and interactively generating potential recipients for different pieces of information. In addition, user recommendation techniques can help users effectively and dynamically organize user groups according to various information sharing tasks.
In general, to accomplish these three goals, ADSB utilizes the latest advances in database, data mining, and information extraction technologies, to create a user friendly, information-rich service on mobile platform in disaster management and recovery domain. It also acts as an infusive channel for better sharing, integration, extraction, and processing of business continuity information.
In particular, to address task 1, we apply hierarchical summarization to automatically extract the status information from a large document set and also provide a hierarchical view to help users browse information at different granularities. To address task 2, we create a user interface called the Dynamic Query Form to improve information exploration quality. It captures users’ interests by interactively allowing them to refine and update their queries. To address task 3, we use transactional recommendation history combined with textual content to explore the implicit relationship among users.
ADSB is essentially a collaborative platform for preparedness and recovery that helps disaster impacted communities to better understand what the current disaster situation is and how the community is recovering. This achievement is paramount, as we have seen, in the aftermath of disasters like Hurricanes Katrina and Andrew, communities disintegrating because faith in the process of recovery is lost. The analytical power of our solutions is designed to be all hazards capable so that they can be used in earthquake, terrorism, or other unanticipated disaster events.
The rest of the paper is organized as follows. Section 2 presents the overview of ADSB system; Section 3 describes the hierarchical summarization module in detail. Affinity Propagation is used to build the hierarchical summaries; Section 4 discusses the dynamic query form module. We propose probabilistic models to dynamically generate query forms based on user’s feedback; Section 5 describes the user recommendation module. The algorithm for ranking users’ interaction preference is implemented by considering the transaction information and the textual content; Section 6 describes the system evaluation and data crawling strategies; Finally, Section 7 concludes the system development and operation.
2. ADSB OVERVIEW ADSB is a collaborative solution on mobile platform designed for information sharing, integration, extraction, and processing. It can help the user efficiently identify, organize, and deliver important information. In ADSB, registered users can submit reports by typing plain texts as well as attach resources of other formats such as PDF and Doc. The system users can also tag those reports to manage their interested information or post comments to interact with other users. ADSB provides hierarchical summaries generated from user specified keywords to briefly capture important information. Also, a set of suggested query forms helps the users efficiently refine the query results. At last, users can also
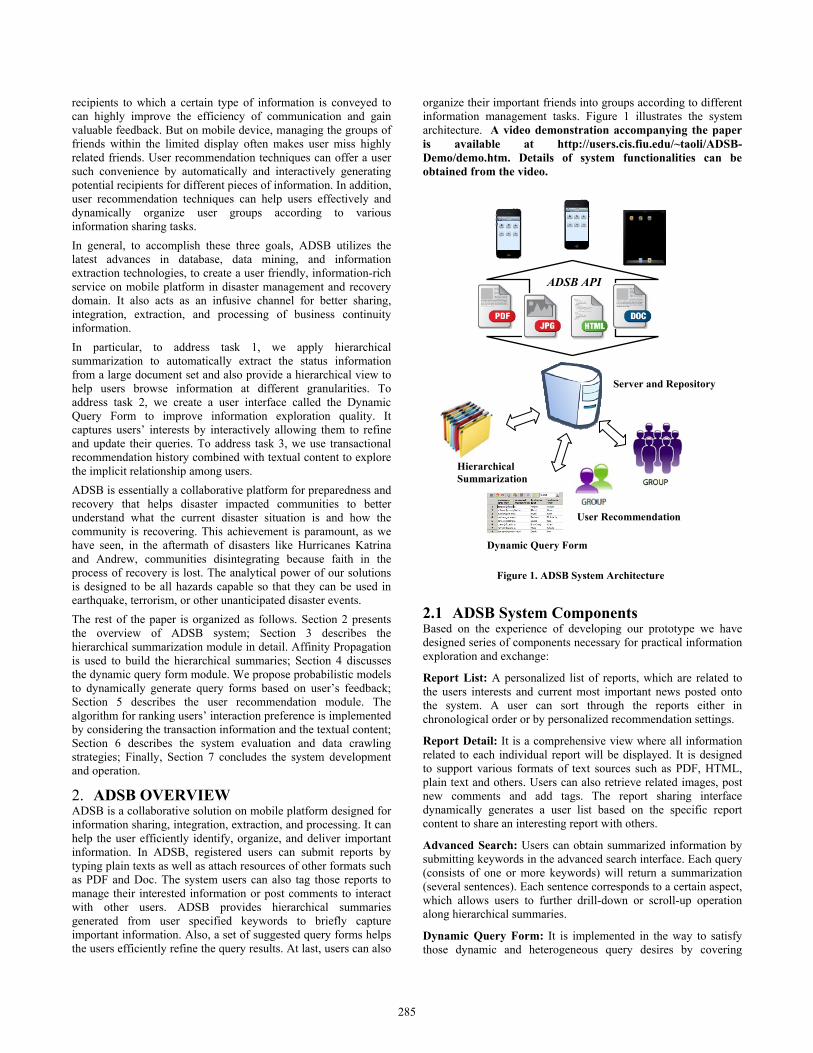
organize their important friends into groups according to different information management tasks. Figure 1 illustrates the system architecture. A video demonstration accompanying the paper is available at http://users.cis.fiu.edu/~taoli/ADSB-Demo/demo.htm. Details of system functionalities can be obtained from the video.
2.1 ADSB System Components Based on the experience of developing our prototype we have designed series of components necessary for practical information exploration and exchange:
Report List: A personalized list of reports, which are related to the users interests and current most important news posted onto the system. A user can sort through the reports either in chronological order or by personalized recommendation settings.
Report Detail: It is a comprehensive view where all information related to each individual report will be displayed. It is designed to support various formats of text sources such as PDF, HTML, plain text and others. Users can also retrieve related images, post new comments and add tags. The report sharing interface dynamically generates a user list based on the specific report content to share an interesting report with others.
Advanced Search: Users can obtain summarized information by submitting keywords in the advanced search interface. Each query (consists of one or more keywords) will return a summarization (several sentences). Each sentence corresponds to a certain aspect, which allows users to further drill-down or scroll-up operation along hierarchical summaries.
Dynamic Query Form: It is implemented in the way to satisfy those dynamic and heterogeneous query desires by covering
Figure 1. ADSB System Architecture
ADSB API
Hierarchical Summarization
User Recommendation
Server and Repository
Dynamic Query Form
285
attribute sets and annotation attributes associated with different reports. The user can refine query conditions and select related query results to generate more concrete and related query forms.
Community Management: Community is defined as a set of users that have a specific relationship between each other. Also, it is an important channel to obtain related information and monitor how the situation evolves with respect to an event. An interactive approach is implemented to improve experiences in which a user can freely group contacts from a recommended contact list rather than being forced to navigate the user list repeatedly.
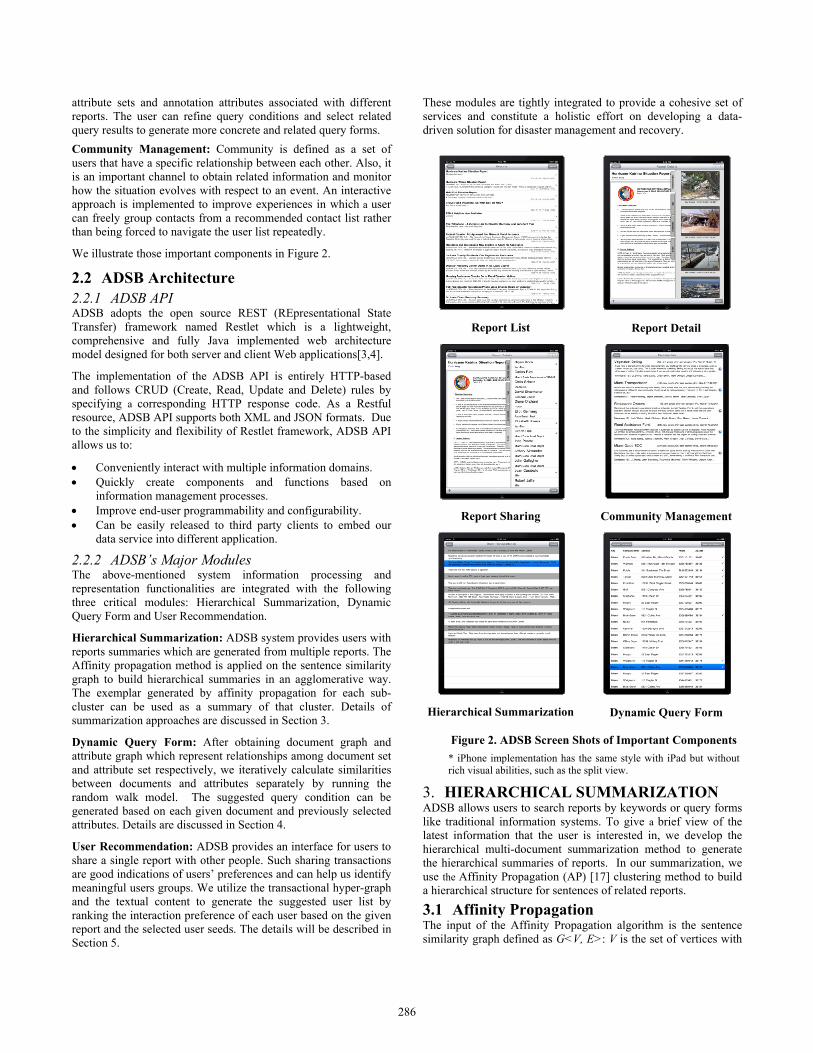
We illustrate those important components in Figure 2.
2.2 ADSB Architecture 2.2.1 ADSB API ADSB adopts the open source REST (REpresentational State Transfer) framework named Restlet which is a lightweight, comprehensive and fully Java implemented web architecture model designed for both server and client Web applications[3,4].
The implementation of the ADSB API is entirely HTTP-based and follows CRUD (Create, Read, Update and Delete) rules by specifying a corresponding HTTP response code. As a Restful resource, ADSB API supports both XML and JSON formats. Due to the simplicity and flexibility of Restlet framework, ADSB API allows us to:
Conveniently interact with multiple information domains. Quickly create components and functions based on
information management processes. Improve end-user programmability and configurability. Can be easily released to third party clients to embed our
data service into different application.
2.2.2 ADSB’s Major Modules The above-mentioned system information processing and representation functionalities are integrated with the following three critical modules: Hierarchical Summarization, Dynamic Query Form and User Recommendation.
Hierarchical Summarization: ADSB system provides users with reports summaries which are generated from multiple reports. The Affinity propagation method is applied on the sentence similarity graph to build hierarchical summaries in an agglomerative way. The exemplar generated by affinity propagation for each sub-cluster can be used as a summary of that cluster. Details of summarization approaches are discussed in Section 3.
Dynamic Query Form: After obtaining document graph and attribute graph which represent relationships among document set and attribute set respectively, we iteratively calculate similarities between documents and attributes separately by running the random walk model. The suggested query condition can be generated based on each given document and previously selected attributes. Details are discussed in Section 4.
User Recommendation: ADSB provides an interface for users to share a single report with other people. Such sharing transactions are good indications of users’ preferences and can help us identify meaningful users groups. We utilize the transactional hyper-graph and the textual content to generate the suggested user list by ranking the interaction preference of each user based on the given report and the selected user seeds. The details will be described in Section 5.
These modules are tightly integrated to provide a cohesive set of services and constitute a holistic effort on developing a data-driven solution for disaster management and recovery.
3. HIERARCHICAL SUMMARIZATION ADSB allows users to search reports by keywords or query forms like traditional information systems. To give a brief view of the latest information that the user is interested in, we develop the hierarchical multi-document summarization method to generate the hierarchical summaries of reports. In our summarization, we use the Affinity Propagation (AP) [17] clustering method to build a hierarchical structure for sentences of related reports.
3.1 Affinity Propagation The input of the Affinity Propagation algorithm is the sentence similarity graph defined as G<V, E>: V is the set of vertices with
Report List
Report Detail
Report Sharing
Community Management
Hierarchical Summarization
Dynamic Query Form
Figure 2. ADSB Screen Shots of Important Components
* iPhone implementation has the same style with iPad but without rich visual abilities, such as the split view.
286

each vertex, called data point, representing a sentence. E is the set of edges. Let , be the similarity between two distinct points i and k, indicating how well that the data point k is suitable to be the exemplar of point . Specially, , is the preference of a sentence to be chosen as the exemplar. In the algorithm, there are two kinds of messages passing between data points: the responsibility and the availability.
The responsibility , is computed as follows,
, , max , , .
The responsibility , is passing from to candidate exemplar . It reflects the accumulated evidence for how well point suits
to be the exemplar for point against other candidate exemplars.
The availability , , is computed as follows,
, 0, , max 0, ,, ,
.
The availability , is passing from the candidate exemplar to point , reflecting the accumulated evidence for how appropriate it would be for point i to choose point k as its exemplar, considering the support from other points which share point as exemplar. Whereas the responsibility updating lets all candidate exemplars compete for the ownership of a data point, the availability updating gathers evidence from data points to measure the goodness of each candidate exemplar.
The self-availability , is updated as follows:
, max 0, ,,
.
This message reflects accumulated evidence of point being an exemplar based on the positive responsibilities sent to candidate exemplar from other points.
All availabilities are initialized to zero: , 0. After the updating converges, availabilities and responsibilities are combined to identify exemplars. For point , its corresponding exemplar is obtained by maximizing the following expression:
arg max , , .
We choose AP for the following reasons:
AP can find clusters with much lower error than other clustering methods, such as the k-means method.
AP performs efficiently on sparse similarity graph, which is the case of document space. The running time for iterations is linear to the number of edges in the graph.
AP takes a real number as input, called preference for each data point. The preference quantifies the likelihood of it being chosen as exemplar. Thus the prior and heuristic knowledge can be used to associate different sentence with different preference.
AP identifies exemplars for each cluster or group which can be naturally used as the summary sentence for the cluster.
3.2 Hierarchical Summarization on Affinity Propagation For the sentences in related reports, , , , , we want to build a hierarchical clustering structure, exemplars of clusters are used as the summary. In an agglomerative way, starting from all the sentences, then the exemplars, we recursively apply affinity propagation until the number of exemplars is small enough. To
conduct the affinity propagation algorithm, we specify the preference for each sentence and similarity between sentences as the input of the algorithm.
3.2.1 Sentence Preference We define the preference of a sentence to be chosen as an exemplar using the following scores.
Language Model score : For sentence , is calculated as the logarithmic probability of sentence using unigram model training on the reports , , , . Generally, a short sentence which has more frequent words in the reports would have a higher score.
LexPageRank score : LexPageRank proposed by [18] calculates the Page Rank score for sentences on the sentence similarity matrix. The score measures the prestige in sentence networks assuming that the sentences that are similar to many of the other sentences in a cluster are more prestigious to the topic. Since the original LexPageRank can be interpreted as the probability in random walk theory, we use the logarithmic version to make it in a same scale with the Language Model score.
Freshness score : In our application, users are generally more interested in latest information, we calculate the freshness score of sentence as
, where is the age in term of number of days the document contains the sentence . Finally, the preference of is the sum of the three feature scores with a scaling parameter:
, .
3.2.2 Sentence Similarity Sentence similarity , indicates how well the data point with index is suited to be the exemplar for data point . In our case, it means how likely sentence i can be summarized by sentence j. If sentence and sentence have non-stop word overlaps, we calculate , by the log-likelihood of sentence given that its exemplar is sentence .
, | .
To calculate the conditional probability, a unigram language model is trained on sentence by using the Dirichlet smoothing. Then the probability of sentence is calculated by using the language model.
4. DYNAMIC QUERY FORM In ADSB, each report is associated with a set of attributes, such as the report location, date, or annotations added by the creator. Such structural information allows users to execute relational queries on reports. For example, we want to find those reports which are about hurricanes from year 1990 to 2010 and hurricane centers’ latitudes are above 30 degrees latitude. Hence, our ADSB system applies query forms for users to satisfy the relational queries.
Traditional query forms are statically embedded in the system by developers or database administrators. Those static query forms are used for the static database schema. However, in ADSB, different reports have different sets of attributes. For example, the hurricane report and earthquake report own two very distinct sets of attributes. Furthermore, the associated values of annotation attributes that are created by the user at runtime may not be consistent. Therefore, it is impossible to design a static and fixed
287
query form to cover all those attributes. In ADSB, we implement dynamic query form to satisfy those dynamic and heterogeneous query desires.
Previous research on database query forms focuses on how to automatically generate the query form from the data distribution or query history [12,13,14,15]. However, different users can have different query desires. How to capture the current user's interests and construct appropriate query forms is the key challenge for query form generation which has not been solved yet.
4.1 Problem Formulation Query forms are designed to return the user's desired results. The metric of the goodness of a query form is based on two traditional measures for evaluating the quality of the query results. One is precision, which is the fraction of results returned by the query form desired by the user. The other is recall, which is the fraction of desired results contained in the results.
Let F = (AF, F) be a query form with a set of query conditions F and a set of displaying attributes AF. Let D be the set of all reports in the database. |D| is the number of reports. Pu(.) is the distribution function of user interests. Pu(d) is the user interest for a report d, and Pu(AF) is the user interest for an attribute subset AF. P( F|d) is the probability of query condition F being satisfied by d, i.e., P( F |d) = 1 if d is returned by F and P( F |d) = 0 otherwise. Then, given a query form F= (AF, F), the expected precision, expected recall and expected fscore of F are defined as follows:
∑ |∑ |
,
∑ |∑
,
1 · ·· ·
,
where , , is a parameter defined by the user and is usually set to 2.
FScoreE(.) is the metric in ADSB system to evaluate the overall goodness of a query form. The problem of our dynamic query form is how to construct a query form that maximizes the goodness metric FScoreE(.), i.e.,
argmax .
4.2 Method Description It is impractical to construct an optimal query form at the very beginning, since we do not know which reports and attributes are desired by the user. In other words, estimating Pu(d) and Pu(AF) is difficult.
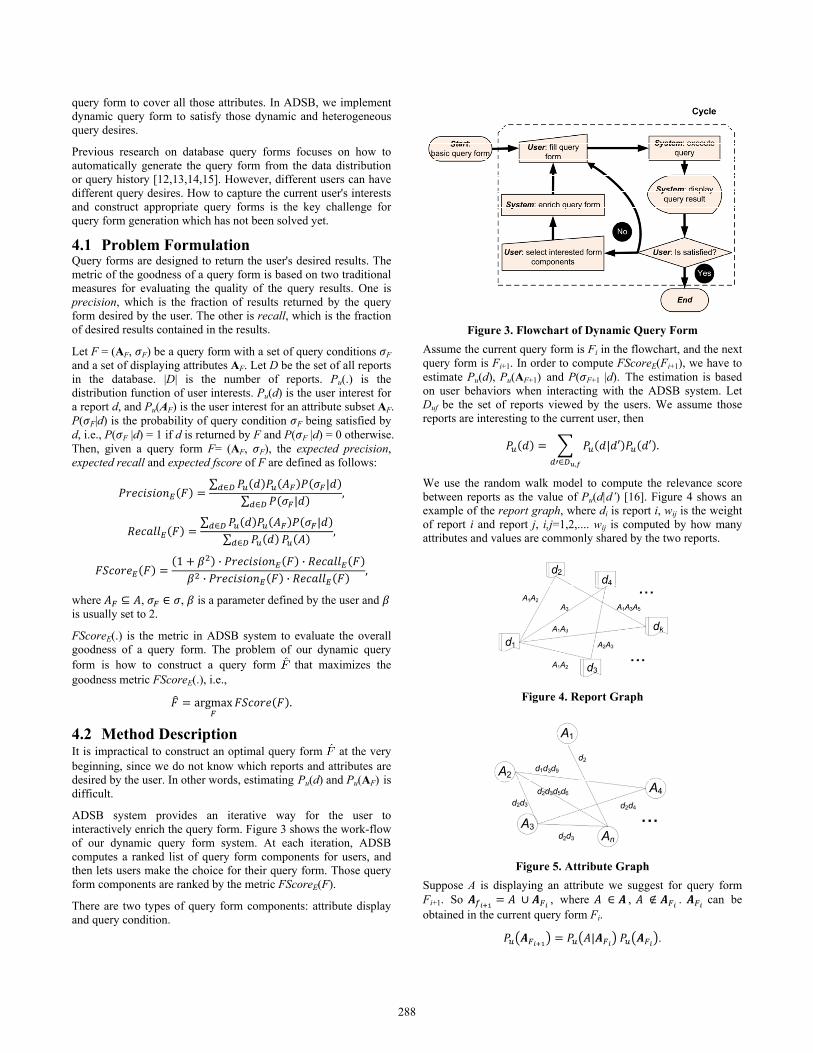
ADSB system provides an iterative way for the user to interactively enrich the query form. Figure 3 shows the work-flow of our dynamic query form system. At each iteration, ADSB computes a ranked list of query form components for users, and then lets users make the choice for their query form. Those query form components are ranked by the metric FScoreE(F).
There are two types of query form components: attribute display and query condition.
Figure 3. Flowchart of Dynamic Query Form
Assume the current query form is Fi in the flowchart, and the next query form is Fi+1. In order to compute FScoreE(Fi+1), we have to estimate Pu(d), Pu(AF+1) and P( F+1 |d). The estimation is based on user behaviors when interacting with the ADSB system. Let Duf be the set of reports viewed by the users. We assume those reports are interesting to the current user, then
|,
.
We use the random walk model to compute the relevance score between reports as the value of Pu(d|d’) [16]. Figure 4 shows an example of the report graph, where di is report i, wij is the weight of report i and report j, i,j=1,2,.... wij is computed by how many attributes and values are commonly shared by the two reports.
Figure 4. Report Graph
Figure 5. Attribute Graph
Suppose A is displaying an attribute we suggest for query form Fi+1. So , where , . can be obtained in the current query form Fi.
| .
288
We also estimate | by using random walk model on the attribute graph as shown in Figure 5. The nodes of the attribute graph are report attributes, and the edges are common reports. So the weight of the edge ij is computed by how many reports both own the two attributes i and j.
Suppose s is a query condition we suggest for query form Fi+1. So , where s is a single query condition for attribute As, . can be obtained in the current query form Fi. For
each report d D, | | | . It is very time-consuming to find the best s by brute-force search on all P(s|d). So we pre-compute the P(s|d) and store it in the database.
5. USER RECOMMENDATION ADSB’s user recommendation component provides an interface for the user to explore other users’ recommendations or share reports with other people. It is also a tool to help the user quickly identify sets of users with shared interests. It is designed by considering each individual’s transactional sharing history, textual content of each transaction and timeliness of interaction to provide each user with a personalized information sharing experience.
Related work during past years has been applied to email communication networks analysis to find important persons, identifying frequent communication pattern and detecting communities based on transactional user relationships [7,8,9, 10,11]. Those techniques can prevent a user from forgetting to add important recipients, avoid costly misunderstandings, and communication delays. Carvalho et al. [10] introduced several supervised learning models to predict the score of each user associated with a given email content. By aggregating TF-IDF vector of each email that a user was related to (by To, CC or BCC), it can predict the score of a new email to such user. However, it was not aware of the different importance of emails for senders and recipients. Horn et al. [11] explicitly associated higher weights to senders, and also consider user-interaction graph as a directed hyper-graph. It focused on the time and frequency of interactions but ignored the content information involved in each email, which could be an important indication of potential related users.
In ADSB, there are three practical considerations motivating the user recommendation: 1. To share information to the right/related people, users need an intelligent tool to help them auto-generate a recipient list which covers active users who could be highly interested in specific information; 2. Identifying meaningful groups of users is tough work, so users prefer efficient ways to organize contacts instead of navigating the contact list repeatedly; 3. It could be more effective and straightforward for one user to access information that others think it is important to him rather than finding it by himself.
So, ADSB system addresses the above-mentioned issues by considering both user interactions and textual information. In practice, we provide dynamic user suggestion for news recommendation and community recommendation interface to help our system users organize their critical partnerships.
5.1 Transactional Interactions In ADSB, an interaction or transaction is defined as the process of a user sharing a report with one or more other users. So, the reports sharing transaction database can be treated as a hyper-
graph with each node representing a registered user and a set of edges created at the same time from one node to a set of nodes representing an occurred transaction. There are three important factors associated with each edge:
Time: The time that the transaction happened. It indicates the importance of recency. In general, the more recently a transaction happens, the more important the report is to those users involved.
Direction: The relation of an interaction. An edge pointed from node A to node B indicating that A shares some information with a set of users including B. The direction indicates that the shared information is more important to the sender than to receivers.
Textual Content: Each transaction is associated with some certain textual content, so the content of an edge means that someone thinks such content is important or related to some group of users.
In practice, a personalized user recommendation requires the algorithm to identify potential users who have frequent and active interactions with the sender and are also interested in some certain topics. In completion of two recommendation tasks, we extend both [10] and [11] by taking the direction, timeliness and textual content of the interaction into consideration to generate 1) a suggested user list for specific report and 2) a suggested user list for specified seeds (users).
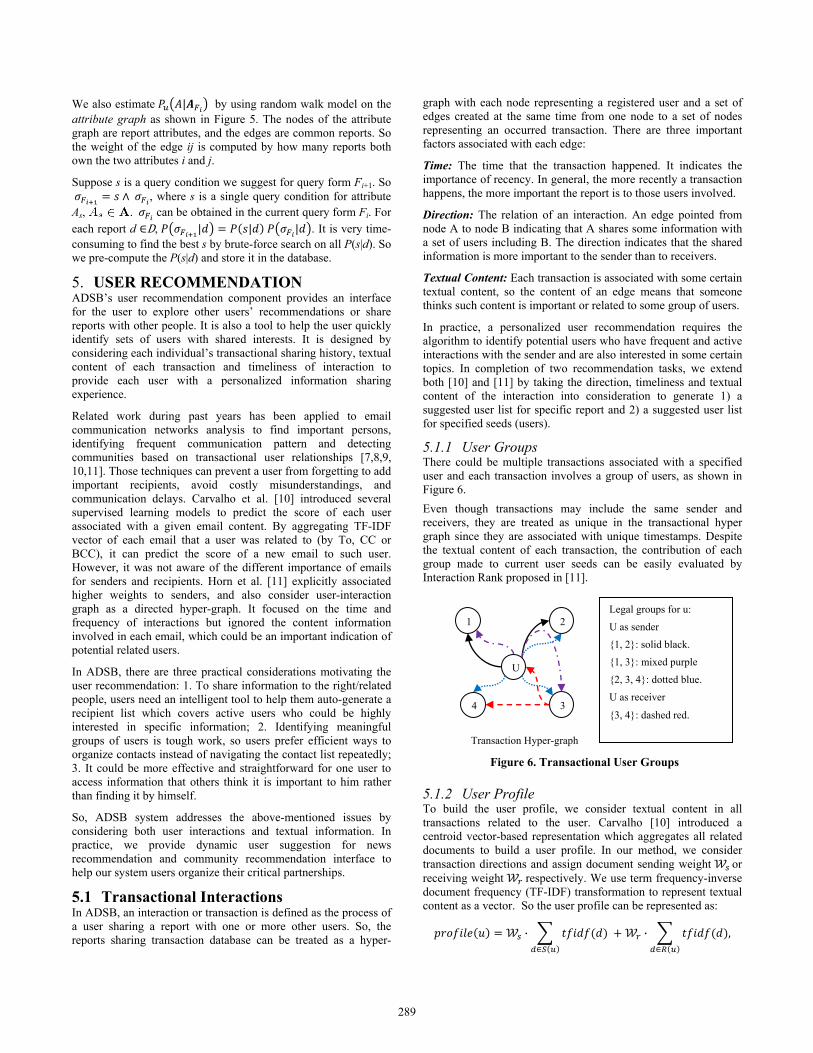
5.1.1 User Groups There could be multiple transactions associated with a specified user and each transaction involves a group of users, as shown in Figure 6.
Even though transactions may include the same sender and receivers, they are treated as unique in the transactional hyper graph since they are associated with unique timestamps. Despite the textual content of each transaction, the contribution of each group made to current user seeds can be easily evaluated by Interaction Rank proposed in [11].
5.1.2 User Profile To build the user profile, we consider textual content in all transactions related to the user. Carvalho [10] introduced a centroid vector-based representation which aggregates all related documents to build a user profile. In our method, we consider transaction directions and assign document sending weight or receiving weight respectively. We use term frequency-inverse document frequency (TF-IDF) transformation to represent textual content as a vector. So the user profile can be represented as:
· · ,
U
1 2
4 3
Legal groups for u:
U as sender
{1, 2}: solid black.
{1, 3}: mixed purple
{2, 3, 4}: dotted blue.
U as receiver
{3, 4}: dashed red.
Transaction Hyper-graph
Figure 6. Transactional User Groups
289
where is defined as
,
indicates a over-time exponential decay of
each document’s contribution. , are sets of documents which sent and received by respectively. So, for a report , user
’s preference to this report can be simply generated by computing the cosine similarity between the users profile and the TF-IDF vector of as:
, , .
Practically, user profile is stored separately and will not be updated in each calculation. Typically, it will be updated when there is new event announced or regularly every few days.
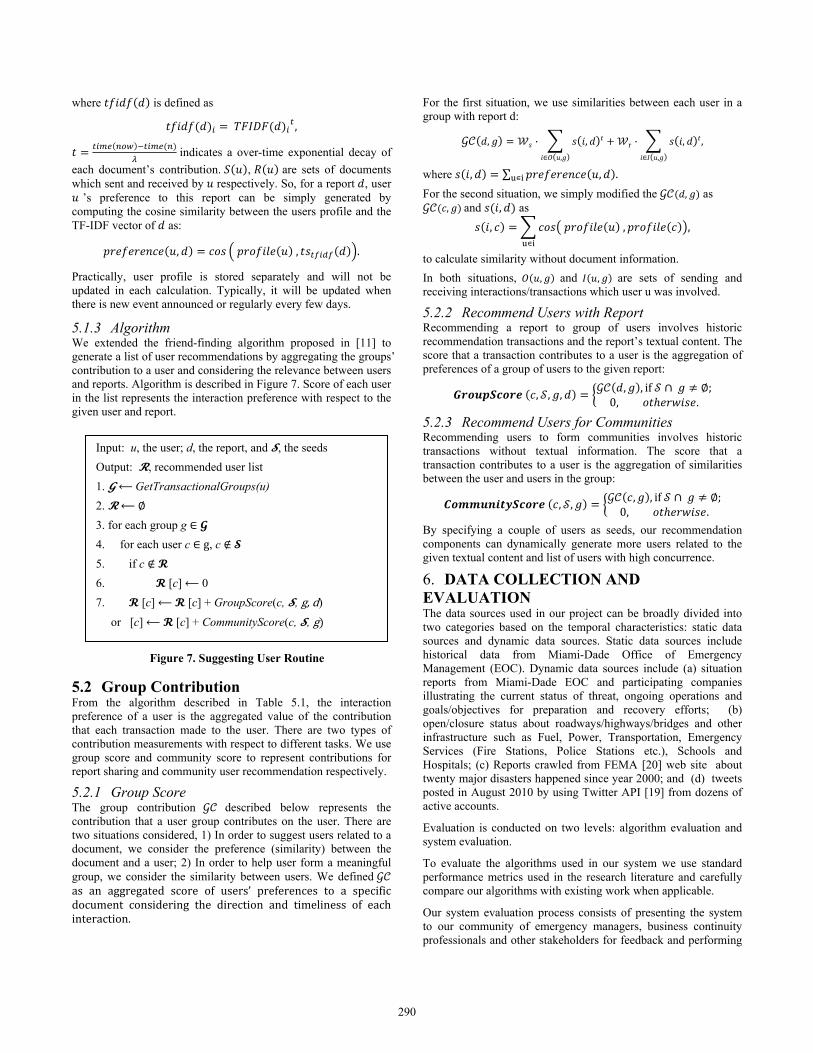
5.1.3 Algorithm We extended the friend-finding algorithm proposed in [11] to generate a list of user recommendations by aggregating the groups’ contribution to a user and considering the relevance between users and reports. Algorithm is described in Figure 7. Score of each user in the list represents the interaction preference with respect to the given user and report.
5.2 Group Contribution From the algorithm described in Table 5.1, the interaction preference of a user is the aggregated value of the contribution that each transaction made to the user. There are two types of contribution measurements with respect to different tasks. We use group score and community score to represent contributions for report sharing and community user recommendation respectively.
5.2.1 Group Score The group contribution described below represents the contribution that a user group contributes on the user. There are two situations considered, 1) In order to suggest users related to a document, we consider the preference (similarity) between the document and a user; 2) In order to help user form a meaningful group, we consider the similarity between users. We defined as an aggregated score of users’ preferences to a specific document considering the direction and timeliness of each interaction.
For the first situation, we use similarities between each user in a group with report d:
, · ,,
r · ,,
,
where , ∑ , .
For the second situation, we simply modified the , as , and , as
, , ,
to calculate similarity without document information.
In both situations, , and , are sets of sending and receiving interactions/transactions which user u was involved.
5.2.2 Recommend Users with Report Recommending a report to group of users involves historic recommendation transactions and the report’s textual content. The score that a transaction contributes to a user is the aggregation of preferences of a group of users to the given report:
, , ,, , if ;
0, .
5.2.3 Recommend Users for Communities Recommending users to form communities involves historic transactions without textual information. The score that a transaction contributes to a user is the aggregation of similarities between the user and users in the group:
, ,, , if ;
0, .
By specifying a couple of users as seeds, our recommendation components can dynamically generate more users related to the given textual content and list of users with high concurrence.
6. DATA COLLECTION AND EVALUATION The data sources used in our project can be broadly divided into two categories based on the temporal characteristics: static data sources and dynamic data sources. Static data sources include historical data from Miami-Dade Office of Emergency Management (EOC). Dynamic data sources include (a) situation reports from Miami-Dade EOC and participating companies illustrating the current status of threat, ongoing operations and goals/objectives for preparation and recovery efforts; (b) open/closure status about roadways/highways/bridges and other infrastructure such as Fuel, Power, Transportation, Emergency Services (Fire Stations, Police Stations etc.), Schools and Hospitals; (c) Reports crawled from FEMA [20] web site about twenty major disasters happened since year 2000; and (d) tweets posted in August 2010 by using Twitter API [19] from dozens of active accounts.
Evaluation is conducted on two levels: algorithm evaluation and system evaluation.
To evaluate the algorithms used in our system we use standard performance metrics used in the research literature and carefully compare our algorithms with existing work when applicable.
Our system evaluation process consists of presenting the system to our community of emergency managers, business continuity professionals and other stakeholders for feedback and performing
Input: u, the user; d, the report, and , the seeds
Output: , recommended user list
1. GetTransactionalGroups(u)
2.
3. for each group g
4. for each user c g, c
5. if c
6. [c] 0
7. [c] [c] + GroupScore(c, , g, d)
or [c] [c] + CommunityScore(c, , g
Figure 7. Suggesting User Routine
290
community exercises. The community exercises involve a real time simulation of a disaster event and are integrated into an existing exercise that the community conducts for readiness each year. This evaluation exposes information at different time intervals and asks the community to resolve different scenarios by using the tool developed. The evaluation conducted takes on the form of a “table-top” exercise in which information injects provide details about the current disaster situation and specify potential goals and course of action. In return, the participant uses the system to gather information to best assess the situation and provide details about the actions they will take. We gather information from the user about what information they found to derive their conclusions or lack thereof. This information allows us to better understand how those techniques overall improve the information effectiveness.
Feedbacks from our users are overwhelming positive and suggest that our system can be used not only to share the valuable actionable information but to pursue more complex tasks like business planning and decision making. There are also many collaborative missions that can be undertaken on our system which allows public and private sector entities to leverage their local capacity to serve the recovery of the community. Our initial work has been recognized by FEMA (Federal Emergency Management Agency) Private Sector Office as a model in assistance of Public-Private Partnerships [21].
7. SYSTEM OPERATION AND CONCLUSION FIU has spent over $600K in the development of the application and has received over $400K in sponsored research or industry donation. The system is utilized by over 100 companies in local communities and County emergency agencies in the south Florida area, which facilitates the collaboration on their mutual interest of disaster preparedness, response and recovery and benefits. The system is monitored 24/7 via scripts that verify application, database, web server, and hardware availability. The system is managed in a revision control system and is running through a test suite that validates key functionality such as report submission, keyword searching, and dynamic queries.
The potential impact of this research on the economy is enormous. A study by the Insurance Information Institute (III) shows that significant economic impacts can result from even minor events; an event that forced the permanent closure of just 1% of businesses in Broward, Miami-Dade, and Monroe Counties (the South Florida tri-county area) would result in 13,500 lost jobs, over $1.8 billion in lost sales, and over $414 million in lost payroll for the first year. Our analysis shows that, if our system helps 5% of the companies in the South Florida area to speed up their hurricane recovery by 1 week, it will prevent more than $200 million dollars of non-property economic losses that would result from that week’s closure [6].
8. ACKNOWLEDGMENTS This work is supported by NSF grant HRD-0833093 and DHS grant 2009-ST-062-000016. We thank Jesse Domack, Mark Oleson and Jason Allen for their work in the system development and testing.
9. REFERENCES [1] The Conference Board. Preparing for the worst: A guide to business
continuity planning for mid-markets. Executive Action Series, February 2006.
[2] R. Berg. Hurricane Ike Tropical Cyclone Report. NHC. Retrieved 2009-09-12.
[3] Wikipedia. http://en.wikipedia.org/wiki/Restlet.
[4] R.T. Fielding, (2000), Architectural Styles and the Design of Network-based Software Architectures, Doctoral dissertation, University of California, Irvine.
[5] V. Hristidis, S. Chen, T. Li, S. Luis, and Y. Deng. Survey of data management and analysis in disaster situations. The Journal of Systems and Software, 83:1701–1714, 2010.
[6] L. Zheng, C. Shen, L. Tang, T. Li, S. Luis, S. Chen, and V. Hristidis. Using data mining techniques to address critical information exchange needs in disaster affected public-private networks, KDD ’10, pages 125–134, 2010.
[7] M.D. Choudhury , W. A. Mason , Jake M. Hofman , Duncan J. Watts, Inferring relevant social networks from interpersonal communication, Proceedings of the 19th international conference on World wide web, April 26-30, 2010.
[8] I. Kahanda and J. Neville. Using transactional information to predict link strength in online social networks. In Proceedings of the Third International Conference on Weblogs and Social Media (ICWSM), June 2009.
[9] S. Yoo , Y. Yang , F. Lin , I. Moon, Mining social networks for personalized email prioritization, Proceedings of the 15th ACM SIGKDD international conference on Knowledge discovery and data mining, June 28-July 01, 2009, Paris, France.
[10] V. R. Carvalho , W.W. Cohen, Ranking users for intelligent message addressing, Proceedings of the IR research, 30th European conference on Advances in information retrieval, March 30-April 03, 2008, Glasgow, UK.
[11] I. Horn, A. Leichtberg, N. Leiser, Y. Matias, and R. Merom. Suggesting friends using the implicit social graph. In Proceedings of KDD-2010, pages 233–242.
[12] M. Jayapandian and H.V. Jagadish. Automated creation of a forms-based database query interface. In Proceedings of VLDB 2008, pages 695-709.
[13] M. Jayapandian and H.V. Jagadish. Expressive query specification through form customization. In Proceedings of EDBT 2008, pages 416-427.
[14] M. Jayapandian and H.V. Jagadish. Automating the design and construction of query forms. IEEE TKDE 21(10): 1389-1402, 2009.
[15] P.P. Talukdar, M. Jacob, M.S. Mehmood, K. Crammer, Z. G. Ives, F. Pereira, and S. Guha. Learning to create data-integrating queries. In Proceedings of VLDB 2008, pages 785-796.
[16] H. Tong, C. Faloutsos, and J. Pan. Fast random walk with restart and its application. In Proceedings of ICDM 2006, pages 613-622.
[17] B.J. Frey and D. Dueck, Clustering by passing messages between data points. Science. 2007
[18] G. Erkan and D.R. Radev, Lexpagerank: Prestige in multi-document text summarization. In Proceedings of EMNLP, 2004.
[19] Twitter API, http://apiwiki.twitter.com.
[20] FEMA, http://www.fema.gov.
[21] FEMA public Private Partnership Models. http://www.fema.gov/pri- vatesector/ppp_models.shtm. under Miami-Dade County.
[22] comScore Press Events. http://www.comscore.com/Press_Events/ Press_Releases/2010/3/Facebook_and_Twitter_Access_via_Mobile_Browser_Grows_by_Triple-Digits. March 3, 2010.
291