
Applying CBR to Machine Tool Product Configuration Design ...
17
CHINESE JOURNAL OF MECHANICAL ENGINEERING Vol. 30,aNo. 1,a2017 ·60· DOI: 10.3901/CJME.2016.0113.007, available online at www.springerlink.com; www.cjmenet.com Applying CBR to Machine Tool Product Configuration Design Oriented to Customer Requirements WANG Pengjia 1, * , GONG Yadong 1 , XIE Hualong 1 , LIU Yongxian 1 , and NEE Andrew Yehching 2 1 School of Mechanical Engineering and Automation, Northeastern University, Shenyang 110819, China 2 Department of Mechanical Engineering, National University of Singapore, Singapore 117576, Singapore Received September 24, 2015; revised January 11, 2016; accepted January 13, 2016 Abstract: Product customization is a trend in the current market-oriented manufacturing environment. However, deduction from customer requirements to design results and evaluation of design alternatives are still heavily reliant on the designer’s experience and knowledge. To solve the problem of fuzziness and uncertainty of customer requirements in product configuration, an analysis method based on the grey rough model is presented. The customer requirements can be converted into technical characteristics effectively. In addition, an optimization decision model for product planning is established to help the enterprises select the key technical characteristics under the constraints of cost and time to serve the customer to maximal satisfaction. A new case retrieval approach that combines the self-organizing map and fuzzy similarity priority ratio method is proposed in case-based design. The self-organizing map can reduce the retrieval range and increase the retrieval efficiency, and the fuzzy similarity priority ratio method can evaluate the similarity of cases comprehensively. To ensure that the final case has the best overall performance, an evaluation method of similar cases based on grey correlation analysis is proposed to evaluate similar cases to select the most suitable case. Furthermore, a computer-aided system is developed using MATLAB GUI to assist the product configuration design. The actual example and result on an ETC series machine tool product show that the proposed method is effective, rapid and accurate in the process of product configuration. The proposed methodology provides a detailed instruction for the product configuration design oriented to customer requirements. Keywords: customer requirements, case-based reasoning, machine tool, case retrieval, case evaluation, computer-aided system 1 Introduction With the development of economic globalization, product customization is a trend in current market-oriented manufacturing environment [1] . In the customization environment, manufacturing enterprises should be able to offer individualized products quickly after the order has been taken. As a symbol of advanced manufacturing technology, machine tool products are facing the same problem. Many new principles and approaches, such as axiomatic design(AD) and quality function deployment (QFD), have been introduced to help designers identify the relationship between customer requirements and design characteristics. TAHA, et al [2] , used axiomatic design method to map customer domain to functional domain and physical domain. ZHANG, et al [3] , used the house of quality to translate customer requirements into engineering characteristics and adopted fuzzy set theory to address the uncertainty in the decision making process. However, * Corresponding author. E-mail: [email protected] Supported by State Science and Technology Support Program of China (Grant No. 2012BAF12B08-04), and Liaoning Provincial Key Scientific and Technological Project of China(Grant Nos. 2011216010, 2010020076-301) © Chinese Mechanical Engineering Society and Springer-Verlag Berlin Heidelberg 2017 deduction from customer requirements to design results and evaluation of design alternatives are still heavily reliant on the designer’s experience and knowledge, and they are time-consuming jobs as well. This will affect the efficiency and effectiveness of the customization design process and even make the development of design automation more difficult. Case-based design(CBD) is an intelligent method that emphasizes finding appropriate past experience to the solution of new problems, which involves retrieving the most similar previous cases from the case library (also known as case base or memory) to provide solution of a new decision problem and to ignore previous cases that are irrelevant [4–5] . Therefore, case-based reasoning(CBR) could be applied to solve the product configuration problem to satisfy customers rapidly and efficiently. In a CBR system, knowledge and previous experiences are stored as cases in a case library. Here, the central issue is the similarity measurement(SM) to find the most useful and helpful case to solve the target problem [6] . In a CBD cycle, case retrieval (CR) is the first and most crucial process. Undoubtedly, the SM mechanism greatly influences the retrieval performance of CR. The attempts at CBD application in customization design have already been studied in early research. TSENG, et al [7] , applied CBR
Transcript of Applying CBR to Machine Tool Product Configuration Design ...

CHINESE JOURNAL OF MECHANICAL ENGINEERING Vol. 30,aNo. 1,a2017
·60·
DOI: 10.3901/CJME.2016.0113.007, available online at www.springerlink.com; www.cjmenet.com
Applying CBR to Machine Tool Product Configuration Design Oriented to Customer Requirements
WANG Pengjia1, *, GONG Yadong1, XIE Hualong1, LIU Yongxian1, and NEE Andrew Yehching2
1 School of Mechanical Engineering and Automation, Northeastern University, Shenyang 110819, China 2 Department of Mechanical Engineering, National University of Singapore, Singapore 117576, Singapore
Received September 24, 2015; revised January 11, 2016; accepted January 13, 2016
Abstract: Product customization is a trend in the current market-oriented manufacturing environment. However, deduction from
customer requirements to design results and evaluation of design alternatives are still heavily reliant on the designer’s experience and
knowledge. To solve the problem of fuzziness and uncertainty of customer requirements in product configuration, an analysis method
based on the grey rough model is presented. The customer requirements can be converted into technical characteristics effectively. In
addition, an optimization decision model for product planning is established to help the enterprises select the key technical
characteristics under the constraints of cost and time to serve the customer to maximal satisfaction. A new case retrieval approach that
combines the self-organizing map and fuzzy similarity priority ratio method is proposed in case-based design. The self-organizing map
can reduce the retrieval range and increase the retrieval efficiency, and the fuzzy similarity priority ratio method can evaluate the
similarity of cases comprehensively. To ensure that the final case has the best overall performance, an evaluation method of similar cases
based on grey correlation analysis is proposed to evaluate similar cases to select the most suitable case. Furthermore, a computer-aided
system is developed using MATLAB GUI to assist the product configuration design. The actual example and result on an ETC series
machine tool product show that the proposed method is effective, rapid and accurate in the process of product configuration. The
proposed methodology provides a detailed instruction for the product configuration design oriented to customer requirements.
Keywords: customer requirements, case-based reasoning, machine tool, case retrieval, case evaluation, computer-aided system
1 Introduction
With the development of economic globalization, product customization is a trend in current market-oriented manufacturing environment[1]. In the customization environment, manufacturing enterprises should be able to offer individualized products quickly after the order has been taken. As a symbol of advanced manufacturing technology, machine tool products are facing the same problem. Many new principles and approaches, such as axiomatic design(AD) and quality function deployment (QFD), have been introduced to help designers identify the relationship between customer requirements and design characteristics. TAHA, et al[2], used axiomatic design method to map customer domain to functional domain and physical domain. ZHANG, et al[3], used the house of quality to translate customer requirements into engineering characteristics and adopted fuzzy set theory to address the uncertainty in the decision making process. However,
* Corresponding author. E-mail: [email protected] Supported by State Science and Technology Support Program of China
(Grant No. 2012BAF12B08-04), and Liaoning Provincial Key Scientific and Technological Project of China(Grant Nos. 2011216010, 2010020076-301)
© Chinese Mechanical Engineering Society and Springer-Verlag Berlin Heidelberg 2017
deduction from customer requirements to design results and evaluation of design alternatives are still heavily reliant on the designer’s experience and knowledge, and they are time-consuming jobs as well. This will affect the efficiency and effectiveness of the customization design process and even make the development of design automation more difficult.
Case-based design(CBD) is an intelligent method that emphasizes finding appropriate past experience to the solution of new problems, which involves retrieving the most similar previous cases from the case library (also known as case base or memory) to provide solution of a new decision problem and to ignore previous cases that are irrelevant[4–5]. Therefore, case-based reasoning(CBR) could be applied to solve the product configuration problem to satisfy customers rapidly and efficiently. In a CBR system, knowledge and previous experiences are stored as cases in a case library. Here, the central issue is the similarity measurement(SM) to find the most useful and helpful case to solve the target problem[6]. In a CBD cycle, case retrieval (CR) is the first and most crucial process.
Undoubtedly, the SM mechanism greatly influences the retrieval performance of CR. The attempts at CBD application in customization design have already been studied in early research. TSENG, et al[7], applied CBR

CHINESE JOURNAL OF MECHANICAL ENGINEERING
·61·
technique to the planning of BOM in mass customization environments. JUAN, et al[8], presented a system to support decision making in housing customization using a hybrid approach combining case-based reasoning and genetic algorithm. FOK, et al[9], presented a case-based design system for the conceptual design of electrical connectors. NOORI[10], developed a CBR system for marketing mix planning. DAN, et al[11], presented a configuration method of product family with the reasoning based on constraints and cases. AHN, et al[12], proposed a hybrid method combining CBR and knowledge-based technique to support the customization of software processes. HO, et al[13], proposed an infrastructural framework, involving various emerging technologies, for the development of an agent-based quality enhancement system with the distinct feature of the ability to cope with the potential quality problems from various customers’ requirements. However, conventional CBR is too reliant on experts’ experiences, especially at the early stages[14]. LIN, et al[15], pointed out that understanding customer voice and enhancing design characteristics which meet customer requirements are the challenges for designers.
With the rapid development of CBR, a large-scale case base is becoming more common, with the number of cases ranging from hundreds to thousands[16]. Although an enormous case base may improve the coverage of the problem domain, it also causes problems of retrieval efficiency and introduces many noisy cases. In past decades, many studies have been conducted to promote the performance of similarity measurement. ZHANG, et al[17], used the fuzzy analogy preferred ratio algorithm to carry out the searching of the case. LI, et al[18], proposed a novel module-based similarity measurement method to calculate feature similarities of modules between a new tooling ontology and each similar tooling ontology. CHENG, et al[19], presented a non-linear formation of Local-Global retrieval based on artificial neural network(ANN), which can provided a higher accuracy. LI, et al[20], proposed a novel geometry search approach to recommend tool selection for review and reuse based on previous cases. However, few studies focus on other aspects that can be further combined to strengthen the retrieval efficiency[21]. The mean by which to convert fuzzy and uncertain customer requirements and improve the retrieval efficiency to optimize the CBR system have become critical issues[22]. Thus, development of a customer requirements conversion method without any human intervention and an efficient case retrieval approach is an urgent need to assist product configuration design.
Therefore, this paper presents an analysis model based on the grey rough model to solve the problem of fuzziness and uncertainty of customer requirements in product configuration. In addition, an optimization decision model for product planning is established to help the enterprises select the key technical characteristics under the constraints of cost and time to serve the customer to maximal
satisfaction. Moreover, this paper proposes a new case retrieval approach that combines the self-organizing map and fuzzy similarity priority ratio method in case retrieval. The self-organizing map is used to reduce the retrieval range and increase the retrieval efficiency, and the fuzzy similarity priority ratio method is used to evaluate the similarity of cases comprehensively. To ensure that the final case has the best overall performance, an evaluation model of similar cases based on the grey correlation analysis is proposed to evaluate similar cases to select the most suitable case. Furthermore, based on the proposed methods, a computer-aided platform is developed using MATLAB GUI to assist in the machine tool product configuration design.
The remaining sections of this paper are organized as follows:
Section 2 gives a brief review of the related work. Section 3 presents the new methods in detail. Section 4 gives an example to illustrate the procedure. In the final section, the discussions and conclusions are presented.
2 Related Works
2.1 Customer requirement processing and conversion In view of customer requirement conversion and
mapping, much work has been performed by scholars, and there have already been many achievements in this field. YUAN, et al[23], proposed the concepts of requirement unit and granularity of requirement unit to decompose the customer requirements appropriately. LOU, et al[24], established the web-based customer requirements interactive platform. The information of customer requirements were expressed and mapped by fuzzy theory, and the method was realized in consequence of fuzzy frame and configuration based rules. GUO, et al[25], presented a new method of analyzing dynamic product information through the web media. Based on the analysis of advantages/disadvantages of the distributed and concentrated web data source, a systematic mapping relationship, from the original web source to structured marketing data setting, was established. ZHOU, et al[26], proposed a model of product customization for satisfying customers. According to the influence of the attribute indices of the customization product on customer satisfaction, the model classified indices into three types: positive related index, negative related index and point index, and customer satisfaction was obtained based on the statistic theories and curve matching. The method above particularly stresses the qualitative expression of customer requirements.
GUO, et al[27], and ZHANG, et al[28], considered from the perspective of customers, established a customization product data structure which can not only reflects the customer requirements but also the product structure, performance. The method above mainly focuses on a completely new design, but in actual engineering practice,

WANG Pengjia, et al: Applying CBR to Machine Tool Product Configuration Design Oriented to Customer Requirements
·62·
the development of new products is almost always evolved from an existing product. The current methods do not reflect the essence of evolutionary product design.
In the engineering area, quality function deployment (QFD) is a sort of method that is widely applied to communicate and coordinate the market and engineering. The core of QFD is to convert customer requirements to characteristic for product design and to further part features, process features and production requirements by using House of Quality(HoQ). However, in the process of QFD, the information needed in HoQ reflects the judgement, perception and assessment of a human[29]. There are some fuzziness and uncertainty in many cases. Moreover, the limitation of QFD also lies in that it reveals only the customer requirements, and it has no relation to the configuration design.
Therefore, this paper presents an analysis method based on the grey rough model to solve the problem of fuzziness and uncertainty of customer requirements in product configuration without any influence of human factors. In addition, an optimization decision model for product planning is established to help enterprises select the key configuration characteristics under the constraints of cost and time to serve the customers with maximal satisfaction.
2.2 Case retrieval
Case retrieval is the core of the case-based design. Many researchers have conducted many works to improve retrieval performance by enhancing the process of similarity measurement[30]. Similarity measurement between pairs of features plays a central role in CR research. Many case-based design systems have represented cases using features and employed a similarity function to measure the similarities between new and prior cases[31].
The approach commonly used to assess similarity is the distance function including Euclidean distance and Manhattan distance[32]. CHIU, et al[33], proposed GA-based feature weighting together with number of nonlinear similarity function based on standard Euclidean distance metric. Cosine matching function to select the case that could be found in Ref. [34]. Ever since ZADEH, et al[35], introduced the concept of fuzzy logic, fuzzy-set theory has been applied in the customer-driven products design to describe the complex, uncertain and vague variables. Much CR literature based on fuzzy set has been implemented. Examples include Ref. [36] and Ref. [37], etc.
These previous CR studies for product design focus only on the SM methods algorithm itself. These methods can generate a better computational performance, but it is more difficult and more time-consuming[38]. They can not resolve the problem of low efficiency[39]. However, by clustering, the case base can be transformed into several small ones in which the cases are more similar in each cluster. The most similar cluster would be retrieved and compared with the new case to find the suitable one. The retrieval efficiency
will then be increased, and the CR performance will be strengthened.
Many clustering algorithms and datamining techniques were introduced to strengthen the retrieval efficiency and accuracy by eliminating redundant and erroneous cases[40]. CAO, et al[41], proposed a fuzzy-rough method for case library maintenance and adaptation knowledge mining. They used fuzzy-rough method to learn feature weights, and divided the case base into some clusters. YANG, et al[42], developed an interactive CBR which used clustering algorithm to merge similar cases together and create decision forests to help divide a large case library into several small ones. To resolve the problems in case adaptation, JUNG, et al[43], built a RBF network on the basis of typical cases generated by k-means clustering, and obtained the most similar typical one through the network after appropriate adjustment.
Although clustering is a promising technique in case deduction, most conventional clustering algorithms suffer from many serious problems. First of all, most clustering algorithms must define auxiliary information in advance[44]. However, it is not always possible to predefine the proper clustering strategy, the topology of the clustering and the number of clusters. Second, conventional clustering algorithms lack the ability to visualize the inherent relationships of the clustering results. To address these issues, this paper introduces a new case retrieval approach that combines the self-organizing map and fuzzy similarity priority ratio method in case retrieval. The self-organizing map is used to reduce the retrieval range and increase the retrieval efficiency. The self-organizing map is an unsupervised self-learning neural network, namely, without the need to give any target output for creating a network. Most importantly, it can offer the user the proper clusters and the visualization of the inherent hierarchical relations of the case library by stacking similar cases in close proximity. The visualization is extremely useful in situations where there are many uncertainties in retrieval requirements such as customer-oriented product configuration design to help identify the customer’s true perception. A similarity measurement method based on the fuzzy similarity priority ratio is then proposed to comprehensively evaluate the similarity of cases retrieved from the case library.
3 Proposed Methodology
3.1 Customer requirement conversion method 3.1.1 Acquisition of customer requirements
Customer requirements are defined as the demands on product expressed by customers, from their own perspective and in their own languages. Customer requirements, which determine the functionality and specifications of a product, are the basic foundation and guidance for product design and manufacturing. If a

CHINESE JOURNAL OF MECHANICAL ENGINEERING
·63·
product is designed and manufactured without knowing the customer requirements, it will inevitably lead to product backlog and less competitive power. For product configuration design, customer requirements are needed first[45]. The main means to obtain customer requirements include a questionnaire survey, telephone survey, face-to-face conversation, analysis of customer feedback and customer complaints, Internet survey, analysis of the competitor’s product, active analysis method and organizing different users to carry on a discussion[46–47]. The methods to acquire customer requirements can be summarized in the following three parts:
(1) Market survey A market survey is the most basic customer requirement
acquisition method and mainly includes an inquiry survey and observation survey. The inquiry survey could acquire information from respondents’ answer to investigators’ questions. The inquiry survey can be conducted via face-to-face conversation, investigative calls, questionnaire survey, etc. The 5 W1H method is usually adopted in the inquiry survey to obtain requirements quickly, namely, Who(customer), When(when to use the product), Where(the use environment of the products), What (requirements or problems), Why(why the requirements or problems exist), How(how to realize the requirements). The observation survey could yield the required information by observing and summarizing the conditions of respondents onsite.
(2) Analysis of the data from internal and external enterprise
The customer requirements could be obtained by analysing the information recorded in the enterprise internal database, such as customer basic materials, order history, customers’ after-sale need, customer complaint, and customer feedback. Meanwhile, the data from external enterprise should be given sufficient attention to help the enterprises grasp the latest trends, developments, market movements and technological advances.
(3) Web-based requirement acquisition approach With the rapid development and wide application of
network and information technology, the Internet has already entered people’s lives, and the enterprise informatization level is increasingly higher. Internet technology has broken the locality, space and time constraints and established an effective and convenient communication platform between enterprises and customers. Web-based technology has already been widely used to obtain customer requirements.
3.1.2 Classification of customer requirements
The product configuration design is a type of design method that takes the requirements model and configuration model as the input, and takes the final product that meets the satisfaction of customers as the output by selecting an appropriate configuration method. Owing to the differences in product models established by
each customer, the customer requirements can be divided into structured requirements and unstructured requirements according to the models. The machine tool product was used as an example, and the classification of customer requirements is shown in Fig. 1.
Fig. 1. Classification of machine tool customer requirements (1) Structured customer requirements This type of customer requirement clearly expresses the
parametric information of product features, which can be used directly. There is a mapping between structured customer requirements and technical characteristics; thus, the conversion process is not required. For example, customers directly regulate the machining object, lathe bed type and required technical characteristics, such as maximum cutting length and maximum spindle speed.
(2) Unstructured customer requirements This type of customer requirement has the characteristics
of fuzziness and uncertainty. The model of unstructured customer requirements is not concrete and has no regular pattern or normalized form. By convention, the unstructured requirements are depicted by customers from their own points of view, which lack the mapping relationships with technical characteristics. For example, customers merely put forward some nonparametric information such as wide processing range, high productivity, high machining accuracy, easy maintenance and long usage life on the machine tool product. To solve the problem of fuzziness and uncertainty in customer requirements during product configuration, the conversion of unstructured customer requirements is necessary.
3.1.3 Conversion process of customer requirements
Undoubtedly, the conversion of customer requirements was performed on unstructured requirements. The unstructured requirements were further decomposed and quantized and then were converted and mapped to generate a product configuration scheme. The product configuration is a process that converts customer requirements into a configuration structure. To realize this process, a mapping among customer requirements, product configuration

WANG Pengjia, et al: Applying CBR to Machine Tool Product Configuration Design Oriented to Customer Requirements
·64·
parameters and structure of product modules must be performed. A product configuration parameter table is a characteristic attribute table for a product that symbolizes the attributes of the product and related parameter values, and its structure includes the parametric type, descriptive type and selective type. The product configuration parameter table includes all functions, performances, structures and dimension parameters and provides evidence for product configuration[48–50]. There is a one-to-one correspondence between the structured requirements and information of configuration parameters. The unstructured requirements must be converted and moved closer to the configuration parameters. The machine tool product configuration was used as an example, and the two-level mapping of customer requirements is shown in Fig. 2.
Fig. 2. Two-level mapping of customer requirements for machine tool product
In Fig. 2, the first level is a mapping between customer
requirements and product configuration parameters. This process decomposed and converted unstructured requirements to structured requirements and formed the table of structured configuration parameters. The mapping between unstructured requirements and the configuration parameters table is usually a one-to-many relationship, which converts an unstructured requirement to many technical characteristics in the configuration parameters table. Based on the customer requirements survey, the customers generally require that the machine tool product have characteristics of a wide processing range, high machining precision, high efficiency, etc. Functionality and performance are the most important information among customers, and requirements regarding the appearance and price of machine tool products are few. These unstructured requirements can be decomposed into the following technical characteristics: maximum cutting length, maximum cutting diameter, X-axis travel, Z-axis travel, maximum spindle speed, X-axis positioning accuracy, Z-axis positioning accuracy and surface roughness. The
second level is the mapping between the machine tool product configuration parameters and machine tool product functional modules. The configuration modules can be divided into basic function modules and optional function modules[51–52]. Through conversion of the mapping relationship, the retrieval and matching of a machine tool product can be finally realized.
3.1.4 Conversion algorithm of customer requirements
The idea of rough set was proposed by PAWLAK(1981) as a new mathematical tool to deal with uncertain (including vague) systems. The most prominent characteristic of rough set theory is that it provides an objective form of analysis. Rough set analysis requires no additional information, external parameters, models, functions, grades or subjective interpretations to determine set membership; instead, it uses only the information presented within the given data. Thus, by using the rough set theory to convert customer requirements, all human intervention can be avoided. The grey systems theory, established by DENG in 1982, is a new methodology that focuses on the study of problems involving small samples and poor information. It addresses uncertain systems with partially known information by generating, excavating, and extracting useful information from what is available.
Therefore, this paper proposes an analysis method of customer requirements based on the grey rough model aimed at the problems of fuzziness, uncertainty and small sample size of customer requirement information in the product configuration design. The grey rough model is a mathematical model that combines the rough set and grey system theory. The grey rough model mainly targets the fuzziness of customer requirements and is also a good tool for eliminating uncertainty with few data. Through this method, the configuration parameters can be described accurately by extracting valuable information from the given information. The grey rough model was established through the upper approximation, the lower approximation and the whiting method of grey information.
The relevant definitions are shown as follows: Grey numbers (denoted by ) are the basic unit of the
grey system and indicate an uncertain number in a certain range. The interval grey number (denoted by [ , ]u u ) is the grey number with the upper and lower bound in the grey system.
For unstructured customer requirements, technical characteristics gained through analysis and conversion are used as the design parameters of the product under configuration. Suppose that the existing products are the objects under evaluation, and the set of objects under evaluation is U={1, 2, , n}; the corresponding attribute
set of each object is A={a1, a2, a3, , aj}, the quantitative
evaluation value of object i under attribute aj is a nonnegative interval grey number:
( ) , ,0 , 1, 2, , .ij ij ijij iju u u u u j mÄ Î =≤ ≤

CHINESE JOURNAL OF MECHANICAL ENGINEERING
·65·
The quantitative evaluation vector of object i is then
1 2( ) ( ( ), ( ), , ( )), 1, 2, , .i i i imu u u u i nÄ = Ä Ä Ä =
To enhance the clarity of the description, the machine
tool product was used as the example to explain the conversion algorithm of customer requirements. The general steps of the grey rough model are shown as follows:
(1) Establish the grey information table G=(U, A), according to the existing machine tool product set U and their technical characteristic set A. The range of values for each technical characteristic was described in the grey information table.
(2) Normalize the data in the grey information table by using the range transformation formula. The values of different technical characteristics have different orders of magnitude. To give every characteristic the same order of magnitude, normalization processing should be performed.
The range transformation formula is shown as follows:
, ,ijij j j
ijijjj jj
u u u ux x
u uu u
- -
+ -+-
- -= =
-- (1)
{ } { }11
max , min , 1,2, , .j ij j iji ni n
u u u u j m-+ = = =≤≤≤≤
(2)
Through normalization of ( )iju Ä , the normalized
valuation vector can be obtained as follows: 1 2( ) ( ( ), ( ), , ( )), ( ) [ , ].i i i im ij ijijx x x x x x xÄ = Ä Ä Ä Ä Î
(3) Determine the ideal evaluation vector of the product
that meets the customer requirements. For a machine tool product, the selection principle of the ideal evaluation vector is to select the optimal value of each index from the standardized grey information table. For example, with the maximum cutting length(A1), the maximum value is the most optimal value, but for the surface roughness(A8), the minimal value is the most optimal.
{ } { }
{ } { }1 1
1 1
min , max ,
min , max .
j ij j iji n i n
j ij j iji n i n
x x x x
x x x x
- +
- +
= =
= =
≤≤ ≤≤
≤≤ ≤≤
(3)
By Eq. (3), the ideal evaluation vector can be obtained as
shown below:
1 2( ) ( ( ), ( ), , ( )),mx x x x+ + + +Ä = Ä Ä Ä
where ( ) [ , ] 1 2, , , , .j jjx x x j m++ +Ä Î =
(4) Calculate the ideal grey correlation coefficients that meet the customer requirements. The normalized evaluation vector was used to calculate the grey correlation coefficients ijr + with respect to the ideal evaluation
vector:
1 + +
2ij
j ijj ij
m M n Nr
x x Nx x M
++ +
æ ö÷ç ÷ç ÷ç= + ÷ç ÷ç ÷- +- + ÷çè ø, (4)
where min min ,i j j ijm x x+= - max max ,i j j ijM x x+= -
min min ,i j j ijn x x+= - max max ,i j j ijN x x+= -
1 ,1 .i n j m≤ ≤ ≤ ≤
Generally, the value of λ is 0.5. The correlation coefficient matrix P= ( )ij n mr+
´ can be established according to the values of ijr+ .
(5) Determine the number of grey class and the grey whitenization weight function ( ) ( )k
if x based on actual customer requirements. For a machine tool product, the technical characteristics of the product could be divided into three grey classes: the core class, the candidate class and the non-essential class for configuration.
(6) Calculate the weight value of each object attribute, namely, the weights of the technical characteristics of the machine tool product:
1
32
21 1
1
1(1 )
(1 )
n
j ij ni k
iki
r
r
-
+
+= =
=
æ ö÷ç ÷ç ÷ç ÷ç ÷ç ÷= -ç ÷÷ç ÷ç ÷ç - ÷ç ÷çè ø
å åå
. (5)
(7) Calculate the grey comprehensive clustering
coefficient i of each technical characteristic:
1
( ) .m
k ki j ij j
j
f r +
=
=å (6)
The grey class to which each technical characteristic of
the machine tool product belongs can be determined by the following formula:
max{ }, 1 3. k ki i k = ≤ ≤ (7)
3.2 Optimization decision model for product planning
Through the conversion of customer requirements, the fuzzy requirements were mapped onto technical characteristics, and the importance degrees of the technical characteristics were determined. However, this does not mean that the technical characteristics with a higher importance degree will certainly be considered in the product configuration design. The product configuration design will be restricted by the cost and time. Therefore, the optimization decision model should be established for the enterprises to select the key technical characteristics under the constraints of cost and time to serve the customer for maximal satisfaction.
Suppose that the cost invested by the enterprises in
WANG Pengjia, et al: Applying CBR to Machine Tool Product Configuration Design Oriented to Customer Requirements
·66·
product configuration design is C, the time must not exceed T, and there are m technical characteristics that meet the customer requirements.
[cjL, cj
U] represents the interval estimation of the cost needed to design the jth technical characteristic in the product configuration design, cj
L≤cjU.
[tjL, tj
U] represents the interval estimation of the time needed to design the jth technical characteristic in the product configuration design, tj
L≤tjU.
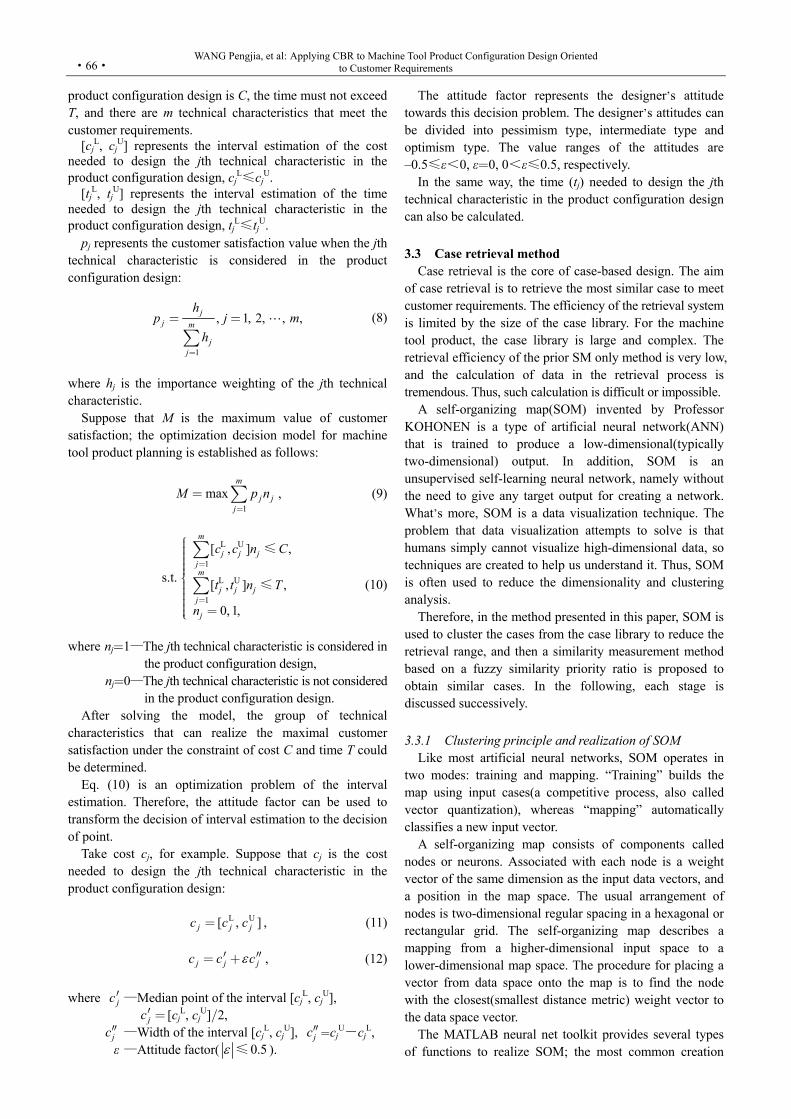
pj represents the customer satisfaction value when the jth technical characteristic is considered in the product configuration design:
1
, 1, 2, , , jj m
jj
hp j m
h
=
= =
å (8)
where hj is the importance weighting of the jth technical characteristic.
Suppose that M is the maximum value of customer satisfaction; the optimization decision model for machine tool product planning is established as follows:
1
maxm
j jj
M p n=
= å , (9)
L U
1
L U
1
[ , ] ,
[ , ] ,
0, 1,
m
j j jjm
j j jj
j
c c n C
t t n T
n
=
==
å
å
≤
≤ (10)
where nj=1—The jth technical characteristic is considered in
the product configuration design, nj=0—The jth technical characteristic is not considered
in the product configuration design. After solving the model, the group of technical
characteristics that can realize the maximal customer satisfaction under the constraint of cost C and time T could be determined.
Eq. (10) is an optimization problem of the interval estimation. Therefore, the attitude factor can be used to transform the decision of interval estimation to the decision of point.
Take cost cj, for example. Suppose that cj is the cost needed to design the jth technical characteristic in the product configuration design:
L U[ , ]j j jc c c= , (11)
j j jc c c¢ ¢¢= + , (12)
where jc¢ —Median point of the interval [cj
L, cjU],
jc¢ = [cjL, cj
U]/2, jc¢¢ —Width of the interval [cj
L, cjU], jc¢¢=cj
U-cjL,
ε —Attitude factor( 0.5 ≤ ).
The attitude factor represents the designer’s attitude towards this decision problem. The designer’s attitudes can be divided into pessimism type, intermediate type and optimism type. The value ranges of the attitudes are –0.5≤ε<0, ε=0, 0<ε≤0.5, respectively.
In the same way, the time (tj) needed to design the jth technical characteristic in the product configuration design can also be calculated.
3.3 Case retrieval method
Case retrieval is the core of case-based design. The aim of case retrieval is to retrieve the most similar case to meet customer requirements. The efficiency of the retrieval system is limited by the size of the case library. For the machine tool product, the case library is large and complex. The retrieval efficiency of the prior SM only method is very low, and the calculation of data in the retrieval process is tremendous. Thus, such calculation is difficult or impossible.
A self-organizing map(SOM) invented by Professor KOHONEN is a type of artificial neural network(ANN) that is trained to produce a low-dimensional(typically two-dimensional) output. In addition, SOM is an unsupervised self-learning neural network, namely without the need to give any target output for creating a network. What’s more, SOM is a data visualization technique. The problem that data visualization attempts to solve is that humans simply cannot visualize high-dimensional data, so techniques are created to help us understand it. Thus, SOM is often used to reduce the dimensionality and clustering analysis.
Therefore, in the method presented in this paper, SOM is used to cluster the cases from the case library to reduce the retrieval range, and then a similarity measurement method based on a fuzzy similarity priority ratio is proposed to obtain similar cases. In the following, each stage is discussed successively.
3.3.1 Clustering principle and realization of SOM
Like most artificial neural networks, SOM operates in two modes: training and mapping. “Training” builds the map using input cases(a competitive process, also called vector quantization), whereas “mapping” automatically classifies a new input vector.
A self-organizing map consists of components called nodes or neurons. Associated with each node is a weight vector of the same dimension as the input data vectors, and a position in the map space. The usual arrangement of nodes is two-dimensional regular spacing in a hexagonal or rectangular grid. The self-organizing map describes a mapping from a higher-dimensional input space to a lower-dimensional map space. The procedure for placing a vector from data space onto the map is to find the node with the closest(smallest distance metric) weight vector to the data space vector.
The MATLAB neural net toolkit provides several types of functions to realize SOM; the most common creation
s.t.
ìïïïïïïíïïïïïïî

CHINESE JOURNAL OF MECHANICAL ENGINEERING
·67·
function is “newsom”. The function “newsom” is used to create a self-organizing map, and its call format is shown below.
net=newsom(P, [D1, D2,], TFCN, DFCN, STEPS, IN).
where P—R×Q-dimensions matrix,
R—Number of the input vector; [D1, D2, , Di]—Input dimension of network, the default
value is [5 8]; TFCN—Topological function, the default value is
hextop; DFCN—Distance function, the default value is
linkdist; STEPS—Steps of classification stage, the default
value is 100; IN—Size of initial classification, the default
value is 3; Net—Generated self-organizing map.
Case clustering can be realized by using SOMTOOLBOX in MATLAB. In the visual graphical display, the cases distributed within and around the same hexagonal grid were the similar cases. Fig. 3 is a schematic diagram of SOM visual clustering. In Fig. 3, the characters a1, a2, a3, b, c, d, e and f are used to represent different original data samples. Through SOM clustering, the similar data samples a1, a2, and a3 will assemble within and around the same hexagonal grid spontaneously to form clusters.
Fig. 3. Schematic diagram of SOM visual clustering
The detailed steps of this algorithm are show as follows. (1) Normalize the original data to eliminate the effect of
dimension and unit. (2) Create a self-organizing map by using the function
“newsom”. (3) Train the network by using the function “train” and
test performance of the network by using the function “sim”.
(4) Convert the training result to serial data by using the function “vec2ind” and then check the clustering result.
3.3.2 Case retrieval algorithms of the machine
tool product Similar case retrieval is the central part of case-based
product configuration; it relates to the performance and
operating efficiency of the whole configuration system. For the machine tool product, this paper adopts SOM to cluster the cases from the case library to reduce the retrieval range, and then uses the fuzzy similarity priority ratio type similarity measurement method to obtain the similar cases.
The specific steps of the proposed case retrieval method are shown as follows.
(1) The case clustering. This process includes two steps. 1) The creation and training of SOM According to the number of cases, the training times can
be determined, and then SOM is trained. 2) The clustering process The new case in line with customer requirements is used
as the trained input sample of SOM, and then the corresponding output-layer winners can be calculated. Through the SOM visual clustering diagram, the candidate set of the similar cases can be determined preliminarily.
(2) Similarity measurement method based on fuzzy similarity priority ratio.
The fuzzy similarity priority ratio method compares paired samples with a fixed sample, and the more similar one is selected as the target sample.
Suppose that X={x1, x2, , xn} is a sample collection; compare any of the xi, xj∈X with the fixed sample xk, i, j=1, 2, , n; j≠k. rij represents the relative priority between xi and xj. If rij∈[0.5, 1], xi has a higher priority. Otherwise, rij∈[0, 0.5] illustrates that xj has a higher priority.
1,
[0, 1] ( ),
1.
ii
ij
ij ji
r
r i j
r r
(13)
Matrix R=(rij)n×n that satisfies Eq. (13) is called the
fuzzy similarity priority ratio matrix. rij can be defined by Hamming distance:
kj
ijki kj
dr
d d=
+, (14)
where , .ki k i kj k jd x x d x x= - = -
After establishing the fuzzy similarity priority ratio
matrix, the infimum of each row is selected from the off-diagonal elements of this matrix. The row within which the infimum with the maximum value is located can then be determined, and the superior object can be obtained. The row and column in which the superior object is located in are removed to form a new matrix. The previous steps are repeated for the new matrix, and a superior sequence can be obtained. The natural number can be used to number the sequence.
The foregoing discussion focuses on the fuzzy similarity priority ratio by a single factor.
If there are multiple factors in X, each one should be processed, and a fuzzy comprehensive evaluation should be performed. In this case, the simple weighted mean method

WANG Pengjia, et al: Applying CBR to Machine Tool Product Configuration Design Oriented to Customer Requirements
·68·
can be used, namely, assigning a certain weigh pi to each factor according to the importance degree. The evaluation criteria are shown as follows:
1 1
, 1.m m
i i ii i
S p S p= =
= =å å (15)
In this approach, the sample is more similar when the
value of S is smaller.
3.4 Similar case evaluation For a case with a smaller S value, it is only an indication
that the case is similar to customer requirements. It is impossible to say for certain that the case has the best overall performance. Therefore, the similar case should be evaluated. The grey relational analysis method does not have requirements regarding the sample size and regular distribution during the analysis, and its result is highly consistent with that achieved by qualitative analysis, which proves that the mean has better objectivity.
In this paper, the grey relational analysis method is used to evaluate the similar cases retrieved from the case library and finally pick out the most suitable case.
When the data are analysed by the grey relational analysis method, the reference sequence should be determined first, symbolized by{x0}={x0(1), x0(2), , x0(k)}. The sequences that were compared to the reference sequence are called the comparison sequence, symbolized by{x1}, {x2}, ,{xm}, {x1}={x1(1), x1(2), , x1(k)}, , {xm}={ xm(1), xm(2), , xm(k)}.
If the values of the reference sequence and the comparison sequence have different orders of magnitude, normalization processing should be performed.
By comparing the geometrical shapes between the reference sequence curve and the comparison sequences curves, the closer the geometrical shape, the larger the correlation degree, making the case more similar and suitable.
The specific steps of the grey relational analysis method are described as follows.
(1) Correlation coefficient Suppose that {x0}={x0(1), x0(2), , x0(k)} is the
reference sequence. {xi}=xi(k)={xi(1), xi(2), , xi(k)} is the comparison sequence, i=1, 2, , m. Thus, the correlation coefficient between the reference sequence{x0} and the comparison sequence {xi} is
+
( )( )i
i
m Mk
k M
=+
, (16)
where 0( ) ( ) ( )i ik x k x k = - , min min ( )i k im k=
max max ( )i k iM k= . Among them, ρ is the distinguishing coefficient, ρ∈[0,
1], and in general, ρ=0.5. Δi(k) is the absolute difference between x0 and xi. minkΔi(k) is the first-stage minimum difference, which represents the shortest distance between
the points in curves xi and x0. miniminkΔi(k) is the two-stage minimum difference, miniminkΔi(k) represents the minimum difference of all curves based on minkΔi(k). maximaxkΔi(k) is the two-stage maximum difference, whose meaning is similar to the two-stage minimum difference.
(2) Correlation degree The reflection of the convergence of the correlation
coefficients of each comparison sequence is called the correlation degree.
In general, the correlation degree between xi and x0 is symbolized by R(x0,xi), denoted as Ri0 for convenience. The calculating formulation of the correlation degree is shown as follows:
01
1( ) ( )
n
i ik
R k kn
=
= å . (17)
4 Case Study
Machine tools are the basic equipment with which to
carry out advanced manufacturing technology. They relate to the country’s tactical status of development in the world. With the development of economic globalization, enterprises adopt customer-driven strategies to produce a smaller number but wider variety of products to offer customers maximal satisfaction. In the customization environment, machine tool enterprises are facing the same problem. However, deduction from customer requirements to design results and evaluation of design alternatives are still heavily reliant on the designer’s experience and knowledge, and they are time-consuming jobs as well. In addition, for machine tool products, the case library is complex, the calculation of data in the retrieval process is tremendous, and it is error-prone. Thus, the development of a customer requirement conversion method and an efficient case retrieval approach and computer-aided system is urgently needed to assist the machine tool product configuration design. By using the proposed method, customer requirements can be converted to technical characteristics effectively, and the most suitable case can be obtained accurately. To validate the practicability and effectiveness of the proposed method, in this chapter, a study is carried out to perform the method in the configuration design of ETC serial machine tools produced by Shenyang Machine Tool Group, the largest machine tool manufacturer in China. The ETC serial machine tool is mainly used for shaft-disc type components and can cut all types of threads, arcs, cones and rotary shapes inside and outside the body surface. The process of the example will be explained in the following sections.
4.1 Conversion of customer requirements
4.1.1 Conversion of customer requirements of machine
tool product based on grey rough model To verify the proposed method in unstructured

CHINESE JOURNAL OF MECHANICAL ENGINEERING
·69·
requirement conversion, the ETC serial machine tool was used as an example. By applying the grey rough model, the fuzzy and uncertain customer requirements were converted to product configuration parameters. Furthermore, the technical characteristics to be considered in the configuration were further determined. The configuration parameters table of a machine tool is shown in Table 1.
Table 1. Configuration parameters of machine tool product
The major modules Structure of performance index
Lathe bed module
Length Type of lathe bed
Width Type of drive
Height Accuracy class
Spindle box module
Maximum spindle speed
Spindle through-hole diameter
Maximum spindle torque
Spindle box dimension parameter
Transmission module
Type of lead-screw
Length of lead-screw
X-axis travel
Z-axis travel
Chip removal way Chip removal position
According to the results of the customer requirements
survey, the most important information among customers involved functionality and performance.
In this paper, 8 characteristics were selected from technical characteristics of the existing product case as the factors to be analysed. The existing 6 different types of machine tools of were used as the evaluation objects, expressed as U={1, 2, 3, 4, 5, 6}.The detailed steps of the proposed method are illustrated as follows.
By invoking the case library of the existing machine tool products and analysing unstructured requirements, customer requirements were mapped to product configuration parameters. The quantized grey information table of the machine tool product technical characteristics is shown in Table 2. In Table 2, A1, A2, A3, A4, A5, A6, A7 and A8 were used to represent maximum cutting length (mm), maximum cutting diameter(mm), X-axis travel (mm), Z-axis travel(mm), maximum spindle speed (r/min), X-axis positional accuracy(mm), Z-axis positional accuracy (mm) and surface roughness(μm), respectively.
By Eqs. (1), (2), the normalized grey information table of machine tool product technical characteristics was obtained as shown in Table 3. Through the normalization process, the values in Table 3 are dimensionless.
Table 2. Quantized grey information table of machine tool product technical characteristics
Product set U A1 L/mm A2 φ/mm A3 T/mm A4 T/mm A5 N/ (r·min–1) A6 P/mm A7 P/mm A8 Ra/μm
1 (500, 600) (300, 320) (130, 165) (600, 630) (3000, 4000) (0, 0.05) (0, 0.06) (0.8, 1.6)
2 (540, 600) (230, 260) (130, 150) (540, 600) (2500, 3000) (0, 0.05) (0, 0.06) (0, 0.8)
3 (600, 680) (220, 250) (200, 225) (550, 610) (3000, 4000) (0, 0.05) (0, 0.06) (1.25, 1.6)
4 (500, 600) (220, 250) (200, 230) (600, 635) (4000, 4500) (0, 0.05) (0, 0.06) (0, 0.8)
5 (600, 650) (300, 320) (180, 208) (540, 600) (2850, 3150) (0, 0.05) (0, 0.06) (0.8, 1.25)
6 (540, 640) (400, 450) (240, 275) (500, 520) (3000, 3400) (0, 0.05) (0, 0.06) (0.8, 1.6)
Table 3. Normalized grey information table of machine tool product technical characteristics
Products set U A1 A2 A3 A4 A5 A6 A7 A8
1 (0.000, 0.556) (0.348, 0.435) (0.000, 0.241) (0.741, 0.963) (0.250, 0.750) (0, 1) (0, 1) (0.500, 1.000)
2 (0.222, 0.556) (0.043, 0.174) (0.000, 0.138) (0.296, 0.741) (0.000, 0.250) (0, 1) (0, 1) (0.000, 0.500)
3 (0.556, 1.000) (0.000, 0.130) (0.483, 0.655) (0.370, 0.815) (0.250, 0.750) (0, 1) (0, 1) (0.781, 1.000)
4 (0.000, 0.556) (0.000, 0.130) (0.483, 0.690) (0.741, 1.000) (0.750, 1.000) (0, 1) (0, 1) (0.000, 0.500)
5 (0.556, 0.833) (0.348, 0.435) (0.345, 0.538) (0.296, 0.741) (0.175, 0.325) (0, 1) (0, 1) (0.500, 0.781)
6 (0.222, 0.778) (0.783, 1.000) (0.759, 1.000) (0.000, 0.148) (0.250, 0.450) (0, 1) (0, 1) (0.500, 1.000)
From Eq. (3), the ideal evaluation vector can be obtained
as follows:
( ) ((0.556,1.000), (0.783,1.000), (0.759,1.000),
(0.741,1.000), (0.750,1.000), (0,1), (0,1), (0,0.5)).
x+ Ä =
From Eq. (4), the grey correlation coefficients matrix P was established as follows:
0.333 0.369 0.348 0.960 0.514 1 1 0.684
0.394 0.345 0.333 0.538 0.333 1 1 0.333
1.000 0.333 0.567 0.598 0.514 1 1 1.000
0.333 0.333 0.581 1.000 1.000 1 1 0.333
0.785 0.369 0.530 0.538 0.376 1 1 0.558
0.750 1.000 1.000 0.333 0.417 1 1 0.684
æçççç
=
è
P .
ö÷÷÷÷÷ç ÷ç ÷÷ç ÷ç ÷ç ÷ç ÷ç ÷ç ÷ç ÷ç ÷÷ç ÷ç ÷ç ÷ç ÷ø
Based on the customer requirements, the product technical characteristics can be divided into three grey classes: the core configuration class, candidate class and non-essential class. The grey whitenization weight function of each characteristic fj
k(x), k∈ [1, 3], could then be constructed. According to the grey correlation coefficients matrix and the value of each characteristic, the middle point of the piecewise function could be found, and the whitenization weight function of each characteristic is established as follows:
1
0, 0.3,
0.3( ) , 0.3 0.7 ,
0.41, 0.7,
j
x
xf x x
x
ìïïïï -ï=íïïïïïî
≤
≤ ≤
≥
WANG Pengjia, et al: Applying CBR to Machine Tool Product Configuration Design Oriented to Customer Requirements
·70·
2
0, 0.3,
0.3, 0.3 0.5,
0.2( ) ,1, 0.5 0.7
0.9, 0.7 0.9,
0.20, 0.9,
j
x
xx
f x x
xx
x
ìïïïï -ïïïïïï=íïïï -ïïïïïïïî
≤
≤ ≤
≤ ≤
≤ ≤
≥
3
1, 0.3,
0.5( ) , 0.3 0.5,
0.20, 0.5.
j
x
xf x x
x
ìïïïï -ï=íïïïïïî
≤
≤ ≤
≥
There was no difference between characteristics A6 and
A7 in each evaluation object, so it can be seen as the only selection in the product configuration design; thus, it can be ignored when the weight was analysed.
From Eq. (5), the weight of each technical characteristic can be calculated as follows: ω1=0.173, ω2=0.182, ω3=0.162, ω4=0.164, ω5=0.193, ω8=0.126.
From Eq. (6), the grey comprehensive clustering coefficients can be obtained:
σ1= (0.481, 0.206, 0.103), σ2= (0.653, 0.254, 0.120),
σ3= (0.301, 0.206, 0.176), σ4= (0.382, 0.306, 0.160),
σ5= (0.702, 0.382, 0.143), σ8= (0.176, 0.333, 0.156).
According to the comprehensive cluster coefficients, the
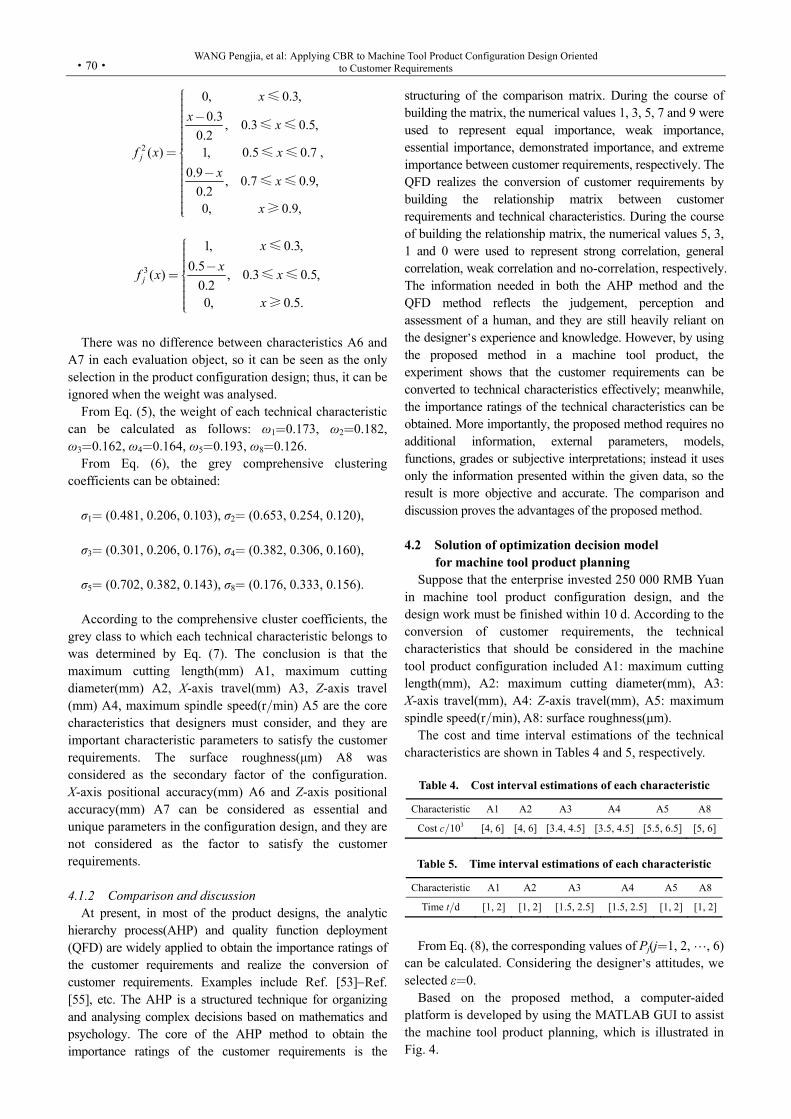
grey class to which each technical characteristic belongs to was determined by Eq. (7). The conclusion is that the maximum cutting length(mm) A1, maximum cutting diameter(mm) A2, X-axis travel(mm) A3, Z-axis travel (mm) A4, maximum spindle speed(r/min) A5 are the core characteristics that designers must consider, and they are important characteristic parameters to satisfy the customer requirements. The surface roughness(μm) A8 was considered as the secondary factor of the configuration. X-axis positional accuracy(mm) A6 and Z-axis positional accuracy(mm) A7 can be considered as essential and unique parameters in the configuration design, and they are not considered as the factor to satisfy the customer requirements.
4.1.2 Comparison and discussion
At present, in most of the product designs, the analytic hierarchy process(AHP) and quality function deployment (QFD) are widely applied to obtain the importance ratings of the customer requirements and realize the conversion of customer requirements. Examples include Ref. [53]Ref. [55], etc. The AHP is a structured technique for organizing and analysing complex decisions based on mathematics and psychology. The core of the AHP method to obtain the importance ratings of the customer requirements is the
structuring of the comparison matrix. During the course of building the matrix, the numerical values 1, 3, 5, 7 and 9 were used to represent equal importance, weak importance, essential importance, demonstrated importance, and extreme importance between customer requirements, respectively. The QFD realizes the conversion of customer requirements by building the relationship matrix between customer requirements and technical characteristics. During the course of building the relationship matrix, the numerical values 5, 3, 1 and 0 were used to represent strong correlation, general correlation, weak correlation and no-correlation, respectively. The information needed in both the AHP method and the QFD method reflects the judgement, perception and assessment of a human, and they are still heavily reliant on the designer’s experience and knowledge. However, by using the proposed method in a machine tool product, the experiment shows that the customer requirements can be converted to technical characteristics effectively; meanwhile, the importance ratings of the technical characteristics can be obtained. More importantly, the proposed method requires no additional information, external parameters, models, functions, grades or subjective interpretations; instead it uses only the information presented within the given data, so the result is more objective and accurate. The comparison and discussion proves the advantages of the proposed method.
4.2 Solution of optimization decision model for machine tool product planning
Suppose that the enterprise invested 250 000 RMB Yuan in machine tool product configuration design, and the design work must be finished within 10 d. According to the conversion of customer requirements, the technical characteristics that should be considered in the machine tool product configuration included A1: maximum cutting length(mm), A2: maximum cutting diameter(mm), A3: X-axis travel(mm), A4: Z-axis travel(mm), A5: maximum spindle speed(r/min), A8: surface roughness(μm).
The cost and time interval estimations of the technical characteristics are shown in Tables 4 and 5, respectively.
Table 4. Cost interval estimations of each characteristic
Characteristic A1 A2 A3 A4 A5 A8
Cost c/103 [4, 6] [4, 6] [3.4, 4.5] [3.5, 4.5] [5.5, 6.5] [5, 6]
Table 5. Time interval estimations of each characteristic
Characteristic A1 A2 A3 A4 A5 A8
Time t/d [1, 2] [1, 2] [1.5, 2.5] [1.5, 2.5] [1, 2] [1, 2]
From Eq. (8), the corresponding values of Pj(j=1, 2, …, 6) can be calculated. Considering the designer’s attitudes, we selected ε=0.
Based on the proposed method, a computer-aided platform is developed by using the MATLAB GUI to assist the machine tool product planning, which is illustrated in Fig. 4.

CHINESE JOURNAL OF MECHANICAL ENGINEERING
·71·
Fig. 4. Computer-aided system for product planning
By inputting the corresponding factors to the system, the
results can be obtained as follows:
n1=1, n2=1, n3=1, n4=1, n5=1, n8=0. Therefore, under the restrictions of fixed cost and time,
the technical characteristics A1, A2, A3, A4 and A5 should be considered in machine tool product configuration design
to best fit with customer requirements. If enterprises want to improve customer satisfaction, additional investment or time is needed. In this study, if the investment increases to 300,000 yuan, all 6 characteristics can be considered in the design, and customer satisfaction reaches a maximum.
4.3 Case retrieval of machine tool product
4.3.1 Case representation and case library calls
In this example, all 6 technical characteristics: A1, A2, A3, A4, A5 and A8 were considered to serve the customer for maximum satisfaction. The ETC serial machine tools were used as an example to perform the case retrieval. Because there are too many cases, it is impossible to show all cases in one figure, so Table 6 shows only a part of the case library of the ETC serial machine tool product. The case library of machine tool product includes the following contents: the product type, the product code, A1: maximum cutting length(mm), A2: maximum cutting diameter (mm), A3: X-axis travel(mm), A4: Z-axis travel(mm), A5: maximum spindle speed(r/min) and A8: surface roughness (μm). According to the customer requirements, the technical characteristics required by customer are shown in Table 7.
Table 6. Partial case library of machine tool product
Type Code A1 L/mm A2 φ/mm A3 T/mm A4 T/mm A5 N/ (r·min–1) A8 Ra/μm
ETC4564 P01001 640 450 275 520 3400 1.6
ETC3265 P01002 650 320 208 600 3150 1.25
ETC2560 P01003 600 250 230 635 4500 0.8
ETC3260 P01004 600 320 165 630 4000 1.6
ETC2240 P01005 400 220 130 500 3000 1.25
ETC2136 P01006 360 216 120 460 3000 0.8
ETC2568 P01007 680 250 225 610 4000 1.25
ETC2029 P01008 290 200 124 430 3500 1.6
ETC2660 P01009 600 260 150 600 3000 0.8
Table 7. Characteristics of the customer requirements
Characteristic A1 L/mm A2 φ/mm A3 T/mm A4 T/mm A5 N/(r·min–1) A8 Ra/μm
Value 600 320 225 630 4300 1.25
4.3.2 SOM network creation and case clustering Owing to the number of cases, the default output
network [5×8] was selected, and the training times are 10, 20, 30, 50, and 100. The customer required case (New case) was used as the input of SOM, and the result of clustering can then be obtained. Among them, New case={600, 320, 225, 630, 4300, 1.25}. Once the program is running, the classification of each neuron is shown in Fig. 5, and the result of similar cases retrievals is shown in Fig. 6. The cases near New case include the candidate set, which is similar to the customer requirements.
According to the result of SOM clustering, the similar product candidate set retrieved from the product case
library is P={P01001, P01002, P01003, P01004, P01007}.
Fig. 5. Classification of neurons

WANG Pengjia, et al: Applying CBR to Machine Tool Product Configuration Design Oriented to Customer Requirements
·72·
Fig. 6. Result of clustering
4.3.3 Comparison and discussion
With the help of SOM, the retrieval data are led into a corresponding small case library, and the most similar case can be obtained within the small case base by similarity measurement. With the case number reduced, the computational times will go down markedly, and the efficiency will be enhanced. Fig. 7 displays the growth trend graph of CT for similarity measurement with the growth of i and c. CT is the computational time, and i and c represent the number of product characteristics from one customer and the number of existing cases, respectively.
Fig. 7 Growth trend of CT for similarity measurement
Moreover, owing to the outstanding ability in the
visualization of the topological relationship among the high-dimensional inputs and the low-dimensional representation of the SOM approach, the proposed CBR can visually display the inherent similar relations within the case cluster. Furthermore, SOM is an unsupervised self-learning neural network, without the need to give any target output for creating a network, so SOM can automatically determine the number of clusters according to the training process rather than being predefined. When a new problem arises, the proposed method can easily and visually show the similar cluster to the retrieved case through SOM clustering. The most suitable case could be obtained within the similar cluster by similarity measurement and grey relational analysis evaluation.
4.3.4 Similarity measurement of machine tool cases based on fuzzy similarity priority ratio
After the similar product candidate set was obtained, the
similarity measurement of machine tool product cases will be performed. To validate the effectiveness of SOM clustering, in this chapter, the case P01009 was put together with the similar product candidate set to perform the similarity measurement. Therefore, the final similar cases that need to perform the similarity measurement were P01001, P01002, P01003, P01004, P01007 and P01009.
Based on the proposed methods, a computer-aided platform is developed using MATLAB GUI to assist the SM of machine tool cases. The fuzzy similarity priority ratio calculation system, fuzzy priority ordering system and fuzzy comprehensive evaluation system are illustrated in Fig. 8Fig. 10, respectively.
Fig. 8. Fuzzy similarity priority ratio calculation system
Fig. 9. Fuzzy priority ordering system
Fig. 10. Fuzzy comprehensive evaluation system
Based on Eqs. (13) and (14), the fuzzy similarity priority ratio matrices R1, R2, R3, R4, R5 and R6 can be obtained by using the fuzzy similarity priority ratio calculation system:

CHINESE JOURNAL OF MECHANICAL ENGINEERING
·73·
1
1.000 0.556 0.000 0.000 0.667 0.000
0.444 1.000 0.000 0.000 0.615 0.000
1.000 1.000 1.000 0.500 1.000 0.500
1.000 1.000 0.500 1.000 1.000 0.500
0.333 0.385 0.000 0.000 1.000 0.000
1.000 1.000 0.500 0.500 1.000 1.000
æççççççççç= ççççççè
R ,
ö÷÷÷÷÷÷÷÷÷÷÷÷÷÷÷÷÷÷ç ÷ç ÷ç ÷ø
2
1.000 0.000 0.350 0.000 0.350 0.316
1.000 1.000 1.000 0.500 1.000 1.000
0.650 0.000 1.000 0.000 0.500 0.462
1.000 0.500 1.000 1.000 1.000 1.000
0.650 0.000 0.500 0.000 1.000 0.462
0.684 0.000 0.538 0.000 0.538 1.000
æççççççççç= ççççççè
R ,
ö÷÷÷÷÷÷÷÷÷÷÷÷÷÷÷÷÷÷ç ÷ç ÷ç ÷ø
3
1.000 0.254 0.091 0.545 0.000 0.600
0.746 1.000 0.227 0.779 0.000 0.815
0.909 0.773 1.000 0.923 0.000 0.938
0.455 0.221 0.077 1.000 0.000 0.556
1.000 1.000 1.000 1.000 1.000 1.000
0.400 0.185 0.063 0.444 0.000 1.000
æççççççççç= ççççççè
R ,
ö÷÷÷÷÷÷÷÷÷÷÷÷÷÷÷÷÷÷ç ÷ç ÷ç ÷ø
4
1.000 0.214 0.043 0.000 0.154 0.214
0.786 1.000 0.143 0.000 0.400 0.500
0.957 0.857 1.000 0.000 0.800 0.857
1.000 1.000 1.000 1.000 1.000 1.000
0.846 0.600 0.200 0.000 1.000 0.600
0.786 0.500 0.143 0.000 0.400 1.000
æççççççççç= ççççççè
R ,
ö÷÷÷÷÷÷÷÷÷÷÷÷÷÷÷÷÷÷ç ÷ç ÷ç ÷ø
5
1.000 0.561 0.182 0.250 0.250 0.591
0.439 1.000 0.148 0.207 0.207 0.531
0.818 0.852 1.000 0.600 0.600 0.867
0.750 0.793 0.400 1.000 0.500 0.813
0.750 0.793 0.400 0.500 1.000 0.813
0.409 0.469 0.133 0.188 0.188 1.000
æççççççççç= ççççççè
R ,
ö÷÷÷÷÷÷÷÷÷÷÷÷÷÷÷÷÷÷ç ÷ç ÷ç ÷ø
6
1.000 0.000 0.562 0.500 0.000 0.562
1.000 1.000 1.000 1.000 0.500 1.000
0.438 0.000 1.000 0.438 0.000 0.500
0.500 0.000 0.562 1.000 0.000 0.562
1.000 0.500 1.000 1.000 1.000 1.000
0.438 0.000 0.500 0.438 0.000 1.000
æççççççççç= ççççççè
R .
ö÷÷÷÷÷÷÷÷÷÷÷÷÷÷÷÷÷÷ç ÷ç ÷ç ÷ø
According to the priority relations, the sequence can be numbered by natural numbers. Through the fuzzy priority ordering system, the ordering matrix O can be obtained:
2 4 4 5 3 2
3 1 3 4 4 1
1 3 2 2 1 3.
1 1 5 1 2 2
4 3 1 3 2 1
1 2 6
4 5
3
æ ö÷ç ÷ç ÷ç ÷ç ÷ç ÷ç ÷÷ç ÷ç ÷ç= ÷ç ÷ç ÷ç ÷ç ÷ç ÷÷ç ÷ç ÷ç ÷ç ÷è ø
O
Based on Eq. (15), the final ordering can be determined by the fuzzy comprehensive evaluation system. The evaluation results are shown in Table 8. According to the value of S, the most similar machine tool product case is P01003, and the product cases P01004 and P01007 also have relatively lower S values. The product case P01009 has the highest S value, and this result proves the effectiveness of the SOM clustering at the same time.
Table 8. Fuzzy comprehensive evaluation results
Case P01001 P01002 P01003 P01004 P01007 P01009
S value 3.373 2.741 1.942 1.967 2.404 3.509
In the next step, the grey correlation analysis method is
used to evaluate the similar cases to pick up the most suitable solution(case).
4.4 Evaluation of similar machine tool product cases
(1) Determine the reference sequence The selection principle of the reference sequence is to
select the optimal value of each index. For example, with the maximum cutting length(A1), the maximum value is the most optimal value, but for the surface roughness(A8), the minimum value is the most optimal value. According to this principle, the reference sequence could be obtained:
{x0}={680, 450, 275, 635, 4500, 0.8}.
(2) Determine the comparison sequence For the case in the machine tool product case library,
P01003, P01004 and P01007 have a lower S value. Thus, the technical parameters of these three similar cases were selected as the comparison sequence, as described below:
{x1}={600, 250, 230, 635, 4500, 0.80},
{x2}={600, 320, 165, 630, 4000, 1.60},
{x3}={680, 250, 225, 610, 4000, 1.25}. (3) Normalization processing of characteristics values From the reference sequence and the comparison
sequence, it can be seen that the values of different characteristics have different orders of magnitude. To make every characteristic have the same order of magnitude, normalization processing should be performed. In this paper, the linear normalization method was used for processing.
For the characteristics that select the maximum value as the optimal value, the calculation formula is
max
ikik
i ik
xx
x¢ = . (18)
For the indices that select the minimum value as the
optimal value, the calculation formula is

WANG Pengjia, et al: Applying CBR to Machine Tool Product Configuration Design Oriented to Customer Requirements
·74·
mini ik
ikik
xx
x¢ = . (19)
Where maxixik and minixik (i=0, 1, 2, 3, k=1, 2, …, 6) represent the maximum and the minimum values of characteristic k in the reference sequence and the comparison sequence, respectively. After normalizing the reference sequence and the comparison sequence, the results are shown below: {x0}={1.000 0, 1.000 0, 1.000 0, 1.000 0, 1.000 0, 1.000 0},
{x1}={0.882 4, 0.555 6, 0.836 3, 1.000 0, 1.000 0, 1.000 0},
{x2}={0.882 4, 0.711 1, 0.600 0, 0.992 1, 0.888 9, 0.500 0},
{x3}={1.000 0, 0.555 6, 0.818 2, 0.960 6, 0.888 9, 0.640 0}.
(4) Calculate the correlation coefficient From Eq. (16), the absolute difference of every sequence
Δi(k) is shown below: Δ1=(0.117 6, 0.444 4, 0.163 7, 0.000 0, 0.000 0,0.000 0), Δ2=(0.117 6, 0.288 9, 0.400 0, 0.007 9, 0.111 1, 0.500 0), Δ3=(0.000 0, 0.444 4, 0.181 8, 0.039 4, 0.111 1, 0.360 0). According to the absolute differences of the sequences,
the two-stage maximum difference is 0.5000 and the two-stage minimum difference is 0.
From Eq. (16), the correlation coefficient can be calculated:
ζ1=(0.680 1, 0.360 0, 0.604 3, 1.000 0, 1.000 0, 1.000 0),
ζ2=(0.680 1, 0.463 9, 0.384 6, 0.969 4, 0.692 3, 0.333 3),
ζ3=(1.000 0, 0.360 0, 0.578 9, 0.863 9, 0.692 3, 0.409 8).
(5) Calculate the correlation degree The correlation degree was calculated by substituting the
weights of the indices and the correlation coefficients into Eq. (17); the results are shown below:
R1=0.109 2, R2=0.085 6, R3=0.094 2.
To facilitate the designers, based on the proposed method,
a computer-aided similar case evaluation system was developed using MATLAB GUI and is illustrated in Fig. 11.
Through this system, the complicated calculation procedures can be realized easily. By inputting the corresponding factors to the system, the results can be obtained rapidly and accurately.
Fig. 11. Similar case evaluation system
According to the results, the case P01003 has the
smallest S value and the highest correlation degree. Therefore, the case P01003 was selected as the most suitable case to realize the configuration design.
By looking at the product database, the type of this machine tool product is ETC2560. The three-dimensional model of this type of product, which was established by using SolidWorks, is shown in Fig. 12. In the next step, the function and structure tree of this similar product should be extracted to determine whether it meets the customer requirements, namely, entering into module-level case matching to determine which modules can be replaced directly or be modified. Through the configuration of these modules, the machine tool product that meets the customer requirements will be finally obtained.
Fig. 12. 3D model of ETC2560 type machine tool
5 Conclusions
(1) An analysis method of customer requirements based
on the grey rough model is presented to solve the problem of fuzziness and uncertainty of customer requirements in product configuration. With this method, the customer requirements are converted to technical characteristics effectively and the influence of human factors can be avoided in the conversion process.
(2) An optimization decision model for machine tool product planning is established. This model may help the enterprises select the key technical characteristics under the constraints of cost and time to serve the customer for maximal satisfaction.

CHINESE JOURNAL OF MECHANICAL ENGINEERING
·75·
(3) A new case retrieval approach that combines the self-organizing map and fuzzy similarity priority ratio method is proposed in case-based design. In the proposed method, SOM is introduced as a clustering tool to reduce the retrieval range and increase the retrieval efficiency, and the fuzzy similarity priority ratio method is used to evaluate the similarity comprehensively.
(4) To ensure that the final case has the best overall performance, an evaluation model of similar cases based on grey relational analysis is proposed. This model may help evaluate the similar cases retrieved from the case library and finally select the most suitable case.
(5) Based on the proposed methods, a computer-aided system is developed using MATLAB GUI to assist the machine tool product configuration design. The actual example and result show that this system is effective, rapid and accurate in the process of product configuration.
(6) The proposed methodology can also be applied to the configuration design of other manufacturing equipment, such as automobiles, planes, ships and excavators. Thus, the proposed methodology could be tested in other design domains in the future.
References
[1] QI Jin, HU Jie, PENG Yinghong, et al. AGFSM: An new FSM based on adapted Gaussian membership in case retrieval model for customer-driven design[J]. Expert Systems with Applications, 2011, 38(1): 894–905.
[2] TAHA Z, SOEWARDI H, DAWAL S Z M. Axiomatic design principles in analysing the ergonomics design parameter of a virtual environment [J]. International Journal of Industrial Ergonomics, 2014, 44(3): 368–373.
[3] ZHANG Zaifang, CHU Xuening. Fuzzy group decision-making for multi-format and multi-granularity linguistic judgments in quality function deployment[J]. Expert Systems with Applications, 2009, 36(5): 9150–9158.
[4] HU Xiao, WANG Zhaodong, WANG Guodong. Case-based reasoning(CBR) model for ultra-fast cooling in plate mill[J]. Chinese Journal of Mechanical Engineering, 2014, 27(6): 1264–1271.
[5] XU Man, YU Haiyan, SHEN Jiang. New algorithm for CBR-RBR fusion with robust thresholds[J]. Chinese Journal of Mechanical Engineering, 2012, 25(6): 1255–1263.
[6] STEPHANE N, HECTOR R, MARC L L J. Effective retrieval and new indexing method for case based reasoning: Application in chemical process design[J]. Engineering Applications of Artificial Intelligence, 2010, 23(6): 880–894.
[7] TSENG H E, CHANG C C, CHANG S H. Applying case-based reasoning for product configuration in mass customization environments[J]. Expert Systems with Applications, 2005, 29(4): 913–925.
[8] JUAN Y K, SHIH S G, PERNG Y H. Decision support for housing customization: A hybrid approach using case-based reasoning and genetic algorithm[J]. Expert Systems with Applications, 2006, 31(1): 83–93.
[9] FOK S C, YAP W P. A case-based design system for the conceptual design of electrical connectors[J]. International Journal of Advanced Manufacturing Technology, 2002, 20(11): 787–798.
[10] NOORI B. Developing a CBR system for marketing mix planning and weighting method selection using fuzzy AHP[J]. Applied Artificial Intelligence, 2015, 29(1): 1–32.
[11] DAN B, GUO L F, WANG J P, et al. Intelligent configuration method of product family for mass customization based on constraints and
cases[J]. Advances science letters, 2011, 4(6): 2478–2482. [12] AHN Y W, AHN H J, PARK S J. Knowledge and case-based
reasoning for customization of software processes-A hybrid approach[J]. International Journal of Software Engineering and Knowledge Engineering, 2003, 13(3): 293–312.
[13] HO G T S, LAU H C W, LEE C K M, et al. An intelligent forward quality enhancement system to achieve product customization[J]. Industrial Management & Data System, 2005, 105(3): 384–406.
[14] GUO Yuan, HU Jie, PENG Yinghong. Research on CBR system based on data mining[J]. Applied Soft Computing, 2011, 11(8): 5006–5014.
[15] LIN M C, WANG C C, CHEN M S, et al. Using AHP and TOPSIS approaches in customer-driven product design process[J]. Computers in Industry, 2008, 59(1): 17–31.
[16] ZHONG Shisheng, XIE Xiaolong, LIN Lin. Two-layer random forests model for case reuse in case-based reasoning [J]. Expert Systems with Applications, 2015, 42(24): 9412–9425.
[17] ZHANG Yu, BAI Xiaolan, ZHANG Chaobiao, et al. CBR-based intelligent modular combination method for CNC lathe[J]. Journal of Mechanical Engineering, 2014, 50(1): 120–129. (in Chinese)
[18] LI X Z, NI Y R, MING X G, et al. Module-based similarity measurement for commercial aircraft tooling design[J]. International Journal of Production Research, 2015, 53(17): 5382–5397.
[19] CHENG J C P, MA L J. A non-linear case-based reasoning approach for retrieval of similar cases and selection of target credits in LEED projects[J]. Building and Environment, 2015, 93(2): 349–361.
[20] LI Zhi, ZHOU Xionghui, LIU Wei, et al. A geometry search approach in case-based tool reuse for mould manufacturing[J]. International Journal of Advanced Manufacturing Technology, 2015, 79(5): 757–768.
[21] KANG Y B, KRISHNASWAMY S, ZASLAVSKY A. A retrieval strategy for case-based reasoning using similarity and association knowledge[J]. IEEE Transactions on Cybernetics, 2014, 44(4): 473–487.
[22] ZHU Guoniu, HU Jie, QI Jin, et al. An integrated feature selection and cluster analysis techniques for case-based reasoning[J]. Engineering Applications of Artificial Intelligence, 2015, 39: 14–22.
[23] YUAN Changfeng, LIU Xiaobing, CHEN Yan. Product requirement analysis based on requirement unit[J]. Journal of Dalian Maritime University, 2008, 34(2): 113–116. (in Chinese)
[24] LOU Jianren, ZHANG Shuyou, TAN Jianrong. Research on expressing and processing client demands for mass customization[J]. Journal China Mechanical Engineering, 2004, 15(8): 685–687. (in Chinese)
[25] GUO Wei, HU Mingyan. Methodology of exploring and analyzing the VOC based on extensive web data source[J]. Computer Integrated Manufacturing Systems, 2004, 10(9): 1165–1170. (in Chinese)
[26] ZHOU Kangqu, HAN Xiaogang, ZHU Xiaohong, et al. Research on customization model based on customer satisfaction[J]. Computer Integrated Manufacturing Systems, 2004, 10(9): 1338–1342. (in Chinese)
[27] GUO Chenguang, LIU Yongxian, HOU Shouming, et al. Innovative product design based on customer requirement weight calculation model[J]. International Journal of Automation and Computing, 2010, 7(4): 578–583.
[28] ZHANG Li. Research on the structure of customer-drive parameter description for the mass customization model[J]. Journal of Hefei University of Technology (Natural Science), 2003, 26(6): 1152–1156. (in Chinese)
[29] YAN W, KHOO L P, CHEN C H. A QFD-enabled product conceptualisation approach via design knowledge hierarchy and RCE neural network[J]. Knowledge-Based Systems, 2005, 18(6): 279–293.
[30] QI Jin, HU Jie, PENG Yinghong, et al. A case retrieval method combined with similarity measurement and multi-criteria decision making for concurrent design[J]. Expert Systems with Applications, 2009, 36(7): 10 357–10 366.

WANG Pengjia, et al: Applying CBR to Machine Tool Product Configuration Design Oriented to Customer Requirements
·76·
[31] SHIN K S, HAN I. Case-based reasoning supported by genetic algorithms for corporate bond rating[J]. Expert Systems with Application, 1999, 16(2): 85–95.
[32] CHENG Zhonghua, JIA Xisheng, GAO Ping, et al. A framework for intelligent reliability centered maintenance analysis[J]. Reliability Engineering and System Safety, 2008, 93(6): 806–814.
[33] CHIU C C, CHANG P C, CHIU N H. A case-based expert support system for due-date assignment in a wafer fabrication factory[J]. Journal of Intelligent Manufacturing, 2003, 14(3): 287–296.
[34] GUPTA K M, MONTEZEMI A R. Empirical evaluation of retrieval in case-based reasoning systems using modified cosine matching function[J]. IEEE Transactions on Systems, Man, and Cybernetics - Part A: Systems and Humans, 1997, 27(5): 601–612.
[35] ZADEH L A. Some reflections on the anniversary of Fuzzy Sets and Systems[J]. Fuzzy Sets and Systems, 1998, 100(1): 5–7.
[36] CHAN F T S. Application of a hybrid case-base reasoning approach in electroplating industry[J]. Expert Systems with Applications, 2005, 29(1): 121–130.
[37] WU M C, LO Y F, HSH S H. A fuzzy CBR technique for generating product ideas[J] Expert Systems with Applications, 2008, 34(1): 530–540.
[38] LIU Qiaosheng, XI Juntong. Case-based parametric design system for test turntable[J]. Expert Systems with Applications, 2011, 38(6): 6508–6516.
[39] REYES E R, NEGNY S, ROBLES G C, et al. Improvement of online adaptation knowledge acquisition and reuse in case-based reasoning: Application to process engineering design[J]. Engineering Applications of Artificial Intelligence, 2015, 41: 1–16.
[40] LIN S W, CHEN S C. Parameter tuning, feature selection and weight assignment of features for case-based reasoning by artificial immune system[J]. Applied Soft Computing, 2011, 11(8): 5042–5052.
[41] CAO G, SHIU S C K, WANG X. A fuzzy-rough approach for the maintenance of distributed case-based reasoning systems[J].Soft Computing, 2003,7(8): 491–499.
[42] YANG Q, WU J. Enhancing the effectiveness of interactive case-based reasoning with clustering and decision forests[J]. Applied Intelligence, 2001, 14(1): 49–64.
[43] JUNG S, LIM T, KIM D. Integrating radial basis function networks with case-based reasoning for product design[J]. Expert Systems with Applications, 2009, 36(3): 5695–5701.
[44] BAJO J, DE PAZ J F, RODRIGUEZ S, et al. A new clustering algorithm applying a hierarchical method neural network[J]. Logic Journal of The IGPL, 2011, 19(2): 304–314.
[45] DURAY R, WARD P T, MILLIGAN G W, et al. Approaches to mass customization: configurations and empirical validation[J]. Journal of Operations Management, 2000, 18(6): 605–625.
[46] SHAN Quan, CHEN Yan. Product module identification based on assured customer requirements[C]//Procedia Engineering, Dali, China, August 18–19, 2011: 5313–5317.
[47] BERNABE-MORENO J, TEJEDA-LORENTE A, PORCEL C, et al. CARESOME: A system to enrich marketing customers acquisition and retention campaigns using social media information[J]. Knowledge-Based Systems, 2015, 80: 163–179.
[48] AGARD B, KUSIAK A. Data-mining-based methodology for the design of Product families[J]. International Journal of Product Research, 2004, 42(15): 2955–2969.
[49] WANG Y, TSENG M. Incorporating tolerances of customers' requirements for customized products[J]. CIRP Annals- Manufacturing Technology, 2014, 63(1): 129–132.
[50] WANG Y, TSENG M M. Integrating comprehensive customer requirements into product design[J]. CIRP Annals-Manufacturing Technology, 2011, 60(1): 175–178.
[51] FENG C X, LI P G, LIANG M. Fuzzy mapping of requirements onto functions in detail design[J]. Computer-Aided Design, 2001, 33(6): 425–437.
[52] MCKAY A, DE PENNINGTON A, BAXTER J. Requirements management: a representation scheme for product specifications[J]. Computer-Aided Design , 2001, 33(7): 511–520.
[53] DAI J, BLACKHURST J. A four-phase AHP-QFD approach for supplier assessment: a sustainability perspective[J]. International Journal of Production Research, 2012, 50(19): 5474–5490.
[54] DU Y B, CAO H J, CHEN X, et al. Reuse-oriented redesign method of used products based on axiomatic design theory and QFD[J]. Journal of Cleaner Production, 2013, 39: 79–86.
[55] HO W, HE T, LEE C K M, et al. Strategic logistics outsourcing: An integrated QFD and fuzzy AHP approach[J]. Expert Systems with Applications, 2012, 39(12): 10 841–10 850.
Biographical notes WANG Pengjia, born in 1985, is currently a PhD candidate at School of Mechanical Engineering and Automation, Northeastern University, China. He received his master degree from Northeastern University, China, in 2011. His research interests include modular design, rapid response design, CAD/CAM, CIMS, manufacturing information, and product lifecycle management. Tel:+86-15702419866; E-mail: [email protected] GONG Yadong, born in 1958, is currently a full professor at School of Mechanical Engineering and Automation, Northeastern University, China. His main research interests include grinding mechanism, digital manufacturing and micro-precision process. E-mail: [email protected] XIE Hualong, born in 1978, is currently an associate professor at School of Mechanical Engineering and Automation, Northeastern University, China. His main research interests include intelligent robot theory, CAD/CAM, rehabilitation medical device and bionic machinery. E-mail: [email protected] LIU Yongxian, born in 1945, is currently a full professor at School of Mechanical Engineering and Automation, Northeastern University, China. His research interests include CAD/CAM, CIMS, manufacturing information, product lifecycle management, and new structure machine tools. E-mail: [email protected] NEE Andrew Yehching, born in 1948, is a full professor at Department of Mechanical Engineering, Faculty of Engineering, National University of Singapore, Singapore. Fellow SME(1990), Fellow CIRP(1990), Founding Fellow Academy of Engineering Singapore(2011). His research interests include virtual and augmented reality applications in manufacturing, computer-aided process and fixture planning, application of AI techniques in manufacturing, sustainable product design and manufacturing. E-mail: [email protected]