AppliedEconometrics Critical Replication -...
41
Applied Econometrics Critical Replication Michael Ash Econ 753 Critical Replication – p.1/41
Transcript of AppliedEconometrics Critical Replication -...

Applied Econometrics
Critical Replication
Michael Ash
Econ 753
Critical Replication – p.1/41
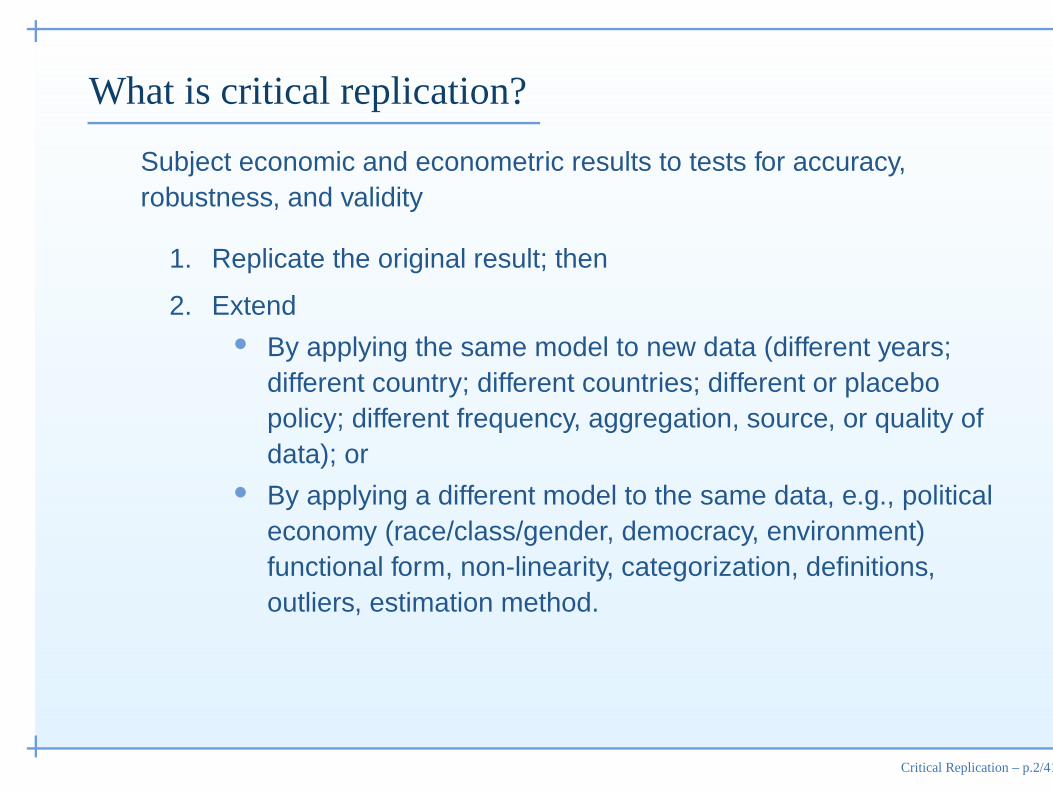
What is critical replication?
Subject economic and econometric results to tests for accuracy,robustness, and validity
1. Replicate the original result; then
2. Extend• By applying the same model to new data (different years;
different country; different countries; different or placebopolicy; different frequency, aggregation, source, or quality ofdata); or
• By applying a different model to the same data, e.g., politicaleconomy (race/class/gender, democracy, environment)functional form, non-linearity, categorization, definitions,outliers, estimation method.
Critical Replication – p.2/41
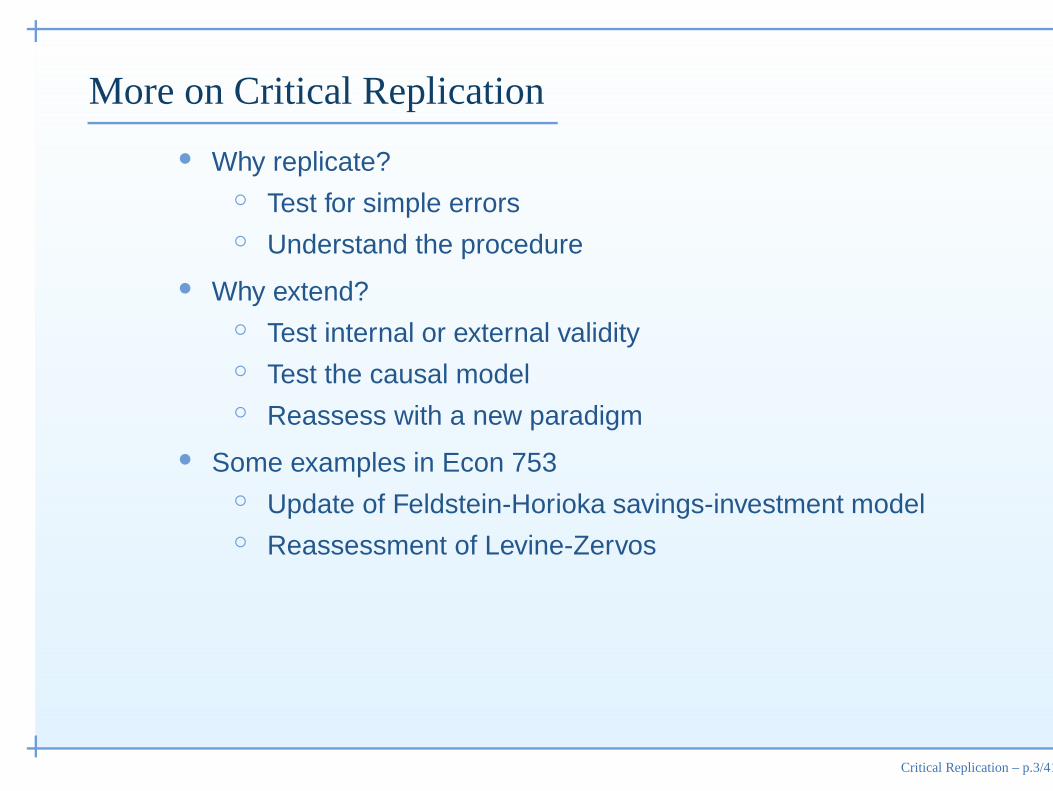
More on Critical Replication
• Why replicate?◦ Test for simple errors◦ Understand the procedure
• Why extend?◦ Test internal or external validity◦ Test the causal model◦ Reassess with a new paradigm
• Some examples in Econ 753◦ Update of Feldstein-Horioka savings-investment model◦ Reassessment of Levine-Zervos
Critical Replication – p.3/41
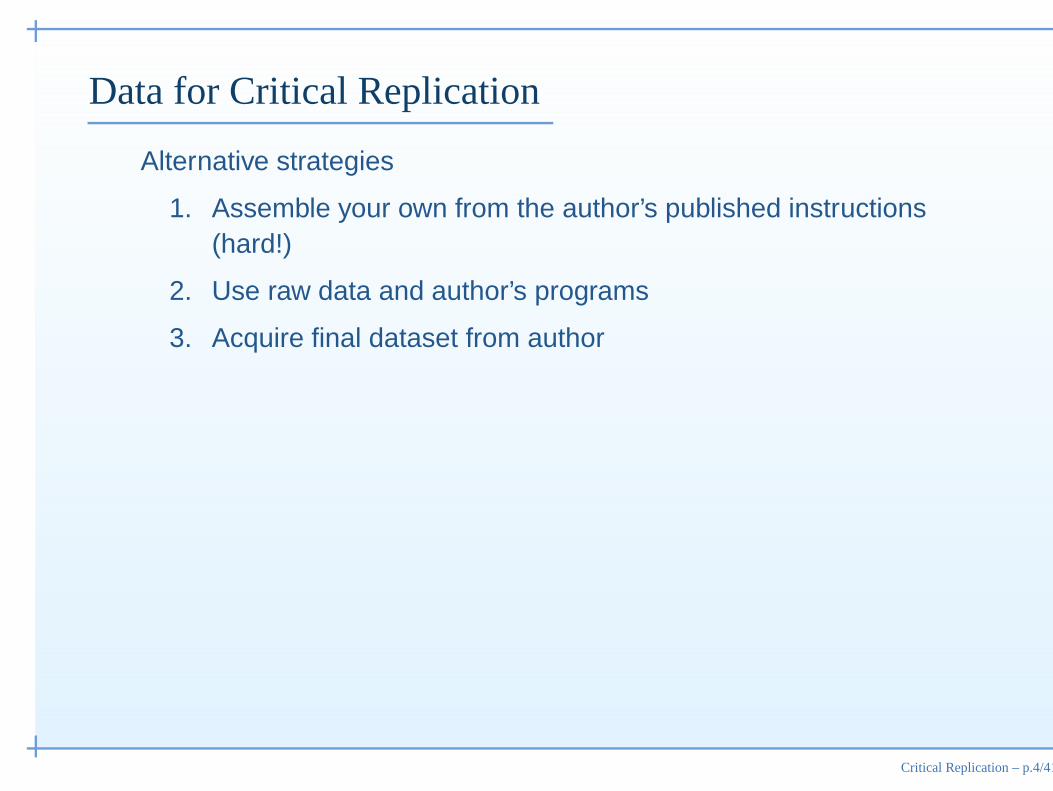
Data for Critical Replication
Alternative strategies
1. Assemble your own from the author’s published instructions(hard!)
2. Use raw data and author’s programs
3. Acquire final dataset from author
Critical Replication – p.4/41
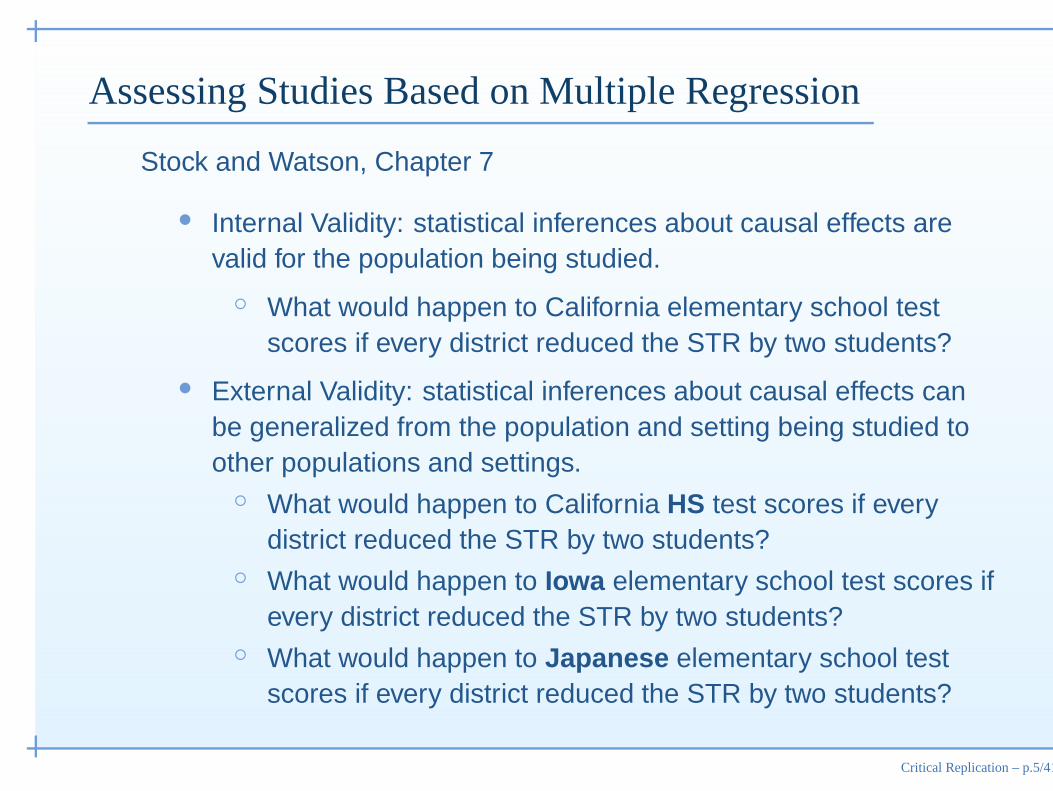
Assessing Studies Based on Multiple Regression
Stock and Watson, Chapter 7
• Internal Validity: statistical inferences about causal effects arevalid for the population being studied.
◦ What would happen to California elementary school testscores if every district reduced the STR by two students?
• External Validity: statistical inferences about causal effects canbe generalized from the population and setting being studied toother populations and settings.◦ What would happen to California HS test scores if every
district reduced the STR by two students?◦ What would happen to Iowa elementary school test scores if
every district reduced the STR by two students?◦ What would happen to Japanese elementary school test
scores if every district reduced the STR by two students?
Critical Replication – p.5/41
Rod-Rod
Trade Policy and Economic Growth: A Skeptic’s Guide to theCross-National Evidence (Francisco Rodríguez and Dani Rodrik, NBERWorking Paper 7081, 1999 and NBER Macroeconomics Annual, 2000)
• “Do countries with lower policy-induced barriers to internationaltrade grow faster, once other relevant country characteristics arecontrolled for?”
• “Large empirical literature providing an affirmative answer”◦ Dollar (1992), Ben-David (1993), Sachs and Warner (1995),
Edwards (1998)
Critical Replication – p.6/41
Rod-Rod
• Begins with a small learning-by-doing model of ambiguous effectof trade policy
• Prima facie case is weak (Figs. I.1 and I.2)
• Definition of trade barrier
• Focus on trade policies rather than volume of trade
• Data quality
• Relevant outcome (GDP v. welfare)
• Publication bias
Critical Replication – p.7/41

Figure I.1: Partial Association between Growth and Import Duties
Gro
wth
(un
expl
aine
d pa
rt)
import duties as % of imports.018885 51.4781
-.054752
.05203
FRA
GNB
ITA
DNKGBR
SGP
NORSWE
FINAUT
JPN
USA
CAN
PRT
CHE
JAM
NZL
ZAF
ISR
IDN
SLVBOL
IRL
ESP
MYS
KOR
PRY
GTMAUS
NIC
BRA
TTO
MEXPAN
TZA
ARG
CRIHND
VEN
BRB
CYP
ZMB
THA
PNG
LKA
MLI
TURURY
ISL
NPLCOL
KENECU
MWI
SYR
PHL
BGD
NERTGO
FJI
SLEPER
COG
GHA
LSO
BWA
SWZZWE
DOM
SEN
TUN
BEN
CMR
RWA
GMB
CAF
IRN
PAK
EGY
BUR
SDN
IND
Weak relationship between tariffs and growth
Critical Replication – p.8/41
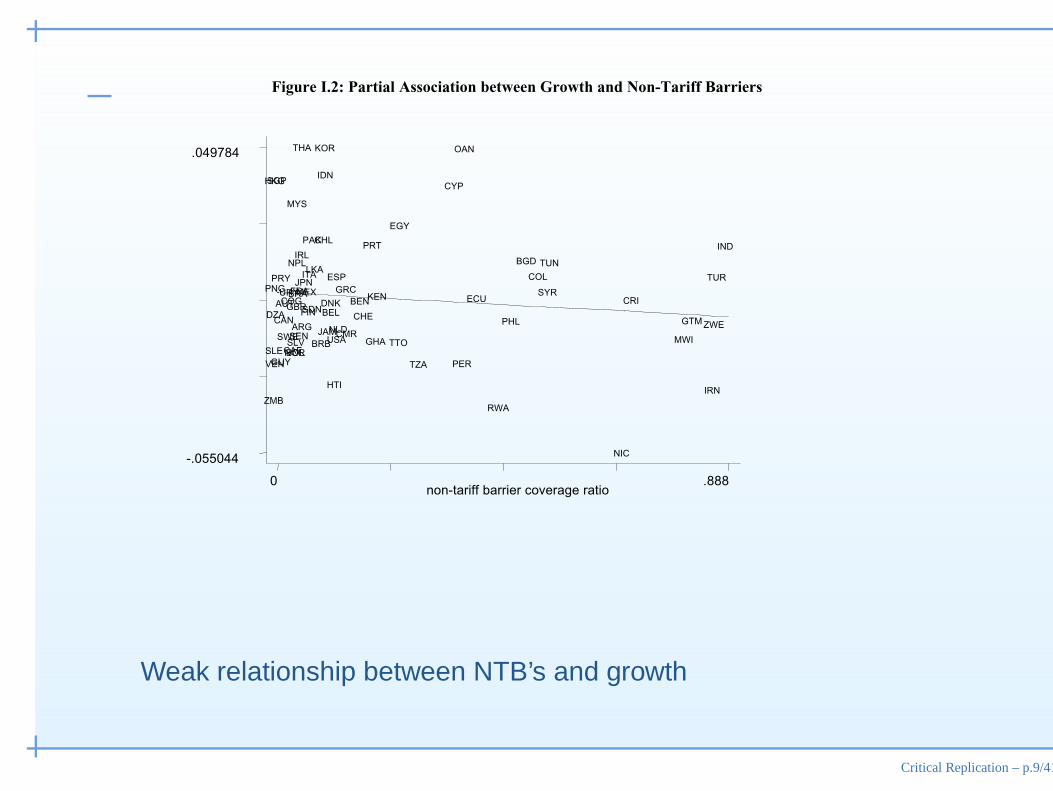
Figure I.2: Partial Association between Growth and Non-Tariff Barriers
non-tariff barrier coverage ratio0 .888
-.055044
.049784
ZMB
SLE
HKG
PNG
VEN
DZA
SGP
PRY
GUY
CAN
AUT
SWE
URYCOG
CAFNORBOLSLV
GBR
MYS
NPL
BRA
SEN
FRA
IRL
THA
ARG
JPNMEX
FIN
ITA
PAK
SDN
LKA
BRB
CHL
KOR
IDN
JAM
BELDNK
HTI
ESP
USANLD
GRC
CMR
BEN
CHE
PRT
GHA
KEN
TTO
EGY
TZA
CYP
PER
OAN
ECU
RWA
PHL
BGD
COL
SYR
TUN
NIC
CRI
MWI
GTM
IRN
ZWE
TUR
IND
Weak relationship between NTB’s and growth
Critical Replication – p.9/41
Rod-Rod
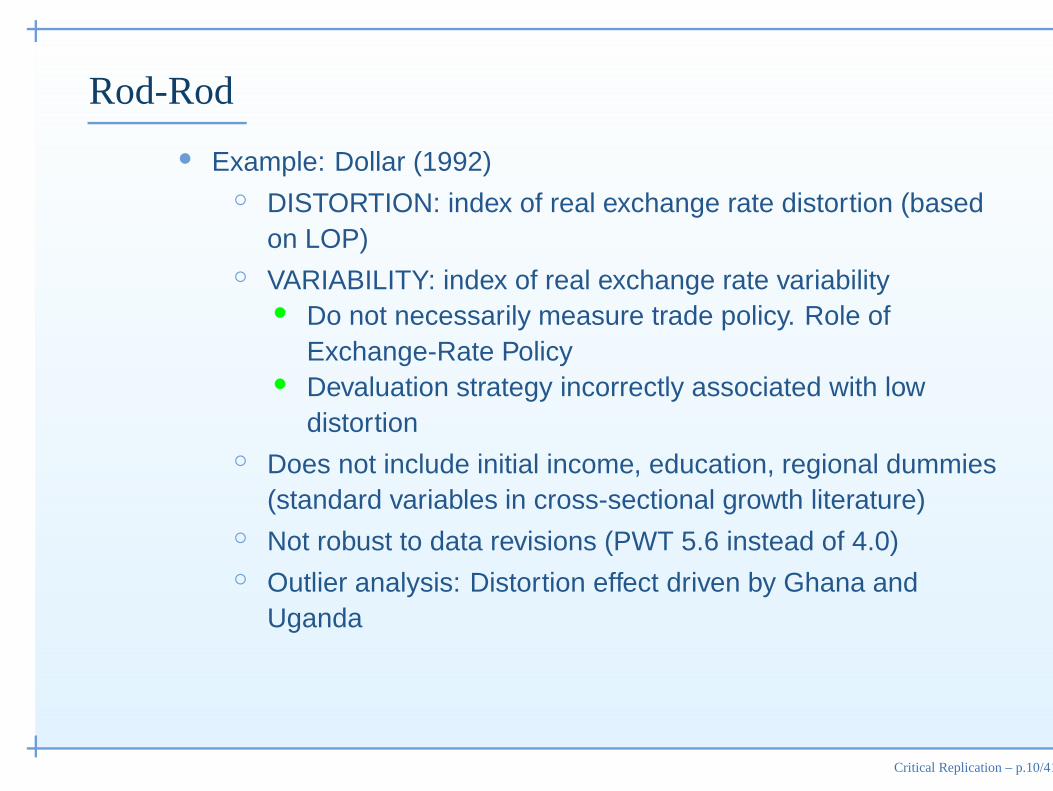
• Example: Dollar (1992)◦ DISTORTION: index of real exchange rate distortion (based
on LOP)◦ VARIABILITY: index of real exchange rate variability
• Do not necessarily measure trade policy. Role ofExchange-Rate Policy
• Devaluation strategy incorrectly associated with lowdistortion
◦ Does not include initial income, education, regional dummies(standard variables in cross-sectional growth literature)
◦ Not robust to data revisions (PWT 5.6 instead of 4.0)◦ Outlier analysis: Distortion effect driven by Ghana and
Uganda
Critical Replication – p.10/41
Rod-Rod
Findings and Recommendations
• The relationship between trade barriers and economic growthreceives weak support from the evidence. Results are contingenton dubious definitions, specific data, outliers.
• Explore contingent relationships (different effects of trade policyin: low- versus high-income countries, mfg versus primaryeconomies, dependent on world economy
• Disaggregate policy and explore more carefully (tariff, capitalcontrols, export-processing zones, etc.)
• Plant-level datasets, especially does export cause efficiency orefficiency cause export
Critical Replication – p.11/41
Internal Validity
• Want β̂ to be unbiased and consistent estimator of β• Hypothesis tests should have the intended significance level and
CI’s should have the desired confidence level.◦ Depends on SE’s being accurately estimated
• Example of a threat to internal validity: omitted variable bias
• Solution: include omitted variables
Critical Replication – p.12/41
External Validity
Example
• Laboratory animal toxicity studies to study, predict, and regulatehuman exposure and health effects
What can go wrong?
• Differences in Populations between population studied and thepopulation of interest (geography, time [e.g., RAND HIE])
• Differences in Settings (legal, institutional, and physicalenvironments
Test scores and STR
• ES scores in the U.S. more likely to be an externally validapplication than HS scores in U.S. or ES scores in Japan.
• Except: High-stakes testing (for students, teachers, etc.)
Critical Replication – p.13/41
Assessing External Validity
Requires
• Specific knowledge of the population and setting studied and thepopulation and setting of interest; or
• Studies on several populations and settings that generate similarresults.
Critical Replication – p.14/41
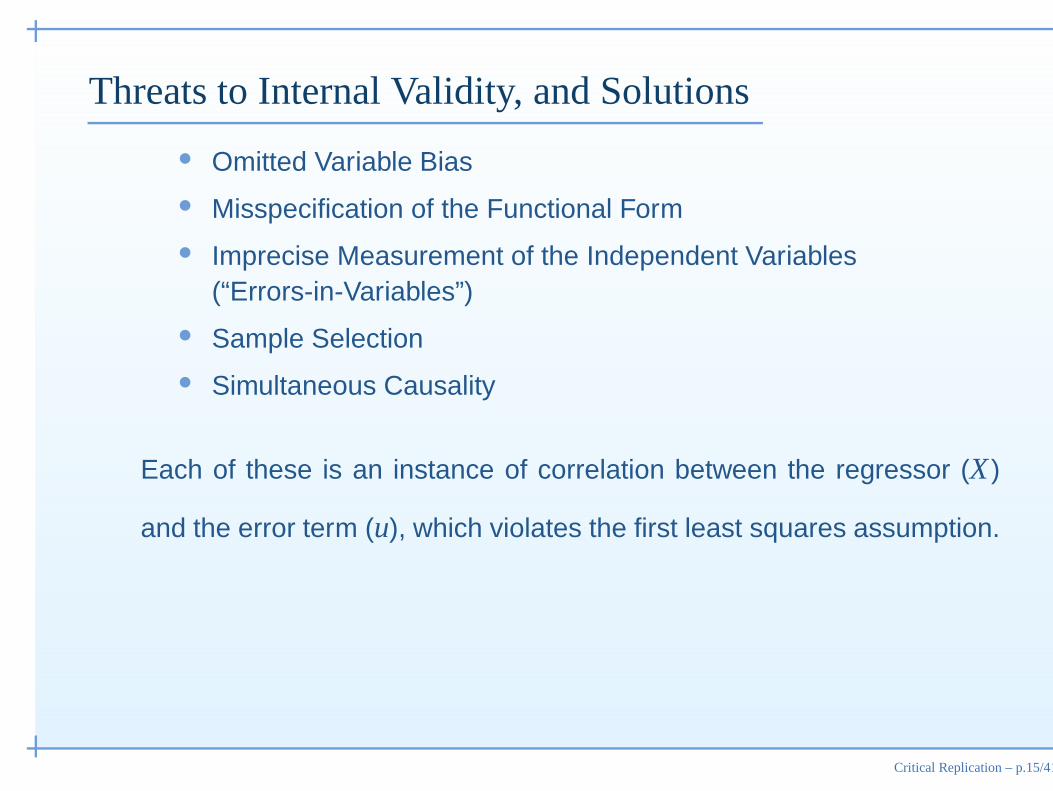
Threats to Internal Validity, and Solutions
• Omitted Variable Bias
• Misspecification of the Functional Form
• Imprecise Measurement of the Independent Variables(“Errors-in-Variables”)
• Sample Selection
• Simultaneous Causality
Each of these is an instance of correlation between the regressor (X )
and the error term (u), which violates the first least squares assumption.
Critical Replication – p.15/41
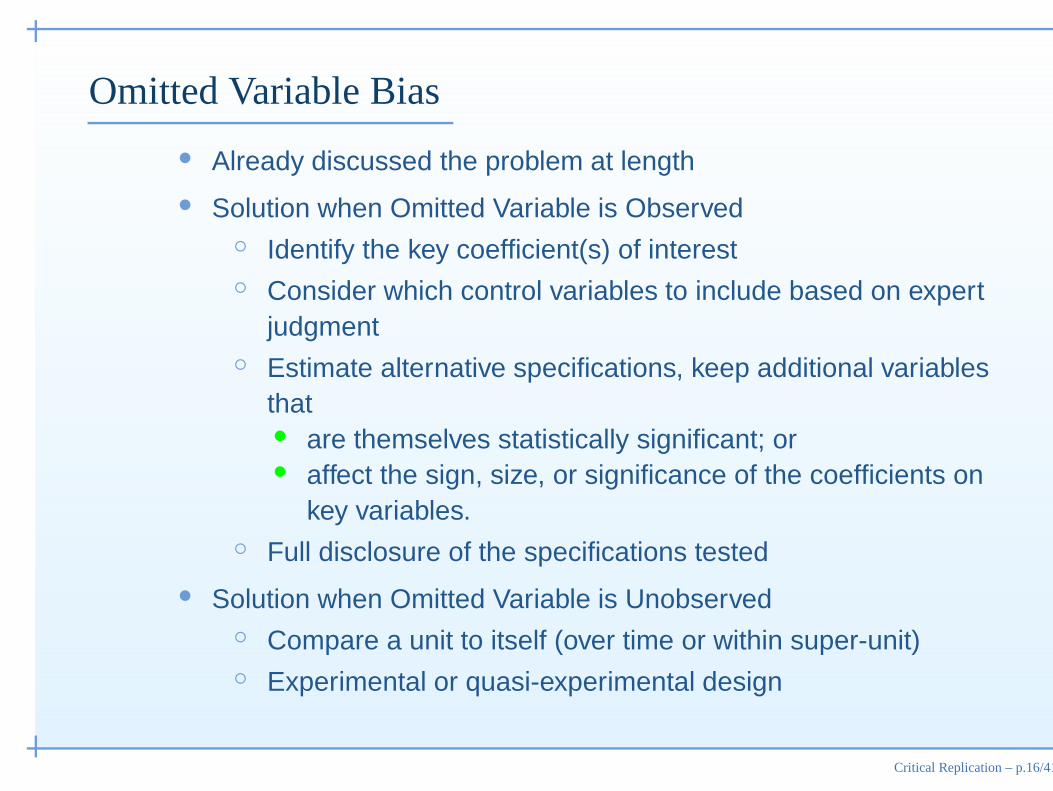
Omitted Variable Bias
• Already discussed the problem at length
• Solution when Omitted Variable is Observed◦ Identify the key coefficient(s) of interest◦ Consider which control variables to include based on expert
judgment◦ Estimate alternative specifications, keep additional variables
that• are themselves statistically significant; or• affect the sign, size, or significance of the coefficients on
key variables.◦ Full disclosure of the specifications tested
• Solution when Omitted Variable is Unobserved◦ Compare a unit to itself (over time or within super-unit)◦ Experimental or quasi-experimental design
Critical Replication – p.16/41
Misspecification of the Functional Form
• Curved and changing relationships (Chapter 6)—beyond thescope of this course. Use scatterplots to identify non-linearrelationships.
• Discrete outcome variables (Chapter 9)
Critical Replication – p.17/41
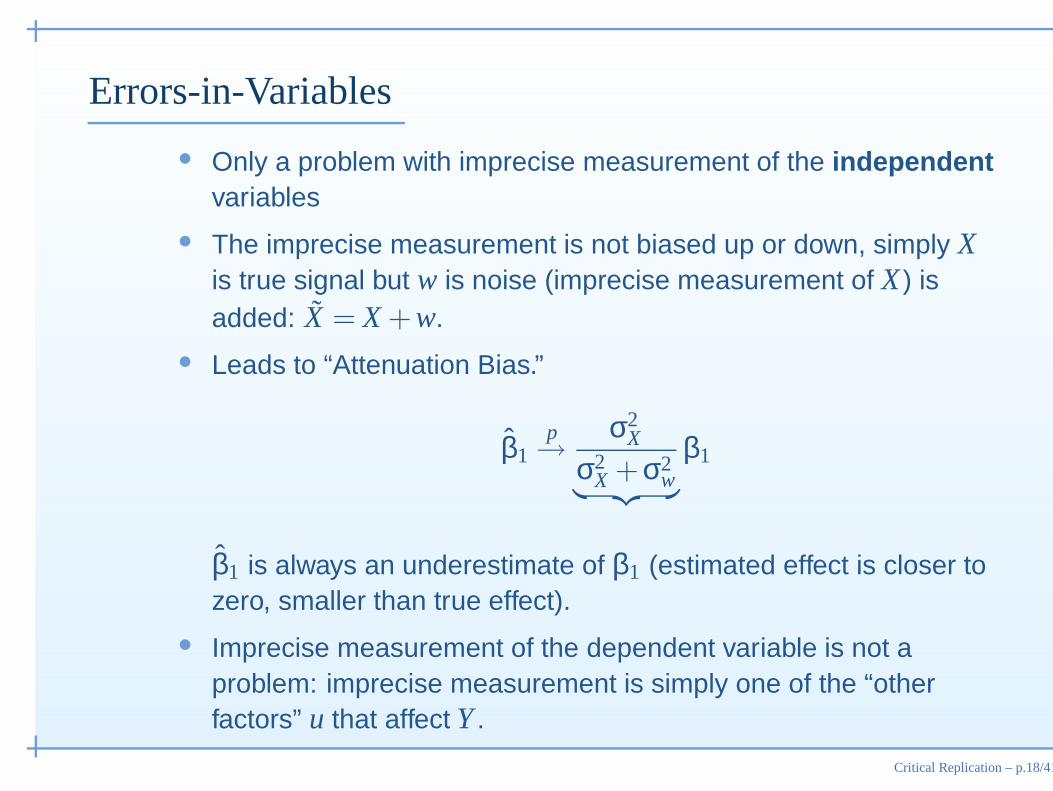
Errors-in-Variables
• Only a problem with imprecise measurement of the independentvariables
• The imprecise measurement is not biased up or down, simply Xis true signal but w is noise (imprecise measurement of X ) isadded: X̃ = X +w.
• Leads to “Attenuation Bias.”
β̂1p→
σ2X
σ2X +σ2
w︸ ︷︷ ︸
β1
β̂1 is always an underestimate of β1 (estimated effect is closer tozero, smaller than true effect).
• Imprecise measurement of the dependent variable is not aproblem: imprecise measurement is simply one of the “otherfactors” u that affect Y .
Critical Replication – p.18/41
Errors-in-Variables, cont’d
• Solutions◦ Multiple independent measures of X (even if all are
imprecise)◦ Adjust estimates for attenuation bias based on estimated
size of the imprecision
Critical Replication – p.19/41
Sample Selection
• Availability of the data is influenced by a selection process that isrelated to the value of the dependent variable.
• In all these cases, “other factors” u may be correlated with X .◦ 1936 Presidential poll limited to car and telephone owners◦ People who apply for job-training programs likely have
barriers to employment.◦ People with jobs may have high earning potential (controlling
for their characteristics).◦ InnerChange program evaluation, attrition in general
• Solutions: various and complex; create an explicit model of theselection process.
Critical Replication – p.20/41

Simultaneous, or Reverse, Causality
• Government may hire additional teachers in low-performingdistricts (or now government may penalize low-performingdistricts).
Yi = β0 +β1Xi +ui
Xi = γ0 + γ1Yi + vi
• Induces correlation between u and X .◦ Consider case where ui is low, hence Yi is low.◦ If Yi is low, then (assuming γ1 positive) Xi is low.◦ But this means that ui and Xi are low together—correlated!
• Solutions: randomized controlled experiments (Chapter 11) andeconometric quasi-experimental methods (beyond the scope ofthis course).
Critical Replication – p.21/41
Summary
• Note that every problem discussed so far involved a violation ofOLS assumption #1: the conditional distribution of ui given Xi hasmean zero.
• General language for discussing problems with causal models(within and beyond econometrics)
Critical Replication – p.22/41

Inconsistency in OLS Standard Errors
• The OLS estimates of β remain consistent and unbiased; but
• Inference (CI’s, hypothesis tests) will be wrong because the SE’sare wrong.
• Heteroskedasticity: use robust standard errors
• Correlation of the error term across observations
Yi = β0 +β1Xi +ui
Yj = β0 +β1X j +u j
ui and u j should not be related.◦ Repeated sampling of the same unit over time, “serial
correlation”◦ Sampling within the same household or geographical unit◦ Less (fewer observations) than meets the eye
Critical Replication – p.23/41
Internal and External Validity
• External Validity
• Internal Validity◦ Omitted Variable Bias◦ Misspecified Functional Form◦ Errors-in-Variables◦ Sample Selection, InnerChange example◦ Simultaneous (Reverse) Causality◦ Inconsistent Standard Errors
Critical Replication – p.24/41
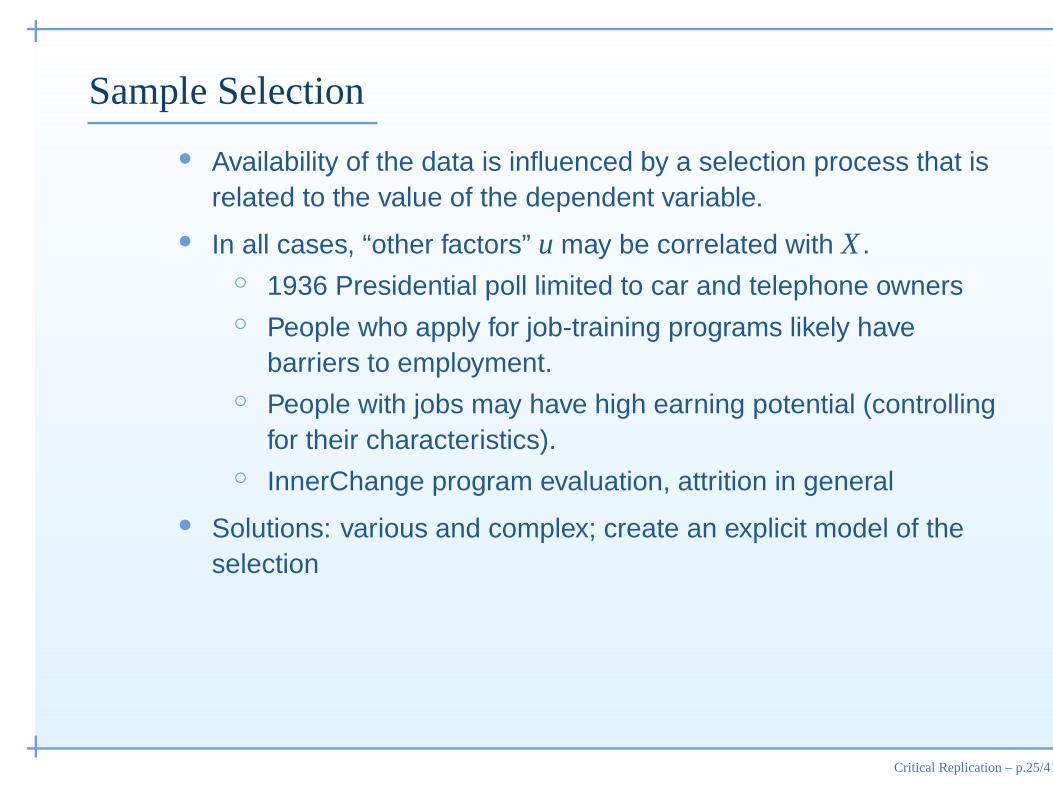
Sample Selection
• Availability of the data is influenced by a selection process that isrelated to the value of the dependent variable.
• In all cases, “other factors” u may be correlated with X .◦ 1936 Presidential poll limited to car and telephone owners◦ People who apply for job-training programs likely have
barriers to employment.◦ People with jobs may have high earning potential (controlling
for their characteristics).◦ InnerChange program evaluation, attrition in general
• Solutions: various and complex; create an explicit model of theselection
Critical Replication – p.25/41
InnerChange
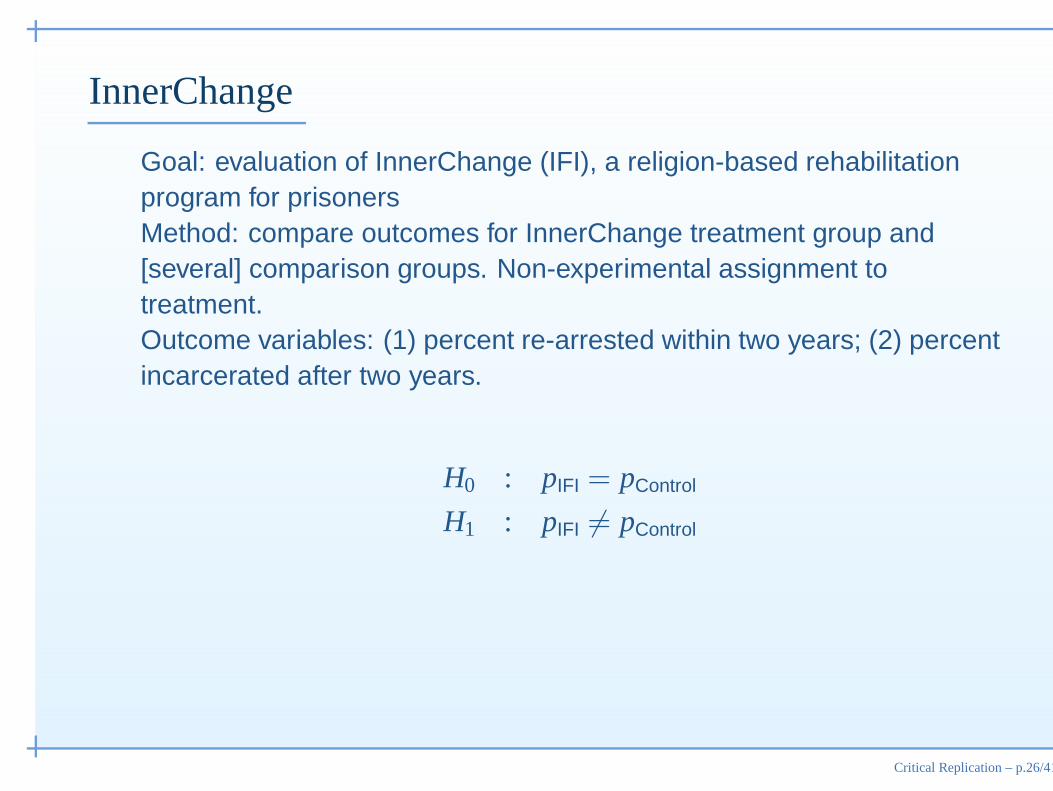
Goal: evaluation of InnerChange (IFI), a religion-based rehabilitationprogram for prisonersMethod: compare outcomes for InnerChange treatment group and[several] comparison groups. Non-experimental assignment totreatment.Outcome variables: (1) percent re-arrested within two years; (2) percentincarcerated after two years.
H0 : pIFI = pControl
H1 : pIFI 6= pControl
Critical Replication – p.26/41

InnerChange
Statistics → Summaries, tables, & tests → Classical tests of
hypotheses → Two-sample proportion calculatorTwo-sample test of proportion x: Number of obs = 177
y: Number of obs = 1754
------------------------------------------------------------------------------
Variable | Mean Std. Err. z P>|z| [95% Conf. Interval]
-------------+----------------------------------------------------------------
x | .243 .0322377 .1798152 .3061848
y | .203 .0096042 .1841761 .2218239
-------------+----------------------------------------------------------------
diff | .04 .033638 -.0259292 .1059292
| under Ho: .031934 1.25 0.210
------------------------------------------------------------------------------
Ho: proportion(x) - proportion(y) = diff = 0
Ha: diff < 0 Ha: diff != 0 Ha: diff > 0
z = 1.253 z = 1.253 z = 1.253
P < z = 0.8948 P > |z| = 0.2104 P > z = 0.1052
Critical Replication – p.27/41
InnerChange: Sample Selection Bias?
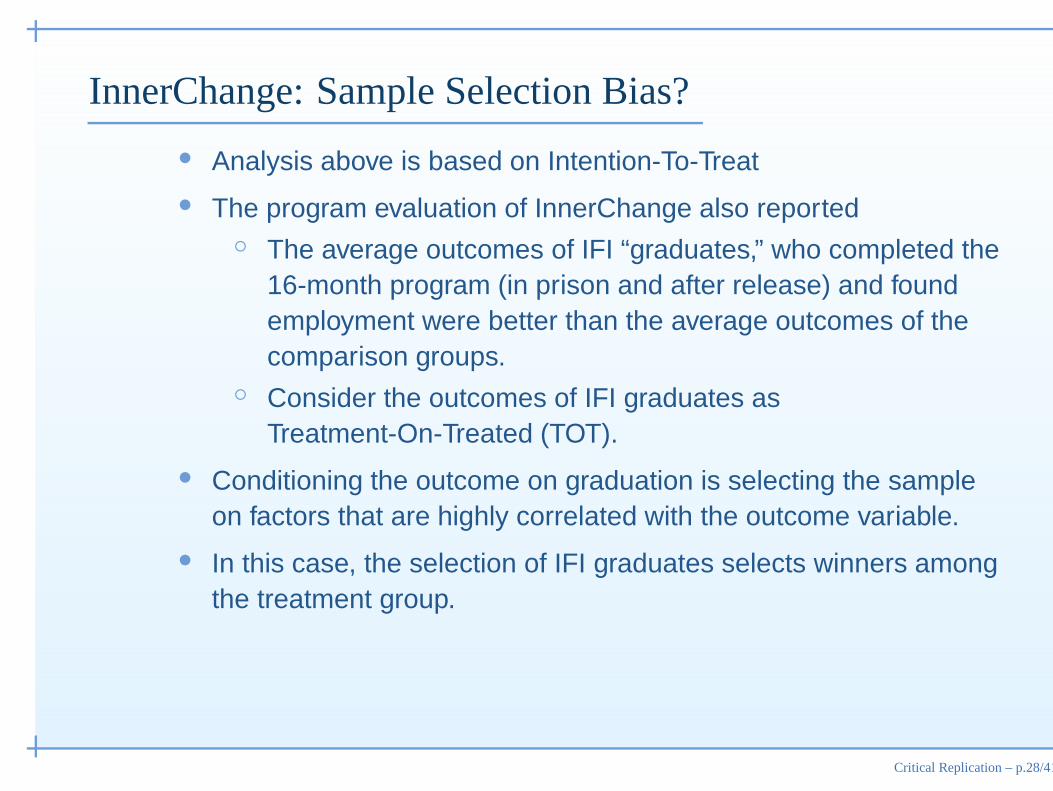
• Analysis above is based on Intention-To-Treat
• The program evaluation of InnerChange also reported◦ The average outcomes of IFI “graduates,” who completed the
16-month program (in prison and after release) and foundemployment were better than the average outcomes of thecomparison groups.
◦ Consider the outcomes of IFI graduates asTreatment-On-Treated (TOT).
• Conditioning the outcome on graduation is selecting the sampleon factors that are highly correlated with the outcome variable.
• In this case, the selection of IFI graduates selects winners amongthe treatment group.
Critical Replication – p.28/41
InnerChange: Sample Selection Bias?
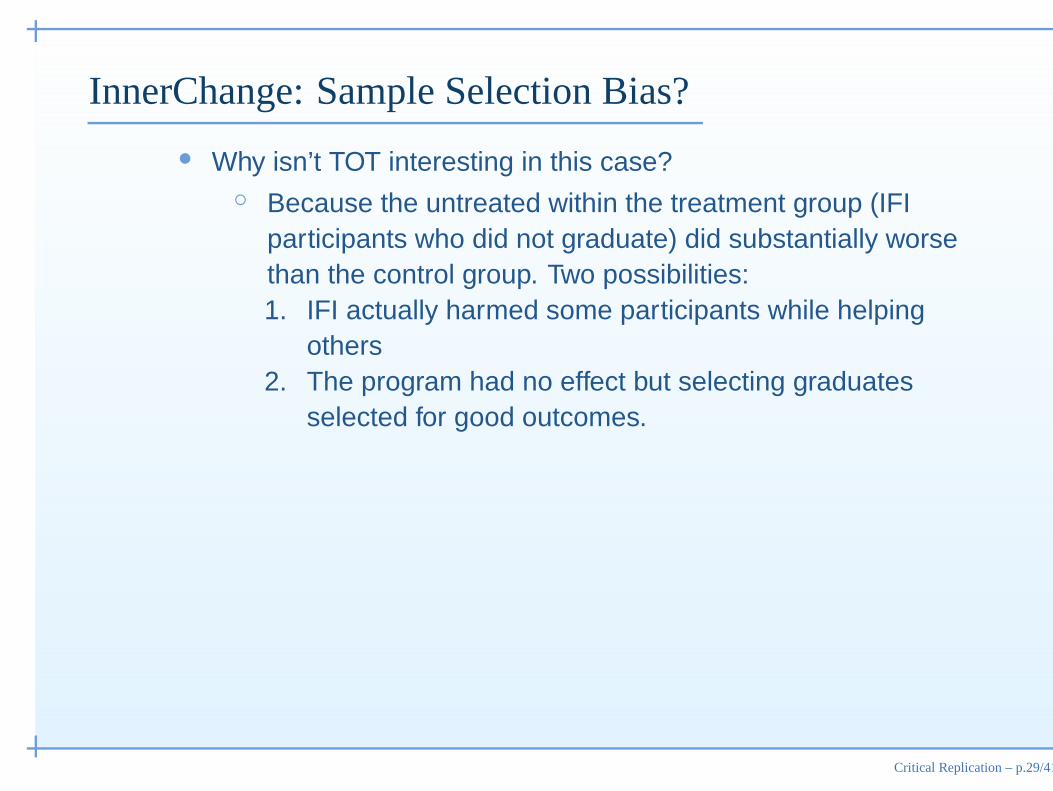
• Why isn’t TOT interesting in this case?◦ Because the untreated within the treatment group (IFI
participants who did not graduate) did substantially worsethan the control group. Two possibilities:1. IFI actually harmed some participants while helping
others2. The program had no effect but selecting graduates
selected for good outcomes.
Critical Replication – p.29/41
Simultaneous, or Reverse, Causality
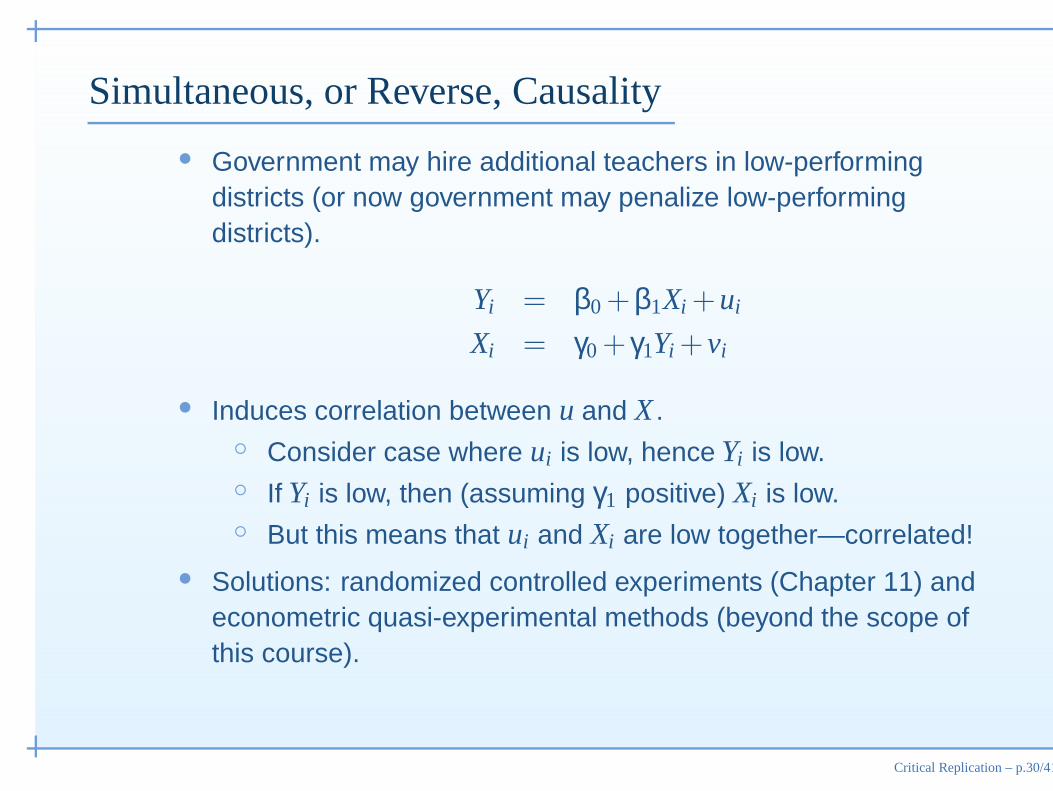
• Government may hire additional teachers in low-performingdistricts (or now government may penalize low-performingdistricts).
Yi = β0 +β1Xi +ui
Xi = γ0 + γ1Yi + vi
• Induces correlation between u and X .◦ Consider case where ui is low, hence Yi is low.◦ If Yi is low, then (assuming γ1 positive) Xi is low.◦ But this means that ui and Xi are low together—correlated!
• Solutions: randomized controlled experiments (Chapter 11) andeconometric quasi-experimental methods (beyond the scope ofthis course).
Critical Replication – p.30/41

Summary
• Note that every problem discussed so far involved a violation ofOLS assumption #1: the conditional distribution of ui given Xi hasmean zero.
• General language for discussing problems with causal models(within and beyond econometrics)
Critical Replication – p.31/41
Inconsistency in OLS Standard Errors
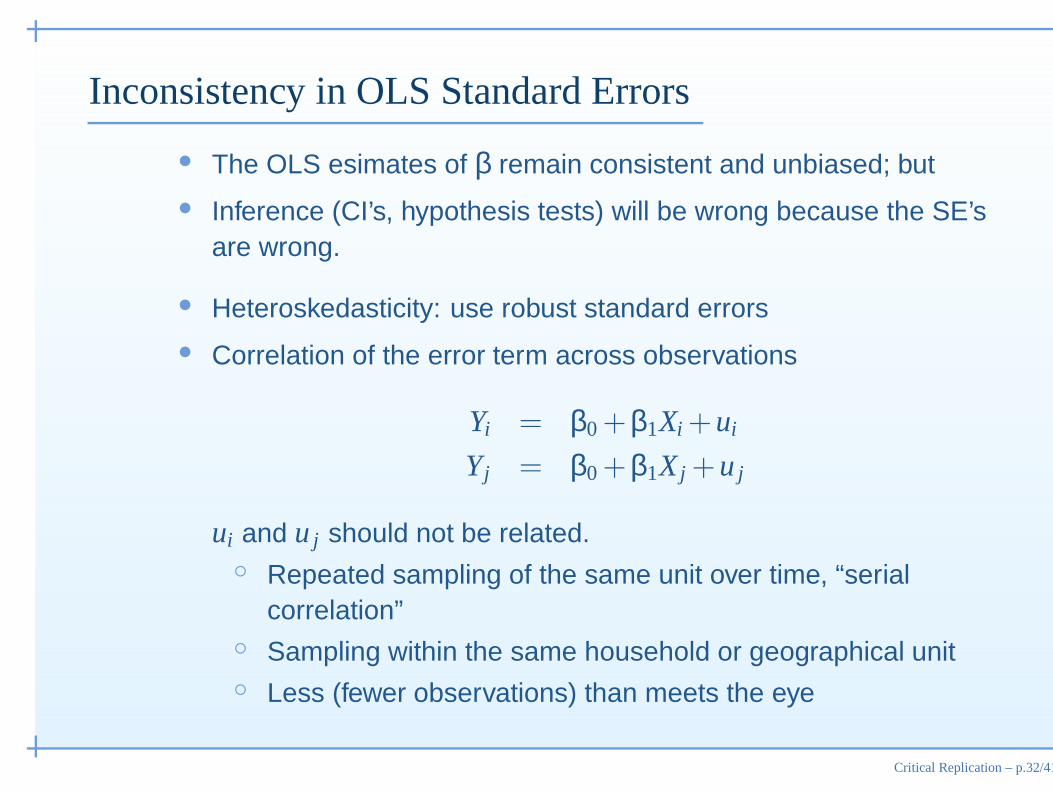
• The OLS esimates of β remain consistent and unbiased; but
• Inference (CI’s, hypothesis tests) will be wrong because the SE’sare wrong.
• Heteroskedasticity: use robust standard errors
• Correlation of the error term across observations
Yi = β0 +β1Xi +ui
Yj = β0 +β1X j +u j
ui and u j should not be related.◦ Repeated sampling of the same unit over time, “serial
correlation”◦ Sampling within the same household or geographical unit◦ Less (fewer observations) than meets the eye
Critical Replication – p.32/41
Test Scores and STR: External Validity
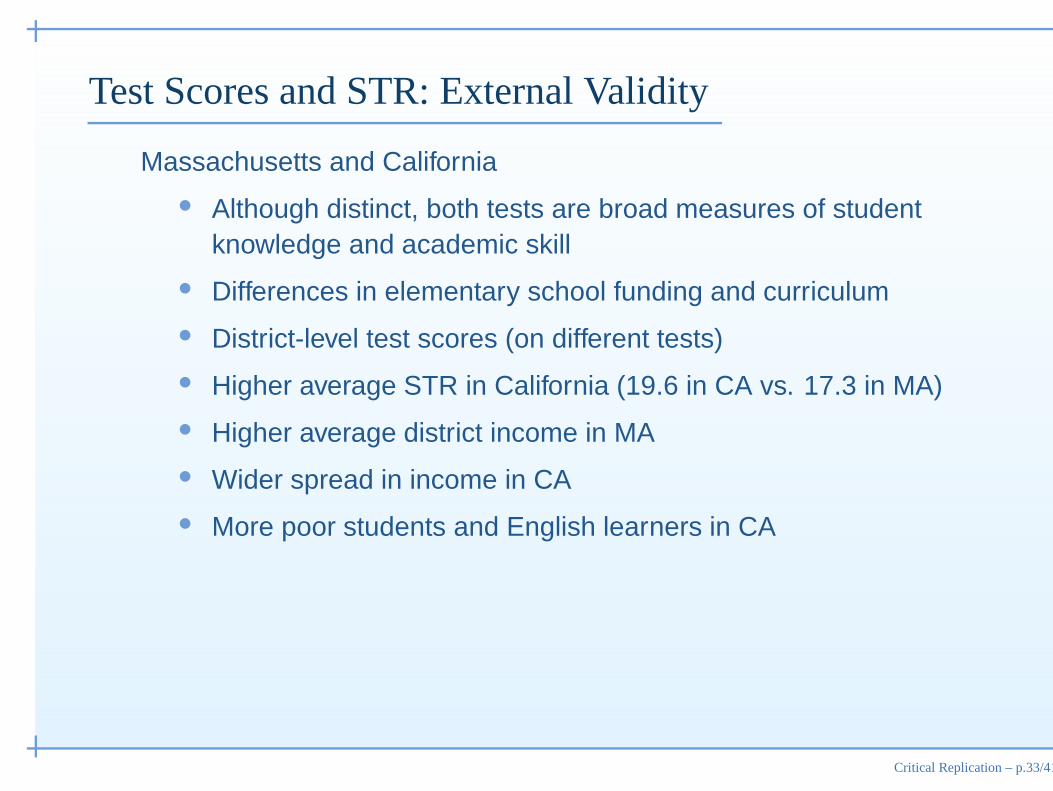
Massachusetts and California
• Although distinct, both tests are broad measures of studentknowledge and academic skill
• Differences in elementary school funding and curriculum
• District-level test scores (on different tests)
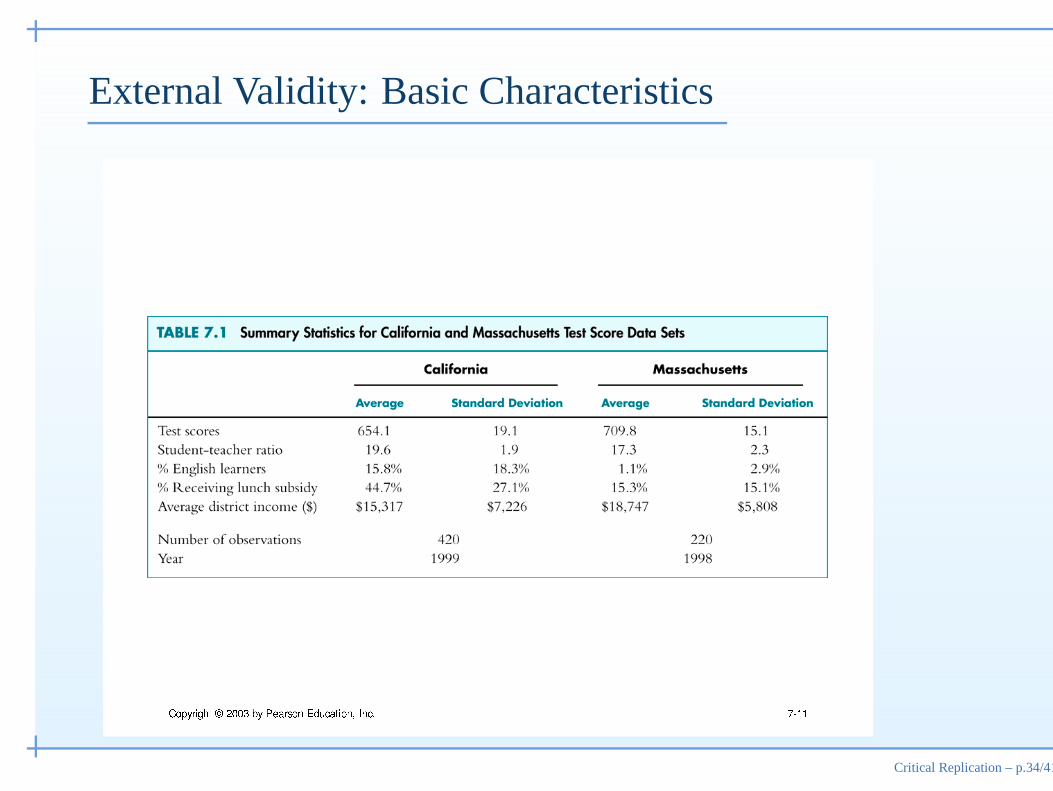
• Higher average STR in California (19.6 in CA vs. 17.3 in MA)
• Higher average district income in MA
• Wider spread in income in CA
• More poor students and English learners in CA
Critical Replication – p.33/41
External Validity: Basic Characteristics
Critical Replication – p.34/41
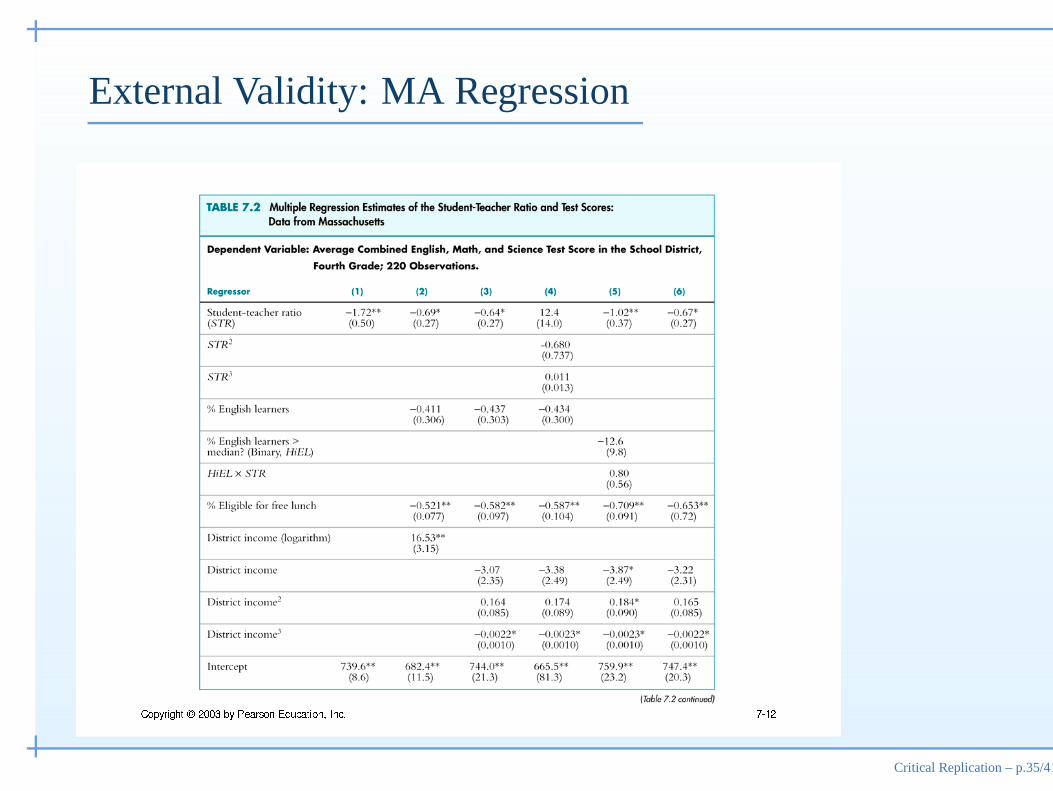
External Validity: MA Regression
Critical Replication – p.35/41
External Validity: First case
• California◦ Adding variables that control of student background
characteristics reduced the coefficient from −2.28 to −0.73,a reduction of 68 percent.
◦ The null hypothesis (H0 : βSTR = 0) was rejected at the 1percent significance level.
• Massachusetts◦ Adding variables that control of student background
characteristics reduced the coefficient from −1.72 to −0.69,a reduction of 60 percent.
◦ The null hypothesis (H0 : βSTR = 0) was rejected only at the5 percent significance level (but there are moreobservations in CA, which tends to drive down the SE).
Critical Replication – p.36/41
External Validity: Truly comparable?
• Different tests, different scores, different differences in scores◦ One test point does not mean the same thing in MA and CA.◦ Standardize the results by dividing the change in test score
by the standard deviation of test scores.◦ Expresses the effect on test scores in terms of the observed
overall spread in test scores.
Critical Replication – p.37/41

External Validity: Summary Table
Critical Replication – p.38/41
Test Scores and STR: Internal Validity
• Omitted variable bias: we’ve done our best (English learners,socioeconomic background). Other important possibilities:teacher quality; extracurriculars; family commitment to learning.Next stop: experiment
• Functional form (Chapter 6, not this course): Basic result is thatlinear is ok.
• Errors-in-Variables: student moves may lead to mismeasurementof district STR; income data are from 1990 Census while otherdata pertain to late 1990’s.
• Selection: all districts included. Absenteeism?
• Simultaneous causality: for example, allocation of resourcesbased on test performance (either compensatory or sanctioning).Neither California nor Massachusetts had (late 1990’s) significantallocation based on performance.
Critical Replication – p.39/41
Test Scores and STR: Internal Validity, cont’d
• Heteroskedasticity-consistent standard errors
• Universe of observations is not the same as a random sample(the ideal under OLS Assumption #2), but probably ok.
Critical Replication – p.40/41
Test Scores and STR: Finally done!
• Effect of STR: cutting STR by two students increases test scoresby approximately 0.08 standard deviations.◦ Effect is signficant but small
• Result appears generalizable in U.S. elementary school systems.
• Consider other omitted variables (listed above)
• Basis for policy decisions, estimating benefits in a cost-benefitanalysis of changing STR versus other possible uses ofeducation resources.
• Did we measure the right outcome? Alternative outcomes?
Critical Replication – p.41/41