Applied Investment Management (AIM) · PDF filematching revenue expectations at €3.4 B...
16
Marquette University AIM Class 2014 Equity Reports Fall 2013 Page 1 Applied Investment Management (AIM) Program AIM Class of 2014 Equity Fund Reports Fall 2013 Date: Friday, September 20, 2013 Time: 1:30 pm – 3:30 pm Road Show Location: Red Granite (Ziegler-Lotsoff) Student Presenter Company Name Ticker Price Page No. Axel Sjoberg Continental A.G. CTTAY $166.22 2 Dayton Hoell Conn’s Inc. CONN $53.01 5 Rocio Maria Diaz Danone S.A. DANOY $14.98 8 Charlie Hoover Hanger, Inc. HGR $31.12 11 Zac Zhuang Suncor Energy Inc. SU $36.15 14 Thank you for taking the time today and participating in the AIM ‘road show’ at Red Granite. These student presentations are an important element of the applied learning experience in the AIM program. The students conduct fundamental equity research and present their recommendations in written and oral format – with the goal of adding their stock to the AIM Equity Fund. Your comments and advice add considerably to their educational experience and is greatly appreciated. Today, each student will spend about 5-7 minutes presenting their formal recommendation, which is then followed by about 8-10 minutes of Q & A. Again, thank you for allowing us the opportunity to present at Red Granite. For more information about AIM please contact: David S. Krause, PhD Director, Applied Investment Management Program Marquette University College of Business Administration, Department of Finance 436 Straz Hall, PO Box 1881 Milwaukee, WI 53201-1881 mailto: [email protected] Website: MarquetteBuz/AIM AIM Blog: AIM Program Blog Twitter: Marquette AIM Facebook: Marquette AIM
-
Upload
phungxuyen -
Category
Documents
-
view
216 -
download
2
Transcript of Applied Investment Management (AIM) · PDF filematching revenue expectations at €3.4 B...
Marquette University AIM Class 2014 Equity Reports Fall 2013 Page 1
Applied Investment Management (AIM) Program
AIM Class of 2014 Equity Fund Reports Fall 2013
Date: Friday, September 20, 2013 Time: 1:30 pm – 3:30 pm
Road Show Location: Red Granite (Ziegler-Lotsoff)
Student Presenter Company Name Ticker Price Page No.
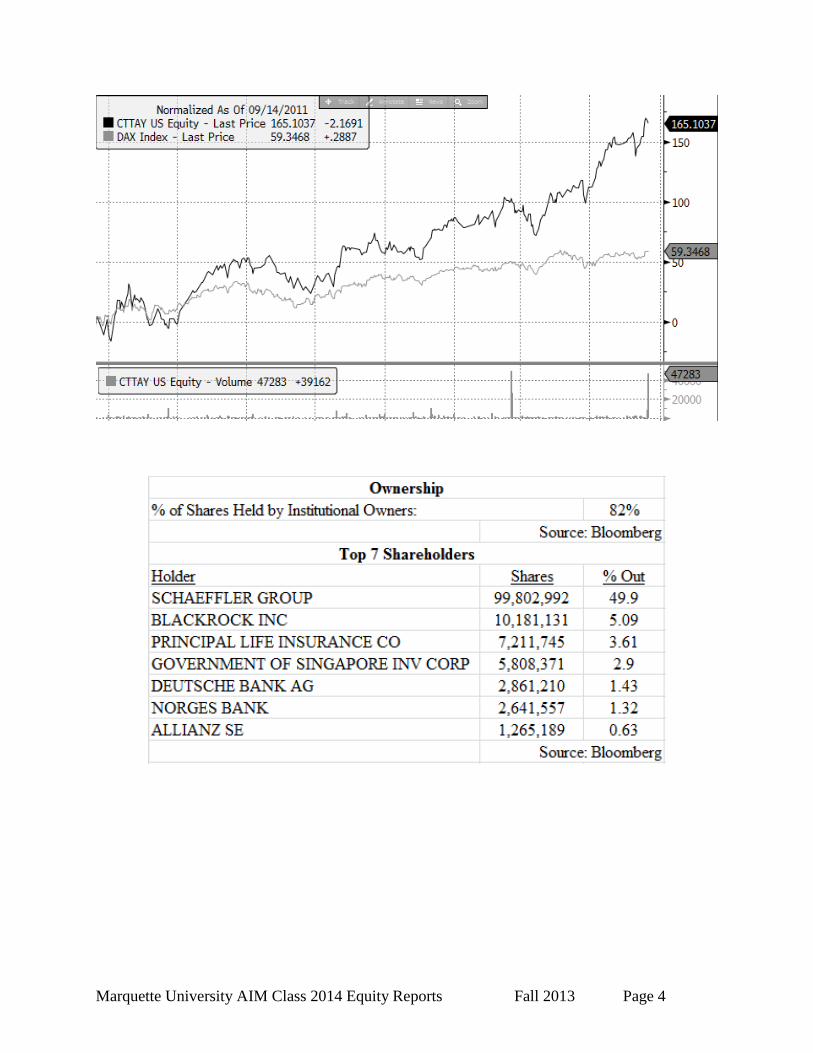
Axel Sjoberg Continental A.G. CTTAY $166.22 2
Dayton Hoell Conn’s Inc. CONN $53.01 5
Rocio Maria Diaz Danone S.A. DANOY $14.98 8
Charlie Hoover Hanger, Inc. HGR $31.12 11
Zac Zhuang Suncor Energy Inc. SU $36.15 14 Thank you for taking the time today and participating in the AIM ‘road show’ at Red Granite. These student presentations are an important element of the applied learning experience in the AIM program. The students conduct fundamental equity research and present their recommendations in written and oral format – with the goal of adding their stock to the AIM Equity Fund. Your comments and advice add considerably to their educational experience and is greatly appreciated. Today, each student will spend about 5-7 minutes presenting their formal recommendation, which is then followed by about 8-10 minutes of Q & A. Again, thank you for allowing us the opportunity to present at Red Granite. For more information about AIM please contact: David S. Krause, PhD Director, Applied Investment Management Program Marquette University College of Business Administration, Department of Finance 436 Straz Hall, PO Box 1881 Milwaukee, WI 53201-1881 mailto: [email protected] Website: MarquetteBuz/AIM AIM Blog: AIM Program Blog Twitter: Marquette AIM Facebook: Marquette AIM

Marquette University AIM Class 2014 Equity Reports Fall 2013 Page 2
Continental A.G. (CTTAY) September 20, 2013
Axel Sjoberg International Consumer Discretionary Continental A.G. (OTC: CTTAY) is a German manufacturer of automotive parts and industrial products. The Company produces passenger car, truck, commercial vehicle, and bicycle tires, braking systems, shock absorbers, hoses, drive belts, conveyor belting, transmission products and sealing systems. They operate mainly in Europe (55% of sales), NAFTA (22%), and Asia (18%). As of December 2012, Continental had approximately 170,000 employees in 46 countries. The corporation is divided into the Automotive Group and the Rubber Group, which contribute 60% and 40% of total sales respectively. Continental was founded in 1871 and is headquartered in Hannover, Germany.
Recommendation Continental A.G. is the world’s 4th largest tire manufacturer and among the leading automotive suppliers. For H1 2013, the Rubber Group saw increasing volumes and expanding margins due to tailwinds in raw materials. They beat consensus by 110 basis points in Q2 at an adj. EBIT margin of 16.8% while matching revenue expectations at €3.4 B. Revenue growth rate in 2012 compared to 2011 was 8.9%. The Automotive Group has moved at a slower pace due to lower demand, but met expectations in Q2 as they were in line with consensus at an adj. EBIT margin of 8.3% and revenues at €5.2 B. Revenue growth was 6.3% in 2012. Despite this, the Automotive Group outgrew global production with 4-5% as a result of stronger demand in the U.S. and China. Both groups combined are anticipated to grow revenue by about 5% in FY13, report an adj. EBIT margin of >10%, and a FCF of more than €700 M. CTTAY’s strategy, their approach to future production, and ability to post consistent margins and growth, makes them solid long-term investment. The stock price appears not to fully recognize the firm’s major projects and their sustainable business model. Also, I believe it fails to include the huge potential Continental has in its high exposure to German OEM’s that puts them in a favorable position to capitalize on a potential upswing in European automobile demand. This upswing is expected to arrive through a strong production trend and demand for cars in Europe, which account for 55% of Continental’s revenue. One indication was that automobile production in Germany was reported to be +5.2% in Q2 vs. –11% in Q1. For these reasons and a favorable valuation, it is recommended that CTTAY be added to the AIM International Equity Fund with a target price of $189.47, which offers a potential upside of 13.98%. The firm also pays an attractive dividend of $2.14 (1.72% yield). Investment Thesis
• Market position. Continental A.G. has shown solid growth, earnings, and free cash flow the past several quarters despite weak European demand. They are expanding further internationally, diversifying their sales revenue geographically to profit from increasing demand potential in major economies. Their size, relationship with OEM’s, and healthy view of future “megatrends,”
Marquette University AIM Class 2014 Equity Reports Fall 2013 Page 3
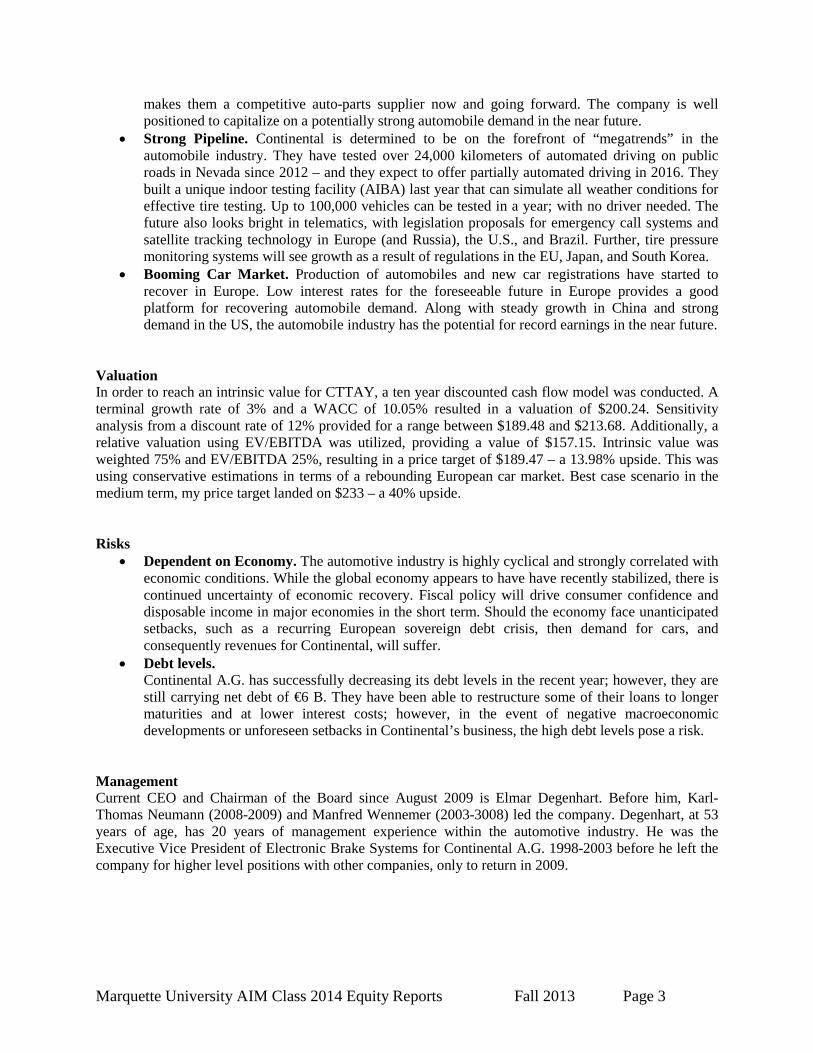
makes them a competitive auto-parts supplier now and going forward. The company is well positioned to capitalize on a potentially strong automobile demand in the near future.
• Strong Pipeline. Continental is determined to be on the forefront of “megatrends” in the automobile industry. They have tested over 24,000 kilometers of automated driving on public roads in Nevada since 2012 – and they expect to offer partially automated driving in 2016. They built a unique indoor testing facility (AIBA) last year that can simulate all weather conditions for effective tire testing. Up to 100,000 vehicles can be tested in a year; with no driver needed. The future also looks bright in telematics, with legislation proposals for emergency call systems and satellite tracking technology in Europe (and Russia), the U.S., and Brazil. Further, tire pressure monitoring systems will see growth as a result of regulations in the EU, Japan, and South Korea.
• Booming Car Market. Production of automobiles and new car registrations have started to recover in Europe. Low interest rates for the foreseeable future in Europe provides a good platform for recovering automobile demand. Along with steady growth in China and strong demand in the US, the automobile industry has the potential for record earnings in the near future.
Valuation In order to reach an intrinsic value for CTTAY, a ten year discounted cash flow model was conducted. A terminal growth rate of 3% and a WACC of 10.05% resulted in a valuation of $200.24. Sensitivity analysis from a discount rate of 12% provided for a range between $189.48 and $213.68. Additionally, a relative valuation using EV/EBITDA was utilized, providing a value of $157.15. Intrinsic value was weighted 75% and EV/EBITDA 25%, resulting in a price target of $189.47 – a 13.98% upside. This was using conservative estimations in terms of a rebounding European car market. Best case scenario in the medium term, my price target landed on $233 – a 40% upside. Risks
• Dependent on Economy. The automotive industry is highly cyclical and strongly correlated with economic conditions. While the global economy appears to have have recently stabilized, there is continued uncertainty of economic recovery. Fiscal policy will drive consumer confidence and disposable income in major economies in the short term. Should the economy face unanticipated setbacks, such as a recurring European sovereign debt crisis, then demand for cars, and consequently revenues for Continental, will suffer.
• Debt levels. Continental A.G. has successfully decreasing its debt levels in the recent year; however, they are still carrying net debt of €6 B. They have been able to restructure some of their loans to longer maturities and at lower interest costs; however, in the event of negative macroeconomic developments or unforeseen setbacks in Continental’s business, the high debt levels pose a risk.
Management Current CEO and Chairman of the Board since August 2009 is Elmar Degenhart. Before him, Karl-Thomas Neumann (2008-2009) and Manfred Wennemer (2003-3008) led the company. Degenhart, at 53 years of age, has 20 years of management experience within the automotive industry. He was the Executive Vice President of Electronic Brake Systems for Continental A.G. 1998-2003 before he left the company for higher level positions with other companies, only to return in 2009.
Marquette University AIM Class 2014 Equity Reports Fall 2013 Page 4
Marquette University AIM Class 2014 Equity Reports Fall 2013 Page 5
Conn’s Inc. (CONN) September 20, 2013
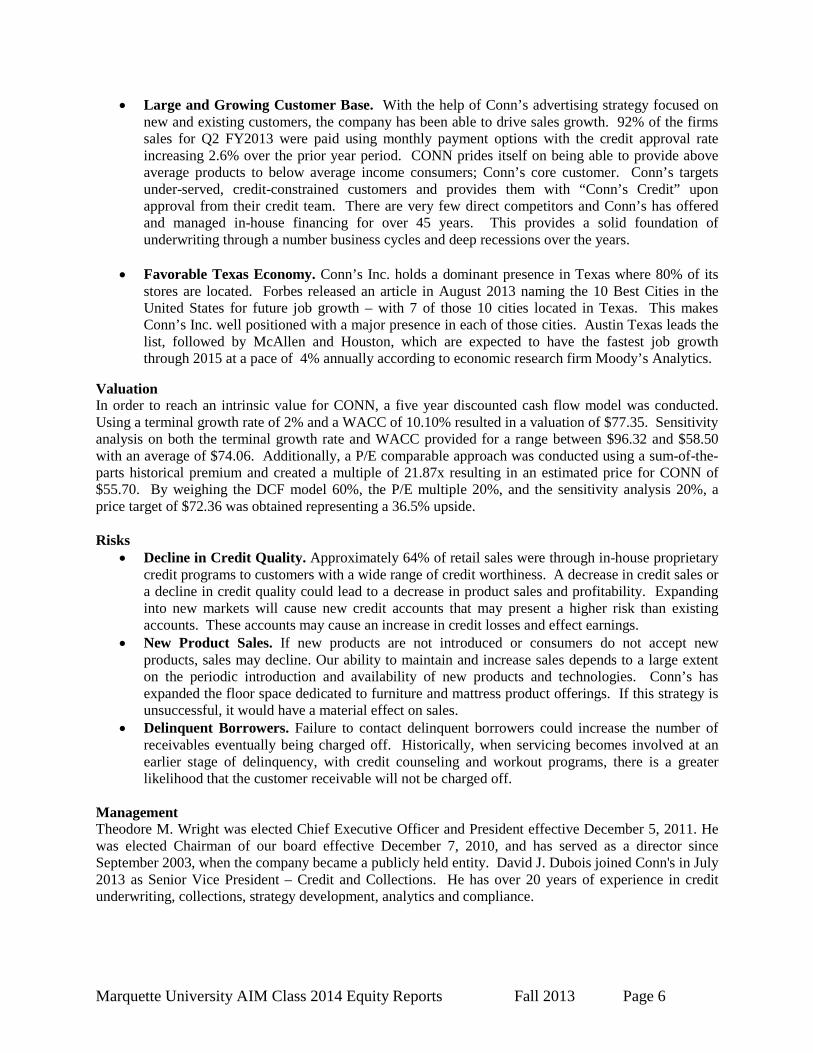
Dayton Hoell Domestic Consumer Discretionary Conn’s Inc. (NASDAQ:CONN) is a home appliances and consumer electronics retailing company, based in the US. The company’s home appliances which include refrigerators, freezers, washers, dryers and dishwashers, furniture and mattresses for living room, bedroom and dining room. Its consumer electronics are LED, LCD, plasma, DLP and 3-D televisions and camcorders. The company’s home office products include desktop, notebook, netbook and tablet computers among others. It also provides repair service agreements and installment credit programs. Conn's offers over 2,100 product items under well-known brands. As of September 5, 2013, the company operated approximately 70 retail locations in Texas, Louisiana, Oklahoma, New Mexico, and Arizona. Conn’s, Inc. was founded in 1890 and is based in The Woodlands, Texas.
Recommendation Conn’s Inc. is well positioned for substantial growth both as a company and even more so as a stock. CONN has had much success as it continues to establish its core customer base, generate new revenue, expand margins, and build and remodel new stores. Total same store revenue increased 18.4% in the second quarter of FY2014 with the furniture and mattress segment and the repair service segment showing 33.7% and 29.8% increases in revenue respectively. Other than it’s significant growth, Conn’s Inc. has branded itself with its ability to provide low-income consumers with the products they deserve through “Conn’s Credit.” The firm targets consumers with difficulties obtaining credit elsewhere and therefore has been able to create a profitable finance division within the company that generates 17% of its revenue. Poor implementation of a new collections system platform had caused a significant increase in the provision for bad debt expense of $5.9 million on Conn’s accounts receivable. As a result Conn’s missed its second quarter estimates in FY2014 causing the market to react with a 20% decline in CONN’s stock. Nevertheless, Conn’s has reported solid retail results in the first half of 2013. Q1 and Q2 2014 revenues have grown 25% and 31% YoY respectively. The retail segment’s operating income was $25.7 million vs. $12.5 million last year and total revenues were $270.7 million vs. the consensus of $261.4 million. Additionally, margins had increased across all product groups. The second quarter’s miss in earnings estimates has placed a strong growth potential on the stock at a significantly undervalued price. Due to this undervaluation, as well as a strong growth outlook it is recommended that Conn’s Inc. be added to the AIM Equity Fund with a price target of $72.36, representing a nearly 37% upside. The firm does not pay a dividend. Investment Thesis
• Significant Growth Opportunities. CONN is in the early stages of store base expansion throughout the southwestern region of the United States. The company has opened up 5 new stores in FY2013 with a FY2014 target of 10-12 new stores - 6 are already in place. Additionally, the firm provides FY2015 guidance of 15-20 new stores. These new openings are significant with their average product sales being 112% of the company’s average. Conn’s stores are spread throughout the region and have achieved a same store sales increase of 18.4% in Q2 2013. Additionally, Conn’s has completed 20 store remodels in FY2013 and plans 10-12 in 2014. The company sees long-term potential for more than 200 stores in the US.
Marquette University AIM Class 2014 Equity Reports Fall 2013 Page 6
• Large and Growing Customer Base. With the help of Conn’s advertising strategy focused on new and existing customers, the company has been able to drive sales growth. 92% of the firms sales for Q2 FY2013 were paid using monthly payment options with the credit approval rate increasing 2.6% over the prior year period. CONN prides itself on being able to provide above average products to below average income consumers; Conn’s core customer. Conn’s targets under-served, credit-constrained customers and provides them with “Conn’s Credit” upon approval from their credit team. There are very few direct competitors and Conn’s has offered and managed in-house financing for over 45 years. This provides a solid foundation of underwriting through a number business cycles and deep recessions over the years.
• Favorable Texas Economy. Conn’s Inc. holds a dominant presence in Texas where 80% of its stores are located. Forbes released an article in August 2013 naming the 10 Best Cities in the United States for future job growth – with 7 of those 10 cities located in Texas. This makes Conn’s Inc. well positioned with a major presence in each of those cities. Austin Texas leads the list, followed by McAllen and Houston, which are expected to have the fastest job growth through 2015 at a pace of 4% annually according to economic research firm Moody’s Analytics.
Valuation In order to reach an intrinsic value for CONN, a five year discounted cash flow model was conducted. Using a terminal growth rate of 2% and a WACC of 10.10% resulted in a valuation of $77.35. Sensitivity analysis on both the terminal growth rate and WACC provided for a range between $96.32 and $58.50 with an average of $74.06. Additionally, a P/E comparable approach was conducted using a sum-of-the-parts historical premium and created a multiple of 21.87x resulting in an estimated price for CONN of $55.70. By weighing the DCF model 60%, the P/E multiple 20%, and the sensitivity analysis 20%, a price target of $72.36 was obtained representing a 36.5% upside. Risks
• Decline in Credit Quality. Approximately 64% of retail sales were through in-house proprietary credit programs to customers with a wide range of credit worthiness. A decrease in credit sales or a decline in credit quality could lead to a decrease in product sales and profitability. Expanding into new markets will cause new credit accounts that may present a higher risk than existing accounts. These accounts may cause an increase in credit losses and effect earnings.
• New Product Sales. If new products are not introduced or consumers do not accept new products, sales may decline. Our ability to maintain and increase sales depends to a large extent on the periodic introduction and availability of new products and technologies. Conn’s has expanded the floor space dedicated to furniture and mattress product offerings. If this strategy is unsuccessful, it would have a material effect on sales.
• Delinquent Borrowers. Failure to contact delinquent borrowers could increase the number of receivables eventually being charged off. Historically, when servicing becomes involved at an earlier stage of delinquency, with credit counseling and workout programs, there is a greater likelihood that the customer receivable will not be charged off.
Management Theodore M. Wright was elected Chief Executive Officer and President effective December 5, 2011. He was elected Chairman of our board effective December 7, 2010, and has served as a director since September 2003, when the company became a publicly held entity. David J. Dubois joined Conn's in July 2013 as Senior Vice President – Credit and Collections. He has over 20 years of experience in credit underwriting, collections, strategy development, analytics and compliance.

Marquette University AIM Class 2014 Equity Reports Fall 2013 Page 7
33%
76%
Shares 4,305,343 2,397,618 2,285,849 1,877,623 21,712,656
Top 5 Shareholders
Source: Yahoo! Finance
Source: Bloomberg
% of Shares Held by All Insiders and 5% Owners:
% of Shares Held by Institutional & Mutual Fund Owners
Ownership
Vanguard
% Out 11.98% 6.67%
6.36% 5.22% 4.76%
Holder Conn’s Voting Trust St. Denis J. Villere & Company Dimensional Fund Advisors Warren A Stephens Trust

Marquette University AIM Class 2014 Equity Reports Fall 2013 Page 8
Danone S.A. (DANOY) September 20, 2013
Rocio Maria Diaz International Consumer Staples Danone S.A. (DANOY) produces and distributes food and beverage products. The company Fresh Dairy division (56% of revenue) offers yogurts, fermented dairy products, and other specialty fresh dairy products under the Activia, Oikos, Actimel brands and others. Its Water division (17% of revenue) offers packaged natural, flavored, and vitamin-enriched waters under brands like Evian and Bonafont and others. The company’s Baby Nutrition division (20% of revenue) produces and distributes specialized food for babies and young children to complement breast-feeding, as well as solid foods for babies under its main brand: Nutrilon. Finally, the Medical Nutrition division (6% of revenue) provides specialized food for people receiving medical treatment, babies afflicted with certain illnesses, and frail elderly people. Danone was founded in 1899 and it is based in Paris, France.
Recommendation As a result of their exposure to some of the fastest-growing categories in consumer staples, Danone’s portfolio has grown 9% over the past three years; which is well ahead of the other European players in the food industry (around 6% for Nestle and Unilever). Its three main divisions – Baby Nutrition, Waters and Fresh Dairy- are three of the four fastest growing categories in the Food & Beverage industry. In addition to this favorable exposure, Danone’s ability to earn and maintain shelf space at groceries, convenience stores and other retailer outlets play an important role in delivering consistent profitable results. The company enjoys leading market positions in the majority of the categories and geographies in which they compete (e.g. leaders in fresh dairy in Russia, Brazil, and Canada as well as leaders in waters in the U.K., Mexico and Argentina). Another strong competitive advantage comes from Danone’s strong brands that allow the company to successfully introduce new products to market and quickly get consumer acceptance; this has also allowed it to increase its market share and shelf space in existing retailers as well as grow into new channels of distribution. Danone continues to strengthen in emerging markets where it achieved 53% of sales in 2012 and has been exposed to 14% underlying market growth over the last three years. In addition to that and contrary to most of its competitors which are not seeing any growth on developed markets, Danone’s categories managed to grow by 2.4% in the past three years in these markets. Because of these reasons, it is recommended that Danone is added to the AIM International portfolio at a target price of $19.09, representing an upside of 21.51%. The company offers a dividend yield of 2.53%.
Investment Thesis Strategic M&A’s. The company has made four acquisitions per year on average since 2009, which have contributed an average of 3% to annual revenue growth. The company looks for companies that allow it to expand into new markets, that are accretive to growth, and that have strong brand recognition. Therefore, the company can take advantage of cross selling opportunities by either leveraging Danone’s existing distribution network and brand recognition, or by using the newly acquired company’s competitive advantage (e.g. local presence, brand). Recently, Danone acquired YoCrunch, the U.S. market leader for yogurt with flavored toppings. This company has had double-digit growth in recent years and it is expected that this acquisition
Price ($): 9/16/13 14.98 Beta: 0.95 FY: Dec 2012 A 2013 E 2014 E Price Target ($): 19.09 WACC: 9.53% Revenue ($mil) 27,129.70 30,923.81 33,573.43 52 WK H-L ($): 11.78- 17.12 M-Term Rev Gr. Rate Est: 7.7% % Growth 40% 14% 9% Market Cap (mil): 43,970 M-Term EPS Fr. Rate Est: 9.1% Gross Margin 50% 51% 51% Float (mil): 2,930,465 Debt/Equity: 81.96% Operating Margin 13% 15% 16% Short Interest (k): 112.4k ROA (ttm): 5.95% EPS (Cal) 0.74A 0.82E 0.99E Ave Daily Vol (K): 580,323 ROE (ttm): 15.93% FCF/Share 0.94 $ 0.91 $ 1.08 $ Dividends ($): 0.38 P/E (Cal) 19.8 17.9 16.8 Yield (%): 2.53% EV/EBITDA 11.43x 10.28x 8.84x
Marquette University AIM Class 2014 Equity Reports Fall 2013 Page 9
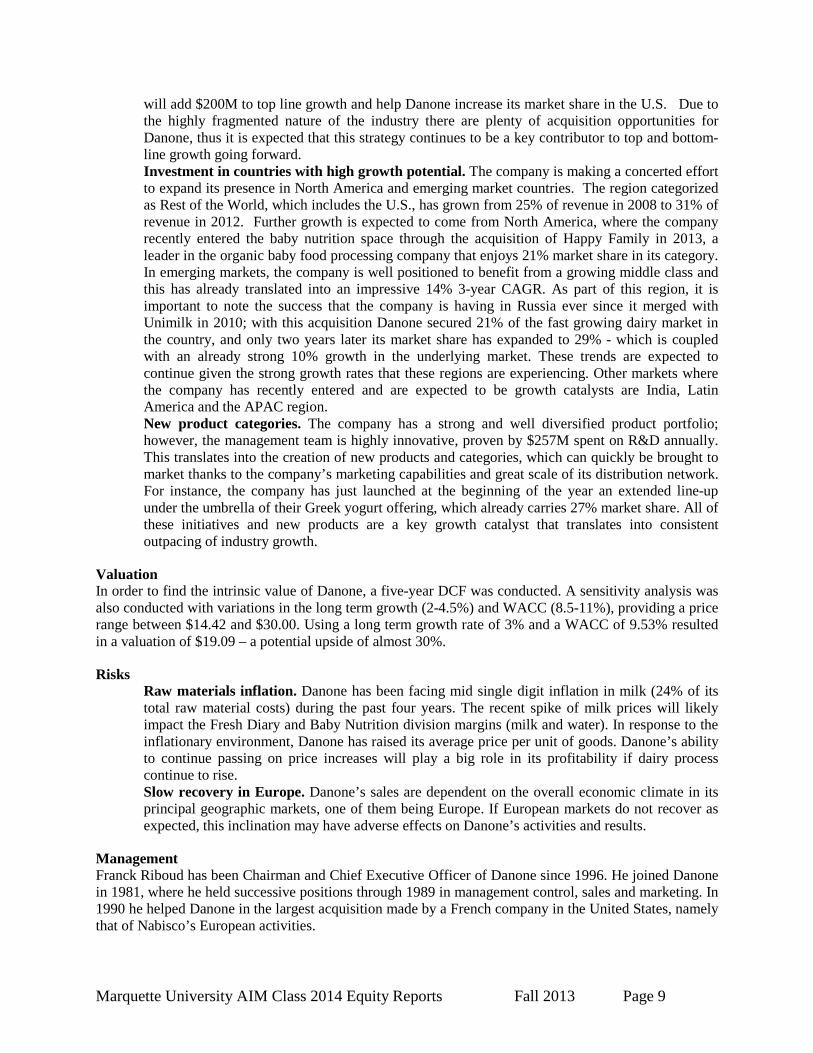
will add $200M to top line growth and help Danone increase its market share in the U.S. Due to the highly fragmented nature of the industry there are plenty of acquisition opportunities for Danone, thus it is expected that this strategy continues to be a key contributor to top and bottom-line growth going forward. Investment in countries with high growth potential. The company is making a concerted effort to expand its presence in North America and emerging market countries. The region categorized as Rest of the World, which includes the U.S., has grown from 25% of revenue in 2008 to 31% of revenue in 2012. Further growth is expected to come from North America, where the company recently entered the baby nutrition space through the acquisition of Happy Family in 2013, a leader in the organic baby food processing company that enjoys 21% market share in its category. In emerging markets, the company is well positioned to benefit from a growing middle class and this has already translated into an impressive 14% 3-year CAGR. As part of this region, it is important to note the success that the company is having in Russia ever since it merged with Unimilk in 2010; with this acquisition Danone secured 21% of the fast growing dairy market in the country, and only two years later its market share has expanded to 29% - which is coupled with an already strong 10% growth in the underlying market. These trends are expected to continue given the strong growth rates that these regions are experiencing. Other markets where the company has recently entered and are expected to be growth catalysts are India, Latin America and the APAC region. New product categories. The company has a strong and well diversified product portfolio; however, the management team is highly innovative, proven by $257M spent on R&D annually. This translates into the creation of new products and categories, which can quickly be brought to market thanks to the company’s marketing capabilities and great scale of its distribution network. For instance, the company has just launched at the beginning of the year an extended line-up under the umbrella of their Greek yogurt offering, which already carries 27% market share. All of these initiatives and new products are a key growth catalyst that translates into consistent outpacing of industry growth.
Valuation In order to find the intrinsic value of Danone, a five-year DCF was conducted. A sensitivity analysis was also conducted with variations in the long term growth (2-4.5%) and WACC (8.5-11%), providing a price range between $14.42 and $30.00. Using a long term growth rate of 3% and a WACC of 9.53% resulted in a valuation of $19.09 – a potential upside of almost 30%.
Risks Raw materials inflation. Danone has been facing mid single digit inflation in milk (24% of its total raw material costs) during the past four years. The recent spike of milk prices will likely impact the Fresh Diary and Baby Nutrition division margins (milk and water). In response to the inflationary environment, Danone has raised its average price per unit of goods. Danone’s ability to continue passing on price increases will play a big role in its profitability if dairy process continue to rise. Slow recovery in Europe. Danone’s sales are dependent on the overall economic climate in its principal geographic markets, one of them being Europe. If European markets do not recover as expected, this inclination may have adverse effects on Danone’s activities and results.
Management Franck Riboud has been Chairman and Chief Executive Officer of Danone since 1996. He joined Danone in 1981, where he held successive positions through 1989 in management control, sales and marketing. In 1990 he helped Danone in the largest acquisition made by a French company in the United States, namely that of Nabisco’s European activities.

Marquette University AIM Class 2014 Equity Reports Fall 2013 Page 10
Ownership % of Shares Held by All Insider and 5% Owners: 0.04% % of Shares Held by Institutional & Mutual Fund Owners 45.30%
Source: Bloomberg
Top 5 Shareholders
Holder Shares Out%
Sun Life Financial 51,111,000 8.81%
Groupe Danone 44,043,800 6.98%
Amundi S.A. 20,065,800 3.18%
Eurozeo 16,406,000 2.60%
Norges Bank 15,017,800 2.38%
Source: Bloomberg

Marquette University AIM Class 2014 Equity Reports Fall 2013 Page 11
Hanger, Inc. (HGR) September 20, 2013
Charlie Hoover Healthcare Hanger, Inc. (NYSE: HGR) is the world’s premier provider of orthotic and prosthetic (O&P) patient care services. The firm is a professional practice management company focused on the orthotic and prosthetic of the orthopedic rehabilitation industry. In essence, HGR acquires and operates O&P businesses throughout the United States, as well as manufactures O&P devices. Headquartered in Austin, Texas, the firm employs approximately 25% of the nation’s O&P professionals providing services to over 650,000 patients per year in more than 600 patient care centers in the country.
Recommendation Hanger, Inc. is the world’s premier provider of products and services that enhance human capabilities. Built on the legacy of James Edward Hanger, the first amputee of the American Civil War, Hanger is steeped in 150 years of clinical excellence and innovation. The firm operates in over 740 O&P patient care clinics located in 45 states, with six strategically located distribution facilities. Each year, approximately $4.3B is spent in the United States for O&P products and services, of which HGR currently accounts for 19%, a percentage that has been steadily increasing over the years. Additionally, HGR has concentrated their business strategy on acquiring new businesses to increase their market share, in order to control a larger portion of this $4.3B. No competitor (Pharmerica, Omnicare, Catamaran, Owens & Minor) currently accounts for more than 2% of the country’s O&P revenues other than HGR, which is why the continuation of acquisitions in this market is essential. The company operates three main business segments consisting of their patient care segment, their distribution segment, and their therapeutic solutions segment. As of 2012, these segments represent 82.5%, 10.9%, and 6.6% respectively of total revenue. The rapidly improving technology that is unable to be matched by competition suggest steady revenue growth for the patient care segment at approximately 7% annually, which will continue to be a significant driver for the firm. Because of these reasons and a favorable valuation, it is recommended that HGR be added to the AIM Equity Fund with a target price of $40.78, which offers a potential upside of 31.05%. The firm does not pay a dividend. Investment Thesis
• Recent Acquisitions. The firm has a strong history of successful integration of small and medium sized O&P business acquisitions, including 115 businesses since 1997, representing over 310 patient care clinics. Specifically, HGR acquired 18 O&P companies operating 59 patient care clinics in 17 states in 2012. The aggregate purchase price of these acquisitions was $83.1M. Management strategically selects these acquisitions based on location, quality of practitioners, and efficient product/service mix. The firm’s strong cash position allows for the continuation of acquisitions moving forward, which has become a successful strategy in accessing new markets and growing their presense in the O&P products and services.
• Patient Care Business Segment. This segment represents the largest segment of HGR’s business. The patient care clinics provide services to design and fit O&P devices to patients.
Marquette University AIM Class 2014 Equity Reports Fall 2013 Page 12
Superior offerings coupled with unmatched technology among competitors ensure steady revenue generation that is expected to continue moving forward at approximately 7% annually. Of the three departments of business in which HGR operates, 82.5% of their total revenue as of year end 2012 originates from patient care. This percentage has been relatively consistent historically with the percentage of total revenue represented in 2011 by patient care at 82.1%, and 87.5% in 2010.
• High-Margin Accelerated Care Plus (“ACP”). HGR acquired ACP in December 2010 for $157.8M in cash. The Reno, Nevada based company is the nation’s leading provider of integrated clinical programs for sub-acute and long-term care (“LTC”) rehabilitation providers, serving over 4,550 LTC facilities nationwide, including 21 of the top 25 national providers. The acquisition combined two industry leaders in adjacent healthcare businesses and provided a platform for future growth and diversification of HGR’s revenue base. ACP has seen dramatic increases in medical technology in recent years, commonly used by professional and college sports teams to accelerate recovery and increase performance. Such technological increases are projected to have direct impact on delivering higher returns by approximately 2% annually moving forward.
Valuation In order to reach an intrinsic value for HGR, a ten year discounted cash flow model was conducted. Using a terminal growth rate of 3% and a WACC of 10.04% resulted in a valuation of $47.00. Sensitivity analysis provided for a range between $40.29 and $59.62. Additionally, relative valuations using P/E and EV/EBITDA ratios were utilized. After calculating respective multiples, estimated P/E and EV/EBITDA values were $35.25 and $38.03, respectively. The total valuation of the firm was calculated by a weighted average of three projections. First, the intrinsic value, $47.00 was weighted by 40%. Second, the EV/EBITDA valuation of $38.03 was weighted by 30%. Finally, HGR’s P/E multiple valuation of $35.25 was weighted by 30% - resulting in an overall price target of $40.78 – a 30%+ upside. Risks
• Change in Government Reimbursement Levels. Should the government decide to alter current reimbursement levels, the firm may experience adverse affects to net sales, cash flows and profitability. HGR derived 40.6% and 41.3% of net sales for the six months ended June 30, 2013 and 2012 respectively, from reimbursements for O&P servies and products from programs administered by Medicare, Medicaid and the U.S. Department of Veteran’s Affairs. If any of these reimbursement levels declined, net sales, cash flows and profitability would have significant change of declining.
• Substantial Debt. As of June 30, 2013, the firm had approximately $504.5 million of total indebtedness and $55.0 million borrowed under their Revolving Credit Facility. This substantial indebtedness could impair the firm’s financial condition and their ability to fulfill obligations under their indebtedness. This risk exposes HGR to the risk of increased interest rates with respect to that portion of debt with a variable rate of interest.
• Potential for Healthcare Reform. Various healthcare reform measures have been enacted into law in recent years, including the Patient Protection and Afforable Care Act adopted in March of 2010. Over time, these reforms could significantly change the way healthcare, including O&P services and products, are obtained and paid for in the United States. These reforms are meant to increase access to and reduce costs of healthcare, which may adversely affect the firm’s net sales, cash flows and profitability.
Management Vinit Asar, who joined HGR in 2008, is the President and CEO. George McHenry joined HGR in 2001 as the Executive VP and CFO, where he remains today. Richmond Taylor is the President and COO of Hanger, Inc. He came from a competitor, Novacare, and joined HGR in 2012 as Executive VP and COO until June of 2012, where he assumed his current position.
Marquette University AIM Class 2014 Equity Reports Fall 2013 Page 13

Marquette University AIM Class 2014 Equity Reports Fall 2013 Page 14
Suncor Energy Inc. (SU) September 20, 2013
Zac Zhuang International Energy Suncor Energy Inc. (NYSE:SU) is an integrated energy company founded in 1919, focused on developing the Athabasca oil sands basin. It is one of the largest independent energy companies in the world and the fifth largest in North America. The company holds the largest position in oil sands. Near Fort McMurray, Alberta, Suncor recovers bitumen from oil sands through its mining and in situ operations. The bitumen from operations is upgraded to refinery-ready feedstock and diesel fuel. In 1967, Suncor pioneered the commercial development of Canada’s oil sands—one of the largest petroleum resources basins in the world. Suncor explores, develops and produces conventional oil and natural gas in western Canada, across the East Coast of Canada and internationally, both onshore and offshore. SU markets its refined products to customers across Canada and in Colorado. It also invests in clean and renewable energy sources. Suncor is headquartered in Calgary, Canada. Price ($): (9/13/13) $36.15 Beta: 1.37 FY: Dec. 31 2012A 2013E 2014EPrice Target ($): 43.20 WACC 10.29% Revenue (Mil) $38,235 $39,833 $42,87252 WK H-L ($): $36.35-$26.83 M-Term Rev. Gr Rate Est: 6.52% % Growth -1.41% 4.18% 7.63%Market Cap (mil): 54,369.6 M-Term EPS Gr Rate Est: 3.24% Gross Margin 36.57% 44.58% 41.54%Float (mil): 1,499.8 Debt/Equity 28.1% Operating Margin 12.18% 20.61% 17.57%Short Interest (%): 0.6% ROA: 5.54% EPS (Cal) 3.14 3.38 3.15Avg. Daily Vol (mil): 4.075 ROE: 7.02% FCF/Share 1.22 1.80 1.78Dividend ($): $0.50 P/E (Cal) 11.5x 12.8x 13.7xYield (%): 1.9% EV/EBITDA 5.5x 4.9x 5.1x Recommendation As an integrated oil company, Suncor’s upstream portfolio has shifted from a 100% oil sands focus to one considerably more diverse in nature with its E&P business (proportion of oil sands at 59% in 2012), which provides portfolio diversity that helps balance against higher cost oil sands production. Approximately 80% of Canada’s oil sands must be tapped using in situ production. The company offers a well-positioned production growth from a deep oil sands resources base, less volatile cash generation without heavily impacted by fluctuating crude oil price environment. Suncor is favorably positioned to deliver consistent volume growth in oil sands at 8% over the next several years. The 6.9 billion barrels of proved and probable reserves can be used to ensure production for more than 34 years at existing rates. From an asset standpoint, SU is one of the few companies in which onshore North American production is naturally hedged with a significant downstream segment. The well-diversified business model allows Suncor to capture global prices for 93% of its output. Suncor has been systematically laying a strong foundation for profitable growth with a sharp focus on capital discipline. The company has successfully managed to fund planned capital spending entirely from cash flow generated from operations for three consecutive years. Given the company’s advantaged business model with a high level of integration and promising long-term production outlook, it is recommended that SU be added to the AIM International Fund with an upside of 17.9%. SU pays a dividend of $0.50 per share. Investment Thesis
• Oil Sands operations set to unlock production. Suncor is pursuing optimization and debottlenecking activities designed to boost production by 100,000 bbl/d of oil sands production over the next five years. Long-term oil and gas production growth is expected to be maintained at 8% per year, compared to major oil average growth of 3.1%. Suncor is the only oil sands producer with integrated mining and in situ bitumen production. The company optimizes bitumen supply to its upgraders from multiple sources and produces their own diluents and bitumen blends right on site. It provides Suncor the opportunity to blend at optimal level in order to maximize netbacks based on market conditions.
Marquette University AIM Class 2014 Equity Reports Fall 2013 Page 15
• Ample access to the market. Oil production in western Canada is expected to double by 2030 from the current level of 3 million barrels a day. Given the limited capacity of pipelines due to delay of contentious projects like Keystone XL, railroads have been jumping into the business—with amounts shipped almost tripling in the past two years. Other pipelines combine with rail to boost excess export capacity by 800,000 barrels a day into 2018 even without Keystone XL. The pattern is playing out across North American, as investments in rail infrastructure give rise to a formidable transportation alternative replacing the demand of pipeline. SU is in the process of constructing rail uploading facilities, with the ability of bring 10,000 to 15,000 barrels per day by year-end 2013.
• Advantaged integrated business model at downstream. Opportunities in the company’s downstream operations have been overlooked by some investors. Suncor’s integrated model strengthens the long-term investment case buffering cash flow generation even in a volatile environment of commodity prices. Suncor’s refining & marketing net earnings per barrel of installed capacity has ranked the first among major competitors for three years consecutively. The Montreal refinery with a current capacity of 137,000 barrels per day has the potential to run discounted inland crudes, which may lead to a substantial increase in margin generation and refining earnings.
Valuation In order to reach an intrinsic value for SU, a five year discounted cash flow model was conducted. Using a terminal growth rate of 4% and a WACC of 10.29%, a price target of $39.71 was obtained. A NAV model was built by using Suncor’s gross proved and probably reserve base, a price target of $42 was achieved. Additionally, two multiple approach valuations by using EV/DACF and EV/EBITDA were conducted; price targets of $43.34 and $47.75 were obtained respectively. By weighing all of the valuation models 25% each, a price target of $43.20 was established. The price target represents a 19.5% upside. Risks
• Fluctuation of commodity price. The most significant risk to Suncor is volatility in crude oil and natural gas prices. The production projection and valuation of oil and gas assets is subject to risk with respect to production rates and expected recovery factors. As global economies remain challenged over the next couple years, outlook of worldwide oil consumption remains sluggish. Surging oil supply in North America driven by the shale oil revolution as well as rising oil sands production may drive price down. Adding to the problem is the potential lower demand of energy due to continual sluggishness in Europe as well as lower-than-expected growth in China.
• Volatility in refining earnings under FIFO inventory accounting. Different from Suncor’s U.S. based competitors, SU accounts for inventories under FIFO, which enhances its exposure to the volatility of refining margins relative to trends implied by market fluctuations in crack spreads.
Management Along with Suncor’s disciplined approach to maximize shareholder returns, SU’s management has delivered on its promises with an annual shareholder return of more than 30% since the company became publicly traded in 1992. With more than 35 years of international energy industry experience, Steve Williams has worked as the chief executive officer since 2012. Mr. Williams started his career at Suncor in May 2002, served as executive vice president and chief operating officer. The chief financial officer of Suncor is Bart Demosky, whose career with Suncor began in 2006. Mr. Demosky has over 25 years of industry experience in strategy and development, finance, risk management and energy supply and trading.
Marquette University AIM Class 2014 Equity Reports Fall 2013 Page 16
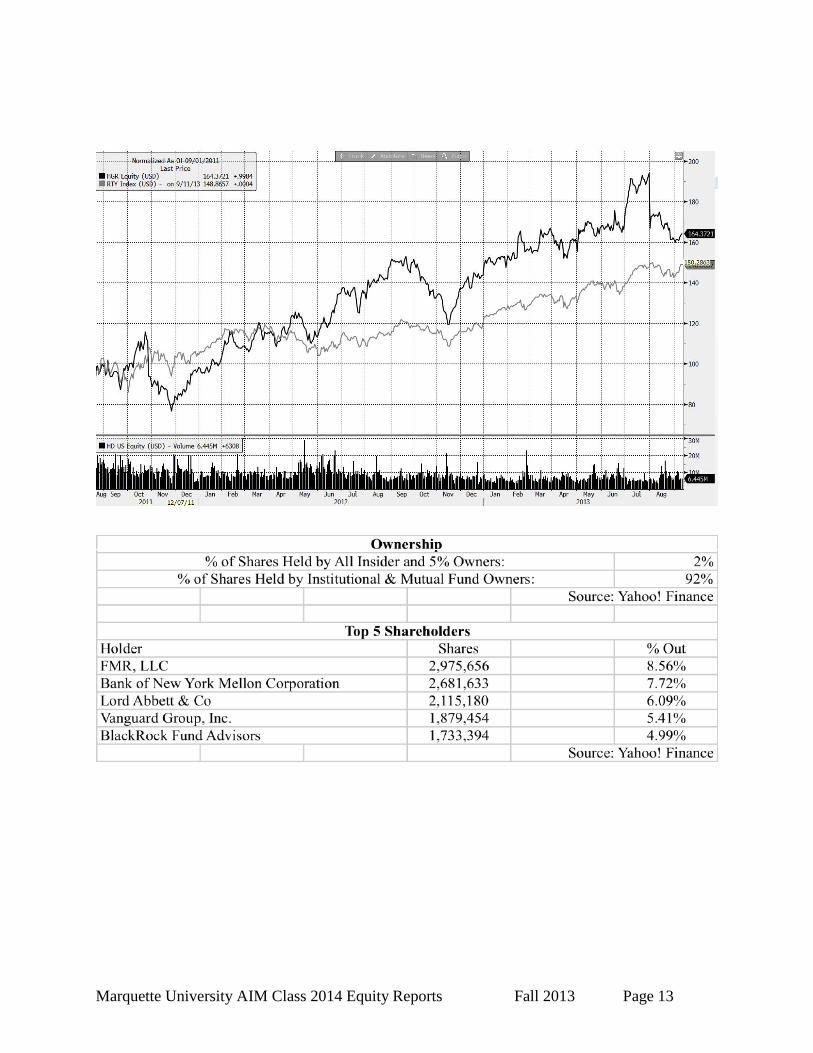
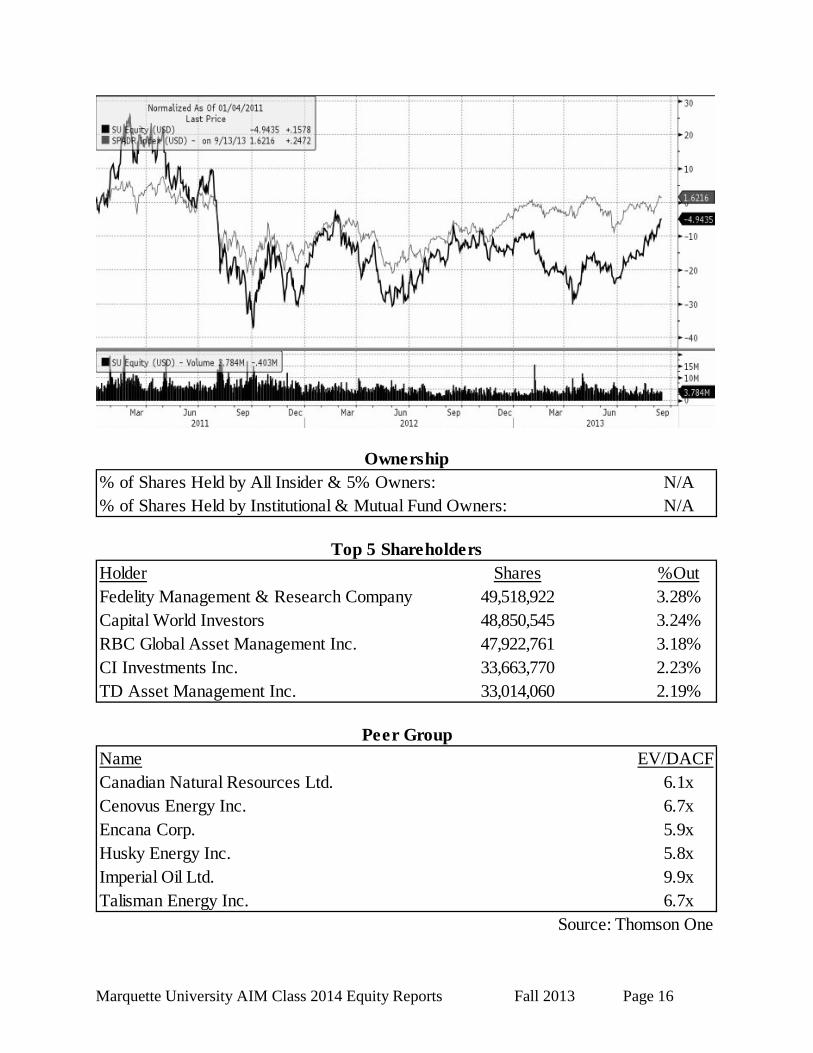
% of Shares Held by All Insider & 5% Owners: N/A% of Shares Held by Institutional & Mutual Fund Owners: N/A
Ownership
Holder Shares %OutFedelity Management & Research Company 49,518,922 3.28%Capital World Investors 48,850,545 3.24%RBC Global Asset Management Inc. 47,922,761 3.18%CI Investments Inc. 33,663,770 2.23%TD Asset Management Inc. 33,014,060 2.19%
Top 5 Shareholders
Name EV/DACFCanadian Natural Resources Ltd. 6.1xCenovus Energy Inc. 6.7xEncana Corp. 5.9xHusky Energy Inc. 5.8xImperial Oil Ltd. 9.9xTalisman Energy Inc. 6.7x
Source: Thomson One
Peer Group