Applications of On-chip Trace on Debugging Embedded Processor
16
Applications of On-chip Trace on Debugging Embedded Processor Xiao Hu and Shuming Chen Geum-Seo Koo 2009. 1. 13.(Tue.) GNU OS Lab.
-
Upload
brooke-fowler -
Category
Documents
-
view
50 -
download
6
description
Applications of On-chip Trace on Debugging Embedded Processor. Xiao Hu and Shuming Chen Geum-Seo Koo 2009. 1. 13.(Tue.) GNU OS Lab. Introduction#1. Debug Techniques Software simulator A debug tool with low cost Make modeling real systems imprecisely Breakoints and single stepping - PowerPoint PPT Presentation
Transcript of Applications of On-chip Trace on Debugging Embedded Processor

Applications of On-chip Trace on Debugging Embedded Processor
Xiao Hu and Shuming Chen
Geum-Seo Koo2009. 1. 13.(Tue.)
GNU OS Lab.

2
Introduction#1 Debug Techniques
Software simulator A debug tool with low cost Make modeling real systems imprecisely
Breakoints and single stepping Change software behavior in the real-time systems Hard to be watched using traditional debug techniques
Logic analyzers Do not change software behavior Now buried in silicon

3
Introduction#2 Software instruments and profiling
Intrusive and comsumes excessive system resources S/W behavior in real-time may be changed by the instructions added
On-chip trace technique Non-intrusively record real-time information The key issues: what information should be recored, how to
compress, transfer and store trace daa, how to apply trace information

4
Debug Techniques
Debug:Get processorBehavior
EmulationReal Chip
On Chip
On-chip hardwareNo Software modified
Simulation
Out ChipLoginAnalyzer
Profiller/monitorSoftware modified
Break Point/Single StepIntrusive
TraceNon-intrusive
Relatioinships of debug techniques

5
YHFP-QDSP Heterogeneous multiprocessor SoC integrated a commercial
RISC core and four DSP cores
The development tools Include On-chip debug hardware Emulators with I/O ports of the enhanced JTAG or the host
processor interface Software simulators IDE with graphic interfaces
TraceDo

6
TraceDo System
Structure of TraceDo.
YHFT-QDSP
RISC core
DSC core
DSP core
DSP core
DSP core
TraceModule
TraceModule
TraceModule
TraceModule
TracePort
DRAM
Emulator
TimeStamp
24bitscounter
TraceAnalyzer
IDE
Debug Host PC
TraceDo- Trace for Debug and Optimization- Modular and scalable

7
Functions and Advantages On-chip trace H/W
Records program path(path trace) Data access(data trace) Peripheral events(event trace) Compress
Emulator Receive trace message Attaches out-chip timestamps
Trace analyzer Decompresses and analyzes trace messages

8
The Message Format of TeaceDo
Various lengths aligned on byte boundaries Compresses values of address and data in the XOR scheme
Avoiding transferring the redundancy high bytes LS encoder
Compressing results of conditional direct branches by bit mapping and length encoding
1st Byte 2nd Byte
(option)...
Last Byte
(option)
HeaderF
bitData Sect
F
bitData Sect ... Data Sect
Message structure of TraceDo
Header: message typeF(Follow bit)=1: no following byteData Sect: message data

9
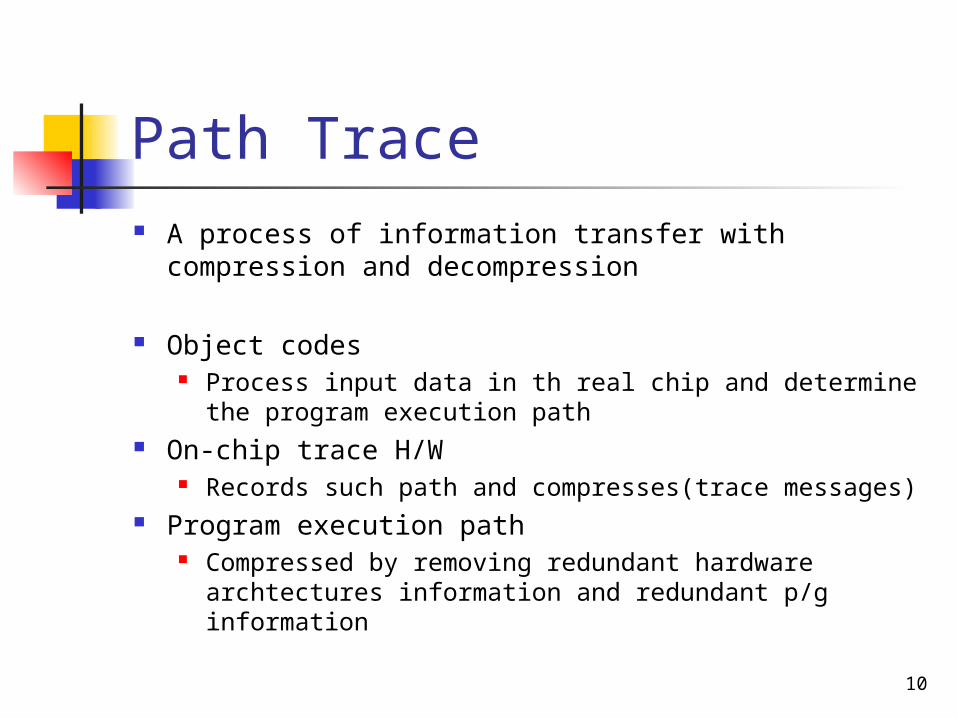
Mechanism of Path Trace
10
Path Trace A process of information transfer with compression and
decompression
Object codes Process input data in th real chip and determine the program
execution path On-chip trace H/W
Records such path and compresses(trace messages) Program execution path
Compressed by removing redundant hardware archtectures information and redundant p/g information
11
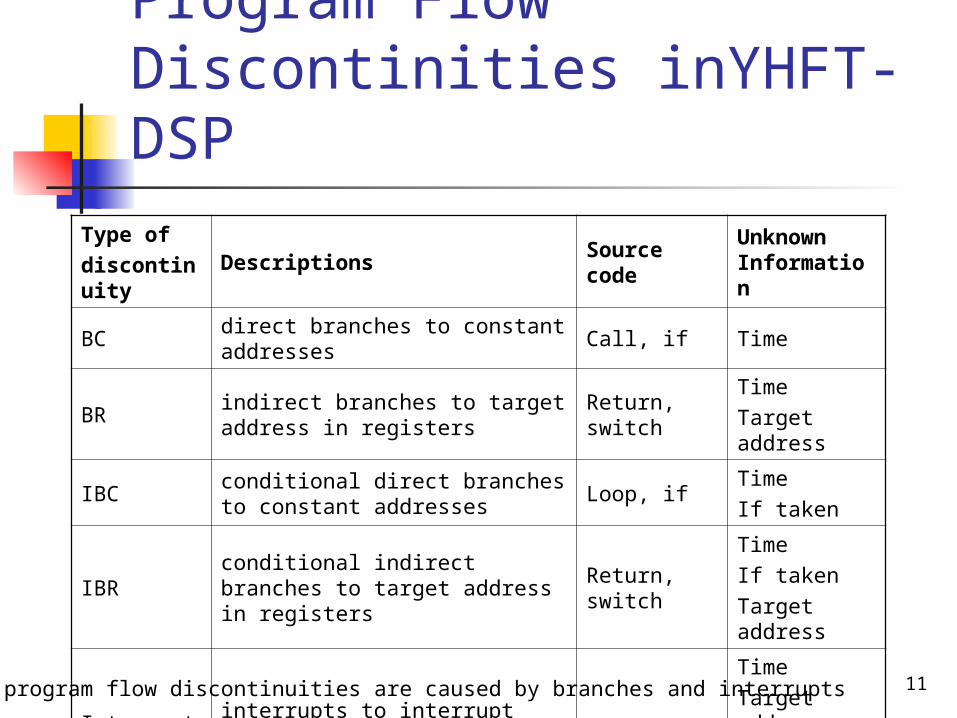
Program Flow Discontinities inYHFT-DSP
Type of
discontinuityDescriptions Source code
Unknown Information
BC direct branches to constant addresses Call, if Time
BRindirect branches to target address in registers
Return, switchTime
Target address
IBCconditional direct branches to constant addresses
Loop, ifTime
If taken
IBRconditional indirect branches to target address in registers
Return, switch
Time
If taken
Target address
Interrupt interrupts to interrupt service routine -
Time
Target address
Taken address
* The program flow discontinuities are caused by branches and interrupts

12
Trace Application The main applications of on-chip trace
Path-based optimization Instruction memory optimization Debug Testing Software complexity criteria and program understanding Data trace

13
Debug using TraceDo The migration of an image recognitions program to YHFT-
QDSP When usging Bp & ss -> Give the whole hierarchy execution path
and the execution time of each function When multicores work thgether -> Run-time execution
informations of muticores are acquired without terminating the system running
When instructions insert -> much avoided by usging TraceDo

14
Optimization using TraceDo
A section of program execution path
An application example of the JPEG encoder running in on DSP core is used for optimization

15
Ratios of Execution Time
The total execution time of the JPEG application is reduced by 7.2%
Replaced by DMA operations
Optimized by code layout for avoiding instruction cache conflicts
(Optimized in assemble language
data layout: reducing data cache conflict miss
PStall: pipeline stall for fetching instructionDStall: pipeline stall for fetching data

16
Conclusion The non-intrusive debug of embedded software is a hard problem
On-chip trace Non-intrusive debug technieuq without software modificatoin Suitable for debug and optimization Applications: debug, testing, codes optimization and program
understanding etc.


![[CB16] COFI break – Breaking exploits with Processor trace and Practical control flow integrity by Ron Shina & Shlomi Oberman](https://static.fdocuments.in/doc/165x107/587756e61a28ab84388b77d5/cb16-cofi-break-breaking-exploits-with-processor-trace-and-practical.jpg)