Applications of Digital Microfluidics for the Extraction ...¨re... · Applications of Digital...
131
Applications of Digital Microfluidics for the Extraction and Analysis of Small Molecules from Solid Samples by Nelson Mario Lafrenière A thesis submitted in conformity with the requirements for the degree of Doctor of Philosophy – Analytical Chemistry Department of Chemistry University of Toronto © Copyright by Nelson Mario Lafrenière (2015)
Transcript of Applications of Digital Microfluidics for the Extraction ...¨re... · Applications of Digital...

Applications of Digital Microfluidics for the Extraction and Analysis of Small Molecules from Solid Samples
by
Nelson Mario Lafrenière
A thesis submitted in conformity with the requirements for the degree of Doctor of Philosophy – Analytical Chemistry
Department of Chemistry University of Toronto
© Copyright by Nelson Mario Lafrenière (2015)
ii
Applications of Digital Microfluidics for the Extraction and Analysis
of Small Molecules from Solid Samples
Nelson Mario Lafrenière
Doctor of Philosophy – Analytical Chemistry
Department of Chemistry
University of Toronto
2015
Abstract
Digital microfluidics (DMF) has emerged as a valuable technology that may be useful in the goal
of realizing true lab-on-a-chip (LOC) or total micro analysis systems (µTAS). DMF is a
relatively new microscale liquid-handling technique in which droplets of fluid are manipulated
on a flat, two-dimensional array of electrodes coated with a hydrophobic insulator. Droplet
movement is driven by the application of electric potentials to successive electrodes, enabling a
droplet to be dispensed from a reservoir, merged, mixed and split. One of the strengths of DMF
when compared to channel microfluidics is the ease with which DMF can process solid samples,
and incorporate solid materials into sample preparation work-flows without the risk of clogging.
This thesis describes the exploration of digital microfluidics as a tool for working with solid
samples and matrices. Chapter two describes the first method useful for analyzing multiple
hormones in dried blood. This method broadens the scope and breadth of information available
from the analysis of dried blood spotted directly onto device. Chapter three describes the first
method for applying digital microfluidics towards the analysis of pharmaceuticals from blood
spotted onto filter paper – dried blood spots (DBS). The DMF method is compared to the
traditional macroscale method employed by collaborators at GlaxoSmithKline. Chapter four

iii
describes the first combination of DMF and miniature mass spectrometry (MS). This newly
developed, automated, multiplexed, and portable platform was designed for the extraction of
illicit drugs from dried urine, and is designed to replace the traditional two-tiered urine analysis
system with a one-tiered total analysis system. Chapter five describes a new method for on-chip
solvent optimization using a design of experiment. Using this system, C18-coated magnetic
beads were incorporated onto device, enabling the first instance of fractionation on a DMF
device. Finally, chapter six summarizes the principles and concepts derived from this work, and
concludes with a look forward to future applications of digital microfluidics as a tool to handle
solid samples and matrices.

iv
This thesis is dedicated to my parents, Mario and Suzanne, for their love, kindness and for giving
me every opportunity to succeed in life.
“Knowing how to think empowers you far beyond those
who know only what to think.”
– Neil deGrasse Tyson

v
Acknowledgments
Throughout my years at the University of Toronto, I have had the opportunity to meet and work
with some of the brightest people in the world. The process of writing my thesis has afforded me
the chance not only to reflect on my research, but on those who were with me throughout and
who contributed to my success and growth as a scientist and as a human being.
First and foremost I would like to acknowledge my supervisor Prof. Aaron R. Wheeler, without
whom I would not be the scientist I am today. His guidance and support throughout the years,
has been paramount to my success, and his genuine kindness and passion for his craft has
inspired me on more than one occasion. I would also like to thank Banting for cheering me up
when I needed it!
I would like to send a heartfelt thanks to the members of my supervisory committee, Prof.
Rebecca Jockusch and Prof. Ulrich Krull. I have often been humbled and awed by your depth of
knowledge and passion for science during annual committee meetings. Your input has been
invaluable and always insightful. I would also like to thank Prof. Kagan Kerman for serving on
my comprehensive oral exam committee. Special thanks to Prof. Lisa Holland and Prof. Bhushan
M. Kapur for serving as external examiners for this thesis defense.
I would also like to thank my undergraduate supervisor, Prof. James H. Watterson, for instilling
within me a passion for chemistry that I never knew I had. James helped guide me throughout
the transition to graduate school, and continued to support me throughout my graduate degree
offering advice whenever I asked. For that I will be forever grateful.
I would like to extend my sincere thanks to my collaborators, Dr. Neil Spooner and Paul Abu-
Rabie at GlaxoSmithKline, for their contributions to the dried blood spot project. I would also
like to extend my thanks to my collaborators from Purdue University, Dr. Paul I. Hendricks, Dr.
Jacob T. Shelley, Chris Pulliam, and Prof. R.G. Cooks for all their help on the dried urine spot
project.
To my friends and colleagues who I have had the pleasure of sharing the Wheeler lab with over
the last five years, to you I owe the vast majority of thanks. Particular thanks to Dr. Michael

vi
Watson and Dr. Mais J. Jebrail, for making me feel like part of the family when I first joined the
lab, and for the patience you demonstrated when showing me the ropes. I’d like to thank Jared
Mudrik for making the lab experience a more enjoyable one, and for inspiring me to lose some
weight! I would like to thank Dr. Andrew Paton and Dr. Lindsey Fiddes for helping me through
some difficult times, and for being the best gym buddies you can have. I’d like to thank Dr. Mark
Yang and Dr. Andrea E. Kirby for showing me how to use the mass spec, and to Andrea I owe
extra thanks, for working with me amazingly well and for participating in incessant singing of
Disney tunes. To Brendon Seale I thank for filling both the gap of morose elder-statesmen and
young go-getter, you have showed me that like a fine wine, a scientist can also age well. I would
like to thank Dr. Steve Shih for helping me get my first publication off the ground, for being Zen
when I was anything but, and for being my back-up when we got in trouble for being too loud.
To Alphonsus Ng, I thank for being constantly cheerful and for being willing to help at the drop
of a hat. To Michael Dryden I thank for being a constant source of both knowledge (be it related
to cooking, electronics, or anything really) and humour.
To the rest of the people I have had the pleasuring of sharing the Wheeler lab with over the
years: Chris Dixon, Ian Swyer, Sara Abdulwahab, Jihye Kim, Ryan Fobel, Christian Fobel,
Darius Rackus, Charis Lam, Uvaraj Uddayasankar, Dr. Ed Regan, Nooman Mufti, Jeremy
Wong, Yue “Alex” Yu, Dr. Kihwan Choi, Dr. Dean Chamberlain, Dr. Yan Gao, Dr. Irena
Barbulovic-Nad, Dr. Sam Au, Dr. Irwin Adam Eydelnant, Suthan Srigunapalan, Dr. Vivienne
Luk, Dr. Elizabeth Miller, Dr. Dario Bogojevic, Dr. Mahesh Sarvothaman, Dr. Mohtashim
Shamsi, Dr. Lorenzo Gutierrez, Dr. Noha Mousa – I thank for your friendship, kindness and
willingness to put up with me.
I would also like to thank Dr. Henry Lee and Yimin Zhou for their dedication to the Bahen clean
room; this work wouldn’t have been possible without proper maintenance of those facilities.
Last but certainly not least, I would like to thank my parents. They have given me everything; a
loving household, constant encouragement and every opportunity to succeed in life. There is
nothing I can do to repay them, except maybe not putting them in a home the first chance I get.

vii
Table of Contents
Acknowledgments ........................................................................................................................ v
Table of Contents ....................................................................................................................... vii
Overview of Chapters ................................................................................................................ xii
Overview of Author Contributions ........................................................................................... xiv
List of Tables .............................................................................................................................. xvi
List of Figures ........................................................................................................................... xvii
List of Abbreviations ................................................................................................................. xix
Chapter 1 Review of Digital Microfluidics for the Analysis of Small Molecules from Solid
Samples ........................................................................................................................................... 1
1.1 Digital Microfluidics ........................................................................................................ 1
1.2 Applications of Digital Microfluidics .............................................................................. 3
1.2.1 The Use of Solids in DMF Workflows ..................................................................... 4
1.3 Digital Microfluidics and Mass Spectrometry ............................................................... 11
1.3.1 Indirect off-line analysis ......................................................................................... 11
1.3.2 In-line analysis ........................................................................................................ 12
1.4 Conclusions .................................................................................................................... 13

viii
Chapter 2 Multiplexed Extraction and Quantitative Analysis of Pharmaceuticals from Dried
Blood Spot Samples using Digital Microfluidics ......................................................................... 15
2.1 Introduction .................................................................................................................... 16
2.2 Experimental .................................................................................................................. 18
2.2.1 Reagents and Materials ........................................................................................... 18
2.2.2 DMF Device Fabrication ........................................................................................ 20
2.2.3 DMF-nanoESI-MS interface ................................................................................... 21
2.2.4 DMF-Driven DBS Processing and Analysis........................................................... 21
2.2.5 Conventional DBS Processing and Analysis .......................................................... 22
2.3 Results and Discussion ................................................................................................... 25
2.3.1 Device and Test Candidates .................................................................................... 25
2.3.2 MS/MS Analysis and Optimization ........................................................................ 26
2.3.3 Quantitative Analysis .............................................................................................. 29
2.4 Conclusion ...................................................................................................................... 32
2.4.1 Future Perspective ................................................................................................... 33
Chapter 3 Analysis on the Go: Quantitation of Drugs of Abuse in Dried Urine with Digital
Microfluidics and Miniature Mass Spectrometry ......................................................................... 34
3.1 Introduction .................................................................................................................... 35
3.2 Experimental .................................................................................................................. 38
3.2.1 Reagents and Materials ........................................................................................... 38
3.2.2 DMF Device Fabrication, Assembly, and Operation .............................................. 38

ix
3.2.3 DMF-Driven Urine Extraction ................................................................................ 40
3.2.4 Conductivity Measurements ................................................................................... 40
3.2.5 Lab-Scale DMF-MS/MS Experiments ................................................................... 40
3.2.6 DMF-Mini-MS/MS Experiments............................................................................ 41
3.2.7 MS/MS Data Collection and Processing................................................................. 41
3.2.8 Dip-DMF-MS/MS Analysis ................................................................................... 42
3.3 Results and Discussion ................................................................................................... 43
3.3.1 Sample Processing .................................................................................................. 43
3.3.2 Quantitative Analysis .............................................................................................. 46
3.4 Conclusion ...................................................................................................................... 52
Chapter 4 Attractive Design: An Elution Solvent Optimization Platform for Magnetic-bead based
Fractionation using Digital Microfluidics and Design of Experiments ........................................ 53
4.1 Introduction .................................................................................................................... 54
4.2 Experimental .................................................................................................................. 56
4.2.1 Reagents and Materials ........................................................................................... 56
4.2.2 DMF Device Fabrication and Operation ................................................................. 56
4.2.3 Solid-Phase Extraction ............................................................................................ 57
4.2.4 Loading Capacity and Equilibrium Characterization ............................................. 58
4.2.5 On-Chip Solvent Composition ................................................................................ 59
4.2.6 Design of Experiments for Elution Solvent Optimization ...................................... 59

x
4.2.7 Evaluation of Extraction Efficiency ........................................................................ 60
4.2.8 Sample Fractionation .............................................................................................. 60
4.3 Results and Discussion ................................................................................................... 62
4.3.1 DMF-magnetic bead-SPE ....................................................................................... 62
4.3.2 Loading Capacity, Saturation, and Equilibrium ..................................................... 63
4.3.3 Elution Solvent Optimization ................................................................................. 65
4.3.4 Sample Fractionation .............................................................................................. 68
4.4 Conclusion ...................................................................................................................... 70
Chapter 5 Exploring the Utility of Digital Microfluidics for the Extraction of Multiple Hormones
from Blood and Tissue .................................................................................................................. 71
5.1 Introduction .................................................................................................................... 72
5.2 Experimental .................................................................................................................. 74
5.2.1 Materials and Methods ............................................................................................ 74
5.2.2 DMF Device Fabrication and Operation ................................................................. 75
5.2.3 Digital Microfluidic Hormone Extraction, Quantitation and Analysis ................... 78
5.3 Results and Discussion ................................................................................................... 81
5.3.1 Continuing work ..................................................................................................... 86
5.4 Conclusion ...................................................................................................................... 89

xi
Chapter 6 Concluding Remarks and Future Perspectives ............................................................. 90
6.1 Concluding Remarks ...................................................................................................... 90
6.2 Future Perspectives ........................................................................................................ 94
References ..................................................................................................................................... 97
xii
Overview of Chapters
This thesis describes various extraction protocols for the analysis of small molecules from a
variety of solid biological matrices using digital microfluidics (DMF) and direct infusion mass
spectrometry that I developed and used while working in the Wheeler Group at the University of
Toronto. The overall theme of this work has been illustrating the utility of DMF for the
extraction of small molecules from solid samples; each chapter is described in the following.
Chapter 1 provides a literature review of the relevant topics encountered during the course of the
projects described in the thesis. A detailed background and review of applications of DMF is
included, with special emphasis on extraction and analysis from solid samples.
Chapter 2 describes a method for the multiplexed quantitation of pharmaceuticals from dried
blood spots using digital microfluidics and direct-infusion MS/MS. This work involved the
adaptation of a protocol to DMF, and evaluation of the performance of the DMF method
compared to the gold standard method including LC-MS/MS.
Chapter 3 describes a method for quantifying drugs of abuse from dried urine samples using
DMF extraction integrated with pulled-glass capillary nanoESI emitters for MS analysis. This
fast, automated extraction protocol does not employ chromatography, and was used to quantify
cocaine, benzoylecgonine, and cocaine from dried urine with limits of detection suitable for
clinical and work-place screening purposes. In addition, we combined the DMF method with a
miniature MS system for analysis, representing the first step towards developing a fully-
integrated field-deployable system for on-site quantitation of drugs of abuse in urine and other
biological matrices.
Chapter 4 describes a solid phase extraction (SPE) method employing C18 functionalized
magnetic beads using DMF. This platform was used to develop a method for on-chip design of
experiments (DOEs) for solvent extraction optimization of unknown compounds on-chip. Using
this protocol, DOEs were performed for a small molecule (sitamaquine) and a peptide
(angiotensin I) to optimize elution solvent optimization for the SPE protocol. This represents the
first platform capable of automated solvent optimization, and the first instance of fractionation
performed using DMF.

xiii
Chapter 5 presents the first method capable of analyzing multiple hormones using DMF and MS.
Building from previous (qualitative) work with estradiol, this (quantitative) method enables the
analysis of three additional sex steroids, testosterone, androstenedione and progesterone. Also
presented is a brief summary of the current ongoing work related to the extraction and
quantitation of multiple hormones from core needle biopsies (CNB).
xiv
Overview of Author Contributions
During my time as a graduate student, I was fortunate to work with a number of collaborators in
and out of the Wheeler group, many of whom are co-authors on the journal papers that have been
published or are in review. Here I outline the contributions each person made towards the work
presented in this thesis.
Chapter 2 describes the extraction of pharmaceuticals from dried blood spots. Experimental
planning and execution, and manuscript preparation was primarily carried out by me. Steve C.C.
Shih built and operated the DMF device automation system and was present for most
experimental work. Paul Abu-Rabie, a scientist at GSK, prepared the dried blood samples and
performed the LC-MS/MS analysis for comparison with DMF. Mais Jebrail was involved in
collecting preliminary data. This work has been published in Bioanalysis (Lafrenière, N.M.;
Shih, S.C.C.; Abu-Rabie, P.; Jebrail, M.J.; Spooner, N.; Wheeler, A.R. "Multiplexed extraction
and quantitative analysis of pharmaceuticals from DBS samples using digital microfluidics"
Bioanalysis 2014, 6, 307-318).
Chapter 3 describes work that was performed in collaboration with Prof. R. Graham Cooks at
Purdue University in West Lafayette, Indiana, and features a DMF-based technique for the
extraction and quantitation of drugs of abuse form dried urine using nanoESI and a miniature
mass spectrometer. I worked closely with Dr. Andrea Kirby (a former graduate student at the
University of Toronto) in planning and executing all aspects of this work. Brendon Seale (a
graduate student at the University of Toronto) helped in the fabrication of devices and in some
experiments. The contributions of our collaborators Dr. Paul I. Hendricks (a former graduate
student at Purdue University) and Chris Pulliam (a graduate student at Purdue University)
included operation of the miniature mass spectrometer and interpretation of the results. This
work has been published in Analytical Chemistry, and I share first authorship with Dr. Andrea
Kirby. (Kirby, A.E.; Lafrenière, N.M.; Seale, B.; Hendricks, P.I.; Cooks, R.G.; Wheeler, A.R.
“Analysis on the Go: Quantitation of Drugs of Abuse in Dried Urine with Digital Microfluidics
and Miniature Mass Spectrometry” Analytical Chemistry, 2014, 86, 6121-6129).
Chapter 4 describes the first instance of SPE fractionation on-chip using C18 functionalized
magnetic beads on a DMF device, using an on-chip DOE for elution solvent optimization. I

xv
worked with Jared Mudrik (graduate student at the University of Toronto) in planning and
executing all aspects of this work. Alphonsus Ng (graduate student at the University of Toronto)
and I fabricated devices for this work, and Alphonsus provided valuable advice and assistance in
using the magnetic lens assembly. A special thanks to Dr. Neil Spooner who supplied
sitamaquine standards. A manuscript has been prepared for publication, and Jared and I will
share first authorship.
Chapter 5 describes the first instance of multiple hormone analysis using DMF for extraction
and MS for analysis, and represents incomplete work (that is currently in progress). The chapter
is divided into two sections. The first section describes work in which I performed all
experiments, wrote the text, and prepared the figures. This work was presented at the 92nd
Canadian Society of Chemistry Conference in 2011. (Lafrenière, N.M., Wheeler, A.R.
“Quantification of Hormones Extracted Via Digital Microfluidics”, 94th Canadian Chemistry
Conference and Exhibition (CSC). Montreal, PQ, Canada. June, 2011). The research presented in
the second section (labeled “continuing work”) was conducted by a team including me, Sara
Abdulwahab, Jihye Kim, and Johannes Hewel. New results are still being collected, and a
manuscript will be prepared to describe the results in the future. My main contributions to the
latter section were device fabrication, and assistance in using and applying DMF for extraction,
and in creating figures. Special thanks to Dr. Hala Gomaa and Dr. Robert R. Casper for the
collection of core need biopsy tissue samples used for analysis.
xvi
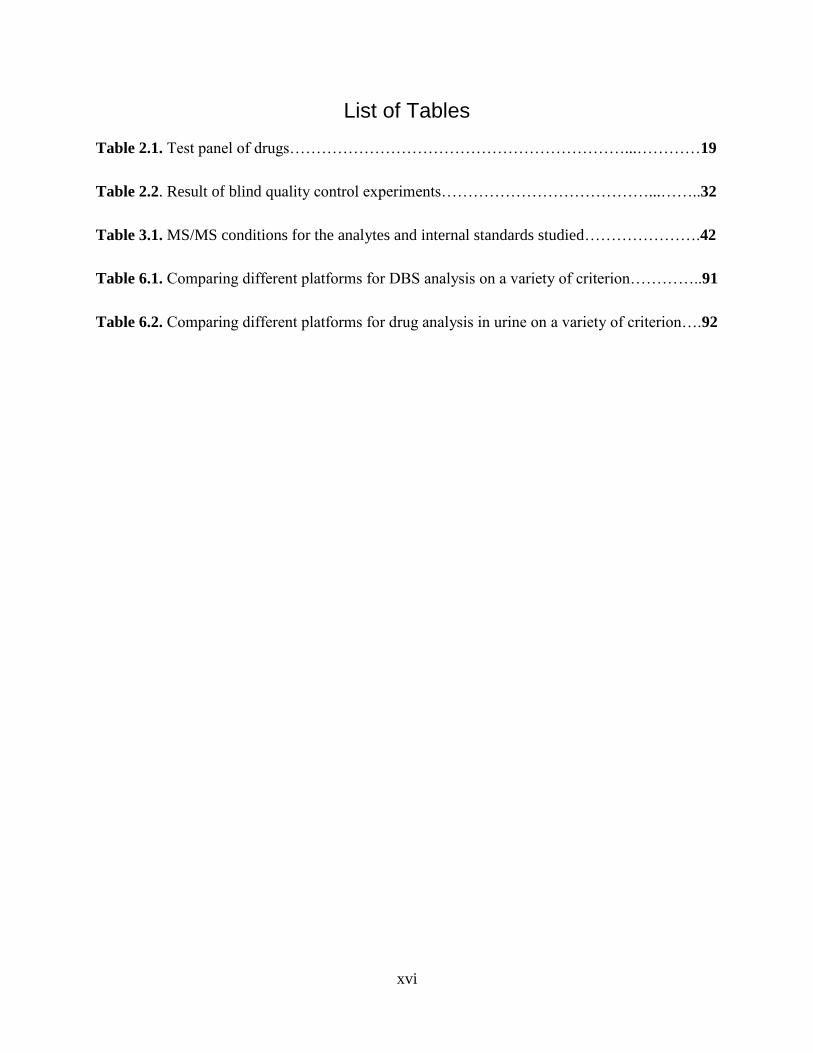
List of Tables
Table 2.1. Test panel of drugs………………………………………………………...…………19
Table 2.2. Result of blind quality control experiments…………………………………...……..32
Table 3.1. MS/MS conditions for the analytes and internal standards studied………………….42
Table 6.1. Comparing different platforms for DBS analysis on a variety of criterion…………..91
Table 6.2. Comparing different platforms for drug analysis in urine on a variety of criterion….92
xvii
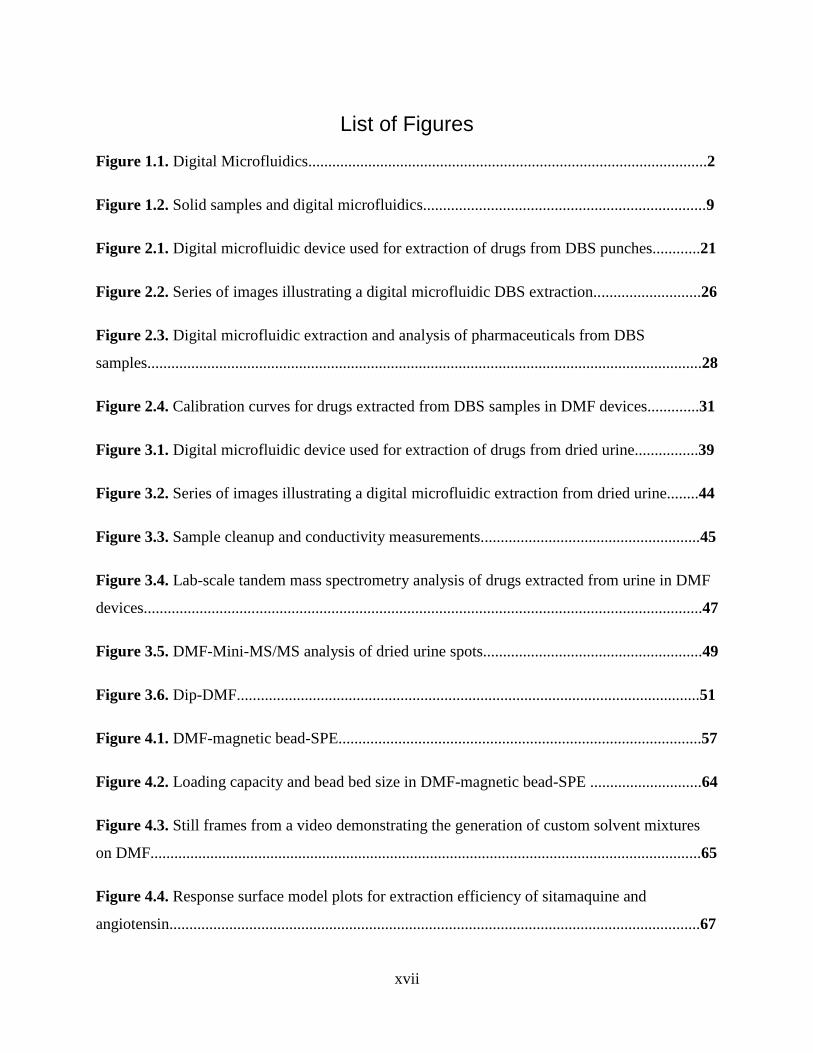
List of Figures
Figure 1.1. Digital Microfluidics....................................................................................................2
Figure 1.2. Solid samples and digital microfluidics.......................................................................9
Figure 2.1. Digital microfluidic device used for extraction of drugs from DBS punches............21
Figure 2.2. Series of images illustrating a digital microfluidic DBS extraction...........................26
Figure 2.3. Digital microfluidic extraction and analysis of pharmaceuticals from DBS
samples...........................................................................................................................................28
Figure 2.4. Calibration curves for drugs extracted from DBS samples in DMF devices.............31
Figure 3.1. Digital microfluidic device used for extraction of drugs from dried urine................39
Figure 3.2. Series of images illustrating a digital microfluidic extraction from dried urine........44
Figure 3.3. Sample cleanup and conductivity measurements.......................................................45
Figure 3.4. Lab-scale tandem mass spectrometry analysis of drugs extracted from urine in DMF
devices............................................................................................................................................47
Figure 3.5. DMF-Mini-MS/MS analysis of dried urine spots.......................................................49
Figure 3.6. Dip-DMF....................................................................................................................51
Figure 4.1. DMF-magnetic bead-SPE...........................................................................................57
Figure 4.2. Loading capacity and bead bed size in DMF-magnetic bead-SPE ............................64
Figure 4.3. Still frames from a video demonstrating the generation of custom solvent mixtures
on DMF..........................................................................................................................................65
Figure 4.4. Response surface model plots for extraction efficiency of sitamaquine and
angiotensin.....................................................................................................................................67

xviii
Figure 4.5. Solid phase extraction efficiencies measured for sitamaquine and angiotensin I using
C18 magnetic beads on DMF compared to identical extraction performed using c18
ZipTips®.........................................................................................................................................67
Figure 4.6. Fractionation of a mixture of sitamaquine and angiotensin I using DMF-magnetic
bead-SPE........................................................................................................................................68
Figure 5.1. Steroidogenesis...........................................................................................................73
Figure 5.2. Device I – digital microfluidic device used for extraction of hormones from dried
blood..............................................................................................................................................76
Figure 5.3. Device II – digital microfluidic device used for extraction of hormones from dried
tissue..............................................................................................................................................77
Figure 5.4. Series of images illustrating a digital microfluidic hormone extraction from dried
blood..............................................................................................................................................83
Figure 5.5. Schematic of alternate device I electrode configurations...........................................84
Figure 5.6. Analysis of hormones using DMF and direct-infusion MS........................................85
Figure 5.7. Scheme for the new DMF-LC-MS/MS method for extraction of hormones from core
needle biopsies (CNB)...................................................................................................................86
Figure 5.8. Digital microfluidic extraction from tissue samples...................................................87
Figure 5.9. Calibration curves for E2, AD, TS, and PG...............................................................88

xix
List of Abbreviations
3D Three Dimensional
AC Alternating Current
AD Androstenedione
AIT Aromatase Inhibitor Therapy
BZE Benzoylecgonine
CAD Collision Activated Dissociation
CNB Core Needle Biopsy
DBS Dried Blood Spot
DC Direct Current
DCM Dichloromethane
DESI Desorption Electrospray Ionization
DNA Deoxyribonucleic Acid
E2 Estradiol
ECTI Emerging Communications Technology Institute
ESI Electrospray Ionization
HPLC High Performance Liquid Chromatography
IgE Immunoglobulin E
IS Internal Standard
ITO Indium Tin Oxide

xx
kHz Kilohertz
kV Kilovolts
LTQ Linear Trap Quadrupole
LOC Lab-on-a-Chip
m/z Mass-to-Charge Ratio
MALDI Matrix-Assisted Laser Desorption/Ionization
MeOH Methanol
MRM Multiple Reaction Monitoring
MS Mass Spectrometry
MS/MS Tandem Mass Spectrometry
nanoESI Nanoelectrospray Ionization
PCR Polymerase Chain Reaction
PK Pharmacokinetic
PG Progesterone
PPM Porous Polymer Monolith
RNA Ribonucleic Acid
RSD Relative Standard Deviation
SAWN Surface Acoustic Wave Nebulization
SCX Strong Cation Exchange
SD Standard Deviation

xxi
SPE Solid Phase Extraction
SRM Selected Reaction Monitoring
TK Toxicokinetic
TNFC University of Toronto Nanofabrication Center
TS Testosterone
TSH Thyroid Stimulating Hormone
µg Microgram
µm Micrometer
µTAS Micro Total Analysis System
Vrms Root Mean Square Voltage

1
Chapter 1 Review of Digital Microfluidics for the Analysis of Small Molecules
from Solid Samples
1.1 Digital Microfluidics
The miniaturization of technologies – a now-ubiquitous trend in our society (which, in the
modern era was catalyzed by the invention of the transistor) – has become popular for a wide
variety of applications. The attraction of miniaturizing large-scale lab processes into micro total
analysis systems (µTAS) – also known as lab-on-a-chip (LOC) systems – is driven by
improvements in heat transfer and kinetics which can lead to decreases in processing times,
heightened control over reagents and solvents, reductions in reagent and solvent consumption, as
well as a reduction in the footprint of laboratory equipment leading to laboratory-analysis
portability.1-5 As efforts towards the development of comprehensive LOC systems continue to
expand, so too does the field of digital microfluidics (DMF).
An alternative paradigm to more established techniques relying on enclosed microchannels,
DMF is a relatively new microscale liquid-handling technique in which droplets of fluid are
manipulated on two-dimensional arrays of electrodes coated with a hydrophobic insulator.1, 6
Droplet movement is driven by electrostatic forces that are controlled through the application of
electric potentials to electrodes in an array. In standard formats, droplets can be dispensed from a
reservoir, merged, mixed and split. Both microfluidic paradigms – microchannels and DMF –
share the benefits of miniaturization listed above, but DMF is unique in several respects. In
DMF, samples can be handled and addressed individually. This discretized sample handling is
performed without the need for a complex network of channels, pumps, valves, or mechanical
mixers that characterize many platforms relying on microchannels. This allows for a wide range
of processes to be performed simultaneously in devices with simple and compact design.
Because droplets can be manipulated on generic M x N arrays of electrodes, droplet operations
are reconfigurable from experiment to experiment. DMF is also suitable for preparative-scale
applications for a number of reasons, including (a) the ease of sample collection, (b) the
relatively large droplet volumes, and (c) the fact that DMF devices are often open to atmosphere.
Perhaps the most important advantage of DMF relative to microchannels is the ease with which

2
DMF can process solid samples and incorporate solid materials into sample preparation work-
flows without the risk of clogging. Of course, DMF is not a panacea, and there are several
disadvantages relative to microchannels including (general) incompatibility with separations
(although note that a counter-example is described in chapter 4 of this thesis), incompatibility
with very small volumes (the applications described here used droplet volumes of ~100-1000
nL), and susceptibility to evaporation. I view DMF and other forms of microfluidics as being
complementary, likely to be uniquely useful depending on the given application.
The most common DMF configuration is known as the “closed” or “two-plate” format illustrated
in Figure 1.1. In this format liquid droplets are sandwiched between two substrates patterned
with electrodes: the bottom plate houses the driving electrodes while the top plate houses the
ground electrode. The bottom plate electrodes are coated in an insulating dielectric layer, and all
surfaces are coated in a hydrophobic layer. The two-plate format is the most powerful format,
and is the one employed throughout this thesis, as it permits the complex droplet manipulations
of dispensing from reservoirs and splitting, and has slower evaporation rates than other DMF
conformations.
A variety of fabrication techniques exist for the production of DMF devices. Some low-cost,
rapid-prototyping fabrication techniques include mask printing from desktop printers onto
flexible copper/polyimide substrates,7 micro-contact printing on compact discs,8 and even
printing of conductive inks onto paper substrates.9-10 Traditionally, however, the production of
DMF devices requires a cleanroom and microfabrication techniques including metal deposition,
photolithography, wet etching and spin-coating.11 For all of the work described here, traditional
cleanroom microfabrication techniques were used in the production of devices, with particular
fabrication recipes noted in the individual chapters.

3
Figure 1.1. Digital microfluidics. (A) Side-view schematic of a typical two-plate DMF
device. (B) Top-view picture of droplet operations in DMF, including mixing, splitting,
merging, and dispensing from reservoirs. Modified with permission from Choi, et al.1 ©
2012 by Annual Reviews.
1.2 Applications of Digital Microfluidics
DMF has emerged as a versatile and flexible fluid handling tool, having found a number of
applications in a wide range of fields. The many unique and useful features of DMF has enabled
its application to the study of chemical and enzymatic reactions,12-15 for biological applications
involving proteomics16-18 and DNA,19-20 as well as for clinical applications.21-23 In addition to its
broad applicability, there has also been significant work exploring the capacity to interface
digital microfluidics with different types of detectors, including optical techniques,24-26
electrochemical techniques,27-28 and mass spectrometry.29-30 A comprehensive review of digital
microfluidics was recently published by Choi, et al.1 Since the focus of this thesis centers on
work involving solid samples and matrices, these applications and uses are described in detail in
the following sections.

4
1.2.1 The Use of Solids in DMF Workflows
One of the most salient features of DMF, setting it apart from its counterparts relying on
microchannels, is the ease with which it can incorporate solid materials. Despite being a fluid-
handling technique, the ability to successfully incorporate solid samples has numerous
advantages, including the immobilization of liquid sample, which, upon drying, is convenient to
store, transport, or analyze (as in chapters 2 & 5). In addition, compatibility with solids allows
for preconcentration of sample through evaporation prior to extraction (as illustrated in chapter
3). Finally, the ability to incorporate solid materials in the DMF work-flow expands the suite of
processes compatible with DMF -- for example, in applications using magnetic beads (as in
chapter 4). In the following sections, I review the state-of-the-art for how DMF has been used
with several kinds of solids, including dried biological specimens, microgels and porous polymer
monoliths, and magnetic particles.
1.2.1.1 Biological specimens – Dried Blood, Dried Blood Spots, and
Dried Urine
The complexity of sample preparation often necessitates the use of techniques such as
centrifugation, vortexing, or mechanical manipulation before extraction and analysis can occur.
The ability to address solid material with ease makes DMF particularly well-suited for working
with solid samples. In fact, some of the first papers describing DMF applied to biochemical
applications exploited the use of dried samples to purify peptides and proteins from
heterogeneous mixtures.17-18, 31 These methods comprised of drying sample on device, rinsing
with a rinse solvent to remove impurities, and finally driving a droplet of matrix assisted laser
desorption/ionization (MALDI) matrix to the purified proteins for analysis on-chip by mass
spectrometry. Later, Jebrail, et al.16 demonstrated the ability to extract and purify proteins from
complex biological mixtures by precipitation, rinsing, and resolubilization. To combat issues of
contamination and to increase the longevity of devices, Yang, et al. 32 developed a world-to-
DMF interface consisting of removable “skins” which could be interchanged as needed. These
removable skins were even pre-loaded with dried spots of enzymes for easy-load protein
digestion.

5
In biological applications involving blood, incorporation of whole blood into the work-flow
(rather than a processed fluid such as serum or plasma) is a particularly attractive prospect.
Working directly with whole blood on a DMF device minimizes the amount of sample handling
required between collection and analysis. In most cases described prior to my contributions in
this area (e.g., the analysis of DNA extracts on the real-time PCR platform developed by
Advanced Liquid Logic19, 23, 33), whole blood was not analyzed using digital microfluidics – it
was processed off-chip prior to use. Recently researchers at Sandia National Laboratories
introduced a world-to-chip interface for RNA extraction,34 which uses a peristaltic pump
connected to a micro-centrifuge tube for the manipulation of blood, lysing solution and RNA
binding beads, and for delivery of the liquid to device for immobilization of the magnetic beads
and subsequent elution. However, as above, whole blood itself does not touch the device, and the
RNA extraction does not occur on-chip. In 2009, as part of their seminal work demonstrating the
extraction and analysis of estradiol using DMF, Mousa and Jebrail, et al.,35 placed blood, serum
and tissue aspirates directly on device for extraction and analysis. Their protocol involved lysing
the sample and letting it dry, before extracting the analyte with a polar extraction solvent, and
cleaning that extract up via liquid-liquid extraction with a non-polar extraction solvent. This
unique work was the impetus for my own contributions described in Chapter 5, in which I
examined the utility of DMF for the extraction and quantitation of multiple hormones in blood
dried directly on device.
An alternative method of integrating blood into the DMF workflow is through the use of dried
blood spot (DBS) sampling. DBS samples are formed by spotting of pin-prick volumes of blood
onto filter paper and allowing the sample to dry. Circular punches of blood/paper (~2-3 mm dia.)
are then removed from these cards and used for analysis. There are a variety of reasons why the
use of DMF for the analysis of DBS is beneficial, including low volumes of reagent, direct
translation and miniaturization of existing assays, portability, automation, and lowered
manufacturing expenses.36 The application of digital microfluidics to newborn screening has
been of particular interest, with DBS samples being used for the screening of Pompe, Fabry,
Hunter, Gaucher and Hurler diseases, in addition to testing for a variety of protein deficiencies.21-
22, 44-47 However, these examples do not incorporate DBS samples directly onto DMF devices.
Instead, the DBS punches were placed into 96-well plates for manual extraction, after which the
processed samples were introduced onto DMF devices for further processing and analysis. The

6
first example of DBS samples incorporated directly into DMF work-flow was described by
Jebrail and Yang, et al.37 in 2011, who developed a DMF method involving the extraction and
derivatization of amino acids from DBS punches, on-device. This proof-of-concept paper
described the quantitation of amino acids that are often measured for early diagnosis of diseases
in newborn screening; specifically homocysteinuria, phenylketonuria and tyrosinemia. Building
on that work, Shih and Yang, et al.30 detailed the extraction, derivatization and analysis of
succinylacetone (a marker for tyrosinemia) in addition to other amino acids (Fig. 1.2A). More
importantly, the Shih and Yang work described an in-line interface for direct analysis by mass
spectrometry of samples handled by DMF. This interface is described in detail in section 1.3.2,
below. In Chapter 2 of this thesis, I describe my contributions in this area, which include an
improved version of this interface (allowing for parallel analysis using multiple emitters) with
applications to quantifying pharmaceuticals in DBS samples. Prior to my work, there were no
instances of multiplexed extraction and quantitation by MS using DMF, thus representing a
significant improvement over the current state of the art.
Another easily obtainable and readily analyzed biological fluid is urine.38 The first combination
of dried urine and DMF is discussed in Chapter 3, in which I detail my efforts extracting and
quantifying illicit compounds from urine using digital microfluidics and a portable mass
spectrometer. The only other instance of combining urine and DMF was described by Srinivasan,
et al.39 in 2004, in which a colorimetric enzymatic glucose assay was applied to liquid urine. My
contribution in chapter 3 represents the first use of dried urine as a sample matrix for analysis by
digital microfluidics.
1.2.1.2 Microgels and Porous Polymer Monoliths (PPMs)
The ability to address solid samples using digital microfluidics is valuable, but is less common
than the incorporation of solids into experimental design and workflow. One prominent instance
of the incorporation of solid structures into DMF is through the use of microgels. In 2007, Fair,
et al.40 demonstrated the first formation of a solid phase in an on-chip chemical reaction, by
combining a 2% sodium alginate solution and a calcium chloride cross-linker together to form a
gel. The potential of hydrogel use on DMF was later harnessed by Fiddes and Luk, et al.,41-42
who demonstrated the first application for digital microfluidics and hydrogel discs, through the

7
use of thermoreversible agarose (polymerized off-chip) for use on-chip as integrated enzymatic
microreactors and three-dimensional cell culture platforms (Fig. 1.2B). The open network
structure of these hydrophilic polymers allows for immobilization of proteins and cells in three
dimensions, making them useful for a wide range of applications.42-43 These hydrogels were
immobilized simply by sandwiching them between the top and bottom plates of the DMF device.
Therefore despite being created off-chip, they can theoretically be added and removed from any
workflow without compromising the integrity of the device.
More recently, Eydelnant, et al.44 developed a method for the in situ generation of 3D gel
structures, and demonstrated its utility for culturing and analysing meso-scale 3D cell constructs
that would be difficult to work with using conventional methods (Fig. 1.2C). The ability to
generate microgels directly on device has several advantages including the ability to automate
the process and remove the need for manual intervention, the tailoring of microgel content based
on specific applications, and the generation of microgel arrays which could be used to model
different experimental conditions. These “microgels on-demand” were used as scaffolding to
house cells, and were evaluated as a method of delivering reagents to the cells in a non-
disruptive manner. These microgels were created using a process known as passive dispensing45
to form droplets known as “virtual microwells”.46 These techniques are pictured in Figure 1.2D
and E respectively, and involve the modification or removal of the hydrophobic coating on either
the bottom or the top plate, to immobilize a small portion of liquid by passing a bulk droplet over
the hydrophilic patch. Unlike microgels generated off-chip 41 microgels generated by passive
dispensing44 are integrated into the device, and removal might compromise device or gel
integrity. In chapter 3, the “virtual microwell” technique was used to immobilize and retain the
sample (i.e., urine) throughout the extraction process.
Hydrogels are (of course) not the only porous solid matrix that can be incorporated into DMF
sample-processing workflows. Porous polymer monoliths (PPMs), which are used routinely by
analytical chemists for solid phase extraction (SPE) and separations, can also be integrated into
DMF. Yang and Mudrik, et al.,47 combined DMF with PPMs to perform reversed-phase SPE
sample cleanup on device (Fig. 1.2F). Representing the first instance of SPE performed on DMF,
this work involved the in situ formation of circular PPM discs by UV-initiated polymerization.
The C12 casting solutions were dispensed from reservoirs and manipulated via DMF to their

8
desired locations before polymerization occurred. SPE was performed by addressing a series of
activation/equilibration and elution solvents to and from the PPM discs for the preparative scale
clean-up of angiotensin II samples. As a follow-up, Mudrik, et al.48 developed a similar
technique to implement strong cation exchange (SCX) in DMF by functionalizing PPMs with
negatively charged moieties (i.e. sulfonate) which were used for binding cationic analytes. Thus,
the combination of PPMs and DMF has been demonstrated to be a useful and powerful technique
for sample clean-up; however, there are certain disadvantages associated with this format. For
instance, once formed, the properties of the PPMs become fixed, and cannot be modified in situ
to suit a specific application (e.g., porosity, volume, etc.), which limits the flexibility of the
platform. In addition, the presence of an immovable solid prevents the electrodes beneath and
around the PPM from being used for any other purpose, limiting the re-configurability of the
device. To address these limitations, I developed an alternative scheme for on-chip SPE,
described in Chapter 4.

9
Figure 1.2. Solid samples and digital microfluidics. (Ai) Digital microfluidic device used for
extraction and detection of amino acids from DBS samples. (ii) Mass spectrum of a DMF
extract from DBS sample. Reprinted with permission from Shih, et al. 30 © 2012 by
American Chemical Society. (B) Hydrogel proteolytic enzyme microreactors. A series of
images (i-v) from a movie (left) and a schematic (right) depicting typical digestion
procedure from a 2mm diameter gel disc. Reprinted with permission from Luk and Fiddes,
et al. 42 © 2012 by Wiley. (Ci) Schematic for device illustrating the difference between
passive and active dispensing using the virtual microwells, to produce (ii) an array of

10
microgels with tuned compositions. Modified with permissions from Eydelnant, et al. 44 ©
2014 by Macmillan publishers Limited and from Eydelnant, et al. 46 © 2012 by Royal
Society of Chemistry. (Di) Device used for cell culture, using (ii) adhesion pads for passive
dispensing. Reprinted and modified with permission from Barbulovic-Nad, et al. 45 © 2010
by Royal Society of Chemistry. (E) Illustration of a virtual microwell produced by passive
dispensing. Reprinted and modified with permission from Eydelnant, et al. 46 © 2012 by
Royal Society of Chemistry. (F) Image illustrating solid-phase extraction from a porous
polymer monolith. Reprinted with permission from Yang and Mudrik, et al. 47 © 2011 by
American Chemical Society. (G) Illustration of magnetic bead washing protocol. Reprinted
with permission from Ng, et al.26 © 2012 by American Chemical Society.
1.2.1.3 Magnetic particles
Magnetic beads are routinely used in analytical laboratories for a wide range of applications.
They are particularly convenient because they are flexible – in contrast to fixed media, like
hydrogels or porous polymer monoliths, a researcher can use whatever size of matrix that is
needed to suit his/her particular application. The first use of magnetic beads in a DMF
application was a proof of concept experiment described by C.J. Kim’s research group,
demonstrating the utilization of antibody conjugated magnetic beads for protein localization.49-50
This concept was extended by Sista, et al.,51-52 who performed non-competitive immunoassays
for insulin, interleukin-6, and troponin I using 1.05 µm diameter paramagnetic particles. This
protocol consisted of the formation of antibody-antigen complexes by mixing a droplet of
analyte on-chip, with a mixture of magnetic particles, labeled antibodies, and blocking proteins
that were prepared off-chip. Additionally, the entire DMF procedure was performed immersed in
silicone oil to prevent nonspecific adsorption of proteins onto the device. Vergauwe, et al.53 also
utilized paramagnetic particles (15 nm diameter) to perform a noncompetitive immunoassay of
IgE. Instead of full immersion in oil, they used oil shells to encapsulate individual sample and
reagent droplets. These non-competitive on-chip immunoassays have a few significant
drawbacks, including the use of oil, which can be problematic for integration with other on-chip
functions and requires specialized device packaging to avoid leaks. In response to this, Ng, et
al.26 developed a DMF protocol for both noncompetitive and competitive immunoassays using
antibody-coated magnetic beads in air (Fig. 1.2G). The assay of 17β-estradiol (E2) represents the

11
first competitive immunoassay performed on DMF. Both the competitive E2 immunoassay and
the noncompetitive thyroid stimulating hormone (TSH) assay were successfully implemented
without any premixing; each of the required assay reagents were loaded individually and the
assays were performed entirely on-chip and open to air.
Until now, immunoassays have been the only application demonstrated for magnetic beads with
DMF. In chapter 4, I describe the first example of magnetic bead-based solid phase extraction on
DMF, utilizing beads coated with C18 moieties for the fractionation of sitamaquine and
angiotensin I. This combination of techniques allows SPE while maintaining device flexibility
and reconfigurability. This system was used to evaluate a design of experiment protocol for on-
chip elution solvent optimization.
1.3 Digital Microfluidics and Mass Spectrometry
Mass spectrometry (MS) is a powerful analytical tool capable of providing qualitative
information such as elemental composition and structure, in addition to quantitative
determination of molecular weight and amount of analyte. Over the last decade MS has become
the premier tool for the analysis of biomolecules, owing largely to the development of “soft”
ionization techniques of electrospray ionization (ESI)54 and matrix assisted laser desorption
ionization (MALDI).55-56 These “soft” ionization methods allow the vaporization and ionization
of large biomolecules with little or no fragmentation. Despite the widespread use of MS,
laborious and time-consuming sample preparation is often necessary before analysis. Digital
microfluidics is emerging as a useful platform for integrated, automated sample handling and
processing upstream of MS analysis, a topic described in detail in a recent review article.29 Here
I review two formats for integrating DMF with mass spectrometry that were used extensively in
the work described in this thesis: indirect off-line MS analysis (i.e., completely off-chip) and in-
line MS analysis (i.e., directly from chip).
1.3.1 Indirect off-line analysis
The term “indirect” as used here refers to the analysis of materials recovered from a DMF device
after initial sample processing for later analysis. Any analysis that occurs off-chip falls under this
category, and thus encompasses a wide range of applications.12, 47, 57-58 While indirect off-line

12
analysis techniques are attractive because of the ease of configuration (no need to modify any of
the instruments), they often require additional sample handling and processing steps (e.g.,
dilution into appropriate ESI solvent or MALDI matrix co-crystallization), which can have
certain drawbacks including adsorption, contamination, and sample loss.29 Indirect methods of
MS analysis are featured in chapters 4 and 5, where samples are recovered from device for
subsequent quantitative analysis via direct-infusion MS. The omission of chromatography prior
to MS analysis, also known as flow-injection MS (FI-MS) or direct-infusion MS, is a common
strategy employed by analytical laboratories to increase sample throughput.59 Both the
resolubilization of dried sample (chapter 5) and recovery and dilution of liquid sample (chapter
4) prior to direct-infusion MS analysis have been employed in the past for several DMF
applications including proteomics,16 synthesis,12, 60 and SPE.47
1.3.2 In-line analysis
To avoid the drawbacks associated with off-chip analysis, several in-line interfaces have been
developed to bridge the gap between DMF and MS. Most in-line couplings of DMF with MS use
ESI, as both techniques require liquid samples and compatible volumes (particularly when
nanoESI MS is employed). Some strategies that have been employed for in-line MS analysis
with DMF include the use of a microfabricated microchannel nanoESI emitter for the
quantitation of amino acids from DBS samples,37 the use of surface acoustic wave nebulization
(SAWN) for rapid hydrogen/deuterium exchange,61 and a unique device format known as
“microfluidic origami,” in which the device and nanoESI emitter are formed from the same
flexible substrate.62
While the techniques described above are promising, a more robust interface was developed by
Shih and Yang, et al.,30 in which a pulled glass nanoESI capillary emitter is sandwiched between
the top and bottom plates of a DMF device. When a sample droplet is ready for analysis, it can
be driven to the emitter and allowing it to fill by capillary action. The spray is then generated
through the application of DC potential between the top-plate DMF electrode and the mass
spectrometer, leading to a stable spray. No external seals or gaskets are used to immobilize the
nanoESI emitter; the only requirement is that the gap between the top and bottom plate of a
device are slightly larger than the outer diameter of the emitter-capillary. This strategy affords

13
the ability for robust, reproducible spray, and the flexibility to interface any DMF device with
MS for analysis. In my work (described in Chapters 2&3), the Shih and Yang, et al.30 interface
was improved upon to comprise four capillary emitters fitted between the tops and bottom plates
of each device to accommodate multiplexed analysis. The presence of multiple capillary emitters
enabled the minimization of dead time between analyses, and serves as proof-of-principle for
much higher levels of multiplexing in the future.63-64
1.4 Conclusions
When I began my thesis work, DMF was in its infancy, and its true potential for working with
solid samples had not yet been realized. In the work described in this dissertation, I took on the
challenge of exploring the utility of digital microfluidics as a platform for the reliable analysis
and detection of small molecules in solid samples and using solids as part of the analysis work-
flow. The utility of DMF for pharmacology and drug development was explored in Chapter 2,
evaluating DMF as an alternative platform to traditional techniques for extraction and
quantitation of drugs from DBS samples. Chapter 3 describes the first combination of DMF and
miniature mass spectrometry towards the development of a mobile total analysis system capable
of detecting drugs of abuse in dried urine. Chapter 4 details the potential of DMF as an
automated platform for on-chip solvent optimization which was demonstrated through the
optimization of elution solvent composition for the purposes of fractionation. Unlike the other
projects, solid samples were not involved, but the incorporation of solid materials (C18 magnetic
particles) was essential to the work. And finally in chapter 5, my work helped to extend the panel
of hormones extracted via DMF, first in dried blood and then in tissue.
When I began my thesis work, I read numerous papers that described simple, one-off
experiments that often concluded by describing a vision of the future in which DMF would be
demonstrated to be useful for processing complex samples in multiplex format. In the work
described in this thesis, I have helped bring this vision closer to reality. In part because of my
work, the community has now established that DMF is well suited to performing a wide range of
multiplexed extractions and analyses from, or in the case of the C18 beads – with the help of,
solid materials. Stated another way, over the last few years, DMF has matured from a ‘fiddly’
technology suitable for simple proof-of-principle experiments, into a platform that is known to

14
be useful for a wide range of applications, including the analysis of small amounts of solid
materials. I propose that this thesis represents a useful step along this path.
15
Chapter 2 Multiplexed Extraction and Quantitative Analysis of
Pharmaceuticals from Dried Blood Spot Samples using Digital Microfluidics
Dried blood spot (DBS) sampling is emerging as a valuable technique in a variety of fields
including clinical and pre-clinical testing of pharmaceuticals. Despite this popularity, current
DBS sampling and analysis processes remain laborious and time consuming. Digital
microfluidics (DMF), a microscale liquid handling technique characterized by the manipulation
of discrete droplets on open electrode arrays, offers a potential solution to these problems. We
report a new DMF method for multiplexed extraction and analysis of pharmaceuticals in DBS
samples. In the new method, four DBS samples are extracted in microliter-sized droplets
containing internal standards, and the extract is delivered to dedicated nanoelectrospray
ionization emitters for direct analysis by tandem mass spectrometry and selected reaction
monitoring. The new method allows for an order of magnitude reduction in processing time and
~3x reduction in extraction solvent relative to conventional techniques, while maintaining
acceptable analytical performance for most drugs tested.

16
2.1 Introduction
Dried blood spot (DBS) sampling, in which a pin-prick of blood is collected and dried on a paper
substrate prior to analysis, is becoming popular for a wide range of applications.65-71 One field
that is emerging as a beneficiary of DBS sampling is preclinical and clinical testing of
pharmaceutical candidates, which includes animal toxicokinetic (TK), 72 pharmacokinetic (PK),
drug metabolism, 73-75 and therapeutic drug monitoring studies. 76-78 In these applications, DBS
sampling enables a reduction in sample processing, transportation, and storage costs, 79 and also
has ethical benefits which helps patient recruitment in clinical studies.77, 80 DBS sampling is
gaining particular favour for pre-clinical TK studies of new chemical entities, as it is consistent
with the “3 Rs” of animal experimentation (replacement, reduction and refinement). 81 With DBS
samples, it is possible to collect 10-20 µL blood samples per time point, which is much less
invasive than the standard techniques which can require more than 0.5 mL per time point (which
moreover require additional manipulation of the animal, e.g., 10 min warming period prior to
sampling, etc.). 80-81 DBS sampling allows for a full profile on each of the main study animals,
which eliminates the need for satellite groups, 81 increasing data quality and alleviating ethical
concerns.72 The benefits of DBS sampling are even more important in the development of
pediatric pharmaceuticals, as the young subjects (who have different pharmacokinetics than
adults) have reduced amounts of blood available for analysis. 82-83
Unfortunately, DBS analysis remains a laborious, time consuming task, requiring a disk to be
punched, the analytes to be extracted from the punch, the analytes to be mixed with internal
standards, and (in some cases) derivatized prior to analysis by high-performance liquid
chromatography (HPLC) and multiple reaction monitoring (MRM) by tandem mass spectrometry
(MS/MS). 79 This processing regimen represents a significant barrier to widespread adoption of
DBS sampling and analysis. A number of strategies have been developed to address these
throughput issues, 84 including direct desorption techniques like desorption electrospray
ionization (DESI) mass spectrometry, 85-87 electrospray directly from DBS sample paper, 88 and
the direct elution of analytes from DBS samples using a variety of techniques such as the
CAMAG thin-layer chromatography MS interface. 79, 84, 89 Despite the growing interest in DBS
samples, there are few automated solutions available. 90-93 This is particularly the case for “direct
analysis” techniques that eliminate the HPLC separation associated with conventional analysis.

17
We recently described the first microfluidic techniques useful for extracting and quantifying
analytes in DBS samples. 30, 37 These techniques are powered by digital microfluidics (DMF), a
fluid handling technique in which discrete droplets (~28 µL) of samples and reagents are
manipulated (i.e., dispensed from reservoirs, split, merged and mixed) on an open surface by
applying a series of electrical potentials to an array of electrodes. 6, 94 Droplet actuation in such
systems is driven by electromechanical forces 95-96 generated on free charges in the droplet
meniscus (in case of conductive liquids), or on dipoles inside of the droplet (in case of dielectric
liquids). Moreover, DMF can be used to actuate a wide range of organic solvents 97 (e.g.,
methanol, acetonitrile, acetone, chloroform), making it suitable for extraction from solid
matrices. DMF has recently emerged as a powerful method for sample processing for analysis by
mass spectrometry. 29 Initial validation of DMF for applications involving DBS samples was the
analysis of biomarkers for amino acid metabolism disorders in newborns. 30, 37 These methods
represent an important step forward, but they are limited to serial analysis of one DBS sample at
a time. Here, we describe the development of a new automated DMF direct analysis method for
parallel processing and quantitation of pharmaceuticals for clinical testing, and compare its
performance (assessed in a university setting in Toronto, Canada) to that of conventional
laboratory processing (assessed in a pharmaceutical analysis laboratory in Ware, UK). We
propose that the method presented here may represent a step toward a new tool for preclinical
and clinical testing in the pharmaceutical industry.

18
2.2 Experimental
2.2.1 Reagents and Materials
Unless otherwise specified, reagents were purchased from Sigma Chemical (Oakville, ON).
Compounds used as analytes and internal standards were sourced as follows: ibuprofen, 2H3
ibuprofen, acetaminophen and proguanil were obtained from Sigma-Aldrich (Pool, UK), 2H4
acetaminophen, 2H4 proguanil, simvastatin and 2H313C simvastatin were obtained from Toronto
Research Chemicals (North York, Canada), benzethonium chloride was obtained from Fisher
Scientific (Loughborough, UK), and sitamaquine, 2H10 sitamaquine and SB-243213 were
supplied by GSK (Stevenage, UK). Parylene-C dimer was from Specialty Coating Systems
(Indianapolis, IN), and Teflon-AF was purchased from DuPont (Wilmington, DE). All working
solutions were prepared using HPLC grade methanol.
Dried blood spot (DBS) samples for analysis by DMF and conventional approaches were
prepared in Ware, UK using methods described previously. 77, 98 Briefly, stock solutions of six
drugs (Table 2.1) were prepared in dimethylformamide at 1 mg/mL for all compounds other than
ibuprofen, which was prepared at 10 mg/mL. Working standards at suitable concentrations were
made-up in acetonitrile/water (1:1, v/v), which were diluted into control rat blood from B&K
Universal (Hull, UK) with a maximum of 5% non-matrix solvent. Calibration standards (in
blood) were prepared at the following concentrations: 5, 20, 100, 800, and 1,000 ng/mL
(sitamaquine and proguanil); 100, 400, 2000, 16,000, and 20,000 ng/mL (benzethonium chloride
and acetaminophen); 25, 100, 500, 4,000, and 5,000 ng/mL (simvastatin): and, 5, 20, 50, 400 and
500µg/mL (ibuprofen). For each analyte, a single concentration blind QC sample (in blood) was
also prepared. 15 µL samples of blood were pipetted onto Ahlstrom 226 (untreated) DBS cards
and allowed to dry at room temperature for at least two hours. Some samples were evaluated in-
house by HPLC-MS/MS and others were mailed to Toronto for direct analysis by DMF.
The internal standard (IS) corresponding to each drug was a stable deuterated form of the drug,
except for benzethonium chloride, for which SB-243213 was used. Individual stock IS solutions
were prepared in dimethylformamide (DMF, 10 mg/mL for ibuprofen, 1 mg/mL for all other
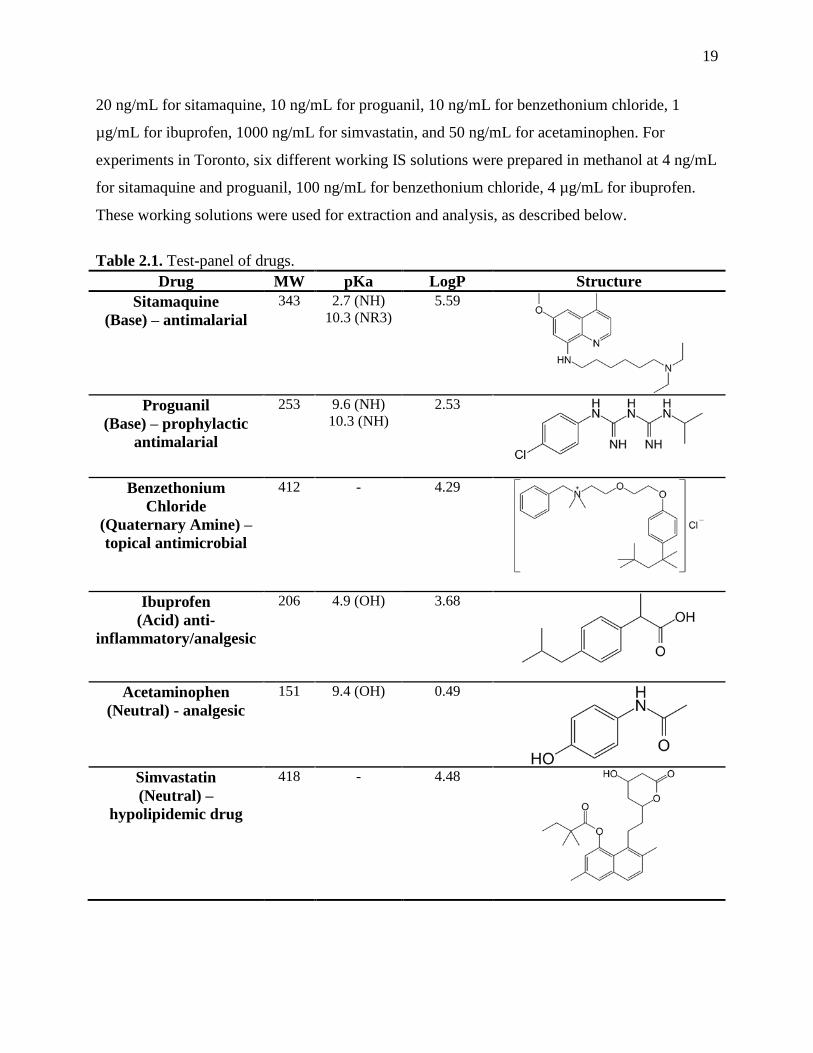
compounds). For experiments in Ware, a single working IS solution was prepared in methanol at
19
20 ng/mL for sitamaquine, 10 ng/mL for proguanil, 10 ng/mL for benzethonium chloride, 1
µg/mL for ibuprofen, 1000 ng/mL for simvastatin, and 50 ng/mL for acetaminophen. For
experiments in Toronto, six different working IS solutions were prepared in methanol at 4 ng/mL
for sitamaquine and proguanil, 100 ng/mL for benzethonium chloride, 4 µg/mL for ibuprofen.
These working solutions were used for extraction and analysis, as described below.
Table 2.1. Test-panel of drugs.
Drug MW pKa LogP Structure
Sitamaquine
(Base) – antimalarial
343 2.7 (NH)
10.3 (NR3)
5.59
Proguanil
(Base) – prophylactic
antimalarial
253 9.6 (NH)
10.3 (NH)
2.53
Benzethonium
Chloride
(Quaternary Amine) –
topical antimicrobial
412 - 4.29
Ibuprofen
(Acid) anti-
inflammatory/analgesic
206 4.9 (OH) 3.68
Acetaminophen
(Neutral) - analgesic
151 9.4 (OH) 0.49
Simvastatin
(Neutral) –
hypolipidemic drug
418 - 4.48

20
2.2.2 DMF Device Fabrication
Digital microfluidic devices were fabricated in the University of Toronto Nanofabrication Centre
(TNFC), using a transparent photomask printed at Pacific Arts and Design (Markham, ON).
DMF device bottom plates were formed from chromium coated glass substrates purchased from
Telic Company (Valencia, CA), and top plates were formed from indium tin oxide (ITO) coated
glass substrates purchased from Delta Technologies Ltd. (Stillwater, MN). Bottom plate
electrodes were formed and coated with Parylene-C and bottom and top plates both were coated
with Teflon-AF as described previously. 11
The device design (Fig. 2.1) features four extraction zones comprising three thin actuation
electrodes (5 × 2 mm ea.) connected to four large actuation electrodes (7 × 7 mm ea.), with inter-
electrode gaps of 40 μm. Devices were assembled with an unpatterned ITO–glass top plate and a
patterned bottom plate such that the 102 mm × 32 mm top plate was aligned with the outer-edges
of the reservoir electrodes on the bottom plate. The two plates were separated by a spacer formed
from five pieces of double-sided tape (total spacer thickness ~450 μm). With these dimensions,
droplets covering the 7 × 7 mm electrodes were ~28 µL.
A ~150 VRMS driving potential was generated by amplifying the sine wave output of a function
generator (Agilent Technologies, Santa Clara, CA) operating at 15 kHz. The application of
driving potentials to the device was managed using an automated feedback control system
described previously. 30, 99 Reagents were loaded onto a DMF device by pipetting an aliquot (~28
µL) onto the bottom plate at the edge of the top plate, and simultaneously applying driving
potential to the appropriate reservoir electrode (relative to the ITO electrode on the top plate) to
draw the fluid into the reservoir. 25, 100 Thereafter, droplets were manipulated by applying the
driving potential to sequential actuation electrodes on the bottom plate relative to the ITO
electrode on the top plate.
21
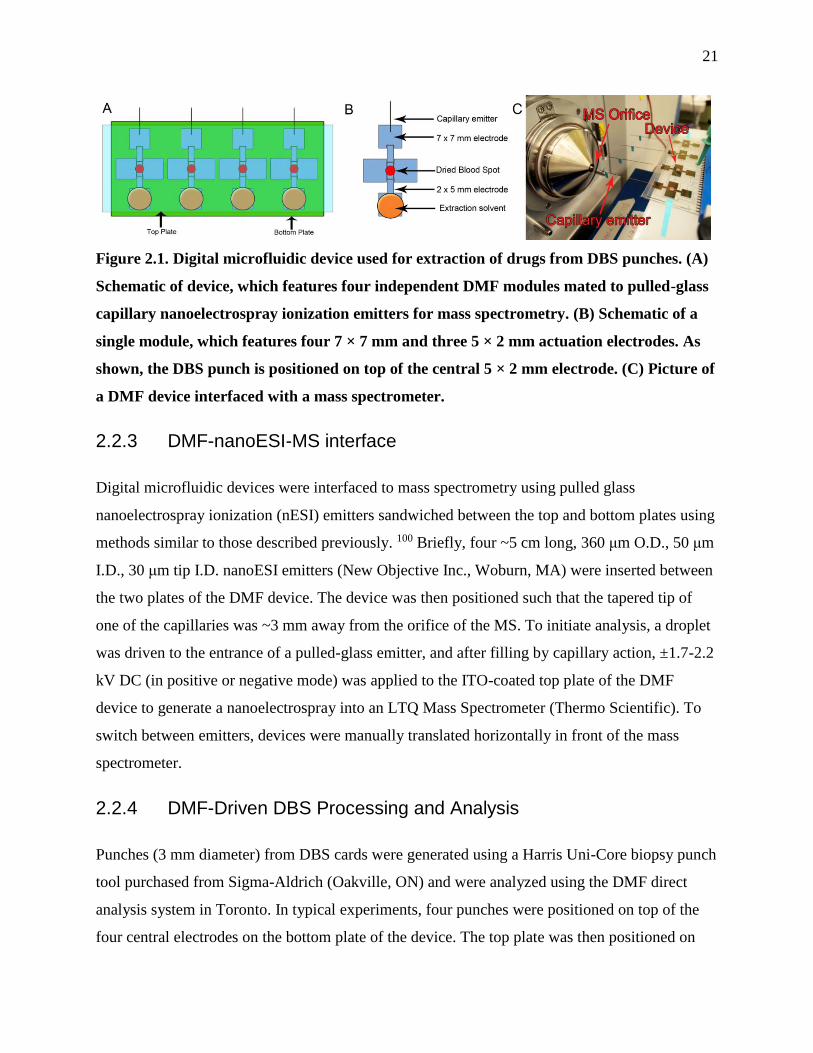
Figure 2.1. Digital microfluidic device used for extraction of drugs from DBS punches. (A)
Schematic of device, which features four independent DMF modules mated to pulled-glass
capillary nanoelectrospray ionization emitters for mass spectrometry. (B) Schematic of a
single module, which features four 7 × 7 mm and three 5 × 2 mm actuation electrodes. As
shown, the DBS punch is positioned on top of the central 5 × 2 mm electrode. (C) Picture of
a DMF device interfaced with a mass spectrometer.
2.2.3 DMF-nanoESI-MS interface
Digital microfluidic devices were interfaced to mass spectrometry using pulled glass
nanoelectrospray ionization (nESI) emitters sandwiched between the top and bottom plates using
methods similar to those described previously. 100 Briefly, four ~5 cm long, 360 μm O.D., 50 μm
I.D., 30 μm tip I.D. nanoESI emitters (New Objective Inc., Woburn, MA) were inserted between
the two plates of the DMF device. The device was then positioned such that the tapered tip of
one of the capillaries was ~3 mm away from the orifice of the MS. To initiate analysis, a droplet
was driven to the entrance of a pulled-glass emitter, and after filling by capillary action, ±1.7-2.2
kV DC (in positive or negative mode) was applied to the ITO-coated top plate of the DMF
device to generate a nanoelectrospray into an LTQ Mass Spectrometer (Thermo Scientific). To
switch between emitters, devices were manually translated horizontally in front of the mass
spectrometer.
2.2.4 DMF-Driven DBS Processing and Analysis
Punches (3 mm diameter) from DBS cards were generated using a Harris Uni-Core biopsy punch
tool purchased from Sigma-Aldrich (Oakville, ON) and were analyzed using the DMF direct
analysis system in Toronto. In typical experiments, four punches were positioned on top of the
four central electrodes on the bottom plate of the device. The top plate was then positioned on

22
the device and 28 µL aliquots of methanol containing the appropriate internal standard were
loaded into each of the four reservoirs. The droplets were then actuated onto the DBS punches,
and cycled 10 times back-and-forth between the large electrodes adjacent to the punches. The
droplets were then incubated on the DBS punches for 5, 10, 15, or 30 min at room temperature,
and then actuated onto the electrodes adjacent to the capillary emitters for analysis.
Analytes were ionized in positive mode for benzethonium chloride, sitamaquine, proguanil,
acetaminophen and simvastatin, and negative mode for ibuprofen. High purity (99.995%) helium
gas (135 ± 70 kPa) was used for collision activated dissociation (CAD), and mass transitions of
412 to 320 and 429 to 228, 344 to 271 and 354 to 271, 254 to 170 and 258 to 174, 152 to 110 and
156 to 114, 419 to 285 and 423 to 285, and 205 to 161 and 208 to 164, were monitored for
benzethonium chloride, sitamaquine, proguanil, acetaminophen, simvastatin, and ibuprofen and
their corresponding internal standards, respectively. Each drug was analyzed separately, and for
each analysis, two m/z transitions were monitored in series: that of the analyte of interest and that
of the corresponding internal standard. The ratios of peak intensities (drug: internal standard) of
the product ions were recorded and used for quantitation. Spectra were collected as an average of
10 acquisitions using Thermo Finnigan’s Xcalibur software (Version 2.0), and at least four
samples were evaluated for every condition recorded. To form calibration curves, concentration-
dependent data were fit with linear regressions using IGOR Pro (Version 5.0.4.8, WaveMetrics,
Inc., Lake Oswego, Oregon, USA).
2.2.5 Conventional DBS Processing and Analysis
DBS samples were processed and analyzed in Ware by HPLC-MS/MS using qualified methods,
described in detail previously.98 Prior to their use for the analysis of test samples here, the
methods were re-qualified in 3 consecutive LC-MS/MS analytical runs to verify their linearity,
precision and accuracy. Briefly, 3 mm diameter disks were punched from the center of the DBS
cards into clean tubes, followed by a 1 hour extraction with 100 µL internal standard working
solution. The samples were then vortex mixed for approximately 20 s, and centrifuged for 1 min
at 3000 x g. The supernatant was then transferred to a clean tube for analysis by HPLC-MS/MS.
The HPLC system comprised a CTC HTS PAL autosampler (Presearch, Hitchin, U.K.) with fast
wash and an Agilent 1100 binary pump (Palo Alto, CA, U.S.A.) with integrated column oven

23
and divert valve. The MS was a triple quadrupole API-5000 (Applied Biosystems/MDS Sciex,
Concord, Canada) equipped with a TurboIonspray ion source. The collision gas (CAD),
nebuliser gas (GS1), and auxiliary/turbo gas (GS2) were all ultra-high purity (UHP) Nitrogen.
MS source conditions were optimized to give the maximum response for a given analyte/assay.
Concentrations of test compounds were determined from the peak area ratios of analyte to IS
using Analyst software (Version 1.4.2, Applied Biosystems/MDS Sciex, Concord, Canada).
For all analytes except acetaminophen, a 50 mm long 2.1 mm i.d. Hypurity C18 3 μm HPLC
column (Thermo Fisher, Loughborough, UK), a flow rate of 1000 μL/min, column temperature
of 60°C, run time of 3.8 min, and gradient chromatography employing the mobile phases methyl
ammonium acetate (10 mM, pH 4.2) (A) and acetonitrile (B) was used. Following sample
injection, the mobile phase was held at 95% A for 0.1 min. A ballistic gradient to 20% A at 1.0
min was followed by an isocratic period at 20% A to 3 min. The mobile phase was then returned
to 95% A by 3.2 min and was held as this composition until 3.8 min, before the injection of the
next sample.
For acetaminophen, a 50 mm long 4 mm i.d. YMC AQ C18 3 μm HPLC column (Dinslaken,
Germany), a flow rate of 800 μL/min, column temperature of 60°C, run time of 2.5 min, and
gradient chromatography employing the mobile phases ammonium acetate (1 mM, native pH)
(A) and acetonitrile (B) was used. Following sample injection, the mobile phase was held at 95%
A for 0.08 min. A ballistic gradient to 0% A at 1.08 min was followed by an isocratic period at
0% A to 1.25 min. The mobile phase was then returned to 95% A by 1.26 min and was held as
this composition until 2.5 min, before the injection of the next sample. The same MRM
transitions were monitored for all drug/IS pairs as outlined in the DMF-driven DBS analysis
section, above.
For each test compound six replicates of the blind QC were run, bracketed by two (five point)
calibration lines plus total blank (matrix only) and blank (blank control matrix plus internal
standard) samples. Calibration plots of analyte/IS peak area ratio versus the nominal
concentration of the analyte in blood were constructed (using Applied Biosystems/MDS Sciex
Analyst software v1.4.2), and a weighted 1/x2 linear regression was applied to the data for all
analytes. Internationally recognised acceptance criteria was applied to all analytical batches to

24
ensure their validity. 101 Post analysis, the nominal blind QC concentrations were unblinded and
a mean accuracy (% bias) and precision (% CV) value was calculated from the six replicate blind
QC for each analyte.

25
2.3 Results and Discussion
2.3.1 Device and Test Candidates
The primary goal of this work was to develop a new digital microfluidic method for multiplexed,
quantitative analysis of drugs in DBS samples. As shown in Figure 2.1, a new device design was
generated bearing four modules to allow for the extraction of four samples in parallel. Each
module comprises four 7 × 7 mm electrodes and three 2 × 5 mm electrodes, and each module is
interfaced to a dedicated nanoelectrospray (nESI) emitter. To our knowledge, this is the first
digital microfluidic device that is integrated with multiple ionization sources. In a typical
experiment, DBS samples are manually punched from the card and positioned on the top of the
central 2 × 5 mm electrodes using tweezers, the top plate is placed onto the device (separated by
spacers of double-sided tape), and the device is connected to an automated droplet control
system, which is described in detail elsewhere.30, 99 During the extraction process, the DBS
sample maintains contact with the top and bottom plates such that it remains stationary. The
control system makes regular impedance measurements and uses this information to maintain
high-fidelity control over droplet position, which is particularly important for manipulating
droplets onto and off of the absorbent DBS punches.
A typical experiment is depicted in Figure 2.2. An aliquot of solvent (~28 µL) is loaded onto the
device (Fig. 2.2A), driven onto the DBS punch and shuttled back and forth (Fig. 2.2B-C) and
incubated (see the following section for discussion of incubation time optimization). The droplet
is then driven to the nESI emitter (Fig. 2.2D), where, after spontaneously filling the emitter by
capillary action, an electrospray is initiated by applying a potential to the top-plate electrode. In
this scheme, the four extractions can be performed in parallel, but the nESI-MS analyses for four
DBS punches are conducted serially by translating the device to position each emitter in front of
the MS inlet. If desirable, in the future, methods for multiplexed ionization and detection 97
might be adapted to allow for parallel analysis.
A panel of six drugs was selected to test the new digital microfluidic extraction and analysis
system (Table 2.1). The panel includes two secondary amines used for their antimalarial
properties (sitamaquine and proguanil), a quaternary amine used as a topical antimicrobial agent

26
(benzethonium chloride), a carboxylic acid used as an analgesic (ibuprofen), and two neutral
compounds, a mild analgesic (acetaminophen) and a hypolipidemic agent (simvastatin). These
drugs were spiked into rat blood at physiologically relevant concentrations and were used to
form DBS samples for analysis using the method shown in Figure 2.2. This panel was chosen in
part because it has been used previously in a range of direct analysis techniques, including direct
elution 79, Desorption Electrospray Ionisation (DESI), 87 Direct Analysis in Real Time (DART)
(unpublished data), and PaperSpray.88 Previous studies have shown that direct analysis
techniques that do not use liquid chromatography have been unable to match the sensitivity of
conventional LC-MS/MS analysis for at least some of the compounds in this suite, with the
neutral compounds (acetaminophen and simvastatin) being the most problematic. 84
Figure 2.2. Series of images illustrating a digital microfluidic DBS extraction. (A) A
reservoir is filled with extraction solvent (methanol containing internal standard). (B - C)
The solvent is then driven onto the dried blood spot, and actuated back-and-forth before
incubating. (D) After incubation, the droplet is moved to the final electrode, where it fills
the pulled glass emitter by capillary action.
2.3.2 MS/MS Analysis and Optimization
The traditional method used for off-line extraction and HPLC-MS/MS analysis of
pharmaceuticals in DBS samples requires several hours per sample,79 although the extraction
phase can be done for multiple samples in parallel. Typically, several hundred DBS samples may
be extracted in parallel, an activity that will typically take several hours to complete, followed by
~5 hrs of HPLC-MS/MS analysis time per 100 samples. In developing the method described
here, we strove to improve upon this by (a) eliminating the HPLC separation (i.e., direct
analysis), and (b) taking advantage of the inherent benefits of microfluidics including reduced

27
reagent use and method integration. For (a), quantitation without HPLC required careful
attention to internal standards and multiple reaction monitoring (MRM) transitions, which are
described in the methods section. A further consideration is that metabolites of some structures
(N-oxides, acyl glucuronides, sulfates) may undergo transformation back to the parent drug in
the source region of the MS. Methods were developed for the analysis of each drug in the panel
using the mass transitions described above. The DMF/direct analysis technique worked well for
four drugs (sitamaquine, proguanil, benzethonium chloride, and ibuprofen), but failed to yield
reproducible signals for two (acetaminophen, simvastatin), which suggests that the new DMF-
MS/MS protocol may face the same challenges as other direct MS/MS techniques.84
Representative spectra for sitamaquine are shown in Figure 2.3A, including strong MRM peaks
for both the native drug (in the DBS) at m/z 344 271 and the deuterated internal standard (in
the extraction solvent) at m/z 354 271. Sitamaquine, proguanil, benzethonium chloride, and
ibuprofen were used in the remaining experiments.
For the second improvement (b) associated with the DMF method (shortened extractions), four
different incubation times were evaluated: 5, 10, 15, and 30 minutes. In separate experiments for
each drug, four replicate DBS punches were extracted and analyzed per extraction time. The
concentrations selected for these experiments were pharmaceutically relevant values: 100 ng/mL
for sitamaquine and proguanil, 50 µg/mL for ibuprofen, and 2000 ng/mL for benzethonium
chloride. Figure 2.3B summarizes the results of the extraction time optimization experiment. As
shown, signal strength generally increases as the extraction time is increased, which suggests that
longer extraction times are better for sensitive analyses. But this benefit is offset by an increase
in variation associated with the longer extraction times, most notably with benzethonium
chloride and ibuprofen. We hypothesize that the increased variation at longer incubation times is
related to evaporation. The method reported here makes use of devices which are open to the
environment; by the end of a 15 or 30 minute extraction time, evaporation becomes significant,
particularly for solvents (like methanol, used here) that have a low boiling point. The inclusion
of internal standard in the extraction solvent mitigates this problem to a degree, but after long
incubation times, it was occasionally observed that the droplet had evaporated to an extent that
droplet actuation was unpredictable (resulting in longer than anticipated extraction times).

28
Figure 2.3. Digital microfluidic extraction and analysis of pharmaceuticals from DBS
samples. (A) Representative positive ion tandem mass spectra of sitamaquine collected via
nanoelectrospray (m/z 344 271, in the DBS punch) (main panel) and deuterated internal
standard (IS, m/z 354 271, in methanol ) (inset). (B) Peak intensity ratio of drug/IS as a
function of on-chip incubation time. Red = sitamaquine (100 ng/mL), blue = proguanil (100
ng/mL), purple = benzethonium chloride (2000 ng/mL), green = ibuprofen (50 µg/mL). The
error bars represent ± 1 SD, n=4.

29
We propose that in the future, if increased sensitivity (related to long extraction times) is desired,
a number of different strategies might be used to reduce evaporation, including a temperature
controlled chamber 102 or the use of a gasket to seal the device. 103 A third strategy might include
operating the device with filler media other than air (e.g., silicone oil 1) but we speculate that
exposure to oil is not a perfect match for applications (such as the one reported here) requiring
analysis by mass spectrometry. Regardless, for the work reported here, the variation was
sufficiently low for incubation times of 5 min (% CVs: sitamaquine – 17.1%, proguanil – 10.4%,
benzethonium chloride – 10.8%, ibuprofen – 35.6%) and 10 min (% CVs: sitamaquine – 11.8%,
proguanil – 16.8%, benzethonium chloride – 7.8%, ibuprofen – 31.0%) for quantitative analysis,
and 5 min incubation was used for the remainder of the work described here.
The total time required to extract and analyze a single DBS sample (including MS/MS analysis
time) is ~6.5 min, representing a 10-fold improvement relative to the standard method used in
industry. This number does not take multiplexing into account; for example in conventional
analysis, DBS samples can be extracted in parallel in well plates which reduces the amount of
time required per data point. The DMF system described here is also multiplexed, allowing for
four parallel extractions, and we propose that higher levels of multiplexing should be achievable
in the future, given the recent report of DMF devices with 4096 individually addressable
electrodes. 104 In addition, the solvent volume used in the DMF method (28 µL per DBS) is
substantially lower than that used in the standard method (100 µL extraction solvent per DBS
plus 1.5 mL LC-MS/MS solvent). The DMF extraction volume was chosen arbitrarily for the
work reported here; we propose that in future experiments with greater control of evaporation (as
described above), even greater reductions in volume might be achieved. For these future
experiments, we propose that the minimum volume required is 2× the volume that can absorb
into a DBS punch (e.g., for a 3 mm dia. punch, the minimum volume is ~6 L).
2.3.3 Quantitative Analysis
The DMF/direct analysis method described above was applied to quantify sitamaquine,
proguanil, benzethonium chloride, and ibuprofen. Calibration curves were generated by plotting
the intensity ratios of drug product ions relative to those of internal standards as a function of
drug concentration in a series of DBS samples (Fig. 2.4). As shown, the curves generated by

30
DMF/direct analysis are linear over multiple orders of magnitude, with R2 values of 0.9999,
0.9974, 0.9964, and 0.9977, respectively. For comparison, calibration plots of analyte/IS peak
area ratio versus the nominal concentration of the analyte in blood were also constructed using
conventional HPLC-MS/MS methods. Curves were linear over the calibration ranges, with R2
values of 0.9954, 0.9969, 0.9885, and 0.9962 for sitamaquine, proguanil, benzethonium chloride,
and ibuprofen respectively.
Replicate blind QC DBS samples were analyzed using the DMF protocol in Toronto and the
traditional macroscale protocol at GSK R&D in Ware. Table 2.2 summarizes the results. For
sitamaquine and proguanil, the DMF and conventional protocols performed similarly, with
measured accuracies relative to the unblinded concentrations of 90.0% and 101% (DMF) and
109% and 104% (conventional). This is striking, given that the analyses were performed using
such different methodologies and were carried out by different operators working in different
laboratories. In contrast, the conventional protocol was more accurate than the DMF protocol for
the quantitation of benzethonium chloride and ibuprofen, with measured accuracies of 112% and
98.8% (conventional), and 66.9% and 119.5% (DMF) respectively. Difficulties in the extraction
and analysis of ibuprofen necessitated the use of a calibration curve spanning a vastly higher
concentration range than the expected therapeutic levels. It is possible that the benzethonium
chloride and ibuprofen in the DBS samples that were analyzed by DMF (that were mailed from
the UK to Toronto) were subject to temperature and humidity changes, which are known to
degrade some analytes. 105 But it is also likely that simple changes in methodology could
improve these results, e.g., tuning the extraction solvent to favour the solubility of weak acids 106
or quaternary amines, 107 or adjusting the solvent composition after extraction for higher
ionization efficiency. Similarly, these steps might enable quantitation of acetaminophen and
simvastatin.
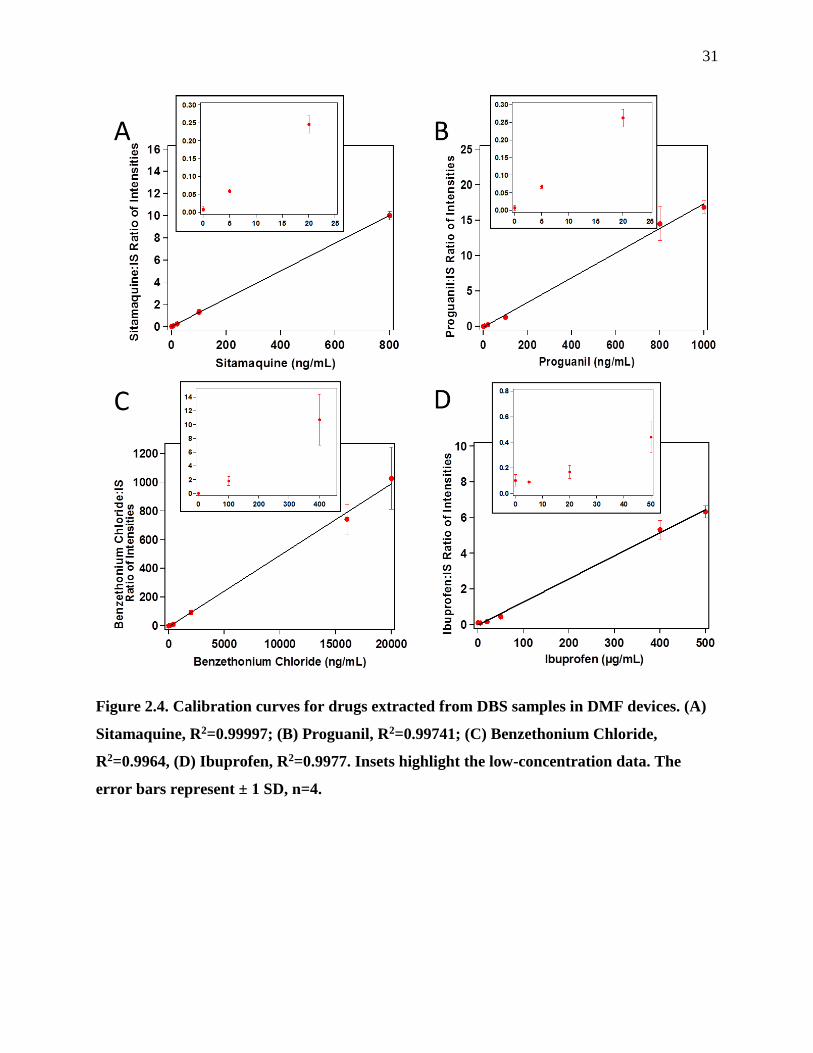
31
Figure 2.4. Calibration curves for drugs extracted from DBS samples in DMF devices. (A)
Sitamaquine, R2=0.99997; (B) Proguanil, R2=0.99741; (C) Benzethonium Chloride,
R2=0.9964, (D) Ibuprofen, R2=0.9977. Insets highlight the low-concentration data. The
error bars represent ± 1 SD, n=4.

32
Table 2.2. Results of blind quality control experiment.
Method Parameter Sitamaquine Proguanil Benzethonium
Chloride
Ibuprofen
- [Actual Drug]
ng/mL
900 450 1000 200,000
conventional [Drug] ng/mL 978 468 1120 197,000
conventional % Accuracy 109 104 112 98.8
conventional % CV of Blind 3.2 2.4 3.1 5.7
conventional No. replicates 6 6 6 6
DMF [Drug] ng/mL 814 457 669 240000
DMF % Accuracy 90 101 67 120
DMF % CV of Blind 2.4 16 16 29
DMF No. replicates 3 4 8 8
2.4 Conclusion
To summarize, the data presented here demonstrate that the DMF-DBS direct analysis technique
is (a) well suited for quantifying sitamaquine and proguanil, (b) compatible with quantifying
benzethonium chloride and ibuprofen (but would benefit from further optimization), and (c) not
suitable for quantifying acetaminophen and simvastatin without a significant change in
methodology. The device and method described here represents a baseline for using digital
microfluidics as a multiplexed sample processing tool for clinical or pre-clinical evaluation of
pharmaceutical agents in DBS samples. In the future, we propose that there are a number of
potential device/instrument-level improvements that could be made including integration with
DMF-driven solid-phase extraction modules for purification and concentration, 47 and/or
interfacing DMF processing with HPLC or other separation techniques. 108-109 The current
popularity of DBS sampling is driving significant innovations, including the recent development
of robotic platforms capable of DBS sample analysis.110 These robotic systems (while still
requiring some fine-tuning) will undoubtedly be useful in large, well-funded laboratories. But the
work presented here suggests that DMF may present an attractive alternative for laboratories that
do not have access to robotic systems, with the added advantages of reduced extraction time and
solvent/reagent usage. The simplicity of the approach presented may also be able to be adapted
to the placement of analytical tools closer to the patient (e.g., in the hospital) rather than in
centralised analytical facilities. This may be of particular importance where rapid decision
making is required.

33
2.4.1 Future Perspective
Digital microfluidics (DMF) is emerging as a versatile sample processing platform to combine
with mass spectrometry.29 We report a new DMF method for multiplexed extraction of
pharmaceuticals from dried blood spot samples, integrated with in-line analysis with tandem
mass spectrometry. This technique has the potential to reduce analysis time, increase throughput,
and provide a flexible, re-configurable platform for the bioanalysis of pharmaceuticals in
complex samples. Further, this approach offers the possibility of changing the paradigm of how
samples are analysed away from centralised laboratories and instead to facilities localised in
closer proximity to the patient. For example, the combination of DMF and miniature mass
spectrometers (discussed in chapter 3) opens to the door to an array of interesting possibilities for
point-of-care analysis.
The incorporation of DBS into the workflow of pharmaceutical laboratories will depend on the
application – high-throughput screening is likely best suited to robotics, while one-off and two-
off analyses may be a good fit for DMF. Likewise, the widespread adoption of DMF as a
platform to analyse DBS samples will depend on the capacity of the field to overcome several
limitations and challenges. For example, the complex fabrication processes for each device and
the lack of access to multiplexed droplet control systems are major hurdles to overcome if the
widespread acceptance of this technology is to ever be reached. Open access automation systems
like DropBot 111 and the development of low-cost and resource-limited fabrication methods 7, 112
may prove integral to the widespread adoption of DMF in coming years.

34
Chapter 3 Analysis on the Go: Quantitation of Drugs of Abuse in Dried Urine
with Digital Microfluidics and Miniature Mass Spectrometry
We report the development of a method coupling microfluidics and a miniature mass
spectrometer, applied to quantitation of drugs of abuse in urine. A custom digital microfluidic
system was designed to deliver droplets of solvent to dried urine samples, and then transport
extracted analytes to an array of nanoelectrospray emitters for analysis. Tandem mass
spectrometry (MS/MS) detection was performed using a fully autonomous 25 kg instrument.
Using the new method, cocaine, benzoylecgonine, and codeine can be quantified from four
samples in less than 15 min from (dried) sample to analysis. The figures of merit for the new
method suggest that it is suitable for on-site screening – for example, the limit of quantitation
(LOQ) for cocaine is 40 ng/mL, which is compatible with the performance criteria for laboratory
analyses established by the United Nations Office on Drugs and Crime. More importantly, the
LOQ of the new method is far superior to the 300 ng/mL cutoff values used by the only other
portable analysis systems we are aware of (relying on immunoassays). This work serves as a
proof-of-concept for integration of microfluidics with miniature mass spectrometry. The system
is attractive for the quantitation of drugs of abuse from urine, and more generally, may be useful
for a wide range of applications that would benefit from portable, quantitative, on-site analysis.
35
3.1 Introduction
Drug abuse is an epidemic that impacts the social and economic well-being of people all around
the world.113-114 While urine, blood, hair, sweat, and saliva have been used to probe for the
presence of illicit and abused drugs,38 urine is the most preferred sample because of its ease of
collection and high concentrations of drugs and metabolites.115-117 A recent trend is the archiving
of urine samples as dried spots on paper,118 with advantages of long-term storage and analysis
(similar to what has been reported for dried blood spots77). Urine samples are routinely analyzed
for stake-holders in a wide range of settings including the workplace, the military, athletics, and
the criminal justice and health care systems.38, 119-120 This has driven the development of portable
immunoassays for drugs of abuse that are compact, inexpensive, and compatible with a wide
range of operating environments.121-122 However, for most applications, the imperfect nature of
immunoassays, which have non-negligible rates of false negatives and positives (resulting in the
use of high cut-off levels),38, 114, 123 requires that initial test results be confirmed by a second
analysis in the laboratory. This two-tiered system of analyses (first in the field, second in the
laboratory) results in significant costs associated with maintaining the chain of custody and
ensuring proper storage and transportation.116, 124
Laboratory analysis for drugs of abuse (the second tier) is typically implemented by gas
chromatography (GC) or high performance liquid chromatography (HPLC) coupled with tandem
mass spectrometry (MS/MS).119-120 These methods are extremely precise and reproducible,
representing the analytical “gold standard” for confirmatory analysis.119, 124-125 But these methods
are slow (often requiring extensive sample processing prior to analysis), must be performed by
well-trained technicians, and require use and maintenance of expensive laboratory equipment. .
Various strategies have been used in an attempt to reduce the analysis time, including “dilute-
and-shoot” protocols in which the sample is simply diluted and then analyzed by HPLC-
MS/MS.126-127 While this circumvents sample processing, these protocols are not ideal for
quantifying low concentrations, and the methods require chromatographic separation which is
often the rate-limiting step in the analysis (30-60 min per sample). Perhaps most importantly,
samples must be transported to and from the lab, adding many days-weeks to a process that
might otherwise be completed in minutes.

36
A potential solution to the time-consuming two-tiered analysis system is to bring gold-standard
analyses into the field, effectively eliminating the need for pre-screening with error-prone
immunoassays. The recent emergence of miniature (or “mini”) mass spectrometers makes this
prospect a possibility. Several kinds of mini MS systems have been developed, using
quadrupoles,128 ion traps,77, 129-131 time-of-flight (TOF) analyzers,132-133 and magnetic sectors.134
While mini MS systems benefit from small size and low power consumption, the trade-off is a
loss of specificity,135 which can be problematic for real-world samples. Specificity limitations
can be overcome by implementing MS/MS and selected reaction monitoring (SRM), permitting
targeted analysis of specific mass transitions upon fragmentation. The mini mass spectrometer
systems developed at Purdue University131, 136 are particularly attractive for the analysis of
complex mixtures because they combine MS/MS analysis with ambient ionization techniques.
The latest generation of these instruments was recently implemented in “backpack” format,137 as
a fully autonomous light-weight instrument (12 kg, including attendant pumps, power supply,
detector, mass analyzer, and ion source) that can be carried or worn comfortably by one person.
For on-site analysis of drugs of abuse, mini mass spectrometers must be combined with
miniaturized systems for sample collection and processing and/or chromatographic separations.
One option for portable sampling is microfluidics, which typically relies on the transport of
liquid samples in enclosed microchannels. A range of microchannel-based methods for analyzing
drugs of abuse have been reported,138-142 but only a few of these methods are compatible with
MS,140-142 and those that are require on-chip chromatography or other separations prior to
detection. More importantly, these methods have, to date, been coupled only to laboratory-scale
MS instruments. A second option is paper spray ionization,143 in which samples embedded in
paper are eluted in solvent and analyzed directly by mass spectrometry with no separations.
Paper spray has been used to analyze drugs of abuse,144 but it is likely limited to simple
processes comprising one or a few steps, and quantitation requires that samples be pre-mixed
with internal standards. A third option is digital microfluidics (DMF), a technique in which
droplets of reagents and samples are manipulated electrodynamically on an array of electrodes.1
DMF is useful for combining complex, multi-step sample preparation with direct analysis by
mass spectrometry,30, 37, 62, 145-146 but (as is the case for microchannels), all systems reported
previously have relied on bench-scale mass spectrometers in a laboratory setting. We propose

37
that a portable system relying on DMF for sample preparation and mini MS for analysis would
be a powerful new tool for single-tier quantitation of drugs of abuse.
Here we report a digital microfluidic platform used for the extraction and quantitation of drugs of
abuse in urine by tandem mass spectrometry. This work is novel in several respects, being (a) the
first microfluidic method integrated with a mini MS, (b) the first microfluidic method capable of
analyzing dried urine, and (c) the first quantitative analysis of drugs of abuse in urine using a
mini MS. We propose that innovation (a) is particularly attractive for a wide range of
applications for portable analysis – there are many on-going efforts to couple microfluidics to
miniature mass spectrometers for portable analysis,129 but to our knowledge, this report
constitutes the first description of such a system in the literature.

38
3.2 Experimental
3.2.1 Reagents and Materials
Cocaine, benzolyecgonine (BZE), and codeine were purchased as 1 mg/mL stock solutions in
methanol (MeOH) from Sigma Aldrich (Oakville, ON, Canada), and solid mepivacaine was
obtained from the same source. Cocaine (and its deuterated internal standard, cocaine-d3), was
also obtained from Cerilliant Corporation (Round Rock, TX, USA) as a 1 mg/mL stock solution
in MeOH. Urine (pooled male donor) was obtained from BioChemed Services (Winchester, VA,
USA). HPLC grade methanol (MeOH) and deionized water (diH2O) with a resistivity of 18
MΩ∙cm at 25˚C were used in all experiments. All drugs were diluted to the appropriate
concentration in MeOH or urine prior to experiments. Glass substrates coated with 200 μm
chromium were from Telic Company (Valencia, CA, USA) and indium-doped tin oxide (ITO)
coated glass substrates were from Delta Technologies, Ltd. (Loveland, CO, USA). Parylene-C
dimer was from Specialty Coating Systems (Indianapolis, IN, USA) and Teflon-AF 1600 was
from Dupont (Wilmington, DE, USA).
3.2.2 DMF Device Fabrication, Assembly, and Operation
Devices were fabricated at the University of Toronto Nanofabrication Centre (TNFC). Device
bottom plates bearing patterned chromium electrodes and contact pads covered with Parylene-C
and Teflon-AF were formed using photolithography and wet etching as described previously.46
As shown in Figure 3.1, bottom plates had four analysis zones spaced 24.44 mm apart, each
comprising one loading reservoir (7 × 7 mm), two thin actuation electrodes (2 × 5 mm), two
large extraction electrodes (7 × 7 mm), one plus-shaped electrode (7 × 5 mm) and two large
actuation electrodes (7 × 7 mm), with inter-electrode gaps of 40 μm.
DMF device top plates were formed from ITO-coated glass substrates coated with 50 nm Teflon-
AF and patterned using a lift-off technique, as described previously.46 Briefly, completed top
plates were globally coated with Teflon-AF with four 2 mm diameter circular regions of exposed
ITO (known as “anchors”) spaced 24.44 mm apart. When used for analysis, a 20 μL aliquot of
urine spiked with an appropriate concentration of drug was spotted onto each of the four anchors
and dried on a hot plate at 100˚C for ~10 minutes.

39
DMF devices were assembled with a urine-spotted ITO-glass top plate and a patterned
chromium-glass bottom plate separated by a spacer formed from 4 pieces of double-sided tape
(spacer thickness ~ 360 μm) such that each dried urine zone on the top plate aligned with a
central thin electrode on an analysis zone (Fig. 3.1a), and the top plate was aligned with the outer
edge of the reservoir electrodes on the device bottom plate to facilitate solvent loading. Droplets
were actuated on assembled devices by applying driving potentials of 110-135 VRMS between the
top-plate electrode (ground) and successive electrodes on the bottom substrate, managed by the
open-source DropBot control system (described in detail elsewhere111).
Figure 3.1. Digital microfluidic device used for extraction of drugs from dried urine. (A)
Three-quarter view schematic of device, which features four independent DMF modules
mated to pulled-glass capillary nanoelectrospray ionization emitters for direct analysis by
tandem mass spectrometry. Urine is affixed and dried onto hydrophilic anchors located on
top plate. When assembled, the top and bottom plates are separated by a 360 μm thick
spacer. (B) Top-down schematic of a single module, which features five 7 × 7 mm, two 2 × 5
mm, and one 7 × 5 mm actuation electrodes. The red scale bar is 7 mm.

40
3.2.3 DMF-Driven Urine Extraction
In a typical experiment, one 22 μL aliquot of extraction solvent (neat MeOH for conductivity
measurements, MeOH containing 50 ng/mL mepivacaine as the internal standard for lab-scale
MS analysis, or MeOH containing 100 ng/mL cocaine-d3 as the internal standard for mini MS
analysis) was loaded into each of the four reservoirs. Each aliquot was then driven to its
respective dried urine zone and incubated for 5 minutes, including 15 cycles of actuating the
droplet back-and-forth between the two extraction electrodes adjacent to the dried urine. Extract
droplets were then split from the hydrophilic dried urine zones and driven to the destination
electrode for analysis.
3.2.4 Conductivity Measurements
In each conductivity measurement, ~80 μL of pooled methanolic extract droplets generated by
DMF from four samples of neat urine or urine spiked with 50 ng/mL cocaine (each representing
a total urine volume of 80 μL) was collected by pipette and diluted in 13 mL diH2O. For
comparison, 80 L aliquots of diH2O, pure methanol, pure urine and urine containing 50 ng/mL
cocaine were also diluted in 13 mL aliquots of diH2O. Diluted solutions were evaluated using an
H270G conductivity meter (Hach Company, Loveland, CO, USA). Four replicates were prepared
and evaluated for each condition.
3.2.5 Lab-Scale DMF-MS/MS Experiments
DMF devices were interfaced to a Thermo LTQ linear ion trap mass spectrometer (Thermo
Scientific, Waltham, MA, USA) using pulled glass capillary nanoESI emitters sandwiched
between the top and bottom substrates of the device as described previously.30, 146 Briefly, a
nanoESI emitter (5 cm long, 360 μm O.D., 50 μm I.D., 30 μm pulled tip I.D., New Objective
Inc., Woburn, MA, USA) was manually inserted between the two plates of the DMF device.
When the extract droplet was driven to the rear of the emitter, it was filled by capillary action in
<1 s. The device was positioned ~3 mm from the grounded inlet of the mass spectrometer, and
spray voltage was applied to the ITO-glass top plate of the DMF device, making contact with the
solution to be sprayed. Once the first sample was analyzed, a second emitter was inserted into the
second extract droplet, the device moved laterally to align the next emitter with the MS inlet, and
41
the process repeated until all four samples were analyzed. All analytes were analyzed in positive
ion mode at a capillary temperature of 250˚C. Parameters including spray potential (+ 1.6-2.0
kV), capillary voltage, tube lens voltage, and collision energy were varied for each analyte to
provide optimum signal. Spectra were obtained by averaging 10 acquisitions (at a rate of 6
acquisitions/s).
3.2.6 DMF-Mini-MS/MS Experiments
Mini MS experiments were performed with a Mini 12 mass spectrometer, described in detail
elsewhere.131 Briefly, the Mini 12 is a 25 kg, 19.6 × 22.1 × 16.5 inch mass spectrometer with a
self-contained vacuum system and an average power consumption of ~65 W. The 4 × 5 mm
rectilinear ion trap (RIT) was operated with an RF driving frequency of 1 MHz, and ions were
trapped for MS/MS analysis with a notched stored waveform inverse Fourier transform (SWIFT)
and activation frequencies were 102.25 kHz (for m/z 304) and 100.85 kHz (for m/z 307). For
DMF-Mini-MS/MS experiments, samples were extracted and introduced into nanoESI capillaries
as above and sprayed into the instrument using the discontinuous atmospheric pressure interface
(DAPI) described in detail elsewhere,147 with a pulse time of 15 ms.
3.2.7 MS/MS Data Collection and Processing
The mass transitions for each analyte and internal standard are listed in Table 3.1. For lab-scale
MS/MS analyses, precursor and product ion peak heights were recorded for the analyte and the
internal standard separately (in series) using Thermo Finnigan’s Xcalibur software (version 2.0).
Four replicates were evaluated for each condition, and calibration curves were generated by
plotting the analyte: internal standard product ion peak height ratios as a function of
concentration. Linear regressions were generated using IGOR Pro (Version 5.0.4.8,
WaveMetrics, Inc., Lake Oswego, OR, USA). Limits of quantitation (LOQ) were calculated as
the concentration of analyte corresponding to the average response from blank measurements
(extracts from dried urine containing no analyte) plus ten times the standard deviation of the
average blank response. For mini MS/MS analysis, cocaine and cocaine-d3 precursor ions were
isolated and fragmented simultaneously, allowing for coincident collection of product ion scans.
Product ion peak areas were extracted from raw data using PTC Mathcad (PTC, Needham, MA,
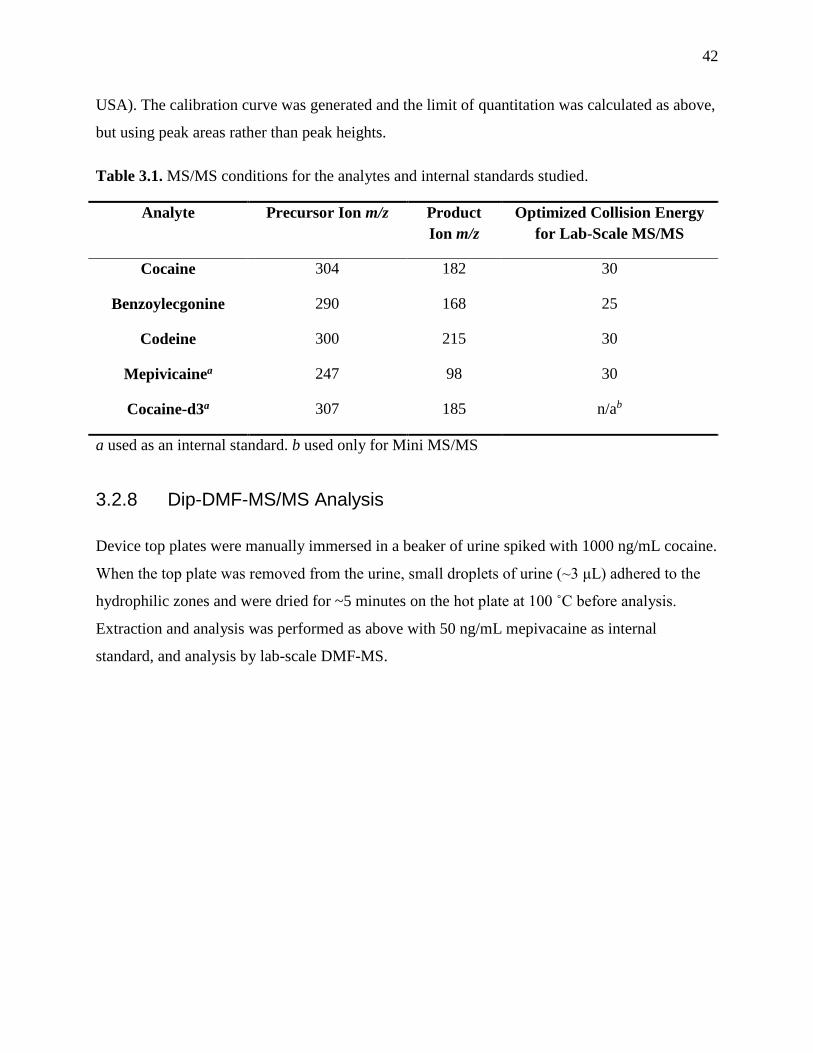
42
USA). The calibration curve was generated and the limit of quantitation was calculated as above,
but using peak areas rather than peak heights.
Table 3.1. MS/MS conditions for the analytes and internal standards studied.
Analyte Precursor Ion m/z Product
Ion m/z
Optimized Collision Energy
for Lab-Scale MS/MS
Cocaine 304 182 30
Benzoylecgonine 290 168 25
Codeine 300 215 30
Mepivicainea 247 98 30
Cocaine-d3a 307 185 n/ab
a used as an internal standard. b used only for Mini MS/MS
3.2.8 Dip-DMF-MS/MS Analysis
Device top plates were manually immersed in a beaker of urine spiked with 1000 ng/mL cocaine.
When the top plate was removed from the urine, small droplets of urine (~3 μL) adhered to the
hydrophilic zones and were dried for ~5 minutes on the hot plate at 100 ˚C before analysis.
Extraction and analysis was performed as above with 50 ng/mL mepivacaine as internal
standard, and analysis by lab-scale DMF-MS.

43
3.3 Results and Discussion
3.3.1 Sample Processing
A digital microfluidic system was developed to extract analytes from dried urine. As far as we
are aware, this is the first microfluidic device (of any format) to be used for this application; we
speculate that the “dried-sample” format might be difficult to integrate with enclosed
microchannels because of the risk of channel clogging. The device is shown in Figure 3.1, and
has four extraction modules distributed in a format similar to that reported previously for other
applications.146 In a typical analysis, four 20 L urine samples were loaded onto the device and
then processed (extracted, desalted, and mixed with internal standards) in parallel, and analyzed
sequentially by nanoESI-MS via embedded pulled-glass capillary emitters.
In initial experiments, samples were loaded and dried directly onto Teflon-coated device bottom
plates (as was done previously with blood samples37), but this strategy was abandoned after
observing that sections of the dried urine would break off during extraction, resulting in
suspended dried urine particles in the extract droplet which interfered with droplet movement
and analysis. To circumvent this problem a new strategy was developed, appropriating a
fluorocarbon liftoff technique developed originally for on-chip cell culture46 to form hydrophilic
sample “anchors” on the device top plate. Several circular anchor sizes were evaluated; for the
work reported here, 2 mm dia. anchors were used as they offered the best compromise between
keeping the dried sample adhered to the device surface while facilitating facile splitting of
extract droplets from the sample after extraction. We propose that the strategy of using
hydrophilic anchors for dried samples may be useful for other applications in the future.
Figure 3.2 illustrates the steps involved in extraction from a dried urine zone. A 22 μL aliquot of
extraction solvent was loaded into the reservoir (Fig. 3.2A), driven to the dried urine zone (Fig.
3.2B), and extracted for 5 minutes by cycling the droplet between the adjacent extraction
electrodes (Fig. 3.2C-E). After extraction, the droplet was split from the dried urine zone and
driven to the final electrode for analysis, where it filled the nanoESI emitter by capillary action
(Fig. 3.2F). As shown, a large fraction of the solvent droplet (~90% estimated by area) was
delivered to the emitter, while the remainder stayed adhered to the hydrophilic anchor (a

44
phenomenon known as passive dispensing46). After the nanoESI emitter was filled, electrospray
was generated by applying spray voltage to the top-plate electrode. The internal standard (IS)
was included in the extraction solvent droplet (mepivacaine or cocaine-d3) to compensate for
samples losses and evaporation.
Figure 3.2. Series of images illustrating a digital microfluidic extraction from dried urine.
(A) A reservoir is filled with extraction solvent (methanol containing internal standard).
(B-D) The solvent is then driven to the dried urine, where it is actuated back-and-forth and
incubated. (E,F) After incubation, the droplet is moved to the final electrode, where it fills
the pulled glass emitter by capillary action. The top plate is transparent, and the solvent
includes dye to improve visibility. A movie corresponding to these images can be found in
the online supplementary information
(http://pubs.acs.org/doi/suppl/10.1021/ac5012969/suppl_file/ac5012969_si_002.mp4) .
The salt content of urine can be troublesome for ESI-MS analysis, as high salt concentrations
cause ion suppression.148 For this reason, standard urine analysis protocols include an extraction
step (liquid-liquid or solid phase extraction) prior to analysis.119 In the method presented here,
we developed a procedure for extracting dried urine zones with methanol (MeOH). The
A B C
D E F
Dried
Urine Spot
Solvent
Droplet
nESI
Emitter

45
mechanism is depicted in Figure 3.3A; drugs are extracted into MeOH droplets, while some of
the salt is left behind in the dried urine zone (exploiting the low solubility of salts in MeOH).
This procedure is fast and automated, and eliminates steps that are traditionally used in liquid-
liquid extraction procedures such as centrifugation to remove particulates and separation of the
extract from the liquid urine sample.119
Figure 3.3. Sample cleanup and conductivity measurements. (A) Side-view scheme (left-to-
right) illustrating the selective extraction of drug from dried urine. (B) Conductivities of
samples diluted in 13 mL of diH2O. Identities: Blank H2O = 80 μL diH2O, Blank MeOH =
80 μL neat MeOH, urine control = 80 μL neat urine, DMF Extract = DMF-generated 80 μL
MeOH extract from neat urine, Urine control (spiked) = 80 μL urine containing 50 ng/mL
cocaine, DMF extract (spiked) = DMF-generated 80 μL MeOH extract from urine spiked
with 50 ng/mL cocaine. Error bars represent ± 1 SD, n=4.

46
To evaluate the efficacy of the DMF extraction method for separating analytes of interest from
the urine matrix, we compared the conductivities of samples before and after extraction. As
shown in Figure 3.3B, the conductivities of unextracted urine and urine extracts are 82.0 ± 6.7
and 25.5 ± 4.0 S/cm, respectively, representing nearly 70% reduction in conductivity. As
expected, this trend was observed for samples with and without analyte. The blank sample
conductivity was 5.0 ± 1.4 S/cm, which suggests that the salt content in the extracts is not zero;
in the future, if additional de-salting is necessary, this procedure might be performed multiple
times in series (i.e., extract from urine, move and dry to form an intermediate dried spot, extract
again). Alternatively, a liquid extraction might be replaced with a DMF solid-phase extraction.149
For the work reported here, the salt-reduction in a single liquid-extraction was sufficient for
analysis.
3.3.2 Quantitative Analysis
As a first step toward a portable analysis system, methods were developed to quantify three
analytes (cocaine, BZE, and codeine) in dried urine on DMF devices using a lab-scale tandem
mass spectrometer (m/z transitions and other parameters listed in Table 1). Four urine samples
can be analyzed using this method (including extraction and quantitation) in ~15min.
Representative spectra for cocaine, BZE and codeine extracted from dried urine on-device are
shown in Figure 3.4A-C. As shown, high-intensity product ion peaks are observed, as well as
peaks representing the precursor ion minus the loss of water. Calibration curves (Fig. 3.4D-F)
were generated by fitting lines of regression to the intensity ratios of drug product ions relative to
those of the IS as a function of drug concentration in the urine samples. As shown, the curves are
linear over multiple orders of magnitude, with R2 values of 0.9924, 0.9982 and 0.9805, for
cocaine, BZE and codeine, respectively. As shown, the precision at each concentration is
illustrated in error bars corresponding to the standard errors of those measurements, with %RSD
values ranging from 6.4 – 57.0%, 6.0 – 30.4%, 4.7 – 27.9% for cocaine, BZE and codeine,
respectively.

47
Figure 3.4. Lab-scale tandem mass spectrometry analysis of drugs extracted from urine in
DMF devices. Representative product ion spectra illustrate (A) the cocaine transitions 304
→ 182 (primary product ion), as well as 304 → 286 ([M+H-H2O]+), (B) the BZE transitions
290 → 168 (primary product ion), as well as 290 → 272 ([M+H-H2O]+), and (C) the codeine
transitions 300 → 215 (primary product ion), as well as 300 → 282 ([M+H-H2O]+).
Calibration curves are linear over two orders of magnitude for (D) cocaine, LOQ = 51

48
ng/mL, R2 = 0.9924, (E) BZE, LOQ = 21 ng/mL, R2 = 0.9989, and (F) codeine, LOQ = 39
ng/mL, R2 = 0.9805. The error bars represent ± 1SD, n = 4. Insets illustrate the lower end of
the calibration curves; the blue lines represent the LOQs.
The limits of quantitation (LOQs), defined as the concentration corresponding to the response of
the blank plus ten times the standard deviation of the blank response, were 51 ng/mL, 21 ng/mL
and 39 ng/mL, for cocaine, BZE, and codeine, respectively. These LOQ values are
approximately 10x higher than those reported for conventional laboratory methods (e.g., Otero-
Fernandez, et al.118 report LOQs of 0.87, 3.1, and 5.0 ng/mL for cocaine, BZE, and codeine,
respectively), but they are well below the standard cutoff values for quantifying drugs of abuse in
urine for confirmation analysis.118 When viewed in context of the speed of the new system (15
min from dried sample to answer), this performance is attractive, even in laboratory settings. But
our primary goal in this work was to develop a portable method, as described below.
After optimizing the method using a lab-scale mass spectrometer, the DMF system was
combined with the fully autonomous 25 kg Mini 12 mass spectrometer.131 The experimental
setup is shown in Figure 3.5A and is similar to that described above for lab-scale MS analysis. A
DMF device was positioned in front of the mass spectrometer; once a sample was extracted and
filled a nanoESI emitter, the sample was introduced to the Mini 12 via the discontinuous
atmospheric pressure interface (DAPI).147 The Mini 12 MS system is controlled using custom
software, and ions are isolated with a notched stored waveform inverse Fourier transform
(SWIFT).150 Since ion isolation is performed manually by tuning the frequency notch for each
ion under a unique set of conditions, it is desirable to limit the time used to complete ion
isolation and activation per analysis. Using an analyte/ internal standard pair with very close
precursor ion m/z ratios (m/z 304 for cocaine and m/z 307 for cocaine-d3) permits the
simultaneous isolation of both precursor ions for MS/MS analysis. In this case, the isolation
window was set to m/z 302-309, allowing both m/z 304 and m/z 307 to be isolated for sequential
fragmentation (Table 1). As shown in Figure 3.5B, the product ion scan for a representative Mini
12 MS/MS analysis contains peaks for both the cocaine and cocaine-d3 product ion peaks at m/z
182 and m/z 185, respectively, as well as unfragmented precursor ions at m/z 304 and m/z 307.

49
Figure 3.5. DMF-Mini-MS/MS analysis of dried urine spots. (A) Picture of DMF-Mini-12
set-up, with numbers indicating (1) Mini-12 miniature mass spectrometer. (2) Digital
microfluidic “DropBot” automation system, (3) MS interface, and (4) DMF device. (B)
Mass spectrum illustrating the transitions of cocaine (10 ng/mL) and internal standard,
cocaine-d3 (50 ng/mL). (C) Calibration curve for cocaine, LOQ = 40 ng/mL, R2=0.9990.
The error bars represent ± 1SD, n = 4. Inset illustrates the lower end of the calibration
curve; the blue line represents the LOQ.
A calibration curve for cocaine extracted from dried urine on DMF devices with analysis by the
mini 12 MS was generated by fitting a line of regression to the intensity ratio of the cocaine
product ion peak area relative to that of cocaine-d3 as a function of cocaine concentration for
seven different urine concentrations (Fig. 3.5C). The calibration curve is linear over the three
orders of magnitude with an R2 value of 0.9990 with an LOQ of 40 ng/mL. The precision at each
concentration is illustrated in error bars corresponding to the standard errors of those
measurements, with %RSD values ranging from 12.3 – 55.7%. Interestingly the LOQ of this new
portable DMF-mini MS/MS method is lower than the minimum required performance limit
(MRPL) outlined by the United Nations Office on Drugs and Crime for laboratory quantitation
of cocaine in urine: 50 ng/mL.116 More importantly, the LOQ of the new method is far lower
than the 300 ng/mL cut-off levels150-152 reported for the portable immunoassays that are routinely

50
used for on-site analysis of drugs in urine. An advantage of immunoassays (e.g., the Alere
Triage® TOX Drug Screen) is their low cost – they are often formed from paper substrates and
are less expensive than the glass DMF devices used here. But we note that methods were
recently reported for forming low-cost DMF devices from paper,10 an innovation that may
eventually enable single-use DMF tests with consumables costs comparable to those of
immunoassays. Because cocaine is extensively metabolized, future work will focus principally
on the detection of its major metabolite, benzoylecgonine.
The results shown in Figure 3.5 validate the use of DMF extraction coupled to the mini 12 MS
for quantitation of cocaine in urine. Future work will focus on developing a fully field-
deployable system for on-site quantitative analysis of drugs of abuse in urine and other biological
samples, taking advantage of the backpack mass spectrometer format137 to exploit the ease of
portability. Toward this goal, we developed a rapid sampling system that we call “Dip-DMF,”
illustrated in Figure 3.6A-C. Dip-DMF exploits the difference in surface energies between the
ITO anchors and the bulk Teflon-AF surface of the devices used here to quickly and easily
deposit urine samples onto the device top-plate. As shown, arrays of sample droplets can be
generated in seconds using Dip-DMF, which (after drying) can be analyzed using the methods
described herein (Fig. 3.6D).

51
Figure 3.6. Dip-DMF. (A-C) Pictures demonstrating the generation of an array of samples
in seconds onto the hydrophilic sites of the device top-plate. The inset in C shows a ~3 μL
urine spot adhered to a hydrophilic spot. (D) Representative product-ion mass spectrum of
cocaine extracted from dried, dip-loaded urine, illustrating the cocaine transitions 304 →
182 (primary product ion), as well as 304 → 286 ([M+H-H2O]+).

52
3.4 Conclusion
In summary, we have developed a digital microfluidic platform coupled to a miniature mass
spectrometer for the quantitation of drugs of abuse in urine. The figures of merit for the new
technique are compatible with the performance criteria for laboratory analyses established by the
United Nations Office on Drugs and Crime. The proof-of-concept results presented here suggest
the possibility of a new paradigm for drug screening in which a single-tier test performed in the
field might replace the two-tier system (one in the field and a second in the laboratory) used
today. More generally, we propose that the combination of microfluidics and miniature mass
spectrometry represents a powerful new tool for portable, on-site “laboratory quality” analysis
for a wide range of applications.

53
Chapter 4 Attractive Design: An Elution Solvent Optimization Platform for
Magnetic-bead based Fractionation using Digital Microfluidics and Design of Experiments
There is great interest in the development of integrated tools allowing for miniaturized sample
processing, including solid phase extraction (SPE). We introduce a new format for microfluidic
SPE relying on C18-functionalized magnetic beads that can be manipulated in droplets in a
digital microfluidic platform. This format provides the opportunity to tune the amount (and
potentially the type) of stationary phase on-the-fly, and allows the removal of beads from
electrodes (to enable other operations in same device-space), maintaining device
reconfigurability. Using the new method, we employed a design of experiments (DOE) operation
to enable automated on-chip optimization of elution solvent composition for reversed phase SPE
of a model system. Further, conditions were selected to enable on-chip fractionation of multiple
analytes. We anticipate this combination of properties will prove useful for separating a wide
range of analytes – from small molecules to peptides – from complex matrices.

54
4.1 Introduction
Solid phase extraction (SPE) is a versatile extraction technique in which analytes partition
between two phases – a liquid solvent and a solid sorbent.153 In a typical SPE experiment, the
analyte of interest is adsorbed onto the solid phase (and the original solvent is washed away) and
then is eluted in a more concentrated and purified form. SPE is widely used in diverse fields
ranging from pharmacokinetics,154 to forensics,155-156 to environmental and biological trace
analysis,157-160 and food analysis.161-162
Recently, there has been great interest in the use of microfluidics-based “lab on a chip”
technologies for the integration of sample delivery, separation, and detection on-chip.163 Many
different formats of microchannel-based devices designed for SPE have been reported, including
channels coated with stationary-phase materials,164 channels packed with beds of beads,165-167
channels incorporating porous membranes,168 and channels bearing porous polymer monoliths
(PPMs).169 Microchannel-based methods are useful for many applications (and are particularly
well suited for integration with separations), but they are not a universal solution appropriate for
all applications; for example, complexities related to “world-to-chip” interfacing make
microchannel-based devices challenging to use when screening many different solvents and
elution conditions for method optimization.
Digital microfluidics (DMF) is an alternative to microchannels for miniaturized analysis. In
DMF, discrete droplets of liquid are manipulated via electrodynamic forces on the surface of an
insulated two dimensional array of electrodes.6, 170 While sharing some features with
microchannels, DMF is particularly well suited for applications incorporating solid materials into
analytical workflows26, 41-42, 146, 171 (as there is no risk of clogging) and for applications requiring
the generation of arbitrary mixtures on device (e.g., serial dilutions100 and tunable gel
compositions44). As a consequence of the flexibility with which liquids can be automatically
merged, mixed, and dispensed using DMF, we hypothesized that it would be a useful platform
for on-chip optimization of solvent conditions for SPE.
The first techniques for performing SPE on DMF were recently reported,47-48 the first of which
used PPMs with C12 alkyl moieties (for reversed phase applications) as a solid phase and the
second used sulfonate-functionalized PPMs for strong cation exchange (SCX) SPE. Droplets
55
were driven to and from the stationary and permanent PPM structures to enable the various steps
required for extraction (equilibration/activation, loading, rinsing, eluting, etc.). PPMs are a useful
format for SPE, but they have some disadvantages, including being static – once formed, their
size, volume, and porosity cannot be changed. An ideal SPE system would have a reconfigurable
stationary phase system that could be tuned depending on the application.
Here we report a new digital microfluidic method for SPE, using magnetic beads functionalized
with C18 alkyl moieties for reversed phase fractionation. We propose that this represents an
improvement over previous work with PPMs – the C18-coated magnetic beads enable DMF-
based SPE while (a) providing the opportunity to tune the amount (and potentially the type) of
sorbent on-the-fly, and (b) allowing the removal of beads from electrodes (to enable other
operations in same device-space), maintaining device reconfigurability. Furthermore, this
innovation enables demonstration of a unique capability of DMF, (c) fully automated on-chip
optimization of the elution solvent composition. Finally, upon optimization, conditions were
selected to allow for (d) on-chip fractionation of multiple analytes. We anticipate this
combination of properties (a-d) will prove useful for separating a wide range of analytes – from
small molecules to peptides – from complex matrices.

56
4.2 Experimental
4.2.1 Reagents and Materials
Unless otherwise specified, all chemicals were purchased from Sigma-Aldrich (Oakville,
Ontario) and were used without modification. HPLC-grade acetonitrile and methanol were
purchased from Fisher Scientific (Ottawa, Ontario). Cleanroom supplies included Parylene C
dimer from Specialty Coating Systems (Indianapolis, Indiana) and Teflon AF from Dupont
(Wilmington, Delaware). Magnetic beads (1 µm dia.) with C18 aliphatic functionality (SiMAG-
Octadecyl) were purchased from Chemicell GmbH (Berlin, Germany). Sitamaquine and 2H10-
sitamaquine were graciously provided by GSK (Stevenage, UK).
4.2.2 DMF Device Fabrication and Operation
DMF device bottom plates were formed bearing a 15-by-4 array of driving electrodes (2 mm × 2
mm) and 8 reservoir electrodes (16 mm × 6 mm). To form the electrode array, glass slides
precoated with chromium (200 nm) and photoresist (AZ1500, 530 nm) (Telic Co., Santa Clarita,
California) were patterned via photolithography and wet etching in the Toronto Nanofabrication
Centre cleanroom at the University of Toronto as described previously.172 The finished DMF
bottom plates were coated with a layer of Parylene C dielectric (7 µm) by vapour deposition
(Specialty Coating Systems) and spin coated with a layer of Teflon AF (50 nm, 30 s, 1000 rpm)
followed by postbaking on a hot plate (160 ºC, 10 min).
DMF top plates were formed from indium tin oxide (ITO)-coated glass (Delta Technologies Ltd.,
Stillwater, Minnesota) spin coated with a layer of Teflon AF (50 nm, as above). DMF top and
bottom plates were assembled by sandwiching them together with three layers (270 µm) of
double-sided tape (3M, London, Ontario) as spacers.
An automated control system with integrated moveable magnetic lens (described in detail
elsewhere173) was used to actuate droplets by applying electrical potentials (100 - 120 VRMS, 10
kHz) to successive DMF electrodes. To immobilize magnetic beads, a magnetic lens was moved
vertically (by means of the integrated step-motor) beneath the DMF device.

57
4.2.3 Solid-Phase Extraction
A six-step method (Figure 4.1 top) was developed to implement solid-phase extraction using
magnetic beads. At the beginning of each experiment, C18 magnetic beads were prepared in
aqueous suspension (5 mg/mL) and were pipetted onto a device in 10 µL aliquots (step 1), each
forming a “bed” of beads. To remove liquid from beads (for this step and in all stages of the
extraction process), the automated control system’s magnetic lens was engaged, immobilizing
the beads on the device surface, allowing the liquid to be moved away via DMF actuation. The
magnetic beads were activated with acetonitrile (10 µL droplet, step 2) and rinsed with water (10
µL droplet, step 3) on-device. Extractions then proceeded with sample loading and incubation
(10 µL droplet, 5 min, step 4) with droplet mixing via DMF actuation, washing twice with water
(2 × 10 µL droplets, step 5) and elutions with an appropriate solvent (10 µL droplet, step 6).
Each of steps (2) – (6) comprised three operations (Fig. 4.1 bottom), including (i) engulfing
beads in solvent, (ii) mixing beads within solvent, and (iii) removing solvent from beads.
Figure 4.1. DMF-magnetic bead-SPE. Top: process flow diagram for the six-step SPE
method: (1) dispense, (2) activate, (3) wash, (4) load, (5) wash, and (6) elute. Bottom:
cartoon (main panels) and pictures (insets) depicting the three fundamental operations
employed in steps 2-6: (i) engulf beads with droplet, (ii) suspend beads and mix, and (iii)
immobilize and remove solvent. In (i) and (iii) the magnetic lens is engaged by positioning it
close to the device; in (ii), the magnetic lens is disengaged by moving it away from the
device.

58
4.2.4 Loading Capacity and Equilibrium Characterization
To measure the loading capacity of C18 magnetic beads, aqueous samples of fluorescein (10 µL
droplet, 0.1% trifluoroacetic acid, TFA) of varying concentrations (0.01, 0.1, 1, 10, and 100
mg/mL) were loaded onto single beds of C18 magnetic beads and incubated with mixing for 5
minutes. The sample droplets were driven away from the beads and the concentrations of
remaining (unadsorbed) fluorescein in the droplets were measured off-device with a plate reader
(PheraStar, BMG Labtech, Durham, NC) (λex, 480 nm; λem, 520 nm). Experiments were
performed in triplicate for each concentration.
To characterize loading equilibrium of sitamaquine, the above experiment was repeated in
triplicate with aqueous sitamaquine (10 µL droplet, 1 µg/mL). The concentration of sitamaquine
remaining in the recovered sample droplet was quantified using an LTQ nESI-MS/MS (Thermo
Scientific, Waltham, MA) operating in selected reaction monitoring (SRM) mode. Prior to
analysis, each eluate (~10 µL droplet) was combined with a 10 µL aliquot of internal standard
(2H10 – Sitamaquine, 500 ng/mL in acetonitrile) and diluted to a volume of 100 µL with
acetonitrile/water (1:1, v/v) containing 0.1% formic acid off-chip. Samples were analyzed in
positive ion mode, with the applied spray voltage varied between 1.2 – 1.5 kV. The flow rate of
the syringe pump and capillary temperature were kept constant at 0.5 µL/min and 350ºC,
respectively. High purity (99.995%) helium gas (output pressure from tank = 135 ± 70 kPa) was
used for collision activated dissociation, and SRM mass transitions of 344 to 271 and 354 to 271
were monitored for sitamaquine and its internal standard (IS). Spectra were collected as an
average of ten acquisitions using Thermo FinniganTM Xcalibur® software (Version 2.0). The
ratios of peak intensities (sitamaquine:IS) of the product ions were recorded and used for
quantitation. The logarithm of the loading equilibrium constant (logK) was then estimated using
equation 1:
𝐾 =𝑛𝑠
𝑛𝑚×
𝑉𝑚
𝑉𝑠 (1)
where ns represents the moles of analyte in the stationary phase, nm the moles of analyte in the
mobile phase, Vm the volume of the mobile phase, and Vs the volume of the stationary phase.
59
4.2.5 On-Chip Solvent Composition
Using a programmed sequence of DMF actuation steps, mixtures of solvents were
composed automatically on-device. Reservoirs were filled with neat solvents (water, acetonitrile
and methanol). Solvent droplets the size of a single actuation electrode (unit droplets, 2.5 µL)
were dispensed from reservoirs, and combined and mixed in the desired proportions to form
appropriate solvent mixtures for elution experiments.
4.2.6 Design of Experiments for Elution Solvent Optimization
Design of experiments was performed using JMP (SAS, Cary, North Carolina). A simplex-
centroid model was used to choose the required experimental data points for combinations of
acetonitrile, methanol, and water. As a result of this model, seven elution solvent combinations
were chosen – the three neat solvents, the three binary mixtures (1:1 proportions, v/v), and the
1:1:1 (v/v) ternary mixture of the solvents. Extractions of separate aqueous solutions of
sitamaquine (10 L droplet,1 µg/mL) and angiotensin I (10 L droplet, 50 µg/mL) were
performed as described above, eluting with the solvent mixtures generated on-chip (prescribed
by the model). ESI-MS/MS was used to quantify recovered sitamaquine (as described above) and
ESI-MS was used to quantify recovered angiotensin I. For the latter, each eluate (~10 µL
droplet) was combined with 10 µL of internal standard (bradykinin, 10 µg/mL in
acetonitrile/water, 1:1, v/v with 0.1% formic acid) and diluted to a volume of 100 µL with
acetonitrile/water (1:1, v/v) containing 0.1% formic acid off-chip. Samples were analyzed in
positive ion mode, with applied spray voltage varied between 1.2 – 1.5 kV, the flow rate of the
syringe pump and capillary temperature were kept constant at 0.5 µL/min and 200ºC,
respectively. The triply protonated peaks ([M+3H]3+) of angiotensin I (433 m/z) and bradykinin
(354 m/z, IS) were monitored, and the ratios of peak intensities (analyte:IS) were used for
quantitation. Spectra were collected as an average of ten acquisitions using Thermo FinniganTM
Xcalibur® software (Version 2.0).
A number of designs have been developed to address specifically the analysis and modeling of
mixtures.174 The experimental data were fit with a particular three-component (i, j, k) model

60
known as the special cubic model, which involves the same number of terms as there are points
in the associated simplex centroid design (equation 2):
�̂� = ∑ 𝑏𝑖𝑥𝑖
𝑖
+ ∑ ∑ 𝑏𝑖𝑗𝑥𝑖𝑥𝑗
<𝑗𝑖
+ ∑ ∑ ∑ 𝑏𝑖𝑗𝑘𝑥𝑖𝑥𝑗𝑥𝑘 (2)
<𝑘<𝑗𝑖
where �̂� is the predicted extraction efficiency, 𝑥𝑛 (n=i,j,k) is the solvent fraction, 𝑏𝑖 is the linear
blending coefficient, 𝑏𝑖𝑗 is the coefficient representing binary effects, and 𝑏𝑖𝑗𝑘 is the coefficient
representing ternary effects. For comparison, a web-based Abraham solvation equation175
calculator (http://showme.physics.drexel.edu/onsc/models/AbrahamDescriptorsModel001.php)
was used to predict the solubilities of sitamaquine (molar volume 332.3 ± 3.0 cm3, molar
refractivity 108.7 ± 0.3 cm3, SMILES CCN(CC)CCCCCCNc1cc(cc2c1nccc2C)OC) in water,
acetonitrile, and methanol.
4.2.7 Evaluation of Extraction Efficiency
The extraction efficiency of C18 magnetic beads on DMF was compared to that of commercial
C18 ZipTips® (Millipore, Toronto, Ontario). DMF-based extractions were performed with
sitamaquine and angiotensin I as described above, eluting each sitamaquine sample in a 10 L
droplet of neat methanol and each angiotensin I sample in a 10 L droplet of 1:1
acetonitrile:water. The same solvents were used to extract these analytes using C18 ZipTips®
following the manufacturer’s instructions. Briefly, C18 ZipTips® were activated by aspirating
and expirating acetonitrile (10 µL), washed by aspirating and expirating water (10 µL), loaded
with sample (10 µL) by repeatedly (5x) aspirating and expirating the sample, then rinsed twice
by aspirating and expirating volumes of water (10 µL). Finally, two elution steps were performed
with the appropriate solvent mixture, repeatedly (10x) aspirating and expirating two volumes of
elution solvent. Eluted sitamaquine and angiotensin I concentrations were quantified via ESI-
MS/MS and ESI-MS, respectively, as described above.
4.2.8 Sample Fractionation
An aqueous mixture of sitamaquine and angiotensin I (1 µg/mL and 50 µg/mL,
respectively) was loaded and extracted via DMF actuation using C18 beads as described above.

61
The first elution step was performed with methanol and the second elution step was performed
with 1:1 acetonitrile:water (v/v). The two eluted fractions were collected and individually
analyzed for sitamaquine and angiotensin I via ESI-MS/MS and ESI-MS, respectively (as
above). For this analysis, each eluate (~10 µL droplet) was spiked with a 10 µL aliquot of
aqueous IS solution (500 ng/mL 2H10-sitamaquine, 10 µg/mL bradykinin) and diluted to a
volume of 100 µL with acetonitrile/water (1:1, v/v) containing 0.1% formic acid off-chip, before
being analyzed as described above. In this case, the doubly protonated peak of bradykinin (531
m/z) was used for quantitation instead of the triply protonated peak (354 m/z).
62
4.3 Results and Discussion
4.3.1 DMF-magnetic bead-SPE
There are two previous examples of solid phase extraction (SPE) implemented by digital
microfluidics,47-48 both relying on stationary porous polymer monolith discs. Here, we sought to
improve upon these techniques by taking advantage of another trend in digital microfluidics – the
use of magnetic particles for immunoassays,26, 51-53, 173, 176-177 cell manipulation,50, 178 and protein
immuno-depletion.179 Magnetic particles are useful in a wide range of settings, as they can form
high surface-area sorbents for heterogeneous applications, but also their positions can be
manipulated relative to that of the solvent (or other system components) using magnetic fields.
Here, we used an integrated instrument with a motorized magnetic lens (developed originally for
immunoassays, described in detail previously173) that allows for reversible immobilization of
magnetic particles to the surface of DMF devices, to explore whether this technique is suitable
for reversed-phase solid-phase extraction.
In this work, we used 1 m dia. C18-functionalized magnetic particles to develop a six-step SPE
method, in which (1) a bed of beads (estimated to be ~9×10⁷ beads, 9×10⁻⁵ cm3) is formed, (2)
the C18 functionality of the beads is activated with an appropriate solvent, (3) the beads are
washed, (4) the sample is loaded and incubated on the beads, (5) the beads are washed again, and
(6) the analytes are eluted from the beads (Figure 4.1, top). These steps are achieved through a
repeating series of three operations: (i) a droplet is dispensed, driven to the beads, and moved
such that they become dispersed, (ii) the suspension is actively mixed and incubated, and (iii) the
beads are immobilized and spent solution (supernatant) driven away (Figure 4.1, bottom). The
entire six-step extraction process can be completed in ~10 min, with up to three extractions
implemented in parallel.
In initial experiments, it was found that the Pluronic droplet-additives (amphiphilic co-block-
polymers of polyethylene oxide and polypropylene oxide) that are often used in DMF to reduce
non-specific adsorption (which can impede droplet movement) to the fluoropolymer-coated
device surfaces,180-181 were incompatible with this process, resulting in a significant drop in
extraction performance, likely caused by micellar encapsulation of hydrophobic analytes and/or
coating of the particle surfaces with adsorbed pluronic. Thus, pluronic additives were not used in

63
the work reported here; this was not observed to present any hindrance to droplet movement or
result in appreciable sample loss. In the future, depending on the application, it may be necessary
to explore alternate anti-fouling strategies that are compatible with C18 magnetic beads
(potentially including the use of DMF device coatings designed to resist fouling).182
4.3.2 Loading Capacity, Saturation, and Equilibrium
The new DMF-magnetic bead-SPE method was evaluated for loading capacity over a wide range
of concentrations of a model analyte (fluorescein), by evaluating the fluorescence intensity of
analyte in the supernatant (the droplet at the end of step 4, above) relative to that of the un-
extracted sample. As shown in Figure 4.2A, ~10% of the sample remained unbound for initial
concentrations of 1 – 1000 μg/mL, indicating that these quantities of fluorescein loaded
successfully without saturation. At concentrations of 10 mg/mL and higher, the magnetic beads
became saturated, resulting in a drop in loading with >80% of sample remaining unbound.
Saturation in solid phase extraction is an annoying problem that can be costly in terms of time
and funds (i.e., new experiments must be repeated with new SPE cartridges with larger sorbent
beds). This problem is magnified in microfluidic SPE systems – the relative cost and complexity
of devices with permanent, single-size sorbent beds (whether implemented in microchannels164-
169 or by DMF47-48) makes the process of disposing and replacing them unattractive. This
problem can be solved when using the methods described here – on a given device, the sorbent
size can be determined on-the-fly. As shown in Figure 4.2B, it is trivial to form sorbent beds
containing different numbers of beads (in this example, ~5.4×10⁷ on the left, and ~1.08×10⁸ on
the right). The flexibility and adaptability of using magnetic beads on DMF could thus be
advantageous in applications in which devices are precious or must be reused.
After establishing convenient (generic) working conditions for the new procedure, we turned our
attention to the antimalarial drug sitamaquine, to serve as a model for small-molecule
pharmaceutical analytes. The equilibrium constant for adsorption of sitamaquine to the stationary
phase was estimated by extracting a 1 µg/mL solution and measuring the fraction of (unretained)
analyte remaining in the sample droplet (by tandem mass spectrometry) post-extraction (1.45%).
This data, along with the known volume of the mobile phase (10 L) and the estimated volume
of the stationary phase (6.03×10⁻⁷ mL, assuming the stationary phase on a single magnetic bead

64
is a shell with uniform thickness equivalent to the approximate length of an octadecyl alkane
chain 2.14 nm), was used to estimate the equilibrium constant using Equation 1. The equilibrium
logK was found to be ~6, which fits comfortably in the range of solute-sorbent equilibria that are
commonly reported for SPE. 183-184
Figure 4.2. Loading capacity and bead bed size in DMF-magnetic bead-SPE. (A) Plot of the
ratio of fluorescence intensity of supernatant droplets (post-extraction) relative to that of
stock solution as a function of fluorescein concentration. All experiments used sorbent beds
formed from 10 L of bead suspension (~9×10⁷ beads, ~9×10⁻⁵ cm3). Error bars represent ±
1 SD, n=3. (B) Pictures of sorbent beds formed from 6 L (left) (~5.4×10⁷ beads, ~5×10⁻⁵
cm3), or 12 L (right) of bead suspension (~1.08×10⁸ beads, ~1×10⁻⁴ cm3).

65
4.3.3 Elution Solvent Optimization
After developing a DMF-magnetic bead-SPE method, we turned our attention to optimization of
elution solvents. While there are macro-scale (robotic) systems that can perform automated
elution optimization in SPE,185-187 there are no reports (to our knowledge) of a microfluidic
system with this capacity. DMF seems well-suited for this task because of its ability to generate
custom solvent mixtures on-the-fly. For example, by dispensing unit droplets of neat water,
methanol, and acetonitrile from reservoirs, solvents can be combined and mixed in appropriate
proportions on-chip to generate a library of elution solvents with the desired compositions
(Figure 4.3). This library can then be used to determine the optimum elution solvent combination
for different analytes.
Figure 4.3. Still frames from a video demonstrating the generation of custom solvent
mixtures on DMF. Acetonitrile, methanol, and DI water (ACN, MeOH, and H2O, labeled
with yellow, green, and red dyes for visualization) in reservoirs (A) are dispensed in desired
proportions (B) and mixed together (C-E) to form elution solvents with desired

66
compositions (in this case, 1:1 ACN:H2O and 2:1:1 H2O:ACN:MeOH). Once formed, the
droplets can be used to elute analytes from the C18 magnetic beads (F).
Two model analytes were used, including sitamaquine as a representative small-molecule drug
and angiotensin I as a representative peptide. Elution solvent optimization was guided using a
common method for the systematic evaluation of new protocols: the chemometric technique
known as “design of experiments” (DOE).188-190 Using a simplex centroid design, seven solvent
combinations were chosen and extraction efficiencies evaluated by mass spectrometry
(comparing recoveries in each of the seven elution solvent mixtures) for both sitamaquine and
angiotensin I. The resulting data was fit with the special cubic function (Equation 2) to generate
response surface model plots (Figure 4.4). In the case of sitamaquine, a general trend of
increasing extraction efficiency with increasing organic fraction of the elution solvent was
observed, with neat methanol yielding a greater efficiency than neat acetonitrile (Fig. 4.4A).
These results are in agreement with the trend predicted for sitamaquine solubilities
(methanol>acetonitrile>water) according to the Abraham general solvation model.175 In the case
of angiotensin I, a 1:1 acetonitrile/water mixture yields the greatest extraction efficiency (Fig.
4.4B). This result is consistent with the common practice191 of using aqueous/acetonitrile mobile
phases for reversed phase separations of peptides by HPLC. While the two model analytes used
here (sitamaquine and angiotensin I) are well-characterized, we propose that in the future, DMF
may be used to automatically optimize extraction protocols for unknown analytes on-the-fly,
reducing time and labour associated with method development.
Using the elution solvents optimized through DOE, the extraction efficiencies for sitamaquine
and angiotensin I were compared between C18 magnetic beads on DMF and the popular
commercial SPE product, the C18 ZipTip® (EMD Millipore, Billerica, MA, USA). For both
analytes, extraction efficiencies were similar (Figure 4.5). With comparable performance to an
established microscale SPE technique, C18 magnetic beads offer a promising platform for DMF-
based SPE with droplet samples.

67
Figure 4.4. Response surface model plots for extraction efficiency of sitamaquine (A) and
angiotensin I (B) in mixtures of DI water (H2O), acetonitrile (ACN), and methanol
(MeOH), where dark color represents increased analyte recovery. Optimal extraction
efficiency occurs with 100% methanol for sitamaquine (lower right, A) and 1:1
acetonitrile:water for angiotensin I (left, middle, B). Each plot was generated by measuring
the extraction efficiencies (using mass spectrometry) for each of the seven solvent
conditions.
Figure 4.5. Solid phase extraction efficiencies measured for sitamaquine and angiotensin I
using C18 magnetic beads on DMF (green) compared to identical extractions performed

68
using C18 ZipTips® (pink). The performance of the extractions is comparable for both
analytes. Error bars represent ± 1 SD, n=3.
4.3.4 Sample Fractionation
Fractionation is an important separation technique when multiple analytes of interest are present
in a mixture. By selectively desorbing each analyte from the stationary phase, analytes can be
collected in separate fractions for individual analysis. In the case of a mixture of sitamaquine and
angiotensin I, the DOE results described above suggested that the two model analytes
(sitamaquine and angiotensin I) might be selectively eluted under different solvent conditions.
As per Figure 4.4, neat methanol, the optimal elution solvent for sitamaquine, only elutes ~5-
10% of angiotensin I. Similarly, 1:1 acetonitrile/water, the optimal elution solvent for
angiotensin I, only elutes ~10-15% of sitamaquine. Thus, we hypothesized that two successive
elutions – first neat methanol, followed by 1:1 acetonitrile/water – might be used to elute a
sitamaquine fraction followed by an angiotensin I fraction. As shown in Figure 4.6, fractionation
was largely successful with little (<10%) co-elution.
Figure 4.6. Fractionation of a mixture of sitamaquine (blue) and angiotensin I (red) using
DMF-magnetic bead-SPE. Representative mass spectra (A) and % recoveries (B) for
elution in methanol (first) and in 1:1: ACN:H2O (second). Error bars represent ± 1 SD,
n=3.

69
The successful analysis of complex mixtures is a significant challenge, and solid-phase
extraction represents one of many in a suite of techniques that has been employed for this
purpose.192 For example, on the microscale, SPE beds in microchannels have been paired with
electrokinetic fractionation to pre-concentrate samples prior to further analysis.193 We propose
that the automated digital microfluidic strategy for fractionation and pre-concentration described
here represents a useful new option for on-chip sample processing of mixtures.

70
4.4 Conclusion
We have demonstrated a new format for solid phase extraction (SPE) making use of digital
microfluidics and functionalized magnetic particles. The new format enables digital microfluidic
SPE without compromising the reconfigurability inherent to the technique. Further, we
demonstrated that the new technique is compatible with automated solvent optimization and
multi-analyte fractionation. We propose that this suite of properties will make DMF-magnetic
bead-SPE an attractive new tool for a wide range of applications.

71
Chapter 5 Exploring the Utility of Digital Microfluidics for the Extraction of
Multiple Hormones from Blood and Tissue
Analysis of hormones is of paramount importance in a range of applications. Whether to assess a
patient’s risk of developing hormone-sensitive cancers over time or to monitor a patient’s
response to hormone replacement therapy, the routine analysis of hormones offers the
opportunity to take a personalized approach to medicine. A complication arises in cases in which
knowing hormone concentrations in tissue is more important than knowing those in blood; the
invasiveness of routine tissue sample collection, which can lead to permanent scarring (and in
addition, all the risks related to general anesthetics) makes routine analysis practically
impossible. Here we build on methods described previously for evaluating estradiol (E2) in
blood and tissue samples to allow for multiplexed quantitation of E2, testosterone,
androstenedione, and progesterone in blood. Further, we present preliminary evidence that these
techniques can be used to analyze core needle biopsy (CNB) samples of tissue, which can be
collected outside of a hospital without general anesthesia. The work described here is not yet
complete (and is subject to on-going method development, collection of new results, and
validation), but these preliminary results suggest potential for clinical applications requiring
frequent analysis of hormones from many different types of sample (e.g., blood, tissue, etc.).

72
5.1 Introduction
Hormones are members of a broad group of chemical messengers responsible for regulating
body functions. Sex steroids are an important class of hormones responsible for physical,
psychological and cognitive development during adolescence.194 Affecting most tissues in the
body, the sex steroids (androgens, estrogens and progesterone) are primarily responsible for the
promotion and maintenance of secondary sexual characteristics. Due to their ubiquity, role in
growth and development, and change in abundances throughout a person’s lifetime, the
contribution of the sex steroids to a variety of pathologies has been extensively studied.195-199
The risk of breast cancer in post-menopausal women, for example, has been linked to heightened
levels of localized estrogen production in the breast,200 leading to a need for the implementation
of routine screening of breast tissue.
Unfortunately, routine screening of steroid hormones in breast tissue is not performed because of
the invasiveness of the procedure which, as a consequence of the significant amounts required
for analysis (> 500 mg), can require a hospital stay, anesthesia, and includes a significant risk of
scarring. Recently, Mousa and Jebrail, et al.35 developed a technique relying on digital
microfluidics to evaluate levels of estradiol (E2) in blood, serum and µL-sized aspirates of breast
tissue, opening the door to the possibility of routine analysis. However, as seen in Figure 5.1, the
biosynthesis of estradiol is complex. Monitoring only the concentration of E2 may miss
important cues that would be useful for diagnosing and treating breast cancer and related
hormone-sensitive conditions. The front-line treatment for breast cancer in post-menopausal
women is aromatase inhibitor therapy (AIT), which suppresses the biosynthesis of estradiol201-203
and increases the concentration of androgens.204-206 While it is believed that AIT suppresses
estradiol production by more than 95%, patient responses are known to vary considerably.207-208
In this chapter, we describe preliminary work involving the quantitation of testosterone,
androstenedione, and progesterone using digital microfluidics for liquid-liquid extraction clean-
up prior to analysis via direct infusion mass spectrometry. The chapter concludes with a
“continuing work” section, describing the use of liquid chromatography-tandem mass
spectrometry (LC-MS/MS) to analyze core needle biopsy (CNB) samples, towards the
development of a personalized medicine approach.
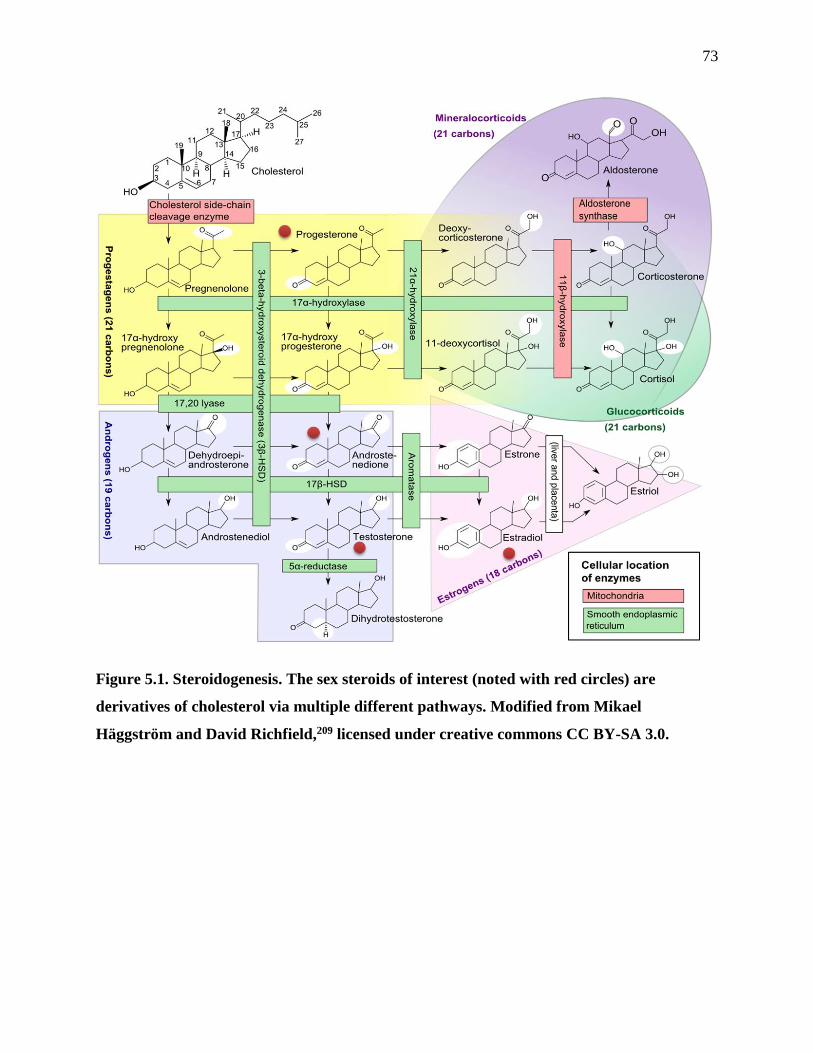
73
Figure 5.1. Steroidogenesis. The sex steroids of interest (noted with red circles) are
derivatives of cholesterol via multiple different pathways. Modified from Mikael
Häggström and David Richfield,209 licensed under creative commons CC BY-SA 3.0.

74
5.2 Experimental
5.2.1 Materials and Methods
Unless otherwise specified, reagents were purchased from Sigma-Aldrich (Oakville, ON,
Canada), including estradiol (1,3,5-Estratriene-3,17β-diol) and estradiol-d3 (1,3,5-Estratriene-
3,17β-diol-16,16,17-d3. Methanol (HPLC grade), concentrated sulfuric acid and hydrogen
peroxide (30%) were purchased from Fisher Scientific (Ottawa, ON). Teflon-AF was purchased
from DuPont (Wilmington, DE). Testosterone (4-Androsten-17β-ol-3-one), testosterone-d3 (4-
Androsten-17β-ol-3-one-16,16,17 – d3), androstenedione (4-Androsten-3,17-dione),
androstenedione-d7 (4-Androsten-3,17-dione-2,2,4,6,6,16,16-d7), progesterone (4-pregnen-3,20-
dione) and progesterone-d9 (4-pregnen-3,20-dione-2,2,4,6,6,17α,21,21,21-d9) were purchased
from Steraloids Inc. (Newport, RI).
Human blood (pooled male donor) was obtained from BioChemed Services (Winchester, VA,
USA). Breast tissue CNB samples were collected by Dr. Hala Gomaa and Dr. Robert R. Casper.
Protocols for extraction were approved by the Mount Sinai Hospital Research Ethics Board
(REB) and patients gave informed consent prior to involvement in the study. Breast CNBs were
collected from post-menopausal patients 2 minutes after administration of local anesthetic.
Samples were collected using a QuickCore 16 G, 20 mm biopsy needle (Cook Medical, Canada).
Samples were placed in Eppendorf tubes and stored at -20°C until use.
Clean room reagents and supplies included Shipley S1818 photoresist and MF321 developer
from Rohm and Haas (Marlborough, MA), AZ300T photoresist stripper from AZ Electronic
Materials (Branchburg, NJ), Parylene C dimer from Specialty Coating Systems (Indianapolis,
IN) and Teflon-AF from DuPont (Wilmington, DE), solid chromium from Kurt J. Lesker Canada
(Toronto, ON), CR-4 chromium etchant from Cyantek (Fremont, CA), hexamethyldisilazane
(HMDS) from Shin-Etsu MicroSi (Phoenix, AZ), concentrated sulfuric acid and hydrogen
peroxide (30%) from Fisher Scientific Canada (Whitby, ON) and dicing tape (medium tack)
from Semiconductor Equipment Corp. (Moorpark, CA).
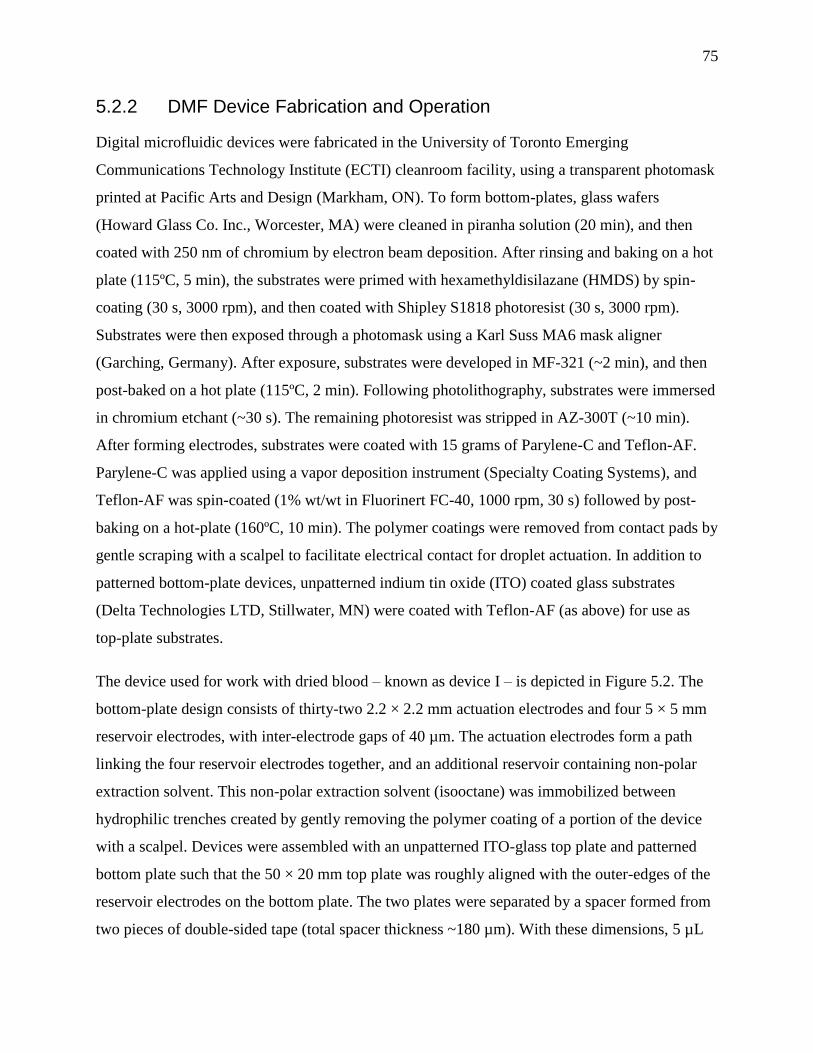
75
5.2.2 DMF Device Fabrication and Operation
Digital microfluidic devices were fabricated in the University of Toronto Emerging
Communications Technology Institute (ECTI) cleanroom facility, using a transparent photomask
printed at Pacific Arts and Design (Markham, ON). To form bottom-plates, glass wafers
(Howard Glass Co. Inc., Worcester, MA) were cleaned in piranha solution (20 min), and then
coated with 250 nm of chromium by electron beam deposition. After rinsing and baking on a hot
plate (115ºC, 5 min), the substrates were primed with hexamethyldisilazane (HMDS) by spin-
coating (30 s, 3000 rpm), and then coated with Shipley S1818 photoresist (30 s, 3000 rpm).
Substrates were then exposed through a photomask using a Karl Suss MA6 mask aligner
(Garching, Germany). After exposure, substrates were developed in MF-321 (~2 min), and then
post-baked on a hot plate (115ºC, 2 min). Following photolithography, substrates were immersed
in chromium etchant (~30 s). The remaining photoresist was stripped in AZ-300T (~10 min).
After forming electrodes, substrates were coated with 15 grams of Parylene-C and Teflon-AF.
Parylene-C was applied using a vapor deposition instrument (Specialty Coating Systems), and
Teflon-AF was spin-coated (1% wt/wt in Fluorinert FC-40, 1000 rpm, 30 s) followed by post-
baking on a hot-plate (160ºC, 10 min). The polymer coatings were removed from contact pads by
gentle scraping with a scalpel to facilitate electrical contact for droplet actuation. In addition to
patterned bottom-plate devices, unpatterned indium tin oxide (ITO) coated glass substrates
(Delta Technologies LTD, Stillwater, MN) were coated with Teflon-AF (as above) for use as
top-plate substrates.
The device used for work with dried blood – known as device I – is depicted in Figure 5.2. The
bottom-plate design consists of thirty-two 2.2 × 2.2 mm actuation electrodes and four 5 × 5 mm
reservoir electrodes, with inter-electrode gaps of 40 µm. The actuation electrodes form a path
linking the four reservoir electrodes together, and an additional reservoir containing non-polar
extraction solvent. This non-polar extraction solvent (isooctane) was immobilized between
hydrophilic trenches created by gently removing the polymer coating of a portion of the device
with a scalpel. Devices were assembled with an unpatterned ITO-glass top plate and patterned
bottom plate such that the 50 × 20 mm top plate was roughly aligned with the outer-edges of the
reservoir electrodes on the bottom plate. The two plates were separated by a spacer formed from
two pieces of double-sided tape (total spacer thickness ~180 µm). With these dimensions, 5 µL

76
droplets were comfortably manipulated on the 2.2 × 2.2 mm and 5 × 5 mm electrodes. A ~150
VRMS driving potential was generated by amplifying the sine wave output of a function generator
(Agilent Technologies, Santa Clara, CA) operating at 15 kHz. 5 µL aliquots of reagents were
loaded onto a DMF device by pipetting a droplet onto the bottom plate at the edge of the top
plate and simultaneously applying driving potential to the appropriate reservoir electrode
(relative to the ITO electrode on the top plate) to draw the fluid into the reservoir. Thereafter,
droplets were manipulated by applying the driving potential to sequential actuation electrodes on
the bottom plate relative to the ITO electrode on the top plate.
Figure 5.2. Device I – digital microfluidic device used for extraction of hormones from
dried blood. (Top) Three-quarter view schematic of device, featuring thirty-two 2.2 × 2.2
mm actuation electrodes and four 5 × 5 mm reservoirs. Blood is placed onto a sample
reservoir and allowed to dry. Non-polar extraction solvent is immobilized via hydrophilic
trenches. (Bottom) When assembled, the top and bottom plates are separated by a 180 μm
thick spacer.

77
The device used for work involving tissue – known as device II – is depicted in Figure 5.3. The
bottom-plate design comprises three processing zones, each bearing three 5 × 2 mm electrodes
connected four 7 × 7 mm electrodes, with inter-electrode gaps of 40 μm. Devices were
assembled with an unpatterned ITO–glass top plate and a patterned bottom plate such that the 75
mm × 30 mm top plate was roughly aligned with the outer-edges of the reservoir electrodes on
the bottom plate. The two plates were separated by a spacer formed from five pieces of double-
sided tape (total spacer thickness ~450 μm). With these dimensions, 25 μL droplets were
comfortably manipulated on the 5 × 2 and 7 × 7 mm electrodes. A ~150 VRMS driving potential
was generated by amplifying the sine wave output of a function generator (Agilent Technologies,
Santa Clara, CA) operating at 15 kHz. ~25 µL aliquots of reagents were loaded onto a DMF
device by pipetting a droplet onto the bottom plate at the edge of the top plate and
simultaneously applying driving potential to the appropriate reservoir electrode (relative to the
ITO electrode on the top plate) to draw the fluid into the reservoir. Thereafter, droplets were
manipulated by applying the driving potential to sequential actuation electrodes on the bottom
plate relative to the ITO electrode on the top plate.

78
Figure 5.3. Device II – digital microfluidic device used for extraction of hormones from
tissue. (Top) Three-quarter view schematic of device, featuring three extraction modules,
each featuring four 7 × 7 mm and three 5 × 2 mm actuation electrodes. As shown, the tissue
sample is positioned on top of the central 5 × 2 mm sample reservoir. (Bottom) When
assembled, the top and bottom plates are separated by a 450 μm thick spacer.
5.2.3 Digital Microfluidic Hormone Extraction, Quantitation and Analysis
5.2.3.1 From Dried Blood
Device I was employed for the extraction of hormones from dried blood. In a typical experiment,
a 10 µL aliquot of whole blood spiked with hormones (testosterone, androstenedione, and
progesterone at concentrations of 0.1 – 2.0 µg/mL) was positioned in the sample reservoir of a
device and the device assembled. Once assembled, solvents (DCM/acetone 80:20 v/v as lysing
solvent, methanol as polar extracting solvent, and isooctane as non-polar extracting solvent) were
loaded. After each blood sample was allowed to dry on the device surface, 10 µL of lysing
solvent (2 x 5µL) was driven to the sample reservoir and allowed to incubate at room
temperature until dry (~5 min). Steroid extraction was accomplished in 3 steps: (1) A volume (5
µL) of methanol was driven to the dried lysate to extract the steroids. (2) A unit droplet of the
extract (~900 nL) was dispensed from the sample reservoir and circulated within the immobile
pool of isooctane for liquid-liquid extraction. After ~20 s, the droplet was driven out of the
isooctane and allowed to evaporate in the collection reservoir. (3) Steps 1 and 2 were repeated
until a total of 20 µL of methanol was consumed.
After the extraction, the top plate was removed, and the dried extract was resolubilized in a 50
µL aliquot of methanol containing an appropriate deuterated internal standard (1 µg/mL) and
analyzed via direct-infusion MS. Concentrations of hormones in blood extracts and standard
solutions were compared to evaluate extraction efficiency.
Hormone extracts were analyzed directly with a Thermo LTQ linear ion trap mass spectrometer
(Thermo Scientific, Waltham, MA, USA). All analytes were analyzed in positive ion mode at a
capillary temperature of 250˚C. Parameters including spray potential (+ 1.6-2.0 kV), capillary

79
voltage, tube lens voltage, and collision energy were varied for each analyte to provide optimum
signal. Spectra were obtained by averaging 10 acquisitions (at a rate of 5 acquisitions/s). A ratio
of the peak height of each hormone relative to that of its internal standard was used for the
construction of calibration curves and evaluation of extraction efficiency.
5.2.3.2 From Tissue
Device II was employed for the extraction of hormones from CNB tissue samples. A device
bearing a tissue sample was assembled and 25 µL of the extraction solution (methanol containing
internal standards at 2000 pg/mL each) was loaded into the polar extraction solvent reservoir and
then driven over the tissue sample. The droplet was shuttled back and forth across the tissue
sample 10x for ~30 s, and then incubated for 4.5 min. Finally, the droplet was driven away from
the tissue sample to the collector electrode, and the top-plate was removed to allow the droplet to
dry on the bottom-plate at room temperature for ~1 h.
For analysis via HPLC-MS, the extract was resolubilized in a 50 µL aliquot of 50:50
methanol:DI water. This aliquot was transferred into a 96-well plate, where it was injected into
the autosampler of an Agilent Technologies 1200 series HPLC system (Santa Clara, California).
Chromatographic separations were performed on a 2.1 × 100 mm HPLC column (Agilent Rapid
Resolution Extend – C18, 1.8 µm) and the HPLC was operated in gradient elution mode at a
flow rate of 100 µL/min. 100% DI water and 100% methanol were used as mobile phases A and
B, respectively. Mobile phase B was held at 50% for 1.00 min and then increased linearly to 95%
in 2.00 min. Mobile phase B was then held at 95% for 6 min before decreasing back to 50% in
0.10 min and holding at 50% for 10.90 min for a total runtime of 20.00 min. During each run, an
aqueous ionization buffer (typically 2% aqueous ammonium hydroxide) was infused post-
column at 5 µL/min by a syringe pump (Harvard Apparatus, Holliston, MA) connected to a T-
junction.
The eluent was monitored by a QuattroMicro triple quadrupole mass spectrometer (Waters,
Milford, MA) via an electrospray ionization (ESI) source operating in negative ion mode for
estradiol and positive ion mode for testosterone, progesterone, and androstenedione. The system
was operated with a spray voltage of 3000 V, 400°C nebulizing gas temperature and cone
potential of 35-40 V for positive ion mode and 70 V for negative ion mode. The mass

80
spectrometer was operated to collect selected ion recording (SIR) chromatograms for each of
hormones and internal standards. Ions monitored included mass-to-charge ratios of 271.43,
274.43, 287.43, 294.43, 289.40, 292.40, 315.43, 324.43 for estradiol, estradiol-d3,
androstenedione, androstenedione-d7, testosterone, testosterone-d3, progesterone, and
progesterone-d9, respectively. Ratios of the areas under the curves (AUC) from SIR
chromatograms of hormone:internal standard were recorded and compared to the linear
regression equations from reference standard curves to determine absolute quantities.

81
5.3 Results and Discussion
The analysis of hormones is important in a wide range of circumstances. Owing to their critical
role in growth, development and reproduction, an imbalance of steroid hormones can result in a
wide variety of clinical disorders, including many types of cancer and infertility.210-213
Additionally, exogeneous hormones are often dosed therapeutically to treat or alleviate the
symptoms of the same disorders, making the monitoring of hormones an important but complex
problem. Here we report an important first step in an exploration of the utility of DMF for the
extraction and analysis of multiple sex steroid hormones from blood and tissue. Figure 5.4A is a
top-view picture of the device (“device I”) used for extraction, with blood loaded onto the
sample reservoir. The reservoirs are labeled (for clarity): (1) sample reservoir, (2) lysing solvent
reservoir, (3) polar extraction solvent reservoir, (4) non-polar extraction solvent reservoir, and
(5) collection reservoir. The hormone extraction process is illustrated in Figure 5.4B-G. As
shown, a typical extraction involved sample lysis, extraction of hormones into a polar solvent
(methanol), extraction of non-polar compounds into a non-polar solvent (isooctane), followed by
collection of and evaporation of extract for subsequent reconstitution and analysis. The images
shown in Figure 5.4 were generated with a dried blood sample, but the same method can also be
used with serum, standard solutions and other samples that can be dried onto a device.
The primary advantage of the technique described here relative to conventional methods is
sample size – only a few mg of sample is required for analysis, which is compatible with finger-
prick samples (for blood) or core-needle biopsy (CNB) samples (for tissue). The collection of
such samples is much less invasive than those used in conventional sampling, which makes this
method attractive for routine screening. A second advantage of this technique is analysis time –
the total time required is around 20 minutes, which represents a significant reduction in
conventional hormone extraction techniques which require several hours.35
The DMF-driven hormone extraction technique presented here represents an advance over the
previously published method35 used to evaluate estradiol in small samples. Figure 5.5 illustrates
the former design (top) and the new design (bottom). The first alteration of note is the increased
dimensions of both the actuation electrodes and the solvent reservoirs. By accommodating larger
amounts of solvent, we can reduce the amount of manual intervention involved in an analysis by
enabling more extraction steps to occur before needing to refill the reservoirs. The second

82
alteration is the increase in the total number of actuation electrodes. The addition of more
electrodes between the reservoirs improves device reliability by providing an alternate route
should particular electrodes become damaged (e.g. biofouling or fabrication defect). The third
alteration is replacing the photoresist walls (for the immobilization of the non-polar extraction
solvent) with hydrophilic trenches scratched into the dielectric layer of the device. This
simplification reduces the time requires for device fabrication, and allows for the straightforward
accommodation of various volumes of solvent.
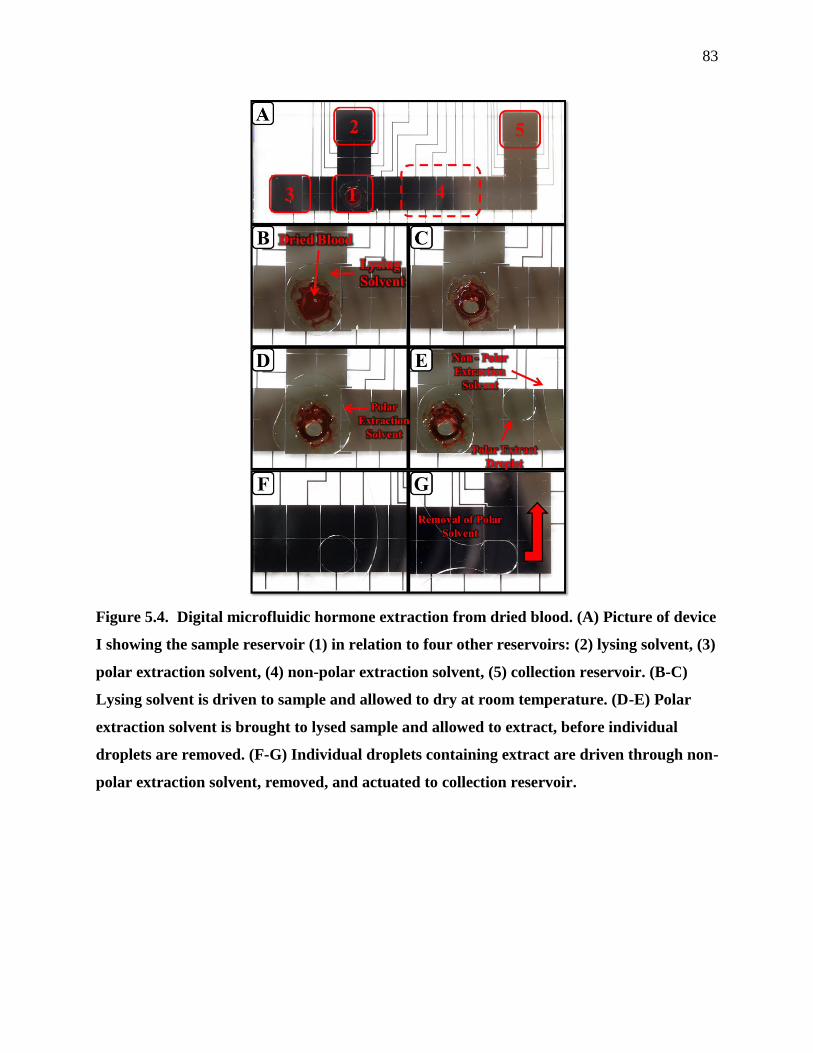
83
Figure 5.4. Digital microfluidic hormone extraction from dried blood. (A) Picture of device
I showing the sample reservoir (1) in relation to four other reservoirs: (2) lysing solvent, (3)
polar extraction solvent, (4) non-polar extraction solvent, (5) collection reservoir. (B-C)
Lysing solvent is driven to sample and allowed to dry at room temperature. (D-E) Polar
extraction solvent is brought to lysed sample and allowed to extract, before individual
droplets are removed. (F-G) Individual droplets containing extract are driven through non-
polar extraction solvent, removed, and actuated to collection reservoir.

84
Figure 5.5. Comparison of schematics of devices used for extraction of hormones. (A)
Device design used in previous hormone work.35 (B) Device design (device I) used here
featuring additional electrodes which act as a safeguard against electrode-failure. The
images are not to scale.
Quantitation and evaluation of extraction efficiency was performed for three sex steroid
hormones: testosterone, androstenedione, and progesterone. Concentrations of hormones in the
g/mL range were selected to evaluate detector response, and calibration curves were
constructed for the three hormones of interest as shown in Figure 5.6A. Detector response was
linear over this range of concentrations, with R2 values of 0.9996, 0.9895, and 0.9999 for
testosterone, androstenedione and progesterone, respectively. Evaluation of extraction
efficiencies for the three sex steroids was performed by comparing the ratio of signal
corresponding to hormone to that of internal standard (IS) for DMF-extracted samples with
analyte/IS ratios generated from standard solutions (i.e., tube controls). Figure 5.6B illustrates a
representative MS1 spectra used for the evaluation of extraction efficiency, featuring
testosterone. Because of the high concentrations involved and multiple clean-up steps in the
process, tandem mass spectrometry was not needed.
As illustrated in Figure 5.6B, extraction efficiencies were 75% for androstenedione, 76% for
testosterone, and 91% for progesterone. These results suggest that DMF may be useful for
multiplexed hormone extraction and analysis.

85
Figure 5.6. Analysis of hormones using DMF and direct-infusion MS. (A) Calibration
curves for standard solutions of testosterone (red, R2 = 0.9996), androstenedione (blue, R2 =
0.9859) and progesterone (grey, R2 = 0.9999). Error bars represent ± 1SD, n = 3. (B)
Representative mass spectrum used to evaluate extraction efficiency. The intensity of the
peak corresponding to the hormone – testosterone [M+H]+ = 289 m/z – is divided by the
intensity of the peak corresponding to the deuterated hormone internal standard (included
in the extraction solvent) – testosterone-d3 [M+H]+= 292 m/z and compared to that of
control samples. (C) Extraction efficiencies (EE) for blood samples handled by DMF.

86
Androstenedione EE = 75%, testosterone EE = 76%, progesterone EE = 92%. Error bars
represent ± 1SD, n = 3.
5.3.1 Continuing work
The aforementioned work, although preliminary, provided an important foundation for current
and on-going work in the lab. We are currently focusing on quantitation of hormones in CNB
tissue samples using DMF for extraction and LC-MS/MS for quantitation. This focus is driven
by the understanding that hormone levels in tissue, which correlate poorly with concentrations of
hormones in the blood, are critical in evaluating the effectiveness of certain hormone
replacement therapies.201 In addition, we observed that the drying of liquid blood directly onto
device can result in the blood becoming brittle, resulting in flakes of blood breaking off into the
sample extract, complicating the sample collection and resolubilization process. (Note that a
similar problem was observed for urine in the work described in Chapter 4. This problem was
solved by including hydrophilic “anchors” on the device surface, and could likely provide similar
benefits for the analysis of blood.) With tissues, this problem is not observed. Figure 5.7
illustrates the workflow of the current method, which is being used for the quantitation of
estradiol, testosterone, androstenedione, and progesterone from tissue samples. The electrode
configuration of device II was designed for a quick, one-step extraction and features three
independent zones for multiplexed extraction.
Figure 5.7. Scheme for the new DMF-LC-MS/MS method for the extraction of hormones
from core needle biopsies (CNB). (A) Core needle used in the collection of tissue. (B)
Multiplexed DMF device used for tissue extraction. (C) Triple-quad LC-MS/MS used for
quantitation.

87
Figure 5.8A illustrates one of the extraction zones, which consists of three 2 × 5 mm electrodes
and four 7 × 7 mm reservoirs. The extraction process is visualized in Figure 5.8B-E. Briefly, a
CNB tissue sample is placed onto the center 2 × 5 mm electrode and solvent with internal
standard is loaded into the reservoir. The extraction solvent is driven to the tissue and passed
back and forth over the sample for roughly 5 minutes before being driven to the final electrode
for collection, dilution, and analysis off-chip via LC-MS/MS. Figure 5.9A-D features calibration
curves of the four hormones extracted using digital microfluidics.
This technique establishes the possibility of performing multiplexed hormone analysis from
CNB samples, which is an exciting prospect for the future of routine, automated analysis and
point-of-care testing. In comparison to the work with blood, the tissue extraction protocol was
streamlined by the removal of the LLE step. By omitting this step, the protocol becomes much
faster, and so throughput is increased. However, introducing a “dirtier” sample into the MS can
lead to greater fouling, which necessitates more frequent maintenance. In ongoing work, we have
adopted a hybrid approach with an initial extraction step followed by a SPE step via the
incorporation of PPMs as mentioned in chapter 4. The use of C18 magnetic beads for this work
is currently being explored.
Figure 5.8. Digital microfluidic extraction from tissue samples. Picture of device II (A) and
frames from a movie (B-E) depicting the extraction of a tissue sample. A tissue sample is
placed into the extraction region and solvent containing internal standard is loaded into the
solvent reservoir (B), the solvent is delivered to the tissue and cycled back and forth to
extract the analytes (C-D), and the solvent is then moved to the collector for analysis (E).

88
Figure 5.9. Calibration curves for (A) E2, (B) AD, (C) TS, and (D) PG. Serial dilutions
were prepared on different days (16 days apart) by different operators (red squares and
blue diamonds). Data are plotted as a ratio of area under curves (AUCs) for light and
heavy hormone standards extracted from the relevant SIR chromatograms. Each data
point represents four injections, and error bars are ±1 S.D.

89
5.4 Conclusion
In this chapter, preliminary efforts towards the development of a lab-on-a-chip method powered
by digital microfluidics for sample clean-up and extraction of testosterone, androstenedione
progesterone, and estradiol in minute quantities of blood and tissue were described. This work
represents the first major step in expanding the utility of a single analysis by increasing the
breadth of information obtainable from a single extraction, and provided the foundation for the
current on-going work which was also briefly summarized in this chapter. When fully optimized
and characterized, I project that future versions of these methods will be useful for a wide range
of clinically relevant applications.

90
Chapter 6 Concluding Remarks and Future Perspectives
6.1 Concluding Remarks
Digital microfluidics is a microscale liquid handling technique with the potential to provide
reliable, automated performance of complex, multistep processes. DMF’s ease of automation,
flexibility in design and detector integration, portability, and small footprint are contributing to
its surge in popularity in a wide array of analytical fields; including forensics, clinical analysis,
and the pharmaceutical industry. In many of these fields, complex sample matrices (such as
solids) are very common. There has been very little work done with DMF incorporating solid
samples and other solid structures into the analytical workflow. In this thesis I describe several
DMF techniques incorporating solid sample matrices and materials for the extraction and
analysis of small molecules. I summarize these contributions below and propose suggestions for
future work.
Multiplexed Extraction and Quantitative Analysis of Pharmaceuticals from Dried Blood
Spot Samples using Digital Microfluidics (Chapter 2)
This chapter describes the development and use of a DMF platform for the multiplexed
extraction and quantitation of pharmaceuticals from DBS samples. The use of dried filter paper
as a means for sample collection, storage, and transportation is becoming widespread in a variety
of fields including clinical and preclinical testing of pharmaceuticals. This chapter explores the
utility of DMF as a means of DBS sample extraction and analysis, by comparing the DMF
method with the traditional macroscale method for the extraction and analysis of four different
pharmaceuticals. Relative to the conventional technique the DMF method enabled a three-fold
reduction in solvent consumption and an order of magnitude reduction in processing time while
maintaining acceptable analytical performance for most drugs tested. This and other criterion are
summarized in table 6.1. For DMF to truly emerge as a viable alternative to the current
methodologies, I propose that rigorous validation of the technique must be performed in order to
meet the stringent quality controls of the pharmaceutical industry. This would include extensive
evaluation of intra-day and inter-day precision and accuracy and potentially will require the
incorporation of additional clean-up procedures (perhaps including the methods described in
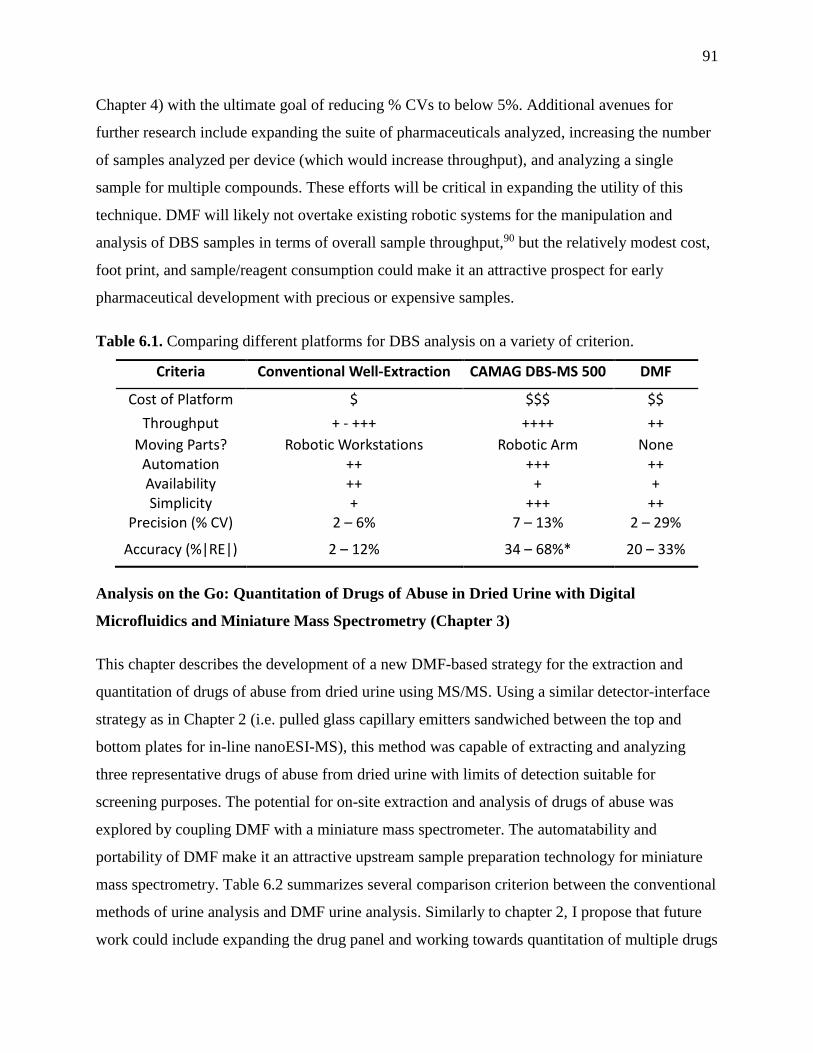
91
Chapter 4) with the ultimate goal of reducing % CVs to below 5%. Additional avenues for
further research include expanding the suite of pharmaceuticals analyzed, increasing the number
of samples analyzed per device (which would increase throughput), and analyzing a single
sample for multiple compounds. These efforts will be critical in expanding the utility of this
technique. DMF will likely not overtake existing robotic systems for the manipulation and
analysis of DBS samples in terms of overall sample throughput,90 but the relatively modest cost,
foot print, and sample/reagent consumption could make it an attractive prospect for early
pharmaceutical development with precious or expensive samples.
Table 6.1. Comparing different platforms for DBS analysis on a variety of criterion.
Criteria Conventional Well-Extraction CAMAG DBS-MS 500 DMF
Cost of Platform $ $$$ $$
Throughput + - +++ ++++ ++
Moving Parts? Robotic Workstations Robotic Arm None
Automation ++ +++ ++
Availability ++ + +
Simplicity + +++ ++
Precision (% CV) 2 – 6% 7 – 13% 2 – 29%
Accuracy (%|RE|) 2 – 12% 34 – 68%* 20 – 33%
Analysis on the Go: Quantitation of Drugs of Abuse in Dried Urine with Digital
Microfluidics and Miniature Mass Spectrometry (Chapter 3)
This chapter describes the development of a new DMF-based strategy for the extraction and
quantitation of drugs of abuse from dried urine using MS/MS. Using a similar detector-interface
strategy as in Chapter 2 (i.e. pulled glass capillary emitters sandwiched between the top and
bottom plates for in-line nanoESI-MS), this method was capable of extracting and analyzing
three representative drugs of abuse from dried urine with limits of detection suitable for
screening purposes. The potential for on-site extraction and analysis of drugs of abuse was
explored by coupling DMF with a miniature mass spectrometer. The automatability and
portability of DMF make it an attractive upstream sample preparation technology for miniature
mass spectrometry. Table 6.2 summarizes several comparison criterion between the conventional
methods of urine analysis and DMF urine analysis. Similarly to chapter 2, I propose that future
work could include expanding the drug panel and working towards quantitation of multiple drugs

92
from a single sample, as well as extending this methodology to other biological matrices. Of
particular interest to the field of forensics would be the extraction and analysis of drugs from
small bone samples, charred remains, vitreous humour, and cerebrospinal fluid. There is a
paucity of data in the literature related to drug concentration in skeletal remains, and there are
continuing efforts to establish forensically relevant data banks of information regarding the
concentration of drugs remaining in tissues after death. DMF may be a suitable technology
capable of analyzing multiple, varying solid sample types in an automated fashion, facilitating
the generation of data banks. More generally speaking, the development of a fully field-
deployable DMF-miniature mass spectrometry unit for quantitation of drugs of abuse is of
particular interest, building off of efforts to develop portable MS systems like the backpack mass
spectrometer.137 A fully integrated portable DMF-MS system will require the development of a
more robust interface between the DMF device, nanoESI emitters, and the mini MS system.
Table 6.2. Comparing different platforms for drug analysis in urine on a variety of criterion.
Criteria Immunoassays Conventional Method DMF
Cost of Platform $ $$$$ $$
Throughput ++ + - +++ +
Portability Yes No Yes
Automation + +++ ++
Sensitivity + +++ ++
Precision ~++ +++ +
Accuracy ~++ +++ +
Attractive Design: An Elution Solvent Optimization Platform for Magnetic-bead based
Fractionation using Digital Microfluidics and Design of Experiments (Chapter 4)
This chapter describes a new digital microfluidic method for the performance of solid phase
extraction, using C18-functionalized magnetic beads for the reversed phase fractionation of
analytes. The incorporation of magnetic beads coated with C18 alkyl moeities affords some
unique advantages for DMF, including maintaining device reconfigurability by adjusting bead
bed size on the fly and by enabling the removal of beads when they are not needed. This system
was used for the fractionation of a peptide (angiotensin I) and a small molecule (sitamaquine).
Optimization of elution solvent composition was performed on-chip in a fully automated fashion,

93
representing a unique demonstration of the utility of DMF. The incorporation of adjustable C18
magnetic bead-beds for SPE, the on-chip fractionation of multiple compounds, and the fully
automated elution solvent optimization performed on-chip, represent three important “firsts” for
digital microfluidics. We anticipate this combination of techniques will be useful for separating a
wide range of analytes – including small molecules and peptides – from complex matrices. I
propose that in the future, this technique be incorporated into the multiplexed extraction protocol
for pharmaceuticals (described in chapter 2) as an additional clean-up step to improve the
performance of the method. Future work might include the investigation of alternate strategies to
extend device lifetime, since the typical strategy of Pluronic-additives is incompatible with the
SPE stationary phase. Other possible strategies could include dynamic coatings designed to
maintain hydrophobicity while repelling protein adsorption.182 Furthermore, the work described
in this chapter utilizes mass spectrometry for direct analysis, but not for direct in-line analysis
due to limitations of our hardware. The lab is currently developing a mobile DMF housing
incorporating electromagnets, which will greatly simplify analytical protocols by enabling in-line
analysis, and could potentially be integrated into the mobile DMF set-up proposed in Chapter 3.
Exploring the Utility of Digital Microfluidics for the Extraction of Multiple Hormones from
Blood and Tissue (Chapter 5)
This chapter represents a snapshot of progress in our on-going efforts to extend the utility of
DMF to the analysis of multiple hormones from two types of solid samples: dried blood and
tissue (in the form of core needle biopsies). Work with dried blood involved the extraction of
three hormones (testosterone, androstenedione, and progesterone) followed by a liquid-liquid
extraction step prior to off-line direct analysis. This work represents the first major step in
expanding the utility of DMF by increasing the breadth of information obtainable from a single
analysis (relative to our original work, which focused on one hormone analyte, estradiol).
Building off our results with dried blood, the work with tissue samples involves a simple,
multiplexed extraction which omits the liquid-liquid extraction step, but incorporates off-line
LC-MS/MS for analysis. Current on-going work involves the incorporation of SPE monoliths to
help improve sample recovery. I propose that the technology described in Chapter 4 – C18
magnetic beads – could be incorporated into the analytical workflow to achieve comparable
results to the monoliths while maintaining device reconfigurability. The fully automated,

94
multiplexed analysis of hormones from core needle biopsies using DMF opens the doors to a
host of exciting possibilities, including routing and monitoring of hormone levels and other
point-of-care clinical applications.
6.2 Future Perspectives
One of the most intriguing potential capabilities of DMF is its ability to process solid materials.
The work described in this thesis illustrates the evolution of the technology from being one that
primarily is used with liquid samples, to being one that can incorporate solids. One field in
particular that would benefit greatly from this is forensic science. The portable DMF-MS/MS
analysis platform described in Chapter 3 for analyzing illicit-drugs in dried urine is the first step
towards introducing DMF to the world of forensics. A logical progression in the area of forensics
would be application to the toxicological analysis of human remains, where traditional samples
(e.g. blood, urine, visceral tissues) are often in short supply, and investigators must rely on non-
traditional samples like bone tissue. 214-215A miniaturized, mobile, automated analytical
technique capable of extracting small quantities of drugs from precious solid samples (e.g., bone)
would be extremely attractive. Unfortunately the field of forensics is often hesitant to adopt new
technologies, and therefore it may be a while before DMF can take a practical foothold in the
field. Even so, the potential benefits suggest that this avenue should be explored.
The work described in this thesis illustrates two important considerations in DMF: portability
and throughput. The innovations described in Chapter 3 represent a significant advancement in
the direct coupling of DMF and miniature mass spectrometry. The very recent development of
new DMF-based hardware systems (such as the miniaturized, open-source DropBot111) and
mobile mass spectrometer strategies (such as the backpack MS137) suggest that this hyphenated
technique is poised to become useful in point-of-care applications by increasing the portability of
the technology. The work described in Chapters 2, 3, and 5 features the multiplexed extraction
and analysis of compounds in DBS samples, dried urine and tissue. The emphasis on multiplexed
analysis in this thesis illustrates the importance of method throughput to the widespread adoption
of DMF, and establishes the utility of multiplexed analysis for these sample types.
This thesis describes the incorporation of several different solid samples and materials into DMF.
The strength and ease with which this is accomplished leads me to conclude that the most useful

95
format for the introduction of liquid samples into DMF is through the use of filter paper as
illustrated in Chapter 2. Filter paper provides a solid support for liquid samples and enables a
reproducible volume to be easily incorporated onto device. Variability between filter paper
brands and matrix effects related to analyte distribution (e.g. hematocrit in blood) must always be
considered.98, 216 Due to low sampling efficiency (i.e. only 2 – 3 µL of a 15 – 20 µL sample is
analyzed from a 3 mm DBS punch) alternate strategies have been employed, including applying
an entire sample to a smaller, pre-cut punch. This variation is known as perforated DBS217-218
and its effect on current DMF protocols should be explored. Filter paper has been used for a wide
variety of biological samples including liquid blood, plasma,219 saliva,220 urine,118 other
forensically relevant samples (e.g. cerebrospinal fluid, vitreous humour, and bile221) and even to
absorb fluid collecting around certain solid tissues (most commonly the liver).221 I propose that
any of these sample types could be incorporated into a DMF workflow, including those
presented in Chapter 3. Also, the ability to pre-treat the filter paper (e.g. internal standard222 or
derivatization reagents223) can help streamline analysis. Despite these clear benefits, the use of
filter paper as a microsampling methodology still requires some upfront sample prep, and so
directly spotting sample onto device may still be favourable for certain applications.
The logical evolution of these two concepts (filter paper samples and DMF) is illustrated through
the use of paper digital microfluidic devices.10 Liquid samples could be placed, and stored,
directly on DMF devices ink-jet printed on paper. Preliminary, unpublished work in our lab has
been conducted in this area, and is yielding promising results. It will be interesting to see if paper
overtakes glass as the favoured substrate for the fabrication of digital microfluidic devices.
This thesis describes several methods of analysis incorporating solid samples or materials, all of
which rely on mass spectrometry for detection. The DMF-MS interfaces described in this thesis
have either been off-line (i.e., sample collected from the chip and analyzed separately – chapter 4
and 5) or direct and in-line. The in-line interface consisting of a pulled glass nESI capillary is
perhaps the most straightforward DMF-MS interface, and was used in chapters 2 and 3 for
successful quantitative analysis. This interface has several key drawbacks, including a lack of
stability and reproducibility, and challenges related to alignment with the MS inlet. The
development of more robust means of interfacing emitters with DMF devices would help to
improve device performance. Approaches to solving this issue include the permanent attachment

96
of emitters to devices (e.g. using glue) or development of a custom emitter holder to align
emitters with both DMF devices and mass spectrometer inlets. The interface reported by Kim, et
al.224-225 (which mates capillaries to DMF devices for DNA sequencing) presents several exciting
opportunities. First, this interface could potentially be used to stabilize nESI capillaries for more
reproducible positioning in front of MS inlets. Second, the interface could provide a means of
introducing a sample directly from device for in-line liquid chromatography or capillary
electrophoresis.226 A reliable in-line interface between these separation techniques and DMF
would greatly improve analysis.
Digital microfluidics is emerging as a powerful technology with the potential to impact the field
of bioanalysis. Although historically used mainly with liquid samples, the work described within
this thesis has cemented DMF as a viable platform for the incorporation of solid samples and
other solid materials. The ability to work with solid samples extends the compatibility of the
technology to many areas of interest, by extending the list of alternative samples viable for
analysis (perhaps someday including bone tissue in forensics). The multiplexed analysis of solid
samples (e.g., dried urine, dried blood on device and in filter paper, and tissue) demonstrates the
potential utility of DMF for the rapid, automated, routine analysis of samples in clinical (Chapter
5), forensic (Chapter 3) and pharmaceutical (Chapter 2) settings. The work presented in Chapter
3 has implications beyond the analysis of solid samples, by describing the first combination of
DMF with miniature mass spectrometry, representing an important and significant first step
towards the development of a fully portable DMF-MS system for on-site quantitative analysis.
Additionally, the work in Chapter 4 represents (a) the first description of C18-functionalized
magnetic bead based SPE, (b) the first instance of DMF-based SPE fractionation, and (c) the first
use of DMF for the automated optimization of solvent conditions. The incorporation of solid
materials like C18-functionalized magnetic beads represents a flexible means of introducing
further sample clean-up steps into DMF workflows, and its utility for the applications described
in Chapter 2 and 5 is currently being explored. Overall, I propose that the developments
presented in this thesis represent useful milestones in the eventual goal of widespread adoption
of digital microfluidics for bioanalysis, both inside and outside of the laboratory.

97
References
1. Choi, K.; Ng, A. H. C.; Fobel, R.; Wheeler, A. R., Annual Review of Analytical
Chemistry, Vol 5. 2012, 5, 413-440.
2. Culbertson, C. T.; Mickleburgh, T. G.; Stewart-James, S. A.; Sellens, K. A.; Pressnall,
M., Analytical Chemistry. 2013, 86 (1), 95-118.
3. Kovarik, M. L.; Gach, P. C.; Ornoff, D. M.; Wang, Y.; Balowski, J.; Farrag, L.;
Allbritton, N. L., Analytical Chemistry. 2012, 84 (2), 516-540.
4. Kovarik, M. L.; Ornoff, D. M.; Melvin, A. T.; Dobes, N. C.; Wang, Y.; Dickinson, A. J.;
Gach, P. C.; Shah, P. K.; Allbritton, N. L., Analytical Chemistry. 2013, 85 (2), 451-472.
5. West, J.; Becker, M.; Tombrink, S.; Manz, A., Analytical Chemistry. 2008, 80 (12),
4403-4419.
6. Wheeler, A. R., Science. 2008, 322 (5901), 539-540.
7. Abdelgawad, M.; Wheeler, A. R., Advanced Materials. 2007, 19 (1), 133-+.
8. Watson, M. W. L.; Abdelgawad, M.; Ye, G.; Yonson, N.; Trottier, J.; Wheeler, A. R.,
Analytical Chemistry. 2006, 78 (22), 7877-7885.
9. Abadian, A.; Jafarabadi-Ashtiani, S., Microfluidics and Nanofluidics. 2014, 16 (5), 989-
995.
10. Fobel, R.; Kirby, A. E.; Ng, A. H. C.; Farnood, R. R.; Wheeler, A. R., Advanced
Materials. 2014, 26 (18), 2838-2843.
11. Jebrail, M. J., Luk, V.N., Shih, S.C.C., Fobel, R., Ng, A., Yang, H., Freire, S.L.S.,
Wheeler, A.R. . Digital Microfluidics for Automated Proteomic Processing Journal of Visualized
Experiments [Online], 2009, p. e1630.
12. Jebrail, M. J.; Ng, A. H. C.; Rai, V.; Hili, R.; Yudin, A. K.; Wheeler, A. R., Angewandte
Chemie-International Edition. 2010, 49 (46), 8625-8629.
13. Miller, E. M.; Wheeler, A. R., Analytical Chemistry. 2008, 80 (5), 1614-1619.
14. Nichols, K. P.; Gardeniers, H. J. G. E., Analytical Chemistry. 2007, 79 (22), 8699-8704.
15. Taniguchi, T.; Torii, T.; Higuchi, T., Lab on a Chip. 2002, 2 (1), 19-23.
16. Jebrail, M. J.; Wheeler, A. R., Analytical Chemistry. 2009, 81 (1), 330-335.
17. Wheeler, A. R.; Moon, H.; Bird, C. A.; Loo, R. R. O.; Kim, C. J.; Loo, J. A.; Garrell, R.
L., Analytical Chemistry. 2005, 77 (2), 534-540.

98
18. Wheeler, A. R.; Moon, H.; Kim, C. J.; Loo, J. A.; Garrell, R. L., Analytical Chemistry.
2004, 76 (16), 4833-4838.
19. Hua, Z.; Rouse, J. L.; Eckhardt, A. E.; Srinivasan, V.; Pamula, V. K.; Schell, W. A.;
Benton, J. L.; Mitchell, T. G.; Pollack, M. G., Analytical Chemistry. 2010, 82 (6), 2310-2316.
20. Malic, L.; Veres, T.; Tabrizian, M., Biosensors & Bioelectronics. 2009, 24 (7), 2218-
2224.
21. Sista, R.; Eckhardt, A. E.; Wang, T.; Sellos-Moura, M.; Pamula, V. K., Clinica Chimica
Acta. 2011, 412 (19-20), 1895-1897.
22. Sista, R. S.; Eckhardt, A. E.; Wang, T.; Graham, C.; Rouse, J. L.; Norton, S. M.;
Srinivasan, V.; Pollack, M. G.; Tolun, A. A.; Bali, D.; Millington, D. S.; Pamula, V. K., Clinical
Chemistry. 2011, 57 (10), 1444-1451.
23. Wulff-Burchfield, E.; Schell, W. A.; Eckhardt, A. E.; Pollack, M. G.; Hua, Z.; Rouse, J.
L.; Pamula, V. K.; Srinivasan, V.; Benton, J. L.; Alexander, B. D.; Wilfret, D. A.; Kraft, M.;
Cairns, C. B.; Perfect, J. R.; Mitchell, T. G., Diagnostic Microbiology and Infectious Disease.
2010, 67 (1), 22-29.
24. Au, S. H.; Shih, S. C. C.; Wheeler, A. R., Biomed Microdevices. 2011, 13 (1), 41-50.
25. Bogojevic, D.; Chamberlain, M. D.; Barbulovic-Nad, I.; Wheeler, A. R., Lab on a Chip.
2012, 12 (3), 627-634.
26. Ng, A. H. C.; Choi, K.; Luoma, R. P.; Robinson, J. M.; Wheeler, A. R., Analytical
Chemistry. 2012, 84 (20), 8805-8812.
27. Dryden, M. D. M.; Rackus, D. D. G.; Shamsi, M. H.; Wheeler, A. R., Analytical
Chemistry. 2013, 85 (18), 8809-8816.
28. Shamsi, M. H.; Choi, K.; Ng, A. H. C.; Wheeler, A. R., Lab on a Chip. 2014, 14 (3), 547-
554.
29. Kirby, A. E.; Wheeler, A. R., Analytical Chemistry. 2013, 85 (13), 6178-6184.
30. Shih, S. C. C.; Yang, H.; Jebrail, M. J.; Fobel, R.; McIntosh, N.; Al-Dirbashi, O. Y.;
Chakraborty, P.; Wheeler, A. R., Analytical Chemistry. 2012, 84, 3731-3738.
31. Moon, H.; Wheeler, A. R.; Garrell, R. L.; Loo, J. A.; Kim, C.-J. C. J., Lab on a Chip.
2006, 6 (9), 1213-1219.
32. Yang, H.; Luk, V. N.; Abeigawad, M.; Barbulovic-Nad, I.; Wheeler, A. R., Analytical
Chemistry. 2009, 81 (3), 1061-1067.
33. Schell, W. A.; Benton, J. L.; Smith, P. B.; Poore, M.; Rouse, J. L.; Boles, D. J.; Johnson,
M. D.; Alexander, B. D.; Pamula, V. K.; Eckhardt, A. E.; Pollack, M. G.; Benjamin, D. K., Jr.;

99
Perfect, J. R.; Mitchell, T. G., European Journal of Clinical Microbiology & Infectious Diseases.
2012, 31 (9), 2237-2245.
34. Jebrail, M. J.; Sinha, A.; Vellucci, S.; Renzi, R. F.; Ambriz, C.; Gondhalekar, C.;
Schoeniger, J. S.; Patel, K. D.; Branda, S. S., Analytical Chemistry. 2014, 86 (8), 3856-3862.
35. Mousa, N. A.; Jebrail, M. J.; Yang, H.; Abdelgawad, M.; Metalnikov, P.; Chen, J.;
Wheeler, A. R.; Casper, R. F., Science Translational Medicine. 2009, 1 (1).
36. Millington, D. S.; Sista, R.; Eckhardt, A.; Rouse, J.; Bali, D.; Goldberg, R.; Cotten, M.;
Buckley, R.; Pamula, V., Seminars in Perinatology. 2010, 34 (2), 163-169.
37. Jebrail, M. J.; Yang, H.; Mudrik, J. M.; Lafreniere, N. M.; McRoberts, C.; Al-Dirbashi,
O. Y.; Fisher, L.; Chakraborty, P.; Wheeler, A. R., Lab on a Chip. 2011, 11 (19), 3218-3224.
38. Moeller, K. E.; Lee, K. C.; Kissack, J. C., Mayo Clinic Proceedings. 2008, 83 (1), 66-76.
39. Srinivasan, V.; Pamula, V. K.; Fair, R. B., Lab on a Chip. 2004, 4 (4), 310-315.
40. Fair, R. B.; Khlystov, A.; Tailor, T. D.; Ivanov, V.; Evans, R. D.; Griffin, P. B.;
Srinivasan, V.; Pamula, V. K.; Pollack, M. G.; Zhou, J., IEEE Design & Test of Computers.
2007, 24 (1), 10-24.
41. Fiddes, L. K.; Luk, V. N.; Au, S. H.; Ng, A. H. C.; Luk, V.; Kumacheva, E.; Wheeler, A.
R., Biomicrofluidics. 2012, 6 (1).
42. Luk, V. N.; Fiddes, L. K.; Luk, V. M.; Kumacheva, E.; Wheeler, A. R., Proteomics.
2012, 12 (9), 1310-1318.
43. Rivest, C.; Morrison, D. W. G.; Ni, B.; Rubin, J.; Yadav, V.; Mahdavi, A.; Karp, J. M.;
Khademhosseini, A., Journal of Mechanics of Materials and Structures. 2007, 2 (6), 1103-1119.
44. Eydelnant, I. A.; Li, B. B.; Wheeler, A. R., Nature Communications. 2014, 5.
45. Barbulovic-Nad, I.; Au, S. H.; Wheeler, A. R., Lab on a Chip. 2010, 10 (12), 1536-1542.
46. Eydelnant, I. A. U., U.; Li, B.; Liao, M.W.; Wheeler, A.R, Lab on a Chip. 2012, 12, 750-
757.
47. Yang, H.; Mudrik, J. M.; Jebrail, M. J.; Wheeler, A. R., Analytical Chemistry. 2011, 83
(10), 3824-3830.
48. Mudrik, J. M.; Dryden, M. D. M.; Lafreniere, N. M.; Wheeler, A. R., Canadian Journal
of Chemistry-Revue Canadienne De Chimie. 2014, 92 (3), 179-185.
49. Shah, G. J.; Pierstorff, E.; Ho, D.; Kim, C. J. C.; Ieee, Meniscus-assisted magnetic bead
trapping on EWOD-based digital microfluidics for specific protein localization. IEEE: New
York, 2007; p U358-U359.

100
50. Shah, G. J.; Kim, C. J., J. Microelectromech. Syst. 2009, 18 (2), 363-375.
51. Sista, R.; Hua, Z. S.; Thwar, P.; Sudarsan, A.; Srinivasan, V.; Eckhardt, A.; Pollack, M.;
Pamula, V., Lab on a Chip. 2008, 8 (12), 2091-2104.
52. Sista, R. S.; Eckhardt, A. E.; Srinivasan, V.; Pollack, M. G.; Palanki, S.; Pamula, V. K.,
Lab on a Chip. 2008, 8 (12), 2188-2196.
53. Vergauwe, N.; Witters, D.; Ceyssens, F.; Vermeir, S.; Verbruggen, B.; Puers, R.;
Lammertyn, J., Journal of Micromechanics and Microengineering. 2011, 21 (5).
54. Fenn, J. B.; Mann, M.; Meng, C. K.; Wong, S. F.; Whitehouse, C. M., Science. 1989, 246
(4926), 64-71.
55. Karas, M.; Bachmann, D.; Bahr, U.; Hillenkamp, F., International Journal of Mass
Spectrometry and Ion Processes. 1987, 78 (0), 53-68.
56. Tanaka, K.; Waki, H.; Ido, Y.; Akita, S.; Yoshida, Y.; Yoshida, T.; Matsuo, T., Rapid
Communications in Mass Spectrometry. 1988, 2 (8), 151-153.
57. Dubois, P.; Marchand, G.; Fouillet, Y.; Berthier, J.; Douki, T.; Hassine, F.; Gmouh, S.;
Vaultier, M., Analytical Chemistry. 2006, 78 (14), 4909-4917.
58. Luk, V. N.; Wheeler, A. R., Analytical Chemistry. 2009, 81 (11), 4524-4530.
59. Deventer, K.; Pozo, O. J.; Verstraete, A. G.; Van Eenoo, P., Trac-Trends in Analytical
Chemistry. 2014, 55, 1-13.
60. Jebrail, M. J.; Assem, N.; Mudrik, J. M.; Dryden, M. D. M.; Lin, K.; Yudin, A. K.;
Wheeler, A. R., Journal of Flow Chemistry. 2012, 2 (3), 103-107.
61. Edgar, J. S.; Winters, D.; Yoon, S. H.; Monkkonen, L.; Masselon, C. D.; Mackay, C. L.;
Langridge-Smith, P.; Goodlett, D. R. In Coupling Surface Acoustic Wave Nebulization with
Digital Microfluidics for Rapid Hydrogen Deuterium Exchange., 60th ASMS Conference on
Mass Spectrometry and Applied Topics, Vancouver, Canada, Vancouver, Canada, 2012.
62. Kirby, A. E.; Wheeler, A. R., Lab on a Chip. 2013, 13 (13), 2533-2540.
63. Kelly, R. T.; Page, J. S.; Tang, K.; Smith, R. D., Analytical Chemistry. 2007, 79 (11),
4192-4198.
64. Kelly, R. T.; Page, J. S.; Zhao, R.; Qian, W.-J.; Mottaz, H. M.; Tang, K.; Smith, R. D.,
Analytical Chemistry. 2008, 80 (1), 143-149.
65. Chace, D. H., Journal of Mass Spectrometry. 2009, 44 (2), 163-170.
66. Guthrie, R.; Susi, A., Pediatrics. 1963, 32 (3), 338-&.
67. Johannessen, A., Bioanalysis. 2010, 2 (11), 1893-1908.

101
68. Lofgren, S. M.; Morrissey, A. B.; Chevallier, C. C.; Malabeja, A. I.; Edmonds, S.; Amos,
B.; Sifuna, D. J.; von Seidlein, L.; Schimana, W.; Stevens, W. S.; Bartlett, J. A.; Crump, J. A.,
Aids. 2009, 23 (18), 2459-2466.
69. Pitt, J. J., The Clinical biochemist. Reviews / Australian Association of Clinical
Biochemists. 2010, 31 (2), 57-68.
70. Al-Dirbashi, O. Y.; Rashed, M. S.; Jacob, M.; Al-Ahaideb, L. Y.; Al-Amoudi, M.;
Rahbeeni, Z.; Al-Sayed, M. M.; Al-Hassnan, Z.; Al-Owain, M.; Al-Zeidan, H., Biomedical
Chromatography. 2008, 22 (11), 1181-1185.
71. Chalcraft, K. R.; Britz-McKibbin, P., Analytical Chemistry. 2009, 81 (1), 307-314.
72. Barfield, M.; Spooner, N.; Lad, R.; Parry, S.; Fowles, S., Journal of Chromatography B.
2008, 870 (1), 32-37.
73. Green, M. D.; Mount, D. L.; Nettey, H., Journal of Chromatography B-Analytical
Technologies in the Biomedical and Life Sciences. 2002, 767 (1), 159-162.
74. Jansson, Å.; Gustafsson, L. L.; Mirghani, R. A., Journal of Chromatography B. 2003,
795 (1), 151-156.
75. Beaudette, P.; Bateman, K. P., Journal of Chromatography B-Analytical Technologies in
the Biomedical and Life Sciences. 2004, 809 (1), 153-158.
76. Edelbroek, P. M.; Heijden, J. v. d.; Stolk, L. M. L., Therapeutic Drug Monitoring. 2009,
31 (3), 327-336 10.1097/FTD.0b013e31819e91ce.
77. Spooner, N.; Lad, R.; Barfield, M., Analytical Chemistry. 2009, 81 (4), 1557-1563.
78. Spooner, N., Bioanalysis. 2010, 2 (11), 1781.
79. Abu-Rabie, P.; Spooner, N., Analytical Chemistry. 2009, 81 (24), 10275-10284.
80. Li, W.; Tse, F. L. S., Biomedical Chromatography. 2010, 24 (1), 49-65.
81. Hill, H., Bioanalysis. 2009, 1 (8), 1359-1364.
82. Hoppu, K., European Journal of Clinical Pharmacology. 2008, 64 (2), 201-205.
83. Pandya, H. C.; Spooner, N.; Mulla, H., Bioanalysis. 2011, 3 (7), 779-786.
84. Abu-Rabie, P., Bioanalysis. 2011, 3 (15), 1675-1678.
85. Takáts, Z.; Wiseman, J. M.; Gologan, B.; Cooks, R. G., Science. 2004, 306 (5695), 471-
473.
86. Takáts, Z.; Wiseman, J. M.; Cooks, R. G., Journal of Mass Spectrometry. 2005, 40 (10),
1261-1275.

102
87. Wiseman, J. M.; Evans, C. A.; Bowen, C. L.; Kennedy, J. H., Analyst. 2010, 135 (4),
720-725.
88. Manicke, N.; Abu-Rabie, P.; Spooner, N.; Ouyang, Z.; Cooks, R., Journal of The
American Society for Mass Spectrometry. 2011, 22 (9), 1501-1507.
89. Déglon, J.; Thomas, A.; Cataldo, A.; Mangin, P.; Staub, C., Journal of Pharmaceutical
and Biomedical Analysis. 2009, 49 (4), 1034-1039.
90. CAMAG. www.camag.com (accessed July 15, 2013).
91. Sparkholland. www.sparkholland.com (accessed July 15, 2013).
92. Prolab. www.prolab.ch/scap.html (accessed July 15, 2013).
93. Advion - TriVersa NanoMate®. www.advion.com/biosystems/triversa-nanomate/triversa-
mass-spectrometry.php (accessed July 15, 2013).
94. Jebrail, M. J.; Wheeler, A. R., Current Opinion in Chemical Biology. 2010, 14 (5), 574-
581.
95. Jones, T. B., Langmuir. 2002, 18 (11), 4437-4443.
96. Kang, K. H., Langmuir. 2002, 18 (26), 10318-10322.
97. Chatterjee, D.; Hetayothin, B.; Wheeler, A. R.; King, D. J.; Garrell, R. L., Lab on a Chip.
2006, 6 (2), 199-206.
98. Luckwell, J.; Denniff, P.; Capper, S.; Michael, P.; Spooner, N.; Mallender, P.; Johnson,
B.; Clegg, S.; Green, M.; Ahmad, S.; Woodford, L., Bioanalysis. 2013, 5 (21), 2613-2630.
99. Shih, S. C. C.; Fobel, R.; Kumar, P.; Wheeler, A. R., Lab on a Chip. 2011, 11 (3), 535-
540.
100. Shih, S. C. C.; Barbulovic-Nad, I.; Yang, X. N.; Fobel, R.; Wheeler, A. R., Biosensors &
Bioelectronics. 2013, 42, 314-320.
101. Shah, V. P.; Midha, K. K.; Findlay, J. W.; Hill, H. M.; Hulse, J. D.; McGilveray, I. J.;
McKay, G.; Miller, K. J.; Patnaik, R. N.; Powell, M. L.; Tonelli, A.; Viswanathan, C. T.; Yacobi,
A., Pharmaceutical research. 2000, 17 (12), 1551-7.
102. Chang, Y.-H.; Lee, G.-B.; Huang, F.-C.; Chen, Y.-Y.; Lin, J.-L., Biomed Microdevices.
2006, 8 (3), 215-225.
103. Fan, S. K.; Hashi, C.; Kim, C. J. In Manipulation of multiple droplets on NxM grid by
cross-reference EWOD driving scheme and pressure-contact packaging, Proceedings of the 16th
International Conference on Micro Electro Mechanical Systems (MEMS), IEEE: Piscataway, NJ:
2003; pp 694-697.

103
104. Hadwen, B.; Broder, G. R.; Morganti, D.; Jacobs, A.; Brown, C.; Hector, J. R.; Kubota,
Y.; Morgan, H., Lab on a Chip. 2012, 12 (18), 3305-3313.
105. Bowen, C. L.; Dopson, W.; Kemp, D. C.; Lewis, M.; Lad, R.; Overvold, C., Bioanalysis.
2011, 3 (14), 1625-1633.
106. Simonsen, K. W.; Steentoft, A.; Buck, M.; Hansen, L.; Linnet, K., Journal of Analytical
Toxicology. 2010, 34 (7), 367-373.
107. Yiu, K. C. H.; Ho, E. N. M.; Wan, T. S. M., Chromatographia. 2004, 59, S45-S50.
108. Gorbatsova, J.; Borissova, M.; Kaljurand, M., Journal of Chromatography A. 2012, 1234,
9-15.
109. Watson, M. W. L.; Jebrail, M. J.; Wheeler, A. R., Analytical Chemistry. 2010, 82 (15),
6680-6686.
110. Abu-Rabie, P.; Spooner, N., Bioanalysis. 2011, 3 (24), 2769-2781.
111. Fobel, R.; Fobel, C.; Wheeler, A. R., Applied Physics Letters. 2013, 102 (19), 193513-5.
112. Abdelgawad, M.; Wheeler, A. R., Microfluidics and Nanofluidics. 2008, 4 (4), 349-355.
113. Van Berkel, G. J.; Pasilis, S. P.; Ovchinnikova, O., Journal of Mass Spectrometry. 2008,
43 (9), 1161-1180.
114. Hutchings, A. D.; Widdop, B., Chapter 9.23 - Drugs of Abuse. In The Immunoassay
Handbook (Fourth Edition), Wild, D., Ed. Elsevier: Oxford, 2013; pp 963-987.
115. Langman, L. J.; Kapur, B. M., Clinical Biochemistry. 2006, 39 (5), 498-510.
116. Guidelines for the Forensic analysis of drugs facilitating sexual assault and other criminal
acts - ST/NAR/45. United Nations Office on Drugs and Crime: New York., 2011.
117. Dowling, G.; Regan, L.; Tierney, J.; Nangle, M., Journal of Chromatography A. 2010,
1217 (44), 6857-6866.
118. Otero-Fernández, M.; Cocho, J. Á.; Tabernero, M. J.; Bermejo, A. M.; Bermejo-Barrera,
P.; Moreda-Piñeiro, A., Anal. Chim. Acta. 2013, 784 (0), 25-32.
119. Merves, M. L.; Goldberger, B. A., Chapter 13 - Forensic Toxicology. In Principles of
Addictions and the Law, Miller, N. S., Ed. Academic Press: San Diego, 2010; pp 193-201.
120. Jenkins, A. J., Forensic Drug Testing. In Principles of Forensic Toxicology, 2nd ed.;
Levine, B., Ed. AACC Press: Washington, DC, 2006.
121. Clarke, W., Chapter 4 Immunoassays for therapeutic drug monitoring and clinical
toxicology. In Handbook of Analytical Separations, Georg, H., Ed. Elsevier Science B.V.: 2004;
Vol. Volume 5, pp 95-112.

104
122. Melanson, S. E. F., Clinics in Laboratory Medicine. 2012, 32 (3), 429-447.
123. Dasgupta, A., Chapter 14 - Limitations of Drugs of Abuse Testing. In Accurate Results in
the Clinical Laboratory, Dasgupta, A.; Sepulveda, J. L., Eds. Elsevier: San Diego, 2013; pp 213-
232.
124. Bush, D. M., Forensic Sci.Int. 2008, 174 (2-3), 111-119.
125. Kostakis, C.; Harpas, P.; Stockham, P., Chapter 10 - Forensic Toxicology. In Liquid
Chromatography, Fanali, S.; Haddad, P. R.; Poole, C. F.; Schoenmakers, P.; Lloyd, D., Eds.
Elsevier: Amsterdam, 2013; pp 249-293.
126. Emotte, C.; Heudi, O.; Deglave, F.; Bonvie, A.; Masson, L.; Picard, F.; Chaturvedi, A.;
Majumdar, T.; Agarwal, A.; Woessner, R.; Kretz, O., Journal of Chromatography B. 2012, 895–
896 (0), 1-9.
127. Baird, G., Chapter 21 - Clinical Chemistry, Including Therapeutic Drug Monitoring and
Biomarkers for Diagnosis. In Liquid Chromatography, Fanali, S.; Haddad, P. R.; Poole, C. F.;
Schoenmakers, P.; Lloyd, D., Eds. Elsevier: Amsterdam, 2013; pp 611-631.
128. Malcolm, A.; Wright, S.; Syms, R. R. A.; Dash, N.; Schwab, M.-A.; Finlay, A.,
Analytical Chemistry. 2010, 82 (5), 1751-1758.
129. Wells, J. M.; Roth, M.; Keil, A.; Grossenbacher, J.; Justes, D.; Patterson, G.; Barket, D.,
Journal of the American Society for Mass Spectrometry. 2008, 19 (10), 1419-1424.
130. Kumano, S.; Sugiyama, M.; Yamada, M.; Nishimura, K.; Hasegawa, H.; Morokuma, H.;
Inoue, H.; Hashimoto, Y., Analytical Chemistry. 2013, 85 (10), 5033-5039.
131. Li, L.; Chen, T.-C.; Ren, Y.; Hendricks, P. I.; Cooks, R. G.; Ouyang, Z., Analytical
Chemistry. 2014, 86 (6), 2909-2916.
132. Ecelberger S. A., C. T. J., Collins B. F., Lewis D. L., Bryden W. A., Johns Hopkins APL
Tech. Dig. . 2004, 25, 14-19.
133. Shimma, S.; Nagao, H.; Aoki, J.; Takahashi, K.; Miki, S.; Toyoda, M., Analytical
Chemistry. 2010, 82 (20), 8456-8463.
134. Kogan, V. T.; Lebedev, D. S.; Pavlov, A. K.; Chichagov, Y. V.; Antonov, A. S.,
Instruments and Experimental Techniques. 2011, 54 (3), 390-396.
135. Ouyang, Z.; Cooks, R. G., Annu. Rev. Anal. Chem. . 2009, 2, 187-214.
136. Gao, L.; Sugiarto, A.; Harper, J. D.; Cooks, R. G.; Ouyang, Z., Analytical Chemistry.
2008, 80 (19), 7198-7205.

105
137. Hendricks, P. I.; Dalgleish, J. K.; Shelley, J. T.; Kirleis, M. A.; McNicholas, M. T.; Chen,
T. C.; Chen, C.-H.; Duncan, J. S.; Boudreau, F.; Noll, R. J.; Denton, J. P.; Roach, T. A.; Ouyang,
Z.; Cooks, R. G., Analytical Chemistry. 2014, 86 (6), 2900-2908.
138. Andreou, C.; Hoonejani, M. R.; Barmi, M. R.; Moskovits, M.; Meinhart, C. D., ACS
Nano. 2013, 7 (8), 7157-7164.
139. Miyaguchi, H.; Tokeshi, M.; Kikutani, Y.; Hibara, A.; Inoue, H.; Kitamori, T., Journal of
Chromatography A. 2006, 1129 (1), 105-110.
140. Zhu, K.; Leung, K. W.; Ting, A. L.; Wong, Z. F.; Ng, W. Y.; Choi, R. Y.; Dong, T. X.;
Wang, T.; Lau, D. W.; Tsim, K. K., Analytical and Bioanalytical Chemistry. 2012, 402 (9),
2805-2815.
141. Petersen, N. J.; Pedersen, J. S.; Poulsen, N. N.; Jensen, H.; Skonberg, C.; Hansen, S. H.;
Pedersen-Bjergaard, S., Analyst. 2012, 137 (14), 3321-3327.
142. Bai, H.-Y.; Lin, S.-L.; Chan, S.-A.; Fuh, M.-R., Analyst. 2010, 135 (10), 2737-2742.
143. Liu, J., Wang, H., Manicke, N. E., Lin, J.-M., Cooks, R. G., Ouyang, Z., Anal. Chem.
2010, 82 (6), 2463.
144. Su, Y.; Wang, H.; Liu, J.; Wei, P.; Cooks, R. G.; Ouyang, Z., Analyst. 2013, 138 (16),
4443-4447.
145. Baker, C. A., Roper, M. G. , Analytical Chemistry. 2012, 84, 2955-2960.
146. Lafrenière, N. M.; Shih, S. C. C.; Abu-Rabie, P.; Jebrail, M. J.; Spooner, N.; Wheeler, A.
R., Bioanalysis. 2014, 6 (3), 307-318.
147. Gao, L.; Cooks, R. G.; Ouyang, Z., Analytical Chemistry. 2008, 80 (11), 4026-4032.
148. Annesley, T. M., Clinical Chemistry. 2003, 49 (7), 1041-1044.
149. Cooks, R. G.; Manicke, N. E.; Dill, A. L.; Ifa, D. R.; Eberlin, L. S.; Costa, A. B.; Wang,
H.; Huang, G.; Ouyang, Z., Faraday Discussions. 2011, 149 (0), 247-267.
150. Guan, S.; Marshall, A. G., International Journal of Mass Spectrometry and Ion
Processes. 1996, 157–158 (0), 5-37.
151. Peace, M. R.; Tarnai, L. D.; Poklis, A., Journal of Analytical Toxicology. 2000, 24 (7),
589-594.
152. Grönholm, M.; Lillsunde, P., Forensic Sci.Int. 2001, 121 (1–2), 37-46.
153. Zwir-Ferenc, A.; Biziuk, M., Polish Journal of Environmental Studies. 2006, 15 (5), 677-
690.

106
154. Veer, V. S.; Pingale, S. G.; Mangaonkar, K. V., Journal of Liquid Chromatography &
Related Technologies. 2014, 37 (14), 1953-1967.
155. Imbert, L.; Dulaurent, S.; Mercerolle, M.; Morichon, J.; Lachatre, G.; Gaulier, J. M.,
Forensic Sci.Int. 2014, 234, 132-138.
156. Wang, R.; Wang, X.; Liang, C.; Ni, C.; Xiong, L.; Rao, Y.; Zhang, Y., Forensic Sci.Int.
2013, 233 (1-3), 304-311.
157. Raihantaha, M.; Mobasser, S., Soil & Sediment Contamination. 2014, 23 (7), 703-714.
158. Ibrahim, W. A. W.; Abd Ali, L. I.; Sulaiman, A.; Sanagi, M. M.; Aboul-Enein, H. Y.,
Critical Reviews in Analytical Chemistry. 2014, 44 (3), 233-254.
159. Bones, J.; Thomas, K. V.; Paull, B., Journal of Environmental Monitoring. 2007, 9 (7),
701-707.
160. Farre, M. L.; Ferrer, I.; Ginebreda, A.; Figueras, M.; Olivella, L.; Tirapu, L.; Vilanova,
M.; Barcelo, D., Journal of Chromatography A. 2001, 938 (1-2), 187-197.
161. Anastassiades, M.; Lehotay, S. J.; Stajnbaher, D.; Schenck, F. J., Journal of Aoac
International. 2003, 86 (2), 412-431.
162. Paya, P.; Anastassiades, M.; Mack, D.; Sigalova, I.; Tasdelen, B.; Oliva, J.; Barba, A.,
Analytical and Bioanalytical Chemistry. 2007, 389 (6), 1697-1714.
163. Arora, A.; Simone, G.; Salieb-Beugelaar, G. B.; Kim, J. T.; Manz, A., Analytical
Chemistry. 2010, 82 (12), 4830-4847.
164. Kutter, J. P.; Jacobson, S. C.; Ramsey, J. M., Journal of Microcolumn Separations. 2000,
12 (2), 93-97.
165. Ekstrom, S.; Wallman, L.; Helldin, G.; Nilsson, J.; Marko-Varga, G.; Laurell, T., Journal
of Mass Spectrometry. 2007, 42 (11), 1445-1452.
166. Li, J. J.; LeRiche, T.; Tremblay, T. L.; Wang, C.; Bonneil, E.; Harrison, D. J.; Thibault,
P., Molecular & Cellular Proteomics. 2002, 1 (2), 157-168.
167. Oleschuk, R. D.; Shultz-Lockyear, L. L.; Ning, Y. B.; Harrison, D. J., Analytical
Chemistry. 2000, 72 (3), 585-590.
168. Petersen, N. J.; Jensen, H.; Hansen, S. H.; Foss, S. T.; Snakenborg, D.; Pedersen-
Bjergaard, S., Microfluidics and Nanofluidics. 2010, 9 (4-5), 881-888.
169. Nge, P. N.; Pagaduan, J. V.; Yu, M.; Woolley, A. T., Journal of Chromatography A.
2012, 1261, 129-135.
170. Lee, J.; Moon, H.; Fowler, J.; Schoellhammer, T.; Kim, C. J., Sensors and Actuators a-
Physical. 2002, 95 (2-3), 259-268.

107
171. Kirby, A. E.; Lafreniere, N. M.; Seale, B.; Hendricks, P. I.; Cooks, R. G.; Wheeler, A. R.,
Analytical chemistry. 2014, 86 (12), 6121-9.
172. Barbulovic-Nad, I.; Yang, H.; Park, P. S.; Wheeler, A. R., Lab on a Chip. 2008, 8 (4),
519-526.
173. Choi, K.; Ng, A. H. C.; Fobel, R.; Chang-Yen, D. A.; Yarnell, L. E.; Pearson, E. L.;
Oleksak, C. M.; Fischer, A. T.; Luoma, R. P.; Robinson, J. M.; Audet, J.; Wheeler, A. R.,
Analytical Chemistry. 2013, 85 (20), 9638-9646.
174. StatSoft, Inc. 2013, Electronic Statistics Textbook. Tulsa, OK: StatSoft. WEB:
http://www.statsoft.com/textbook/ . (accessed December 8, 2014).
175. Abraham, M. H.; Smith, R. E.; Luchtefeld, R.; Boorem, A. J.; Luo, R.; Acree, W. E.,
Journal of Pharmaceutical Sciences. 2010, 99 (3), 1500-1515.
176. Emani, S.; Sista, R.; Loyola, H.; Trenor, C. C., III; Pamula, V. K.; Emani, S. M., Blood
Coagulation & Fibrinolysis. 2012, 23 (8), 760-768.
177. Tsaloglou, M.-N.; Jacobs, A.; Morgan, H., Analytical and Bioanalytical Chemistry. 2014,
406 (24), 5967-5976.
178. Kumar, P. T.; Toffalini, F.; Witters, D.; Vermeir, S.; Rolland, F.; Hertog, M. L. A. T. M.;
Nicolai, B. M.; Puers, R.; Geeraerd, A.; Lammertyn, J., Sensors and Actuators B-Chemical.
2014, 199, 479-487.
179. Mei, N.; Seale, B.; Ng, A. H. C.; Wheeler, A. R.; Oleschuk, R., Analytical Chemistry.
2014, 86 (16), 8466-8472.
180. Luk, V. N.; Mo, G. C. H.; Wheeler, A. R., Langmuir. 2008, 24 (12), 6382-6389.
181. Au, S. H.; Kumar, P.; Wheeler, A. R., Langmuir. 2011, 27 (13), 8586-8594.
182. Sarvothaman, M. K.; Kim, K. S.; Seale, B.; Brodersen, P. M.; Walker, G. C.; Wheeler, A.
R., Advanced Functional Materials. 2014, In Press.
183. Amin, A. S.; Al-Attas, A. S., Journal of Saudi Chemical Society. 2012, 16 (4), 451-459.
184. Jonker, M. T. O.; Koelmans, A. A., Environmental Science & Technology. 2001, 35 (18),
3742-3748.
185. Solid Phase Extraction Solutions.
http://www.gilson.com/en/AI/Categories/9/#.VGy2efnF-84 (accessed November 19, 2014).
186. Fu, S. L.; Lewis, J., Journal of Analytical Toxicology. 2008, 32 (4), 292-297.
187. Janiszewski, J. S.; Swyden, M. C.; Fouda, H. G., Journal of Chromatographic Science.
2000, 38 (6), 255-258.

108
188. Synaridou, M.-E. S.; Sakkas, V. A.; Stalikas, C. D.; Albanis, T. A., Journal of
Chromatography A. 2014, 1348 (0), 71-79.
189. Sayar, O.; Aboufazeli, F.; Reza Lotfi Zadeh Zhad, H.; Sadeghi, O.; Karimi, M.; Najafi,
E., Current Neuropharmacology. 2014, 10 (4), 512-521.
190. Coscolla, C.; Navarro-Olivares, S.; Marti, P.; Yusa, V., Talanta. 2014, 119, 544-552.
191. Hühmer, A. F. R.; Aced, G. I.; Perkins, M. D.; Gürsoy, R. N.; Jois, D. S. S.; Larive, C.;
Siahaan, T. J.; Schöneich, C., Analytical Chemistry. 1997, 69 (12), 29-58.
192. Issaq, H. J.; Conrads, T. P.; Janini, G. M.; Veenstra, T. D., Electrophoresis. 2002, 23
(17), 3048-3061.
193. Wang, Z.; Jemere, A. B.; Harrison, D. J., Electrophoresis. 2012, 33 (21), 3151-3158.
194. Neufang, S.; Specht, K.; Hausmann, M.; Guentuerkuen, O.; Herpertz-Dahlmann, B.;
Fink, G. R.; Konrad, K., Cerebral Cortex. 2009, 19 (2), 464-473.
195. Gray, A.; Feldman, H. A.; Mckinlay, J. B.; Longcope, C., The Journal of Clinical
Endocrinology & Metabolism. 1991, 73 (5), 1016-1025.
196. Maria, N. D.; Manno, M.; Villa, E., Molecular and Cellular Endocrinology. 2002, 193
(1–2), 59-63.
197. Platz, E. A.; Giovannucci, E., Journal of Steroid Biochemistry and Molecular Biology.
2004, 92 (4), 237-253.
198. Townsend, E. A.; Miller, V. M.; Prakash, Y. S., Endocrine Reviews. 2012, 33 (1), 1-47.
199. Villablanca, A. C.; Jayachandran, M.; Banka, C., Clinical Science. 2010, 119 (11-12),
493-513.
200. Lamar, C. A.; Dorgan, J. F.; Longcope, C.; Stanczyk, F. Z.; Falk, R. T.; Stephenson, H.
E., Cancer Epidemiology Biomarkers & Prevention. 2003, 12 (4), 380-383.
201. Mousa, N. A.; Eiada, R.; Crystal, P.; Nayot, D.; Casper, R. F., Menopause-the Journal of
the North American Menopause Society. 2012, 19 (4), 420-425.
202. Thurlimann, B.; Keshaviah, A.; Coates, A. S.; Mouridsen, H.; Mauriac, L.; Forbes, J. F.;
Paridaens, R.; Castiglione-Gertsch, M.; Gelber, R. D.; Rabaglio, M.; Smith, I.; Wardly, A.; Price,
K. N.; Goldhirsch, A.; Grp, B. I. G. C., New England Journal of Medicine. 2005, 353 (26), 2747-
2757.
203. Younus, M.; Kissner, M.; Reich, L.; Wallis, N., Drug Safety. 2011, 34 (12), 1125-1149.
204. Hickey, T. E.; Robinson, J. L. L.; Carroll, J. S.; Tilley, W. D., Molecular Endocrinology.
2012, 26 (8), 1252-1267.

109
205. Macedo, L. F.; Guo, Z.; Tilghman, S. L.; Sabnis, G. J.; Qiu, Y.; Brodie, A., Cancer
Research. 2006, 66 (15), 7775-7782.
206. Macedo, L. F.; Sabnis, G.; Brodie, A., Aromatase Inhibitors and Breast Cancer. In
Steroid Enzymes and Cancer, Bradlow, H. L.; Carruba, G., Eds. 2009; Vol. 1155, pp 162-173.
207. McBryan, J.; Theissen, S. M.; Byrne, C.; Hughes, E.; Cocchiglia, S.; Sande, S.; O'Hara,
J.; Tibbitts, P.; Hill, A. D. K.; Young, L. S., Cancer Research. 2012, 72 (2), 548-559.
208. Miller, W. R.; Larionov, A. A., Breast Cancer Research. 2012, 14 (1).
209. Häggstrom, M.; Richfield, D., Wikiversity Journal of Medicine. 2014, 1 (1),
http://upload.wikimedia.org/wikipedia/commons/1/13/Steroidogenesis.svg (accessed August 23,
2014).
210. Smith, S.; Pfeifer, S. M.; Collins, J. A., Jama-Journal of the American Medical
Association. 2003, 290 (13), 1767-1770.
211. Kaaks, R.; Rinaldi, S.; Key, T. J.; Berrino, F.; Peeters, P. H. M.; Biessy, C.; Dossus, L.;
Lukanova, A.; Binghan, S.; Khaw, K. T. G.; Allen, N. E.; Bueno-De-Mesquita, H. B.; van Gils,
C. H.; Grobbee, D.; Boeing, H.; Lahmann, P. H.; Nagel, G.; Chang-Claude, J.; Clavel-Chapelon,
F.; Fournier, A.; Thiebaut, A.; Gonzalez, C. A.; Quiros, J. R.; Tormo, M. J.; Ardanaz, E.;
Amiano, P.; Krogh, V.; Palli, D.; Panico, S.; Tumino, R.; Vineis, P.; Trichopoulou, A.;
Kalapothaki, V.; Trichopoulos, D.; Ferrari, P.; Norat, T.; Saracci, R.; Riboli, E., Endocrine-
Related Cancer. 2005, 12 (4), 1071-1082.
212. Severi, G.; Morris, H. A.; MacInnis, R. J.; English, D. R.; Tilley, W.; Hopper, J. L.;
Boyle, P.; Giles, G. G., Cancer Epidemiology Biomarkers & Prevention. 2006, 15 (1), 86-91.
213. Lukanova, A.; Lundin, E.; Akhmedkhanov, A.; Michel, A.; Rinaldi, S.; Zeleniuch-
Jacquotte, A.; Lenner, P.; Muti, P.; Biessy, C.; Krogh, V.; Berrino, F.; Hallmans, G.; Riboli, E.;
Kaaks, R.; Toniolo, P., International Journal of Cancer. 2003, 104 (5), 636-642.
214. VandenBoer, T. C.; Grummett, S. A.; Watterson, J. H., J. Forensic Sci. 2008, 53 (6),
1474-1482.
215. Lafrenière, N. M.; Watterson, J. H., Forensic Sci.Int. 2009, 185 (1-3), 100-106.
216. Denniff, P.; Spooner, N., Bioanalysis. 2010, 2 (8), 1385-1395.
217. Li, F.; Ploch, S.; Fast, D.; Michael, S., Journal of Mass Spectrometry. 2012, 47 (5), 655-
667.
218. Li, F.; Zulkoski, J.; Fast, D.; Michael, S., Bioanalysis. 2011, 3 (20), 2321-2333.
219. Barfield, M.; Wheller, R., Analytical Chemistry. 2010, 83 (1), 118-124.
110
220. Abdel-Rehim, A.; Abdel-Rehim, M., Biomedical Chromatography. 2014, 28 (6), 875-
877.
221. Chace, D. H.; Lappas, N. T., The Use of Dried Blood Spots and Stains in Forensic
Science. In Dried Blood Spots, John Wiley & Sons, Inc.: 2014; pp 140-150.
222. Abu-Rabie, P.; Denniff, P.; Spooner, N.; Brynjolffssen, J.; Galluzzo, P.; Sanders, G.,
Analytical Chemistry. 2011, 83 (22), 8779-8786.
223. Mess, J.-N.; Taillon, M.-P.; Côté, C.; Garofolo, F., Biomedical Chromatography. 2012,
26 (12), 1617-1624.
224. Kim, H.; Bartsch, M. S.; Renzi, R. F.; He, J.; Van de Vreugde, J. L.; Claudnic, M. R.;
Patel, K. D., Jala. 2011, 16 (6), 405-414.
225. Kim, H.; Jebrail, M. J.; Sinha, A.; Bent, Z. W.; Solberg, O. D.; Williams, K. P.;
Langevin, S. A.; Renzi, R. F.; Van De Vreugde, J. L.; Meagher, R. J.; Schoeniger, J. S.; Lane, T.
W.; Branda, S. S.; Bartsch, M. S.; Patel, K. D., Plos One. 2013, 8 (7).
226. Holland, L. A.; Chetwyn, N. P.; Perkins, M. D.; Lunte, S. M., Pharmaceutical research.
1997, 14 (4), 372-387.