Applications and Technology of Electronic Nose for...
12
Open Journal of Applied Biosensor, 2013, 2, 39-50 http://dx.doi.org/10.4236/ojab.2013.22005 Published Online May 2013 (http://www.scirp.org/journal/ojab) Applications and Technology of Electronic Nose for Clinical Diagnosis Simeng Chen, Yuchao Wang, Seokheun Choi * Department of Electrical & Computer Engineering, State University of New York at Binghamton, Binghamton, USA Email: * [email protected] Received January 28, 2013; revised March 14, 2013; accepted March 22, 2013 Copyright © 2013 Simeng Chen et al. This is an open access article distributed under the Creative Commons Attribution License, which permits unrestricted use, distribution, and reproduction in any medium, provided the original work is properly cited. ABSTRACT Rapid advances in sensor technologies have facilitated the development of high-performance electronic noses that can detect and discriminate volatile compounds in situ. The research and development of electronic noses has resulted in a new qualitative and semi-quantitative detection approach in the field of clinical diagnostics. Electronic noses have a clear potential to be a non-invasive, simple and rapid but above all accurate early diagnostic screening tool. This review collates existing knowledge of recent advances in electronic nose technologies and applications. Keywords: Electronic Nose; Biosensor; Clinical Diagnosis 1. Introduction Due to an increase in awareness that the early detection of diseases greatly increases the chances for successful treatment, there is an urge in demand for inexpensive, non-invasive, simple, and fast early qualitative diagnosis of diseases. Using odors to detect diseases can be traced back to ancient times, originating with Hippocrates around 400 B.C., and is directly related to traditional medicine in different cultures [1].The selective detection of various volatile compounds in odors sampled from the human body is of great significance to early clinical dia- gnosis. Many methodologies have been applied to invest- tigate the odor feature of samples, and human assessment has been the main tool of diagnosis for many years. How- ever, this evaluation has its deficiencies, such as subject- tivity, variability, time consumption, low reproducibility, fatigue, and infections. Recently, an objective instrument like gas chromatography coupled with mass spectrometry has become one of the most widely used analytical de- tectors for clinical diagnosis [2]. Nevertheless, these ana- lytical instruments are large, expensive and require trained operators, which place significant limitations on their applications and potential markets. Therefore, a new instrumental methodology of mimicking the human ol- factory perceptions to odor profiles can revolutionize clinical diagnostics because of its ability to be a non- invasive, simple, rapid and accurate early diagnostic tool. Along with the significant developments in biosensors, electronic noses have been developed for detecting vola- tile compounds from the human body for clinical diagno- sis, such as rapid detection of tuberculosis (TB), Helico- bacter pylori (HP) and urinary tract infections (UTI). This review aims to describe the use of electronic noses in clinical diagnosis. The main features and the working principles of modern electronic noses are intro- duced. The current electronic nose technology and the most relevant contributions in disease diagnoses are pre- sented afterwards. Finally, some interesting remarks concerning the challenges and future trends of electronic noses in medical application are mentioned. 2. Components and Techniques of an E-Nose in Clinical Diagnosis An electronic nose is first defined as a device which comprises of an array of chemical sensors with different selectivity, a signal-preprocessing unit and a pattern rec- ognition system [3].The interaction between volatile or- ganic compounds (VOC) with an array of sensors gener- ates a characteristic fingerprint which can be recognized by comparing it with previously recorded patterns in the recognition system. Electronic noses can be used for de- tecting bacterial pathogens, either in vitro or in vivo, or as a potential tool for the identification of patients with diseases, such as lung cancer, chronic obstructive pul- monary disease (COPD) and asthma [4]. In a broader sense, an electronic nose device is composed of three * Corresponding author. Copyright © 2013 SciRes. OJAB
Transcript of Applications and Technology of Electronic Nose for...

Open Journal of Applied Biosensor, 2013, 2, 39-50 http://dx.doi.org/10.4236/ojab.2013.22005 Published Online May 2013 (http://www.scirp.org/journal/ojab)
Applications and Technology of Electronic Nose for Clinical Diagnosis
Simeng Chen, Yuchao Wang, Seokheun Choi* Department of Electrical & Computer Engineering, State University of New York at Binghamton, Binghamton, USA
Email: *[email protected]
Received January 28, 2013; revised March 14, 2013; accepted March 22, 2013
Copyright © 2013 Simeng Chen et al. This is an open access article distributed under the Creative Commons Attribution License, which permits unrestricted use, distribution, and reproduction in any medium, provided the original work is properly cited.
ABSTRACT
Rapid advances in sensor technologies have facilitated the development of high-performance electronic noses that can detect and discriminate volatile compounds in situ. The research and development of electronic noses has resulted in a new qualitative and semi-quantitative detection approach in the field of clinical diagnostics. Electronic noses have a clear potential to be a non-invasive, simple and rapid but above all accurate early diagnostic screening tool. This review collates existing knowledge of recent advances in electronic nose technologies and applications. Keywords: Electronic Nose; Biosensor; Clinical Diagnosis
1. Introduction
Due to an increase in awareness that the early detection of diseases greatly increases the chances for successful treatment, there is an urge in demand for inexpensive, non-invasive, simple, and fast early qualitative diagnosis of diseases. Using odors to detect diseases can be traced back to ancient times, originating with Hippocrates around 400 B.C., and is directly related to traditional medicine in different cultures [1].The selective detection of various volatile compounds in odors sampled from the human body is of great significance to early clinical dia- gnosis. Many methodologies have been applied to invest- tigate the odor feature of samples, and human assessment has been the main tool of diagnosis for many years. How- ever, this evaluation has its deficiencies, such as subject- tivity, variability, time consumption, low reproducibility, fatigue, and infections. Recently, an objective instrument like gas chromatography coupled with mass spectrometry has become one of the most widely used analytical de- tectors for clinical diagnosis [2]. Nevertheless, these ana- lytical instruments are large, expensive and require trained operators, which place significant limitations on their applications and potential markets. Therefore, a new instrumental methodology of mimicking the human ol- factory perceptions to odor profiles can revolutionize clinical diagnostics because of its ability to be a non- invasive, simple, rapid and accurate early diagnostic tool.
Along with the significant developments in biosensors, electronic noses have been developed for detecting vola- tile compounds from the human body for clinical diagno- sis, such as rapid detection of tuberculosis (TB), Helico- bacter pylori (HP) and urinary tract infections (UTI).
This review aims to describe the use of electronic noses in clinical diagnosis. The main features and the working principles of modern electronic noses are intro- duced. The current electronic nose technology and the most relevant contributions in disease diagnoses are pre- sented afterwards. Finally, some interesting remarks concerning the challenges and future trends of electronic noses in medical application are mentioned.
2. Components and Techniques of an E-Nose in Clinical Diagnosis
An electronic nose is first defined as a device which comprises of an array of chemical sensors with different selectivity, a signal-preprocessing unit and a pattern rec- ognition system [3].The interaction between volatile or- ganic compounds (VOC) with an array of sensors gener- ates a characteristic fingerprint which can be recognized by comparing it with previously recorded patterns in the recognition system. Electronic noses can be used for de- tecting bacterial pathogens, either in vitro or in vivo, or as a potential tool for the identification of patients with diseases, such as lung cancer, chronic obstructive pul- monary disease (COPD) and asthma [4]. In a broader sense, an electronic nose device is composed of three *Corresponding author.
Copyright © 2013 SciRes. OJAB

S. M. CHEN ET AL. 40
systems: 1) a sample delivery system, 2) a detection sys- tem and 3) a data computing system [5].
2.1. Sample Delivery System
The sample delivery system introduces odors to be ana- lyzed into the detection system. It includes a pretreatment step whose goal is to enrich, clean up and enhance the signal. Although this step tends to be slow and labor- intensive, it improves the quality of the analysis by adopting an appropriate sampling technique. Current main techniques to introduce the volatile compounds extracted from samples into the electronic nose detection system are described thereafter.
2.1.1. Static Headspace Extraction (SHS) Static headspace extraction (SHS) is one of the most common techniques for quantitative and qualitative ana- lysis of volatile compounds from a variety of matrices. In the SHS technique, a sample is placed in a hermetically sealed vial and then volatile components can be extracted from the sample once equilibrium has been established between the matrix and the gaseous phase. The form of matrix of the sample, vial volume and temperature are the main factors to optimize the extraction for efficiency, sensitivity, quantitation and reproducibility. Bernabei et al. has adopted SHS to extract volatile compounds from the headspace of urine samples for diagnosing urinary tract cancers experiment [6].
2.1.2. Dynamic Headspace Extraction (DHS) Dynamic headspace extraction (DHS) or purge and trap (P&T) relies on the volatility of analytes to achieve ex- traction from the matrix like SHS technique. However, VOC are removed from the sample continuously by a flowing gas before equilibrium is achieved between the gaseous phase and matrix. In the purge and trap tech- nique, samples are placed in a purged vessel and the vo- latile components are purged by a stream of inert gas and trapped into an adsorbent. The trap is subsequently heated to desorb VOC molecules into a detection system which increases sensitivity for analysis. Kanoh et al. un-dertook a study of diagnosing interstitial lung diseases using trap and purge to concentrate ethane from exhaled breath samples. Activated coconut charcoal surrounded by dry ice is used as adsorbent to trap the sampled gas and then heated to drive off the absorbed ethane. The desorbed gas was transferred to an airtight syringe for analysis [7].
2.1.3. Solid-Phase Microextraction (SPME) Solid-phase microextraction (SPME) involves the use of a fiber coated with sorptive material in the headspace of the sample to extract volatile analytes from a sample ma-
trix onto the fiber. After extraction has ideally reached equilibrium, the fiber is heated to desorb the solutes into the detection system. Success relies on choosing an ap- propriate coating for volatile analytes, extraction time, sample volume, heating temperature, and modification of the sample matrix. For multianalyte extraction, the use of several diverse SPME fiber coatings can be taken into consideration. Dixon et al. employed SPME to facilitate the isolation and analysis of VOCs from human feces for diagnosing human health conditions. They indicated that multifarious nature of metabolites present in human feces dictates the use of different SPME fiber coatings. Eight different SPME fibers are utilized as a set of fibers ap- propriate for human fecal VOC metabolomics and ob- tained an evaluation of 90% isolation of the total me- tabolites [8].
There are a variety of techniques available for the ex- traction of VOCs from various matrices. The choice of sampling headspace technique used as the sample delive- ry system depends on the type of sample matrix, infor- mation required (quantitative or qualitative), sensitivity required, the need for automation and budget. SHS is the most widely used extraction method due to its minimal sample preparation, simplicity, rapidity, use of little or no solvent, and inexpensive characteristic. However, SHS has a low sensitivity as analytes are not pre-concentrated. Introducing a pre-concentration step can improve sensi- tivity, at the cost of increasing the time of analysis. In addition, incomplete desorption of VOCs, introductions of impurities, decomposition of analytes and irreversible adsorption might occur during the pre-concentration step. For instance, silica gel and Tenax are commonly used sorbents for trapping VOCs. Tenax is a porous polymer resin which has a low affinity for water. However, highly volatile compounds and polar volatile compounds are poorly retained on Tenax. It might decompose when heated to temperature above 200˚C. Silica gel is a stron- ger sorbent than Tenax and its hydrophilic characteristic makes it an excellent material for trapping polar com- pounds but it also retains water.
2.2. Detection System
Technology in detection systems has developed signify- cantly along with advances in different sensor platforms and complex microarray devices. Since the first sensor array was developed using Metal Oxide Semiconductor (MOS), various advanced devices based on nanotech- nology have been developed including metal oxide semiconducting field effect transistors (MOSFET), con- ducting polymer sensors (CP), optical sensors, quartz crystal microbalance sensors (QCM), and surface acous- tic sensors (SAW) [9-13].
Copyright © 2013 SciRes. OJAB

S. M. CHEN ET AL. 41
2.2.1. Metal Oxide Semiconductor (MOS) Sensor MOS sensors are one of the most commonly utilized sensor systems as they possess a broad range of elec- tronic, chemical, optical and physical properties that are often stable to vary with the composition of surrounding gas atmosphere [14]. The oxide materials in MOS sen- sors contain chemically adsorbed oxygen species, which can interact with gaseous molecules on the metal oxide surface thus altering the conductivity of the oxide [15]. The change in resistance depends on the VOC that inter- acts with the adsorbed oxygen on the semiconductor, the metal oxide grain size and the temperature at which the sensing takes place [16]. MOS sensors have the advan- tage of being inexpensive, robust, long lasting and rapi- dly responsive; nevertheless, they require high-tem- perature material processing, generally functioning at 300-500˚C, to allow rapid and reversible reactions at the sensor surface and avoid formation of a layer of chemi- sorbed water that would inhibit the reaction with VOCs [17-20]. These results in large power consumption espe- cially in traditional MOS sensors configured as single crystals, thin/thick films and ceramics [21-23].
2.2.2. Metal-Oxide-Semiconductor Field-Effect Transistor (MOSFET)
MOSFET odor sensing devices works on the principle that VOCs interact with the gate material, usually a cata- lytic metal, leading to gas diffusion through the gate and thus changing the threshold voltage of the device. It has been proven that the shift of the threshold voltage is proportional to the concentration of the analyte. For gas diffusion to occur, a porous gas sensitive gate material is required to facilitate diffusion of gas into the material [24]. Conducting polymers have been widely used as the gate material, such as poly (ethylene-co-vinyl, acetate, poly (styrene-co-butadiene), poly (9-vinylcarbazole) and platinum (Pt), palladium (Pd) and iridium (Ir) can be employed as catalytic metals. MOSFETs can be pro- duced using standard micro-fabrication techniques and operated at much lower temperatures (around 150˚C) than MOS sensors. The sensitivity can be optimized by changing the gate material and thickness, porosity of the metal gate, and operation at different temperatures. MOSFET sensors are robust and can be made with IC fabrication processes which minimize batch-to-batch variations. However, MOSFET sensors undergo baseline drift similar to that of the conductivity sensors.
2.2.3. Conducting Polymer (CP) Sensors Conducting polymers are widely used as sensor elements in electronic noses as they provide different reversible physic-chemical properties and high sensitivity to groups of volatile compounds. In these sensors, interaction be- tween polymers and volatile compounds lead to a change
in resistance of conducting polymers on a sensor surface. Different polymers respond to diverse vapors with diffe- rent physiochemical properties and properties of CPs strongly depend on doping level, ion size of the dopant, protonation level and water content. A number of clinical applications of conducting polymers to electronic noses have been performed in several years. Aathithan et al. used a commercial electronic nose consisting of an array of polymer sensors to diagnose bacteriuria by detection of VOCs in urine [23]. Fend et al. used an electronic nose consisting of 14 different polymers to implement early detection of Tuberculosis [25]. In comparison with MOS which operates at high temperature, CP sensors can quickly respond to VOCs under ambient temperature conditions [26]. However, CPs are easily affected by hu- midity and sensor drift due to oxidation of the polymer over time [27].
2.2.4. Optical Sensors In optical electronic noses, a light source excites the volatile analyte, producing a signal that can be measured in resulting absorbance, fluorescence, polarization, re- fractive index, interference, scattering and reflectance [28]. An optical sensor in detection system comprises four basic components: a light source, suitable optics for directing light to and from the sensor, sensing materials or sensor and a photodetector for detecting light signals coming from the sensor. A wide selection of light sources are available for optical sensors, including highly coherent gas and semiconductor diode lasers, broad spectral band incandescent lamps, and narrow-band, solid-state, light-emitting diodes (LEDs) [29-32]. Photo- diodes, CCD and CMOS cameras can be employed to detect output signals, but the choice must be made care- fully and take into account the specifications required, such as sensitivity, detectivity, noise, spectral response, and response time. Optical sensors can generally be categorized into two types, i.e. intrinsic optical and ex- trinsic optical sensors. For an intrinsic sensor, gaseous compounds can be detected directly by measuring chang- es in optical properties on the sensing surface such as absorbance, fluorescence and refractive index at their absorption, emission or resonance wavelengths. Based on this idea, some approaches applied to electronic noses have been developed including waveguides method, sur- face plasmon resonance, interference or reflection-based method, and scanning light-pulse technique. For an ex- trinsic sensor, an indicating species is employed to detect the analyte by being attached on an optical substrate. Indicators can be dyes, polymers or other materials that interact with the analyte to produce signal modulation. The colorimetric method is the most commonly used technique using this theory. Over the past two decades, advanced optical sensing in clinical diagnosis applica-
Copyright © 2013 SciRes. OJAB

S. M. CHEN ET AL.
Copyright © 2013 SciRes. OJAB
42
tions has been developed with the advent of revolutions in detector technology. In a breath analysis study, Wang and Sahay analyzed 14 of the established breath bio- markers, i.e., ethane, ammonia, acetone, nitric oxide and carban dioxide by applying a laser absorption spectro- scopic technique [33]. Mitsubayashi et al. conducted research on an optical bio-sniffer for methyl mercaptan in halitosis [34]. Choi et al. used a SPR protein sensor using the Vroman effect for real-time, sensitive and se- lective detection of proteins. This protein detector can be integrated with microfluidic systems which can provide extremely sensitive and selective analytical capability [35].
2.2.5. Piezoelectric Sensors Piezoelectric sensors rely on the piezoelectric effect, discovered by the Curie brothers in 1880, which states that certain crystals generate an electrical potential pro- portional to an applied mechanical stress. Inversely, when an electric potential is applied, piezoelectric crys- tals undergo a mechanical deformation which can in turncreate a mechanical pressure. In these sensors, piezo- electric crystals have a resonant frequency which is highly sensitive to the mass change applied to the crys- tals [28]. Selective coating sallow specific gaseous com- pounds to be adsorbed on the crystal, leading to an in- crease in mass and changing the frequency of oscillation correlated with analyte concentration. Several different forms of piezoelectric sensors exist, including bulk acoustic wave (BAW), surface acoustic wave (SAW),
quartz crystal microbalance (QCM), flexural plate wave (FPW) and shear horizontal acoustic plate mode (SH- APM). Many researchers are involved with optimizing the methodology of piezoelectric sensor. Wang et al. used a pair of SAW sensors to detect different VOCs exhaled by lung cancer cells. Breaths odors are collected in inert Tedlar bags and pre-concentrated by a heat de- sorption system. Polymer film was attached on the sur- face of SAW sensors to improve the sensitivity of detec- tion. VOCs were continuously absorbed on the polymer coated SAW sensor and the frequency response was de- tected. The SAW sensors can discriminate breath from lung cancer patients, chronic bronchitis patients and healthy persons for pathology analysis. It was found that the results from the SAW sensors compared favorably with those obtained by GC-MS [36]. An electronic nose based on eight QCM gas sensors was employed to meas- ure urine headspace for an early and non-invasive diag- nosis of urinary tract cancers. QCM sensors are coated by sensing layers of metalloporphyrins. It is shown that the electronic nose is able to detect anomalous composi- tion of urine headspace and has 100% accuracy for clas- sification of patients and healthy people [6].
Table 1 gives an overall summary in advantages, dis- advantages, and application fields for the mentioned sensing methods.
2.3. Data Computing System
In data computing systems, pattern-recognition techni-
Table 1. A summary of gas sensing methods.
Sensor Type Principle Sensitivity Advantages Disadvantages Ref.
Metal Oxide Semiconductors
Conductivity 5 -500 ppm Low cost;
Short response time; long-lasting Relatively low sensitivity; High energy consumption
[37,38]
Conducting Polymers
Conductivity 0.1 - 100 ppm
Short response time Low cost of fabrication;
portable structure; Low energy consumption
Long-time instability; Irreversibility; Poor selectivity
[39-41]
Optical Fluorescence;
Chemoluminescence
Low parts per billion (ppb)
High sensitivity; Long lifetime;
Insensitive to environment change
Difficulty in miniaturization High cost
[42,43]
Quarz Crystal Mrobalance
(QCM) Piezoelectricity
1.0-ng mass change
High sensitivity; Fast response times
Good CMOS compatibility & scalability;
Complex fab. Process; Interference from humidity &
temp; Low signal to noise ratio;
[44-47]
Surface Acoustic Wave(SAW)
Piezoelectricity 1.0-pg mass
chnge
High sensitivity Good CMOS compatibility &
scalability
Unstable at higher temp; Complex readout circuitary
[48-50]
Carbon nanotubes
Conductivity Low parts per
million
Ultra-sensitive; Great adsorptive capacity;
Large surface-area-to-volume ratio
Diffculties is fabrication and repeatability;
High cost [51-53]
Calorimetric Methods
Calorimetry 10 - 100 ppm Stability; Low cost;
Adequate sensitivity;
Risk of catalyst poisoning and explosion;
Deficiencies in selectivity [54,55]

S. M. CHEN ET AL. 43
ques are utilized for data processing of multivariate res- ponse generated by the sensor array [56]. The process of recognition starts after the sensor signals have been ac- quired and stored in the computer. It can be split into four sequential stages: signal preprocessing, dimension- ality reduction, prediction and validation as shown in Figure 1 [57]. Signal preprocessing is the first stage of whole process, focusing on compensating for sensor drift, extracting descriptive parameters from the sensor array response and preparing the feature vector for further processing. The dimensionality reduction stage aims at reducing the initial feature vector dimensionality to avoid problems with high-dimensional datasets. The prediction stage works on data classification, regression, or cluster- ing. Classification solves the problem of identifying an unknown odor sample from previously learned odorants in database. Regression is to predict the properties of analytes, e.g. concentration and quality. Clustering ad- dresses the problem of finding spatial relationships or si-
milarities among data samples. The final stage, validation, selects models and parameter settings and estimates the true error rates for a trained model. Figure 2 shows the data processing scheme of pattern analysis techniques in electronic noses.
Pattern-recognition methods can be divided into two categories: unsupervised and supervised learning proce- dures. For supervised pattern recognition, an unknown odor is tested and classified according to a knowledge base, which requires a priori knowledge about the classes contained within the training sample. In contrast, unsu- pervised methods learn to separate the different classes from the response vector, discriminating between un- known odor vectors without corresponding odor class de- scriptions [58].
Principal Components Analysis (PCA) is a com- monly used technique of unsupervised pattern-recogni- tion for its fast computing speed. PCA is a linear feature extraction technique which focuses on visualizing the
Figure 1. Four sequential stages in data processing.
Figure 2. Data processing scheme and available techniques.
Copyright © 2013 SciRes. OJAB
S. M. CHEN ET AL. 44
most reliable data cloud within a low dimensional space. By projecting variables onto fewer dimensions, original data can be condensed to a few variables reflecting the most relevant analytical information. This offers an ad- vantage that the classification and regression of un- knowns is processed much faster, thus reducing detection time. However, if the sensor output parameters are not linear, interpolation of features may occur in the results of PCA, because PCA is a linear technique that treats all sensors equally, leading to unduly influence the sensors’ performance.
Linear Discriminant Analysis (LDA) is a supervised method performing dimensionality reduction while pre- serving as much class discriminatory information as pos- sible. LDA provides an algorithm to carefully establish a discriminant function for predictors, aiming to achieve maximum separation between data classes. Choi et al. employed a microfluidic device to monitor protein dis- tributions using LDA to quantitatively differentiate the SPR angle patterns on the sensing surfaces with pre-ad- sorbed proteins [59]. However, when the number of ob- servations is limited compared to the dimension of the feature space, a reliable classifier can be seriously de- graded if only using LDA. Hence, it is necessary for a data reduction, e.g. PCA, precede LDA for data classify- cation. Aamir and Hasan investigated a biometric iden- tity system using PCA and LDA. It is observed that using PCA and LDA jointly achieved accurate results and sig- nificantly decreased the complexity [60].
3. Applications of Electronic Noses in Clinical diagnosis
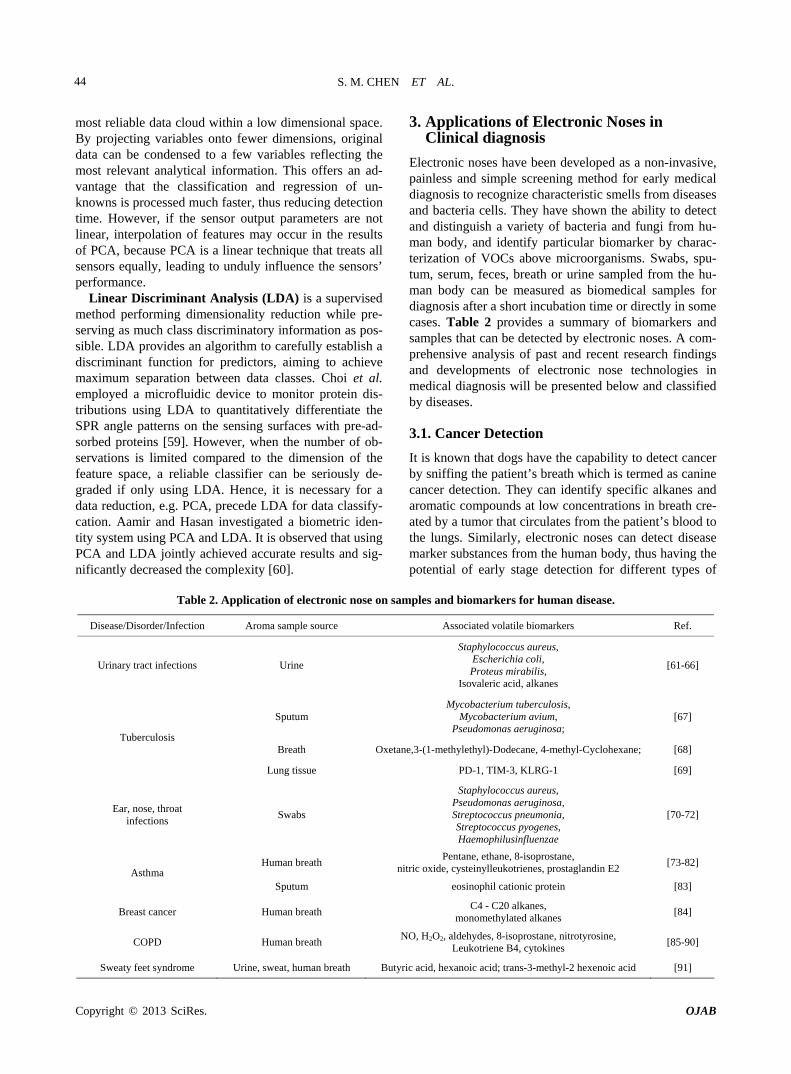
Electronic noses have been developed as a non-invasive, painless and simple screening method for early medical diagnosis to recognize characteristic smells from diseases and bacteria cells. They have shown the ability to detect and distinguish a variety of bacteria and fungi from hu- man body, and identify particular biomarker by charac- terization of VOCs above microorganisms. Swabs, spu- tum, serum, feces, breath or urine sampled from the hu- man body can be measured as biomedical samples for diagnosis after a short incubation time or directly in some cases. Table 2 provides a summary of biomarkers and samples that can be detected by electronic noses. A com- prehensive analysis of past and recent research findings and developments of electronic nose technologies in medical diagnosis will be presented below and classified by diseases.
3.1. Cancer Detection
It is known that dogs have the capability to detect cancer by sniffing the patient’s breath which is termed as canine cancer detection. They can identify specific alkanes and aromatic compounds at low concentrations in breath cre- ated by a tumor that circulates from the patient’s blood to the lungs. Similarly, electronic noses can detect disease marker substances from the human body, thus having the potential of early stage detection for different types of
Table 2. Application of electronic nose on samples and biomarkers for human disease.
Disease/Disorder/Infection Aroma sample source Associated volatile biomarkers Ref.
Urinary tract infections Urine
Staphylococcus aureus, Escherichia coli, Proteus mirabilis,
Isovaleric acid, alkanes
[61-66]
Sputum Mycobacterium tuberculosis,
Mycobacterium avium, Pseudomonas aeruginosa;
[67]
Breath Oxetane,3-(1-methylethyl)-Dodecane, 4-methyl-Cyclohexane; [68] Tuberculosis
Lung tissue PD-1, TIM-3, KLRG-1 [69]
Ear, nose, throat infections
Swabs
Staphylococcus aureus, Pseudomonas aeruginosa, Streptococcus pneumonia, Streptococcus pyogenes, Haemophilusinfluenzae
[70-72]
Human breath Pentane, ethane, 8-isoprostane,
nitric oxide, cysteinylleukotrienes, prostaglandin E2 [73-82]
Asthma Sputum eosinophil cationic protein [83]
Breast cancer Human breath C4 - C20 alkanes,
monomethylated alkanes [84]
COPD Human breath NO, H2O2, aldehydes, 8-isoprostane, nitrotyrosine,
Leukotriene B4, cytokines [85-90]
Sweaty feet syndrome Urine, sweat, human breath Butyric acid, hexanoic acid; trans-3-methyl-2 hexenoic acid [91]
Copyright © 2013 SciRes. OJAB

S. M. CHEN ET AL. 45
cancers. Recent results showed utility of an electronic nose to smell chemicals related to lung, breast, brain, prostatic, melanoma and pancreatic cancers. However, few biomarkers are available for cancer detection at the present time due to the difficulty in determining which specific VOCs correlate with a cancer type among a vast myriad of possible compounds detected.The detection of lung cancer accounts for most cancer diagnosisby elec- tronic noses since important biomarkers for this disease have been discovered in numerous investigations of VOCs identified from exhaled breath of lung cancer pa- tients. Machado et al. used an electronic nose to identify and discriminate between 14 bronchogenic carcinoma patients and 45 healthy controls. The electronic nose is based on array of 32 polymer composite sensors with the output processed using Savitzky-Golay filtering and baseline correction and then analyzed using PCA. The result demonstrated effective discrimination between samples from patients with lung cancer and those from healthy controls. In validation study, the electronic nose had 71.4% sensitivity and 91.9% specificity for detecting lung cancer, positive and negative predictive values were 66.6% and 93.4%, respectively [92]. Although studies have supported the correlation between the composition of breath and lung cancer, many other diseases can alter the breath composition and interfere with detection, so it is necessary not only to detect generic alterations, but also those specifically consequent to cancer. Based on this fact, Pennazza et al. conducted an experiment to dis- criminate between lung cancer, diverse lung diseases, reference controls, and most importantly to study the effect of compounds in breath whose concentrations are significantly different with respect to normal populations. The effect of alleged lung cancer typical VOCs (aniline, o-toluidine, and cyclopentane) is investigated by adding VOCs to breaths collected from control individuals to create artificial lung cancer breaths. The analysis of arti- ficial breaths is compared with those of breaths exhaled by patients and healthy controls. Results have shown that the data points of the artificially altered breath samples tend to drift toward the lung cancer group, proving the significance of the role played by these volatile com- pounds in contribution to lung cancer [93]. Researchers are dedicated to applying electronic noses to other types of cancer. Brain cancer was investigated by Kateb et al. using a Jet Propulsion Laboratory’s electronic nose (JPL E-Nose) to discriminate the odor signatures between cultured glioblastoma and melanoma tumor cells, and between chicken heart and chicken liver tissues. The JPL E-Nose consisted of 16 sensors with uniquely coated polymer-carbon composite films and sensed the air in the head space above the cells based on a change in conduc- tivity. The results showed that the JPL E-Nose was able to distinguish between two types of tumor cells and be-
tween two types of organ tissue, which could be used as part of multi-modality intraoperative approach for detec- tion and treatment of brain cancers [94]. Horvath was able to discriminate between different VOCs emitted by human grade 3 seropapillary ovarian carcinoma and healthy human Fallopian tube specimens by using an electronic nose. This method has correctly classified 84.4% of cancer tissues (sensitivity: 84.4%) and 86.8% of the control samples (specificity: 86.8%) [95].
3.2. Respiratory Diseases
The extensive research for non-invasive respiratory dis- ease markers has led to the development of an electronic nose which can distinguish diseases that affect the airway or pulmonary parenchyma [4]. Electronic noses can be applied to identify respiratory bacterial pathogens either in vitro or in vivo or as a potential tool for the identifica- tion of patients with COPD, asthma, and Tuberculosis. The analysis of exhaled breath has been proposed as the main option for detection and identification of respiratory diseases, although other approaches exist, e.g. the analy- sis of blood samples and bacterial culture samples. The breath prints produced by an electronic nose are associ- ated with airway inflammation activity, and provide a molecular basis for disease detection and a personalized pharmacological treatment. Bruins used a commercially available e-nose (diagnose, C-it BV) to detect tuberculo- sis in exhaled air produced by healthy controls and TB patients. The diagnose device incorporated 12 metal- oxide sensors, as4 different sensor types (AS-MLC; AS-MLN; AS-MLK; AS-MLV, Applies Sensors Gmbh) in triplicate. Two studies were conducted to estimate the diagnostic accuracy of the Diagnose analysis, I.e., a Proof of Principle Study (30 participants) and a Valida- tion Study (194 participants). The results showed that the electronic nose can differentiate between TB patients and healthy controls with a sensitivity of 76.5% and speci- ficity of 87.2% when identifying TB patients within the entire test population. The research has demonstrated a possibility of an electronic nose as a portable and fast- time-to-result device to screen search for TB cases in rural areas, without the need for highly-skilled operators or a hospital center infrastructure [96]. Similarly, Drago- nieri employed the Cyranose 320 electronic nose to dis- criminate between patients with non-small cell lung can- cer, patients with COPD, and healthy controls. Results have shown that smell prints from non-small cell lung cancer patients clustered distinctly from those of COPD subjects and healthy controls [97]. From further study, it is known that patients with COPD produce certain VOCs distinct from those produced by patients with lung can- cer.
Copyright © 2013 SciRes. OJAB

S. M. CHEN ET AL. 46
3.3. Urinary Tract Infections
Urinary Tract Infection (UTI) is one of the most preva- lent infectious diseases with 3 million UTI cases each year in the USA alone [98]. The urinary system includes the kidneys, ureters, bladder and urethra. Most UTI af- fects the lower urinary tract known as a simple cysititis (a bladder infection), which is not serious unless it spreads to the upper tract and develops into pyelonephri-tis; thus, early diagnosis for UTI is important and the application of an electronic nose opens the gate for on-line and simple UTI diagnosis. Approximately 80% of uncomplicated UTIs are caused by Escherichia coli, 20% by enteric pathogens such as Enterococci, Klebsiel- lae, Proteus spp., coagulase (–) Staphylococci and fungal opportunistic pathogens such as Candida albicans [99, 100]. Electronic noses can diagnose UTIs by examining the volatile compounds produced by bacterial contami- nants in urine samples. Based on this fact, Pavlou et al. employed an electronic nose consisting of 14 conducting polymer sensors to distinguish between normal urine, Escherichia coli infected, Proteus spp. and Staphylococ- cus spp. They also investigated the feasibility of using the electronic nose to identify unknown UTI cases. The study has shown the potential for early detection of mi- crobial contaminants related to UTI using an electronic nose, which might be applied in rapid systems for use in clinical practice [61].
4. Concluding Remarks and Future Challenges
This review gives a glimpse of what has been achieved to date and what might be possible in the future through the use of electronic noses in clinical diagnosis. Versatile sensing techniques of electronic noses continue to open up new possibilities for assays in parallel, real-time, ac- curate and fast detection in clinical practice, allowing earlier detections of diseases and evaluations of patient conditions before symptoms appear. However, as several studies have shown, sensor-based electronic noses gene- rally suffer from significant weaknesses that limit their widespread application in clinical diagnosis, such as sen- sitivity to temperature, humidity, interference with other gases and the release of poisonous products. Adopting appropriate sample pretreatment and pre-concentration techniques can increase the sensitivity of diagnosis; fur- thermore, the use of filters and separation units can in- crease the selectivity and reduce interfering substances [1]. However, this leads to an increase in the complexity of the electronic nose system, which is undesirable for widespread clinical practice. The research and develop- ment of electronic noses will still focus on epidemic dis- eases such as various cancers, tuberculosis (TB), auto- immune deficiency syndrome (AIDS), and other major
diseases responsible for current world pandemics [101]. Breath analysis is an attractive procedure for electronic noses to predict disease because it is non-invasive and sampling methods are simple. However, one of the major proficiencies of diagnostic breath analysis is the diffi- culty in discovering the relationship between identified marker compounds with a pathology, since in most cases specific metabolic pathways are unknown [102]. Once these difficulties are resolved, the application of elec- tronic noses could make up a vital part in monitoring disease epidemiology.
REFERENCES [1] F. Rock, N. Barsan and U. Weimar, “Electronic Nose:
Current Status and Future Trends,” Chemical Reviews, Vol. 108, No. 2, 2008, pp. 705-725. doi:10.1021/cr068121q
[2] A. P. F. Turner and N. Magan, “Electronic Noses and Disease Diagnostics,” Nature Reviews, Vol. 2, No. 2, 2004, pp. 161-166. doi:10.1038/nrmicro823
[3] J. W. Gardner and P. N. Bartlett, “A Brief History of Electronic Noses,” Sensors and Actuators B, Vol. 18-19, No. 1-3, 1994, pp. 211-220.
[4] J. L. Valera, B. Togores and B. G. Cosio, “Use of the Electronic Nose for Diagnosing Respiratory Diseases,” Archivos de Bronconeumología, Vol. 48, No. 6, 2012, pp. 187-188. doi:10.1016/j.arbr.2012.03.002
[5] M. Peris and L. Escuder-Gilabert, “A 21st Century Tech- nique for Food Control: Electronic Noses,” Analytica Chimica Acta, Vol. 638, No. 1, 2009, pp. 1-15. doi:10.1016/j.aca.2009.02.009
[6] M. Bernabei, G. Pennazza, M. Santonico, C. Corsi, C. Roscioni, R. Paolesse, C. D. Natale and A. D’Amico, “A Preliminary Study on the Possibility to Diagnose Urinary Tract Cancers by an Electronic Nose,” Sensors & Actua- tors: B. Chemical, Vol. 131, No. 1, 2008, pp. 1-4. doi:10.1016/j.snb.2007.12.030
[7] S. Kanoh, H. Kobayashi, and K. Motoyoshi, “Exhaled Ethane: An in Vivo Biomarker of Lipid Peroxidation in Interstitial Lung Diseases,” Chest, Vol. 128, No. 4, 2005, pp. 2387-2392. doi:10.1378/chest.128.4.2387
[8] E. Dixon, C. Clubb, S. Pittman, L. Ammann, Z. Rasheed, N. Kazmi, A. Keshavarzian, P. Gillevet, H. Rangwala and R. D. Couch, “Solid-Phase Microextraction and the Hu-man Fecal VOC Metabolome,” PLoS ONE, Vol. 6, No. 4, 2011, pp. 371-380. doi:10.1371/journal.pone.0018471
[9] A. Nordberg, M. Hansson, I. Sundh, E. Nordkvist, H. Carisson and B. Mathisen, “Monitoring of a Biogas Proc- ess Using Electronic Gas Sensors and Near-Infrared Spec- troscopy (NIR),” Water Science and Technology, Vol. 41, No. 3, 2000, pp. 1-8.
[10] J. Hartmann, J. Auge and P. Hauptmann, “Using the Quartz-Crystal-Microbalance Principle for Gas Detection with Reversible and Irreversible Sensors,” Sensors and Actuators B, Vol. 19, No. 1-3, 1994, pp. 429-433. doi:10.1016/0925-4005(93)01025-Y
Copyright © 2013 SciRes. OJAB

S. M. CHEN ET AL. 47
[11] J. Ricco, R. M. Crooks and G. C. Osbourn, “Surface Acoustic Wave Chemical Sensor Arrays: New Chemi- cally Sensitive Interfaces Combined with Novel Cluster Analysis to Detect Volatile Organic Compounds and Mixtures,” Accounts of Chemical Research, Vol. 31, No. 5, 1998, pp. 289-296. doi:10.1021/ar9600749
[12] B. C. Sisk and N. S. Lewis, “Estimation of Chemical and Physical Characteristics of Analyte Vapors Through Analysis of the Response Data of Arrays of Polymer- Carbon Black Composite Vapor Detectors,” Sensors and Actuators B, Vol. 96, No. 1, 2003, pp. 268-282. doi:10.1016/S0925-4005(03)00543-4
[13] K. J. Albert, D. R. Walt, D. S. Gill and T. C. Pearce, “Op-tical Multibead Arrays for Simple and Complex Odor Discrimination,” Analytical Chemistry, Vol. 73, No. 11, 2001, pp. 2501-2508. doi:10.1021/ac001137a
[14] A. Kolmakov and M. Moskovits, “Chemical Sensing and Catalysis by Onedimensional Metal-Oxide Nanostruc- tures,” Annual Review of Materials Research, Vol. 34, 2004, pp. 151-180. doi:10.1146/annurev.matsci.34.040203.112141
[15] J. W. Gardner and P. N. Bartlett, “Electronic Noses: Prin- ciples and Applications,” Oxford University Press, Ox- ford, 1999.
[16] T. Maekawa, K. Suzuki, T. Takada, T. Kobayashi and M. Egashira, “Odor Identification Using a SnO2-Based Sen- sor Array,” Sensors and Actuators B, Vol. 80, No. 1, 2001, pp. 51- 58.
[17] J. Getino, L. Ares, J. I. Robla, M. C. Horrillo, I. Sayago, M. J. Fernandez, J. Rodrigo and J. Gutierrez, “Environ- mental Applications of Gas Sensor Arrays: Combustion Atmospheres and Contaminated Soils,” Sensors and Ac- tuators B, Vol. 59, No. 2, 1999, pp. 249-254. doi:10.1016/S0925-4005(99)00229-4
[18] S. Zampolli, I. Elmi, F. Ahmed, M. Passini, G. C. Cardi- nali, S. Nicoletti and L. Dori, “An Electronic Nose Based on Solid State Sensor Arrays for Low-Cost Indoor Air Quality Monitoring Applications,” Sensors and Actuators B, Vol. 101, No. 1-2, 2004, pp. 39-46.
[19] S. Ehrmann, J. Jungst, J. Goschnick and D. Everhard, “Application of a Gas Sensor Microarray to Human Breath Analysis,” Sensors and Actuators B, Vol. 65, No. 1, 2000, pp. 247-249.
[20] P. Moseley, “Materials Selection for Semiconductor Gas Sensors,” Sensors and Actuators B: Chemical, Vol. 6, No. 1-3, 1992, pp. 149-156. doi:10.1016/0925-4005(92)80047-2
[21] N. White and J. D. Turner, “Thick-Film Sensors: Past, Present and Future, Measurement,” Science and Tech- nology, Vol. 8, No. 1, 1997, pp. 1-20.
[22] D. Kohl, “Function and Applications of Gas Sensors,” Journal of Physics D: Applied Physics, Vol. 34, No. 19, 2001, pp. R125-R149. doi:10.1088/0022-3727/34/19/201
[23] S. Aathithan, J. C. Plant, A. N. Chaudry and G. L. French, “Diagnosis of Bacteriuria by Detection of Volatile Or- ganic Compounds in Urine Using an Automated Head- space Analyzer with Multiple Conducting Polymer Sen- sors,” Journal of Clinical Microbiology, Vol. 39, No. 7,
2001, pp. 2590-2593. doi:10.1128/JCM.39.7.2590-2593.2001
[24] I. Eisele, T. Doll and M. Burgmair, “Low Power Gas Detection with Fet Sensors,” Sensors and Actuators B: Chemical, Vol. 78, No. 1-3, 2001, pp. 19-25. doi:10.1016/S0925-4005(01)00786-9
[25] R. Fend, A. H. J. Kolk, C. Bessant, P. Buijtels, P. R. Klatser, A. C. Woodman, “Prospects for Clinical Appli- cation of Electronic-Nose Technology to Early Detection of Mycobacterium tuberculosis in culture and sputum,” Journal of Clinical Microbiology, Vol. 44, No. 6, 2006, pp. 2039-2045. doi:10.1128/JCM.01591-05
[26] H. Bai and G. Shi, “Gas Sensors Based on Conducting Polymers,” Sensors, Vol. 7, No. 3, 2007, pp. 267-307. doi:10.3390/s7030267
[27] D. James, S. M. Scott, Z. Ali and W. T. O’Hare, “Che- mical Sensors for Electronic Nose Systems,” Micro-chimica Acta, Vol. 149, No. 1-2, 2005, pp. 1-17. doi:10.1007/s00604-004-0291-6
[28] E. H. Oh, H. S. Song and T. H. Park, “Recent Advances in Electronic and Bioelectronic Noses and Their Bio- medical Applications,” Enzyme and Microbial Technol- ogy, Vol. 48, No. 6, 2011, pp.427-437. doi:10.1016/j.enzmictec.2011.04.003
[29] S. Kladsomboon, M. Lutz, T. Pongfa and T. Kerdcharoen, “An Optical Artificial Nose System for Odor Classifica- tions Based on LED Arrays,” Proceedings of the 8th In- ternational Conference on Electrical Engineering/Elec- tronics, Bangkok, 17-19 May 2011, pp. 145-148.
[30] A. Eambaipreuk, “Breath Monitoring Based on the Opti-cal Electronic Nose System,” Proceedings of Biomedical Engineering International Conference (BMEICON), Bang- kok, 29-31 January 2012, pp. 63-66.
[31] T. C. Pearce, S. S. Schiffman, H. T. Nagle and J. W. Gardner, “Handbook of Machine Olfaction: Electronic Nose Technology,” ChemPhysChem, Vol. 4, No. 11, 2003, pp. 1265-1266. doi:10.1002/cphc.200390115
[32] Y. Mendelson, “The Biomedical Engineering Handbook,” CRC Press, LLC, Florida, 2000.
[33] C. Wang and P. Sahay, “Breath Analysis Using Laser Spectroscopic Techniques: Breath Biomarkers, Spectral Fingerprints, and Detection Limits,” Sensors, Vol. 9, No. 10, 2009, pp. 8230-8262. doi:10.3390/s91008230
[34] K. Mitsubayashi, T. Minamide, K. Otsuka, H. Kudo and H. Saito, “Optical Bio-Sniffer for Methyl Mercaptan in Halitosis,” Analytica Chimica Acta, Vol. 573, 2006, pp. 75-80. doi:10.1016/j.aca.2006.01.062
[35] S. Choi, Y. Yang, J. Chae, “Surface Plasmon Resonance Protein Sensor Using Vroman Effect,” Biosensors and Bioelectronics, Vol. 24, No. 4, 2008, pp. 893-899. doi:10.1016/j.bios.2008.07.036
[36] P. Wang, X. Chen, F. Xu, D. Lu, W. Cai , K. Ying, Y. Wang and Y. Hu, “Development of Electronic Nose for Diagnosis of Lung Cancer at Early Stage,” Proceedings of the 5th International Conference on Information Tech- nology and Application in Biomedicine, Shenzhen, 30-31 May 2008, pp. 589-591.
[37] W. Feng, R. Hettiarachchi1, S. Sato, K. Kakushima, M.
Copyright © 2013 SciRes. OJAB

S. M. CHEN ET AL. 48
Niwa, H. Iwai, K. Yamada and K. Ohmoril, “Advan- tages of Silicon Nanowire Metal-Oxide-Semiconductor Field-Effect Transistors over Planar Ones in Noise Prop- erties,” Japanese Journal of Applied Physics, Vol. 51, No. 4, 2012, Article ID: 04DC06.
[38] A. Oprea, N. Bârsan and U. Weimar, “Characterization of Granular Metal Oxide Semiconductor Gas Sensitive Lay- ers by Using Hall Effect Based Approaches,” Journal of Physics D: Applied Physics, Vol. 40, No. 23, 2007, pp. 7217-7237. doi:10.1088/0022-3727/40/23/S05
[39] J. Lee, W. D. Kim and H. Lim, “Facile Fabrication of Conducting Polymer Nanowire Based Field Effect Tran- sistor with Controlled Shape and Position,” Microelec- tronic Engineering, Vol. 98, 2012, pp. 382-385. doi:10.1016/j.mee.2012.07.012
[40] M. E. Vaschetto, A. P. Monkman and M. Springborg, “First-Principles Studies of Some Conducting Polymers: PPP, PPy, PPV, PPyV, and PANI,” Journal of Molecu- lar Structure (Theochem), Vol. 468, No. 3, 1999, pp. 181- 191. doi:10.1016/S0166-1280(98)00565-X
[41] C. Luo and A. Chakraborty, “Effects of Dimensions on the Sensitivity of a Conducting Polymer Microwiresen- sor,” Microelectronics Journal, Vol. 40, No. 6, 2009, pp. 912–920. doi:10.1016/j.mejo.2008.11.064
[42] M. L. Gabriele, G. Wollstein, H. Ishikawa, J. Xu, J. Kim, L. Kagemann, L. S. Folio and J. S. Schuman, “Three di- mensional Optical Coherence Tomography Imaging: Ad- vantages and Advances,” Progress in Retinal and Eye Research, Vol. 29, No. 6, 2010, pp. 556-579. doi:10.1016/j.preteyeres.2010.05.005
[43] M. Blumentritt, K. Melhorn, J. Flachsbarth, M. Kroener, W. Kowalsky and H. H. Johannes, “A Novel Fabrication Method of Fiber-Optical Planar Transmission Sensors for Monitoring pH in Concrete Structures,” Sensors and Ac- tuators B, Vol. 131, No. 2, 2008, pp. 504-508. doi:10.1016/j.snb.2007.12.034
[44] A. L. Smith and H. M. Shirazi, “Principles of Quartz Crystal Microbalance/Heat Conduction Calorimetry: Measurement of the Sorption Enthalpy of Hydrogen in Palladium,” Thermochimica Acta, Vol. 432, No. 2, 2005, pp. 202-211. doi:10.1016/j.tca.2005.03.017
[45] B. Pejcic, E. Crookea, C. M. Doherty, A. J. Hill, M. Myers, X. Qia and A. Rossa, “The Impact of Water and Hydrocarbon Concentration on the Sensitivity of a Poly- mer-Based Quartz Crystal Microbalance Sensor for Or- ganic Compounds,” Analytica Chimica Acta, Vol. 703, No. 1, 2011, pp. 70-79.
[46] B. Pejcic, C. Barton, E. Crooke, P. Eadington, E. Jee and A. Ross, “Hydrocarbon Sensing. Part 1: Some Important Aspects about Sensitivity of a Polymer-Coated Quartz Crystal Microbalance in the Aqueous Phase,” Sensors and Actuators B, Vol. 135, No. 2, 2009, pp. 436-443. doi:10.1016/j.snb.2008.09.044
[47] G. Xiea, P. Suna, X. Yana, X. Dua and Y. Jianga, “Fab- rication of Methane Gas Sensor by Layer-by-Layer Self- Assembly of Polyaniline/PdO Ultra Thin Films on Quartz Crystal Microbalance,” Sensors and Actuators B: Chemi- cal ,Vol. 145, No. 1, 2010, pp. 373-377. doi:10.1016/j.snb.2009.12.035
[48] F. D. Lai and H. M. Huang, “Fabrication of High Fre- quency and Low-Cost Surface-Acoustic Wave Filters Us- ing Near Field Phase Shift Photolithography,” Microelec- tronic Engineering, Vol. 83, No. 4, 2006, pp. 1407-1409. doi:10.1016/j.mee.2006.01.106
[49] S. Krishnamoorthy and A. A. Iliadis, “Properties of High Sensitivity ZnO Surface Acoustic Wave Sensors on SiO2/ (100) Si Substrates,” Solid-State Electronics, Vol. 52, No. 11, 2008, pp. 1710-1716. doi:10.1016/j.sse.2008.06.039
[50] L. Fan, H. Ge, S. Y. Zhang, H. Zhang and J. Zhu, “Opti- mization of Sensitivity Induced by Surface Conductivity and Sorbed Mass in Surface Acoustic Wave Gas Sen- sors,” Sensors and Actuators B: Chemical, Vol. 171-172, 2012, pp. 1272-1276. doi:10.1016/j.snb.2012.05.046
[51] M. H. Ervina, B. S. Millera, B. Hanrahana, B. Mailly and T. Palacios, “A Comparison of Single-Wall Carbon Nanotube Electrochemical Capacitor Electrode Fabrica- tion Methods,” Electrochimica Acta, Vol. 65, 2012, pp. 37-43. doi:10.1016/j.electacta.2012.01.060
[52] H. Kang, S. Lim, N. Park, K.-Y. Chun and S. Baik, “Im- proving the Sensitivity of Carbon Nanotube Sensors by Benzene Functionalization,” Sensors and Actuators B: Chemical, Vol. 147, No. 1, 2010, pp. 316-321. doi:10.1016/j.snb.2010.03.028
[53] J. Zheng, Q. Q. Zhang, X. C. He, M. J. Gao, X. F. Ma and G. Li, “Nanocomposites of Carbon Nanotube (CNTs)/ CuO with High Sensitivity to Organic Volatiles at Room Temperature,” Procedia Engineering, Vol. 36, 2012, pp. 235-245. doi:10.1016/j.proeng.2012.03.036
[54] V. Casey, J. Cleary, G. D. Arcy and J. B. McMonagle, “Calorimetric Combustible Gas Sensor Based on a Pla- nar Thermopile Array: Fabrication, Characterisation, and Gas Response,” Sensors and Actuators B: Chemical, Vol. 96, No. 1, 2003, pp. 114-123. doi:10.1016/S0925-4005(03)00510-0
[55] P. Kirchner, J. Oberländer, P. Friedrich, J. Berger, G. Rysstad, M. Keusgen and M. J. Schöning, “Realisation of A Calorimetric Gas Sensor on Polyimide Foil for Appli- cations in Aseptic Food Industry,” Sensors and Actuators B: Chemical, Vol. 170, 2012, pp.60-66. doi:10.1016/j.snb.2011.01.032
[56] E. L. Hines, P. Boilot, J. L. W. Gardner and M. A. Gongora, “Pattern Analysis for Electronic Noses,” In: T. Pearce, et al., Eds., Handbook of Machine Olfaction: Ele- ctronic Nose Technology, Wiley-VCH, Weinheim, 2003, pp. 130-160.
[57] R. O. Gutierrez, “Pattern Analysis for Machine Olfaction: A Review,” IEEE Sensors Journal, Vol. 2, No. 3, 2006, pp. 189-202.
[58] D. L. G. González, R. Aparicio and G. Y. Aceites, “Sen- sors: From Biosensors to the Electronic Nose,” Grasas y Aceites, Vol. 53, No. 1, 2002, pp. 96-114.
[59] S. Choi, S. Huang, J. Li and J. Chae, “Monitoring Protein Distributions Based on Patterns Generated by Protein Adsorption Behavior in a Microfluidic Channel,” Lab Chip, Vol. 11, 2011, pp. 3681-3688. doi:10.1039/c1lc20680j
[60] K. Aamir and F. Hasan, “Principal Component Analysis-
Copyright © 2013 SciRes. OJAB

S. M. CHEN ET AL. 49
Linear Discriminant Analysis Feature Extractor for Pat- tern Recognition,” IJCSI International Journal of Com- puter Science Issues, Vol. 8, No. 6, 2011, p. 267.
[61] A. K. Pavlou, N. Magan, C. McNulty, J. M. Jones, D. Sharp, J. Brown and A. P. F. Turner, “Use of an Elec- tronic Nose System for Diagnoses of Urinary Tract Infec- tions,” Biosensors and Bioelectronics, Vol. 17, No. 10, 2002, pp. 893-899. doi:10.1016/S0956-5663(02)00078-7
[62] S. Aathithan, J. C. Plant, A. N. Chaudry and G. L. French, “Diagnosis of Bacteriuria by Detection of Volatile Or- ganic Compounds in Urine Using an Automated Head- space Analyzer with Multiple Conducting Polymer Sen- sors,” Journal of Clinical Microbiology, Vol. 39, No. 7, 2001, pp. 2590-2593. doi:10.1128/JCM.39.7.2590-2593.2001
[63] N. Guernion, N. M. Ratcliffe, P. T. Spencer-Phillips and R. A. Howe, “Identifying Bacteria in Human Urine: Cur- rent Practice and the Potential for Rapid, Near-Patient Diagnosis by Sensing Volatile Organic Compounds,” Clinical Chemistry and Laboratory Medicine, Vol. 39, No. 10, 2001, pp. 893-906. doi:10.1515/CCLM.2001.146
[64] V. Kodogiannis and E. Wadge, “The Use of Gas-Sensor Arrays to Diagnose Urinary Tract Infections,” Interna- tional Journal of Neural Systems, Vol. 15, No. 5, 2005, pp. 363-376. doi:10.1142/S0129065705000347
[65] J. W. Yates, M. J. Chappell, J. W. Gardner, C. S. Dow, C. Dowson, A. Hamood, F. Bolt and L. Beeby, “Data Re- duction in Headspace Analysis of Blood and Urine Sam- ples for Robust Bacterial Identification,” Computer Me- thods and Programs in Biomedicine, Vol. 79, No. 3, 2005, pp. 259-271.doi:10.1016/j.cmpb.2005.04.003
[66] P. Ying, G. A. Sonn, M. L. Y. Sin, K. E. Mach, M. Shih, V. Gau, P. K. Wong and J. C. Liao, “Electrochemical Immunosensor Detection of Urinary Lactoferrin in Clini- cal Samples for Urinary Tract Infection Diagnosis,” Bio- sensors and Bioelectronics, Vol. 26, No. 2, 2010, pp. 649-654. doi:10.1016/j.bios.2010.07.002
[67] A. K. Pavlou, N. Magan, J. M. Jones, J. Brown, P. Klatser and A. P. Turner, “Detection of Mycobacterium Tuber- culosis (TB) in Vitro and in Situ Using an Electronic Nose in Combination with a Neural Network System,” Biosensors and Bioelectronics, Vol. 20, No. 3, 2004, pp. 538-544. doi:10.1016/j.bios.2004.03.002
[68] M. Phillips, V. Basa-Dalay, G. Bothamley, R. N. Cataneo, P. K. Lam, M. P. R. Natividad, P. Schmitt and J. Wai, “Breath Biomarkers of Active Pulmonary Tuberculosis,” Tuberculosis, Vol. 90, No. 2, 2010, pp. 145-151. doi:10.1016/j.tube.2010.01.003
[69] T. M. Henao, S. M. Irwin, S. Shang, D. Ordway and I. M. Orme, “T Lymphocyte Surface Expression of Exhaustion Markers as Biomarkers of the Efficacy of Chemotherapy for Tuberculosis,” Tuberculosis, Vol. 91, No. 4, 2011, pp. 308-313. doi:10.1016/j.tube.2011.04.001
[70] S. Y. Lai, O. F. Deffenderfer, W. Hanson, M. P. Phillips and E. R. Thaler, “Identification of Upper Respiratory Bacterial Pathogens with the Electronic Nose,” Laryngo- scope, Vol. 112, No. 6, 2002, pp. 975-979. doi:10.1097/00005537-200206000-00007
[71] M. E. Shykhon, D. W. Morgan, R. Dutta, E. L. Hines and
J. W. Gardner, “Clinical Evaluation of the Electronic Nose in the Diagnosis of Ear, Nose and Throat Infection: A Preliminary Study,” The Journal of Laryngology & Otology, Vol. 118, No. 9, 2004, pp. 706-709. doi:10.1258/0022215042244660
[72] R. Dutta, D. Morgan, N. Baker, J. W. Gardner and E. L. Hines, “Identification of Staphylococcus Aureus Infec- tions in Hospital Environment: Electronic Nose Based Approach,” Sensors and Actuators B: Chemical, Vol. 109, No. 2, 2005, pp. 355-362. doi:10.1016/j.snb.2005.01.013
[73] C. O. Olopade, M. Zakkar, W. I. Swedler and I. Rubin- stein, “Exhaled Pentane Levels in Acute Asthma,” Chest Journal, Vol. 111, No. 4, 1997, pp. 862-865. doi:10.1378/chest.111.4.862
[74] P. Montuschi, M. Corradi, G. Ciabattoni, J. Nightingale, S. A. Kharitonov and P. J. Barnes, “Increased 8-Isopros- tane, a Marker of Oxidative Stress, in Exhaled Conden- sate of Asthma Patients,” American Journal of Respira- tory and Critical Care Medicine, Vol. 160, No. 1, 1999, pp. 216-220. doi:10.1164/ajrccm.160.1.9809140
[75] P. Paredi, S. A. Kharitonov and P. J. Barnes, “Elevation of Exhaled Ethane Concentration in Asthma,” American Journal of Respiratory and Critical Care Medicine, Vol. 162, No. 4, 2000, pp. 1450-1454. doi:10.1164/ajrccm.162.4.2003064
[76] A. D. Smith, J. O. Cowan, S. Filsell, C. McLachlan, G. Monti-Sheehan, P. Jackson and D. R. Taylor, “Diagnos- ing Asthma: Comparisons between Exhaled Nitric Oxide Measurements and Conventional Tests,” American Jour- nal of Respiratory and Critical Care Medicine, Vol. 169, No. 4, 2004, pp. 473-478. doi:10.1164/rccm.200310-1376OC
[77] S. Dragonieri, R. Schot, B. J. Mertens, S. C. Le, S. A. Gauw, A. Spanevello, O. Resta, N. Willard, T. Vink, K. Rabe, E. Bel and P. Sterk, “An Electronic Nose in the Discrimination of Patients with Asthma and Controls,” The Journal of Allergy and Clinical Immunology, Vol. 120, No. 4, 2007, pp. 856-862. doi:10.1016/j.jaci.2007.05.043
[78] K. Kostikas, G. Papatheodorou, K. Psathakis, P. Panagou and S. Loukides, “Prostaglandin E2 in the Expired Breath Condensate of Patients with Asthma,” European Respira- tory Journal, Vol. 22, No. 5, 2003, pp. 743-747. doi:10.1183/09031936.03.00000603
[79] K. Kostikas, M. Gaga, G. Papatheodorou, T. Karamanis, D. Orphanidou and S. Loukides, “Leukotriene B4 in Ex- haled Breath Condensate and Sputum Supernatant in Pa- tients with COPD and Asthma,” Chest Journal, Vol. 127, No. 5, 2005, pp. 1553-1559. doi:10.1378/chest.127.5.1553
[80] G. E. Carpagnano, M. P. F. Barbaro, O. Resta, E. Gramiccioni, N. V. Valerio, P. Bracciale and G. Valerio, “Exhaled Markers in the Monitoring of Airways Inflam- mation and Its Response to Steroid’s Treatment in Mild Persistent Asthma,” European Journal of Pharmacology, Vol. 519, No. 1-2, 2005, pp. 175-181. doi:10.1016/j.ejphar.2005.06.034
[81] A. M. Fortuna, T. Feixas, M. González and P. Casan, “Diagnostic Utility of Inflammatory Biomarkers in Asth-
Copyright © 2013 SciRes. OJAB

S. M. CHEN ET AL.
Copyright © 2013 SciRes. OJAB
50
ma: Exhaled Nitric Oxide and Induced Sputum Eosino- phil Count,” Respiratory Medicine, Vol. 101, No. 11, 2007, pp. 2416-2421. doi:10.1016/j.rmed.2007.05.019
[82] J. S. Debley, E. S. Cochrane, G. J. Redding and E. R. Carter, “Lung Function and Biomarkers of Airway In- flammation during and after Hospitalization for Acute Exacerbations of Childhood Asthma Associated with Vi- ral Respiratory Symptoms,” Annals of Allergy, Asthma & Immunology, Vol. 109, No. 2, 2012, pp. 114-120. doi:10.1016/j.anai.2012.06.004
[83] N. Snell and P. Newbold, “The Clinical Utility of Bio- markers in Asthma and COPD,” Current Opinion in Pharmacology, Vol. 8, No. 3, 2008, pp. 222-235. doi:10.1016/j.coph.2008.04.001
[84] M. Phillips, R. N. Cataneo, B. A. Ditkoff, P. Fisher, J. Greenberg, R. Gunawardena, C. S. Kwon, F. Rahbari- Oskoui and C. Wong, “Volatiles Markers of Breast Can- cer in the Breath,” The Breast Journal, Vol. 9, No. 3, 2003, pp. 184-191. doi:10.1046/j.1524-4741.2003.09309.x
[85] M. Corradi, A. Pesci, R. Casana, R. Alinovi, M. Goldoni, M. V. Vittoria and A. Cuomo, “Nitrate in Exhaled Breath Condensate of Patients with Different Airway Diseases,” Nitric Oxide-Biology and Chemistry, Vol. 8, No. 1, 2003, pp. 26-30.
[86] B. Balint, S. A. Kharitonov, T. Hanazawa, L. E. Donnelly, P. L. Shah, M. E. Hodson and P. J. Barnes, “Increased Nitrotyrosine in Exhaled Breath Condensate in Cystic Fi- brosis,” European Respiratory Journal, Vol. 17, No. 6, 2001, pp. 1201-1207.doi:10.1183/09031936.01.00072501
[87] M. Corradi, M. Majori, G. C. Cacciani, G. F. Consigli, E. de’Munari and A. Pesci, “Increased Exhaled Nitric Oxide in Patients with Stable Chronic Obstructive Pulmonary Disease,” Thorax, Vol. 54, No. 7, 1999, pp. 572-575. doi:10.1136/thx.54.7.572
[88] W. J. van Beurden, G. A. Harff, P. N. R. Dekhuijzen, M. J. van den Bosch, J. P. Creemers and F. W. Smeenk, “An Efficient and Reproducible Method for Measuring Hy- drogen Peroxide in Exhaled Breath Condensate,” Respi- ratory Medicine, Vol. 96, No. 3, 2002, pp. 197-203. doi:10.1053/rmed.2001.1240
[89] Z. L. Borrill, R. C. Starkey and S. D. Singh, “Variability of Exhaled Breath Condensate Leukotriene B4 and 8-Isoprostane in COPD Patients,” International Journal of Chronic Obstructive Pulmonary Disease, Vol. 2, No. 1, 2007, pp. 71-76.
[90] W. J. van Beurden, P. N. Dekhuijzen, G. A. Harff and F. W. Smeenk, “Variability of Exhaled Hydrogen Peroxide in Stable COPD Patients and Matched Healthy Con- trols,” Respiration, Vol. 69, No, 3, 2002, pp. 211-216. doi:10.1159/000063622
[91] J. B. Sidbury, E. K. Smith and W. Harlan, “An Inborn Error of Short-Chain Fatty Acid Metabolism: The Odor of Sweaty Feet Syndrome,” The Journal of Pediatrics,
Vol. 70, No. 1, 1967, pp. 8-15. doi:10.1016/S0022-3476(67)80160-4
[92] R. F. Machado, D. Laskowski, O. Deffenderfer, et al., “Detection of Lung Cancer by Sensor Array Analyses of Exhaled Breath,” American Journal of Respiratory and Critical Care Medicine, Vol. 171, No. 11, 2005, pp. 1286-1291. doi:10.1164/rccm.200409-1184OC
[93] D. A. Pennazza, M. Santonico, E. Martinelli, C. Roscioni and G. Galluccio, “An Investigation on Electronic Nose Diagnosis of Lung Cancer,” Lung Cancer, Vol. 68, No. 2, 2010, pp. 170-176. doi:10.1016/j.lungcan.2009.11.003
[94] B. Kateb, M. A. Ryan, M. L. Homer, L. M. Lara, Y. Yin, K. Higa and M. Y. Chen, “Sniffing Out Cancer Using the JPL Electronic Nose: A Pilot Study of a Novel Approach to Detection and Differentiation of Brain Cancer,” Neuro- Image, Vol. 47, No. S2, 2009, pp. T5-T9. doi:10.1016/j.neuroimage.2009.04.015
[95] G. Horvath, J. Chilo and T. Lindblad, “Different Volatile Signals Emitted by Human Ovarian Carcinoma and Healthy Tissue,” Future Oncology, Vol. 6, No. 7, 2010, pp. 1043-1049. doi:10.2217/fon.10.60
[96] M. Bruins, Z. Rahimc, A. Bos, W. W. van de Sande, H. P. Endtz and A. van Belkum, “Diagnosis of Active Tuber- culosis by E-Nose Analysis of Exhaled Air,” Tuberculo- sis, Vol. 93, No. 2, 2012, pp. 1-7.
[97] S. Dragonieri, J. T. Annema, R. Schot, M. P. C. van der Schee, A. Spanevello, P. Carratú, O. Resta, K. F. Rabe and P. J. Sterk, “An Electronic Nose in the Discrimina- tion of Patients with Non-Small Cell Lung Cancer and COPD,” Lung Cancer, Vol. 64, No. 2, 2009, pp. 166-170. doi:10.1016/j.lungcan.2008.08.008
[98] M. Schaechter, G. Medoff and B. I. Eisenstein, “Mecha- nisms of Microbial Disease,” Lippincott Williams & Wil- kins., Baltimore, 1999.
[99] O. Honkinen, O. Lehtonen, O. Ruuskanen, P. Huovinen and J. Mertsola, “Cohort Study of Bacterial Species Caus- ing Urinary Tract Infection and Urinary Tract Abnormali- ties in Children,” British Medical Journal, Vol. 318, No. 7186, 1999, pp. 770-771. doi:10.1136/bmj.318.7186.770
[100] S. Krcmery, M. Dubrava and V. Krcmery Jr, “Fungal Urinary Infections in Patients at Risk,” International Journal of Antimicrobial Agents, Vol. 11, No. 3, 1999, pp. 289-291. doi:10.1016/S0924-8579(99)00032-1
[101] R. Fend, “Development of Medical Point-of-Care Appli- cations for Renal Medicine and Tuberculosis Based on Electronic Nose Technology,” Ph.D. Thesis, Cranfield University, Silsoe, 2004.
[102] F. D. Francescoa, R. Fuocob, M. G. Trivellaa and A. Cec- carinib, “Breath Analysis: Trends in Techniques and Clinical Applications,” Microchemical Journal, Vol. 79, No. 1, 2005, pp. 405-410. doi:10.1016/j.microc.2004.10.008