Application Server Market Opportunities, Strategies, … Server Brochure.pdf · WINTERGREEN...
24
WINTERGREEN RESEARCH, INC. Application Server Market Opportunities, Strategies, and Forecasts, 2006 to 2012 Application Server Picture by Susie Eustis MOUNTAINS OF OPPORTUNITY WinterGreen Research, Inc. Lexington, Massachusetts www.wintergreenresearch.com REPORT # SH29821478 494 PAGES 150 TABLES AND FIGURES 2006 $3,200
Transcript of Application Server Market Opportunities, Strategies, … Server Brochure.pdf · WINTERGREEN...
WINTERGREEN RESEARCH, INC.
Application Server Market Opportunities, Strategies, and
Forecasts, 2006 to 2012
Application Server
Picture by Susie Eustis
MOUNTAINS OF OPPORTUNITY
WinterGreen Research, Inc. Lexington, Massachusetts www.wintergreenresearch.com
REPORT # SH29821478 494 PAGES 150 TABLES AND FIGURES 2006 $3,200

WINTERGREEN RESEARCH, INC.
REPORT # SH29821478 494 PAGES 150 TABLES AND FIGURES 2006 $3,200
CHECK OUT THESE KEY TOPICS
APPLICATION SERVER MARKET SHARES APPLICATION SERVER MARKET FORECASTS
Application Servers Implement Internet Channel Application Server Regional Analysis SOA Reusable Software Component
Application Servers Manage Distributed TransactionsDISCONNECTED SILOS OF APPLICATIONS
E-BUSINESS PLATFORMS APPLICATION SERVER SOLUTIONS
PROFESSIONAL SERVICE CAPABILITIES GO TO MARKET STRATEGIES
APPLICATION SERVER PRICING APPLICATION SERVER POSITIONING
APPLICATION SERVER INDUSTRY SPECIFIC APPLICATIONS OPEN SOURCE APPLICATION SERVERS
APPLICATION SERVER DEVELOPMENT TOOLS
OPPORTUNITY ABOUNDS WinterGreen Research, Inc. Lexington, Massachusetts
www.wintergreenresearch.com
WINTERGREEN RESEARCH, INC.
REPORT # SH29821478 494 PAGES 150 TABLES AND FIGURES 2006 $3,200
Application Server Market Opportunities, Market Forecasts, and
Market Strategies, 2006-2012
IBM has positioned to offer application servers on the mainframe, with economies of scale achieved by implementing shared processing with highly efficient multiple workloads on single systems, particularly mainframes. The large quantities of data generated by web applications, the sheer volume of transactions managed by automated process generates large volumes of revenue, creating the need for mainframe application servers even in mid range size companies. Application servers depend on SOA solutions. Services oriented applications are evolved from an architecture that is an IT data base engine that functions as a directory to manage scripts with header, date, user, and use information that supports broad enterprise access to information. SOA engines are designed to support reuse of adapters in a number of data centers. Mission-critical requirements for scalability, reliability, load balancing and performance are essential through a distributed environment in an enterprise. Mission-critical application systems and underlying platforms are reliable. Mission-critical functionality is needed by any application that inter-operates with a mainframe system. In addition to keeping transactions on centralized servers or mainframes, organizations are distributing information to the edge of the network using edge servers throughout their organizations. Application servers provide connectivity to partners, suppliers, and customers. The Internet has become a new distribution channel. Partners are automating the ordering and shipping of goods. The middleware computing paradigm is leading to global installation of the networking equipment to support connectivity within and across organizations. Broadband communications pathways are being put in place. Information is mapped from nodes in a source schema to nodes in the destination schema. By drawing links between the nodes, a map is created. Rules embedded in messages provide conversion, processing, and abstraction capabilities. Rules are used to create looping, cumulative, date and time, and iteration. Linking one or more source nodes to a rule component and then linking the rule component to one or more destination nodes graphically implement these.
WINTERGREEN RESEARCH, INC.
REPORT # SH29821478 494 PAGES 150 TABLES AND FIGURES 2006 $3,200
Application server markets at $2 billion in 2005 are expected to reach $6.6 billion by 2012.

WINTERGREEN RESEARCH, INC.
REPORT # SH29821478 494 PAGES 150 TABLES AND FIGURES 2006 $3,200
Companies Profiled
Market Leaders
IBM BEA
Market Participants Adobe AmberPoint AttachmateWRQ BMC Software Cape Clear CAPE Systems EMC Documentum Envoy Technologies FileNet Fiorano Fujitsu GoAhead GXS HP i2 Inovis Interwoven Infravio IONA ItemField Kabira Microsoft MQ Software Novell Open Text Oracle Pegasystems Progress Software Red Hat SAP Savvion SOA Software Sun Microsystems Sybase Synergy Financial Systems TIBCO Vitria webMethods Zebra Technologies

WINTERGREEN RESEARCH, INC.
REPORT # SH29821478 494 PAGES 150 TABLES AND FIGURES 2006 $3,200
Application Server Strategies and Forecasts, 2006-2012
REPORT METHODOLOGY
THIS IS THE 286TH REPORT IN A SERIES OF MARKET RESEARCH REPORTS THAT PROVIDE FORECASTS IN
COMMUNICATIONS, TELECOMMUNICATIONS, THE INTERNET, COMPUTER, SOFTWARE, TELEPHONE EQUIPMENT, HEALTH EQUIPMENT, AND ENERGY. THE PROJECT LEADERS TAKE DIRECT RESPONSIBILITY FOR WRITING AND PREPARING EACH REPORT. THEY HAVE SIGNIFICANT EXPERIENCE PREPARING INDUSTRY STUDIES. FORECASTS ARE BASED ON PRIMARY RESEARCH AND PROPRIETARY DATA BASES. FORECASTS REFLECT ANALYSIS OF THE MARKET TRENDS IN THE SEGMENT AND RELATED SEGMENTS. UNIT AND DOLLAR SHIPMENTS ARE ANALYZED THROUGH CONSIDERATION OF DOLLAR VOLUME OF EACH MARKET PARTICIPATION IN THE SEGMENT. INSTALLED BASE ANALYSIS AND UNIT ANALYSIS IS BASED ON INTERVIEWS AND AN INFORMATION SEARCH. MARKET SHARE ANALYSIS INCLUDES CONVERSATIONS WITH KEY CUSTOMERS OF PRODUCTS, INDUSTRY SEGMENT LEADERS, MARKETING DIRECTORS, DISTRIBUTORS, LEADING MARKET PARTICIPANTS, OPINION LEADERS, AND COMPANIES SEEKING TO DEVELOP MEASURABLE MARKET SHARE. OVER 200 IN DEPTH INTERVIEWS ARE CONDUCTED FOR EACH REPORT WITH A BROAD RANGE OF KEY PARTICIPANTS AND INDUSTRY LEADERS IN THE MARKET SEGMENT. WE ESTABLISH ACCURATE MARKET FORECASTS BASED ON ECONOMIC AND MARKET CONDITIONS AS A BASE. USE INPUT/OUTPUT RATIOS, FLOW CHARTS, AND OTHER ECONOMIC METHODS TO QUANTIFY DATA. USE IN-HOUSE ANALYSTS WHO MEET STRINGENT QUALITY STANDARDS. INTERVIEWING KEY INDUSTRY PARTICIPANTS, EXPERTS AND END-USERS. OUR RESEARCH INCLUDES ACCESS TO LARGE PROPRIETARY DATABASES. LITERATURE SEARCH INCLUDES ANALYSIS OF TRADE PUBLICATIONS, GOVERNMENT REPORTS, AND CORPORATE LITERATURE.
YOU MUST HAVE THIS STUDY
WINTERGREEN RESEARCH, INC.
REPORT # SH29821478 494 PAGES 150 TABLES AND FIGURES 2006 $3,200
Application Server Market Opportunities, Strategies, and
Forecasts, 2006 to 2012
Table of Contents APPLICATION SERVER EXECUTIVE SUMMARY
APPLICATION SERVER EXECUTIVE SUMMARY ES-1 Application Servers Implement Internet Channel ES-1 Application Servers Support High Availability Systems ES-4
Application Servers On The Mainframe ES-4 Application Server Market Shares ES-6
Application Server Market Shares First Three Quarters 2006 ES-6 Application Server Market Forecasts ES-8
APPLICATION SERVER MARKET DESCRIPTION AND MARKET DYNAMICS 1. APPLICATION SERVER MARKET DESCRIPTION AND MARKET DYNAMICS 1-1 1.1 Application Server Virtual Hosting, Clustering, Fail-Over And Load Balancing 1-1 1.2 Application Server Provides Competitive Advantage 1-5 1.3 SOA Reusable Software Components 1-6
1.3.1 SOA Community-Based Marketplaces 1-8 1.3.2 Components Aimed At Developer Base 1-9
1.4 Infrastructure Switch 1-9 1.4.1 Market Change 1-10
1.5 Increasing Java Productivity 1-12 1.5.1 Increasing Developer Base 1-13
1.6 Application Server Platform Priorities 1-13 1.7 Consolidated Systems 1-14 1.8 Application Servers Manage Distributed Transactions 1-17
1.8.1 Application Server Transaction Management 1-18 1.8.2 Distributed Transactions 1-19 1.8.3 Distributed Processing Implemented As A Centralized System 1-20 1.8.4 Benchmarking Core Application Server Competitive Measure 1-21 1.8.5 Application Server Positioning 1-23
1.9 Disconnected Silos Of Applications 1-25 1.9.1 Mission Critical Functionality 1-26 1.9.2 Mainframe Environments Provide Improved ROI 1-27
1.10 Distributed Computing 1-31 1.11 Web-Based Systems 1-31 1.12 E-Business Platforms 1-35
1.12.1 Business Process Management Platforms 1-36 1.12.2 Business Process Use Of Application Servers 1-38 1.12.3 Effective Control Of E-Commerce Systems 1-40 1.12.4 Web-Based E-Commerce Systems 1-41 1.12.5 Common Platform For Applications 1-42 1.12.6 Scalability, Performance, And Reliability 1-43
1.13 Integrated Functionality 1-44 1.14 Modular, Application Server-Based Architecture 1-45 1.15 Application Server Solutions 1-47
1.15.1 Internet Customer Relationship Management Solutions 1-48 1.16 Professional Service Capabilities 1-49
WINTERGREEN RESEARCH, INC.
REPORT # SH29821478 494 PAGES 150 TABLES AND FIGURES 2006 $3,200
1.16.1 Systems Integrators And Web Developers 1-49 1.16.2 Expanding Market Presence 1-50
1.17 Go To Market Strategies 1-50 1.17.1 Go To Market Partnering 1-51 1.17.2 Business Imperatives 1-51
1.18 Need For Speed And Simplicity Of Underlying Business Processes 1-52 1.18.1 Complexity: The Challenge 1-54 1.18.2 Order-To-Delivery Cycle 1-55
APPLICATION SERVER MARKET SHARES AND MARKET FORECASTS
2. APPLICATION SERVER MARKET SHARES AND MARKET FORECASTS 2-1 2.1 Application Servers Implement Internet Channel 2-1
2.1.1 Application Server Market Driving Forces 2-5 2.1.2 Application Server Segments 2-7
2.2 Application Server Market Shares 2-9 2.2.1 Application Server Market Shares First Three Quarters 2006 2-10 2.2.2 Application Server Market Shares2005 2-16 2.2.3 Apache 2-25 2.2.4 Consistent Model For Enterprise Application 2-25
2.3 Application Server Market Forecasts 2-26 2.3.1 High End Application Server Market 2-29 2.3.2 Mid Range Application Server Market 2-32
2.4 Open Source Application Servers 2-35 2.4.1 Worldwide Application Server License Market Forecasts 2-38 2.4.2 Small and Medium Business Application Server Market 2-40
2.5 Application Server Development Tools 2-42 2.5.1 Application Server Installed Base and Unit Shipments 2-43
2.6 Application Server Pricing 2-44 2.6.1 Application Server Pricing Variations 2-44
2.7 Application Server Regional Analysis 2-46 2.8 Internet Driving Forces 2-49 2.9 Application Server Positioning 2-53
2.9.1 Reliability 2-55 2.9.2 High Availability 2-56 2.9.3 Performance 2-56 2.9.4 Scalability 2-57 2.9.5 Flexibility 2-57 2.9.6 Productivity 2-58 2.9.7 Operability 2-58 2.9.8 Maintainability 2-59 2.9.9 Security 2-59 2.9.10 Complexity Of Integrating 2-60
2.10 Application Server Support High Availability Systems 2-60 2.10.1 Application Server Primary Functions 2-61
APPLICATION SERVER PRODUCT DESCRIPTION
3. APPLICATION SERVER PRODUCT DESCRIPTION 3-1 3.1 IBM WebSphere Application Server 3-1
3.1.1 IBM WebSphere Application Server 3-3 3.1.2 IBM WebSphere Application Server for z/OS 3-3 3.1.3 IBM iSeries WebSphere Application Server 3-6 3.1.4 IBM WebSphere Application Server Transaction Management And Integration 3-9 3.1.5 IBM Mainframe WebSphere Application Server SOA Software Advantages: 3-10 3.1.6 IBM Services Oriented Architecture SOA Software Benefits: 3-11 3.1.7 IBM WebSphere Apache Geronimo Application Server Community Edition 3-12 3.1.8 IBM WebSphere Application Server - Express 3-18
WINTERGREEN RESEARCH, INC.
REPORT # SH29821478 494 PAGES 150 TABLES AND FIGURES 2006 $3,200
3.1.9 IBM WebSphere Open Source, Lightweight J2EE Application Server Built On Apache Geronimo 3-26 3.1.10 IBM Rational Web Developer 3-27 3.1.11 IBM WebSphere® Extended Deployment 3-28 3.1.12 IBM WebSphere® Partitioning Facility 3-28 3.1.13 IBM WebSphere Edge Server 3-29 3.1.14 IBM WebSphere Remote Server 3-30
3.2 BEA WebLogic Application Server 3-31 3.2.1 BEA JRockit 3-32 3.2.2 BEA WebLogic Application Server Enterprise-Grade Kernel 3-34 3.2.3 BEA WebLogic Application Server Advanced Administration 3-35 3.2.4 BEA WebLogic Application Server Reliable Messaging 3-35 3.2.5 BEA WebLogic Family of Products 3-37 3.2.6 BEA WebLogic RFID Product Family 3-38 3.2.7 BEA WebLogic System-Wide Default Persistent Store 3-39 3.2.8 BEA WebLogic Server Security 3-41 3.2.9 BEA WebLogic Server 9.2 3-41 3.2.10 BEA WebLogic Portal 9.2 3-44 3.2.11 BEA WebLogic Workshop 9.2 3-46 3.2.12 BEA WebLogic Mobility Server 3-47
3.3 Oracle Application Server 3-48 3.3.1 Oracle Application Server Fusion Middleware 3-49 3.3.2 Oracle Application Server 10g: Editions, Products, and Options 3-50 3.3.3 Oracle Small Business Application Server 3-54 3.3.4 Oracle Application Server Service-Oriented Architecture (SOA) 3-55 3.3.5 Oracle Business Activity Monitoring 3-55 3.3.6 Oracle BPEL Process Manager 3-56 3.3.7 Oracle Application Server Business Rules 3-56 3.3.8 Oracle Fusion Middleware Enterprise Service Bus (ESB) Infrastructure 3-57 3.3.9 Oracle ESB Communication with Reliable Messaging and Intelligent Routing 3-57 3.3.10 Oracle Application Server 10g Enterprise Edition 3-58 3.3.11 Oracle Application Server 10g Standard Edition 3-58 3.3.12 Oracle Application Server 10g Standard Edition One 3-58 3.3.13 Oracle Application Server 10g Java Edition 3-59 3.3.14 Oracle Business Integration 3-59
3.4 Novell 3-59 3.4.1 Novell exteNd Non-Invasive Connectivity 3-60 3.4.2 Novell exteNd Security 3-60 3.4.3 Novell Technology Partner IBM DB2 Connect Application Server zSeries 3-68 3.4.4 Novell exteNd Application Server HA/HR Features 3-68 3.4.5 Novell exteNd Application Server 3-69
3.5 Fujitsu Application Server 3-70 3.5.1 Fujitsu® Interstage® Application Server 3-72 3.5.2 Fujitsu Interstage Application Server Cross Platform Support 3-77 3.5.3 Fujitsu Interstage Application Server Greater IT Productivity and Improved Quality 3-77 3.5.4 Fujitsu Interstage Application Server Greater Operational Stability 3-78 3.5.5 Fujitsu Interstage Application Server Secure System Development 3-78
3.6 Red Hat Application Server 3-78 3.6.1 Red Hat Application Server Technology Summary 3-79 3.6.2 Red Hat Application Solutions 3-82 3.6.3 Red Hat Application Server 3-82
3.7 Adobe / Macromedia 3-84 3.7.1 Macromedia Flex 3-85 3.7.2 Adobe Macromedia JRun 4 3-90 3.7.3 Adobe Macromedia Presentation Services 3-91 3.7.4 Adobe Macromedia Performance and Scalability 3-93 3.7.5 Adobe Macromedia Application Server Development and Deployment Services 3-95 3.7.6 Adobe Macromedia Application Server Data Access Services 3-96 3.7.7 Adobe Macromedia ColdFusion MX 7 3-97 3.7.8 Adobe FrameMaker 3-97

WINTERGREEN RESEARCH, INC.
REPORT # SH29821478 494 PAGES 150 TABLES AND FIGURES 2006 $3,200
3.7.9 Adobe Flex 3-99 3.7.10 Adobe Flex Builder 2 3-99 3.7.11 Adobe Flex Charting 2 3-100 3.7.12 Adobe Flex Data Services 2 3-100
3.8 Microsoft Application Center 3-100 3.8.1 Microsoft Internet Information Services (IIS) 3-103
3.9 Broadsoft BroadWorks Assistant 3-103 3.9.1 BroadWorks Receptionist 3-103
3.10 Sun SeeBeyond ICAN Suite 3-104 3.11 Apache 3-105
3.11.1 Apache Authn/Authz 3-106 3.11.2 Apache Caching 3-106 3.11.3 Apache Configuration 3-107 3.11.4 Apache Graceful stop 3-107 3.11.5 Apache Proxying 3-107 3.11.6 Apache Smart Filtering 3-107 3.11.7 Apache Large File Support 3-108 3.11.8 Apache SQL Database Support 3-108 3.11.9 Apache Authn/Authz 3-108
3.12 Sun Java System Application Server 3-109 3.12.1 SJSAS 3-110 3.12.2 NetBeans 3-111 3.12.3 Sun Java System Message Queue 3-111 3.12.4 Sun Java System Web Server 3-111
3.13 Zeus Web Server 3-111 3.14 BMC Mainview for Application Server Management 3-113
APPLICATION SERVER STRATEGY, TECHNOLOGY, AND INDUSTRY SPECIFIC APPLICATIONS
4. APPLICATION SERVER STRATEGY, TECHNOLOGY, AND INDUSTRY SPECIFIC APPLICATIONS 4-1 4.1 Application Server Strategy 4-1 4.2 Application Server Positioning 4-2
4.2.1 B2B Commerce Technology As A Working Reality 4-3 4.2.2 Integration Application Server 4-4 4.2.3 Application Server Strategy 4-4 4.2.4 Communities Of Partners 4-6
4.3 IBM Strategy 4-6 4.3.1 IBM WebSphere Application Development Targets Ordinary People 4-7 4.3.2 Common Development Environment Across Windows And Linux 4-9 4.3.3 IBM WebSphere Grid Supports 4-10 4.3.4 IBM Partner Strategy 4-10 4.3.5 IBM Application Server Bundling 4-11
4.4 BEA Strategy 4-12 4.4.1 BEA Positions To Preserve Existing Investment In IT Systems 4-13 4.4.2 BEA Application Infrastructure Positioning 4-14 4.4.3 BEA Sales Strategy 4-15 4.4.4 BEA Dev2dev 4-21 4.4.5 Dev2dev User Group Program 4-22 4.4.6 Dev2dev University Program 4-22 4.4.7 BEA dev2dev Membership Program 4-23
4.5 Microsoft Strategy 4-23 4.6 Oracle Strategy 4-24 4.7 Application Server Technology 4-24
4.7.1 Java Application Server 4-24 4.7.2 Java and J2EE 4-25 4.7.3 Major Types Of Enterprise Beans 4-25 4.7.4 EJB Clustering 4-27

WINTERGREEN RESEARCH, INC.
REPORT # SH29821478 494 PAGES 150 TABLES AND FIGURES 2006 $3,200
4.7.5 EJB Caching 4-28 4.7.6 Back-End Layer 4-28 4.7.7 Relational Database Access 4-29 4.7.8 Web Services 4-30 4.7.9 Web Service Applications Composed Of Servlets And EJBs 4-31 4.7.10 WS-Security 4-32 4.7.11 Open Standards 4-32 4.7.12 Reliable Web Services Solutions 4-32 4.7.13 Enterprise JavaBeans (EJBs) 4-34 4.7.14 Autonomic Computing Technologies 4-38 4.7.15 Grid Protocol Topology 4-43 4.7.16 Open Grid Services Architecture (OGSA) 4-45 4.7.17 Eclipse Open-Source Tools Framework 4-46
4.8 Transaction Automation 4-47 4.8.1 Asynchronous Communications Dominate 4-47
4.9 Stateless Session Bean 4-49 4.10 Cluster 4-50 4.11 Location Transparency 4-51 4.12 Smart Proxy 4-52 4.13 Load Balancing 4-52 4.14 Process-Entity Design Pattern 4-53 4.15 Command Objects / Control Flow 4-53 4.16 Authorization Checks 4-54 4.17 Delegation 4-55 4.18 Collaborative Filtering 4-56 4.19 Site Analysis 4-56 4.20 Portals 4-57 4.21 Application Server Industry Specific Applications 4-59
4.21.1 Packaged Applications 4-59 4.21.2 Real-Time Processing 4-60
APPLICATION SERVER COMPANY PROFILES 5. APPLICATION SERVER COMPANY PROFILES 5-1 5.1 Adobe 5-1
5.1.1 Adobe’s Products 5-2 5.1.2 Adobe Creative Suite 5-2 5.1.3 Digital Imaging and Video 5-2 5.1.4 Intelligent Document Software 5-3 5.1.5 Adobe Financial Data 5-3 5.1.6 Adobe acquires Macromedia 5-5
5.2 AmberPoint 5-8 5.2.1 AmberPoint/Software AG 5-10 5.2.2 AmberPoint/IONA 5-10
5.3 AttachmateWRQ 5-11 5.3.1 Legacy Integration 5-12 5.3.2 AttachmateWRQ/OpenSpan 5-12 5.3.3 AttachmateWRQ/NetIQ 5-13 5.3.4 NetIQ 5-14
5.4 BEA 5-16 5.4.1 Partners 5-17 5.4.2 Customers 5-17 5.4.3 Products 5-18 5.4.4 BEA Acquires Fuego 5-20 5.4.5 BEA Acquires Plumtree Software 5-20 5.4.6 Plumtree software products 5-21 5.4.7 BEA First Quarter Results 5-21 5.4.8 BEA Revenue 2005 5-22
WINTERGREEN RESEARCH, INC.
REPORT # SH29821478 494 PAGES 150 TABLES AND FIGURES 2006 $3,200
5.5 BMC Software 5-22 5.5.1 BMC’s Strategy 5-23 5.5.2 Mainframe Management 5-25 5.5.3 Distributed Systems Management 5-25 5.5.4 BMC/IDS Scheer 5-25 5.5.5 BMC/Identify 5-26 5.5.6 BMC Financial Data 5-27
5.6 Cape Clear 5-29 5.6.1 Partners 5-31 5.6.2 Cape Clear Solutions 5-31 5.6.3 Cape Clear/MrTed 5-32
5.7 CAPE Systems 5-33 5.7.1 Services 5-33 5.7.2 Solutions 5-33 5.7.3 Partners 5-34 5.7.4 Products 5-34
5.8 EMC Documentum 5-35 5.8.1 Products 5-35 5.8.2 Services 5-36 5.8.3 Solutions 5-36 5.8.4 EMC Acquires nLayers 5-36 5.8.5 EMC acquires Interlink 5-37 5.8.6 EMC First Quarter Results 5-37 5.8.7 EMC Documentum 2005 Revenue 5-39
5.9 Envoy Technologies 5-39 5.9.1 Products 5-39 5.9.2 Partners 5-40 5.9.3 Customers 5-40
5.10 FileNet 5-41 5.10.1 Strategies 5-41 5.10.2 Customers and Markets 5-42 5.10.3 FileNet P8 Platform 5-43 5.10.4 Products 5-43 5.10.5 FileNet First Quarter 2006 Results 5-46 5.10.6 FileNet Revenue 2005 5-47
5.11 Fiorano 5-49 5.11.1 Products 5-49 5.11.2 Customers 5-51 5.11.3 Partners 5-51 5.11.4 Fiorano / Improsive Technologies 5-52 5.11.5 Fiorano / IntegraSolv 5-53 5.11.6 Fiorano / Asidua 5-53
5.12 Fujitsu 5-54 5.12.1 Services 5-54 5.12.2 Products 5-55 5.12.3 Fujitsu Acquires Rapidigm 5-56 5.12.4 Fujitsu 2005 Revenue 5-56
5.13 GoAhead 5-57 5.13.1 Customers 5-58 5.13.2 Partners 5-58 5.13.3 Products 5-58
5.14 GXS 5-58 5.14.1 Industry 5-59 5.14.2 Products 5-60 5.14.3 Discussion of Strategy 5-60 5.14.4 Acquisitions 5-61 5.14.5 Partners 5-61 5.14.6 Customers 5-63 5.14.7 Microsoft / GXS 5-63
WINTERGREEN RESEARCH, INC.
REPORT # SH29821478 494 PAGES 150 TABLES AND FIGURES 2006 $3,200
5.15 HP 5-64 5.15.1 Products 5-64 5.15.2 Consulting and Integration 5-65 5.15.3 HP Financial Data 5-65 5.15.4 HP 2005 Revenue 5-68 5.15.5 HP/TIBCO 5-68
5.16 i2 5-69 5.16.1 Distributed Fulfillment and Revenue Management. 5-69 5.16.2 Supply and Demand Synchronization 5-70 5.16.3 Products 5-70 5.16.4 i2’s Financial Data 5-71 5.16.5 i2 Revenue 2005 5-72 5.16.6 i2/RiverOne 5-72
5.17 IBM 5-73 5.17.1 Description of Business 5-74 5.17.2 IBM's Strategy 5-75 5.17.3 Products and Services 5-76 5.17.4 IBM WebSphere 5-76 5.17.5 IBM and SAP 5-78 5.17.6 IBM Acquires DataPower 5-79 5.17.7 DataPower 5-80 5.17.8 DataPower's strategy 5-80 5.17.9 DataPower XG3 Product Family 5-81 5.17.10 IBM Acquires Ascential Software 5-81 5.17.11 Ascential 5-82 5.17.12 IBM / Micromuse Inc. 5-83 5.17.13 IBM Acquires Bowstreet, Inc. 5-84 5.17.14 IBM 2006 First-Quarter Results 5-85
5.18 Inovis 5-88 5.18.1 Products 5-89 5.18.2 Inovis Acquires QRS Corporation 5-90 5.18.3 Partners 5-91
5.19 Interwoven 5-91 5.19.1 Products 5-92 5.19.2 Customers 5-94 5.19.3 Interwoven’s Acquisitions 5-95 5.19.4 Interwoven’s Financial Data 5-95 5.19.5 Interwoven 2005 Revenue 5-96 5.19.6 Interwoven / Data Builder 5-97
5.20 Infravio 5-97 5.20.1 Partners 5-99
5.21 IONA 5-99 5.21.1 Products 5-99 5.21.2 Partners 5-100 5.21.3 IONA And Industria Form Strategic Partnership 5-100 5.21.4 IONA and Wipro Technologies Partner for SOA 5-100 5.21.5 IONA And AmberPoint Announce Integrated SOA Infrastructure Capabilities 5-101 5.21.6 IONA First Quarter 2006 Revenue 5-101 5.21.7 IONA 2005 Revenue 5-102
5.22 ItemField 5-102 5.22.1 Products 5-103 5.22.2 Partners 5-103 5.22.3 Customers 5-104
5.23 Kabira 5-106 5.23.1 Products 5-106 5.23.2 Customers 5-106 5.23.3 Partners 5-106
5.24 Microsoft 5-107 5.24.1 Business 5-107

WINTERGREEN RESEARCH, INC.
REPORT # SH29821478 494 PAGES 150 TABLES AND FIGURES 2006 $3,200
5.24.2 Product Information 5-108 5.24.3 Microsoft BizTalk Server 5-109 5.24.4 Customers 5-111 5.24.5 Microsoft and GXS Form Strategic Alliance 5-111 5.24.6 SAP and Microsoft 5-112 5.24.7 Microsoft, SOFTBANK BB and Japan Telecom 5-112 5.24.8 Microsoft Reports Third-Quarter Results 5-113 5.24.9 Microsoft Revenue 2005 5-115
5.25 MQ Software 5-116 5.25.1 Products 5-116 5.25.2 Partners 5-117 5.25.3 Customers 5-117 5.25.4 Acquisitions 5-118
5.26 Novell 5-118 5.26.1 Identity-driven computing solutions 5-119 5.26.2 Linux and platform services solutions 5-120 5.26.3 Novell’s Strategy 5-121 5.26.4 Partners 5-121 5.26.5 Novell Financial Data 5-122 5.26.6 Novell / Reuters 5-123
5.27 Open Text 5-124 5.27.1 Partners 5-124 5.27.2 Products and Solutions 5-124 5.27.3 Open Text Third Quarter 2006 Financial Results 5-125 5.27.4 Open Text 2005 Revenue 5-126
5.28 Oracle 5-127 5.28.1 Business 5-127 5.28.2 Recent Acquisitions 5-128 5.28.3 Products and Services 5-128 5.28.4 Oracle Acquires Oblix 5-130 5.28.5 Oblix Products and Services 5-131 5.28.6 Oracle Buys Open Source Software Company Sleepycat 5-131 5.28.7 Oracle’s Third Quarter Results 5-132 5.28.8 Oracle Revenue 2005 5-133
5.29 Pegasystems 5-133 5.29.1 Partners 5-134 5.29.2 Customers 5-134 5.29.3 Products and Solutions 5-134 5.29.4 Pegasystems 2005 Revenue 5-135
5.30 Progress Software 5-136 5.30.1 Products 5-137 5.30.2 Partners and Customers 5-138 5.30.3 Progress Software/ NEON Systems 5-138 5.30.4 Progress Software Reports First Quarter Financial Results 5-139 5.30.5 Progress Software 2005 Revenue 5-139
5.31 Red Hat 5-140 5.31.1 Red Hat Business Model 5-141 5.31.2 Business Strategy 5-142 5.31.3 Products and Services 5-143 5.31.4 Red Hat Enterprise Linux and Red Hat Desktop technologies 5-143 5.31.5 Additional Red Hat enterprise technologies 5-145 5.31.6 Red Hat Completes Acquisition of JBoss 5-145 5.31.7 Red Hat Reports Fiscal Fourth Quarter and Fiscal Year 2006 Results 5-146
5.32 SAP 5-148 5.32.1 Partners 5-149 5.32.2 Services 5-149 5.32.3 Solutions and Products 5-150 5.32.4 SAP Acquires Frictionless Commerce 5-150 5.32.5 SAP Acquires Virsa 5-151
WINTERGREEN RESEARCH, INC.
REPORT # SH29821478 494 PAGES 150 TABLES AND FIGURES 2006 $3,200
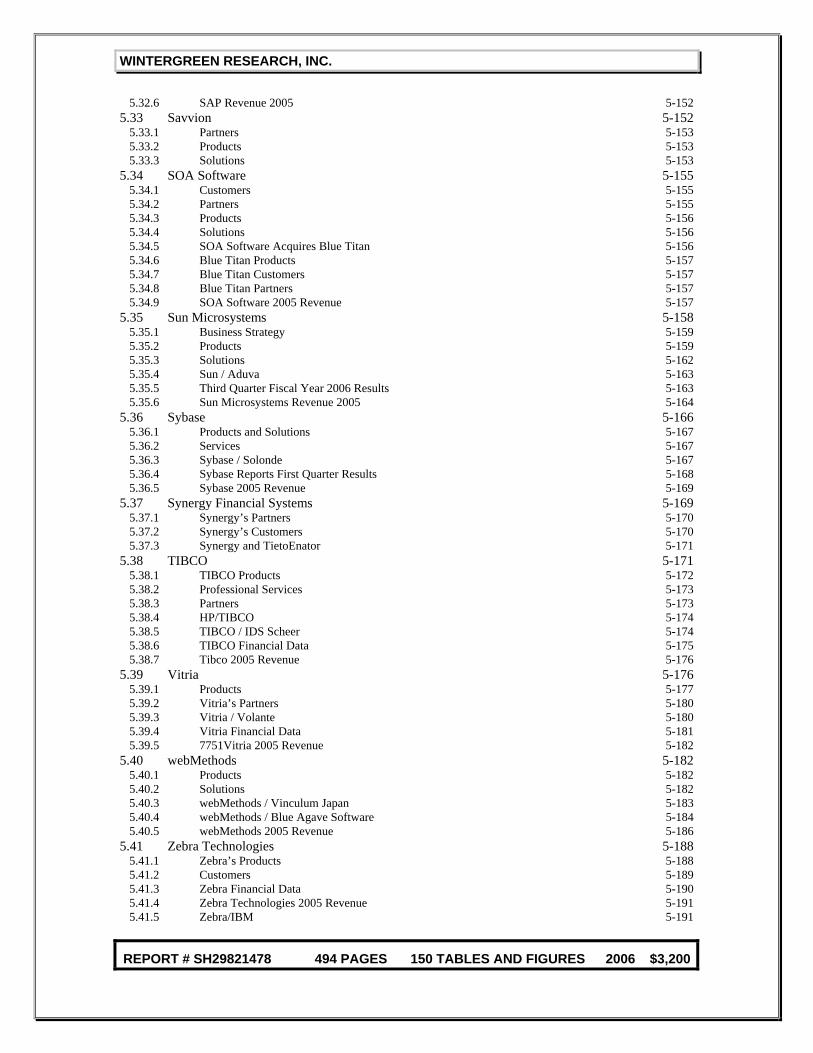
5.32.6 SAP Revenue 2005 5-152 5.33 Savvion 5-152
5.33.1 Partners 5-153 5.33.2 Products 5-153 5.33.3 Solutions 5-153
5.34 SOA Software 5-155 5.34.1 Customers 5-155 5.34.2 Partners 5-155 5.34.3 Products 5-156 5.34.4 Solutions 5-156 5.34.5 SOA Software Acquires Blue Titan 5-156 5.34.6 Blue Titan Products 5-157 5.34.7 Blue Titan Customers 5-157 5.34.8 Blue Titan Partners 5-157 5.34.9 SOA Software 2005 Revenue 5-157
5.35 Sun Microsystems 5-158 5.35.1 Business Strategy 5-159 5.35.2 Products 5-159 5.35.3 Solutions 5-162 5.35.4 Sun / Aduva 5-163 5.35.5 Third Quarter Fiscal Year 2006 Results 5-163 5.35.6 Sun Microsystems Revenue 2005 5-164
5.36 Sybase 5-166 5.36.1 Products and Solutions 5-167 5.36.2 Services 5-167 5.36.3 Sybase / Solonde 5-167 5.36.4 Sybase Reports First Quarter Results 5-168 5.36.5 Sybase 2005 Revenue 5-169
5.37 Synergy Financial Systems 5-169 5.37.1 Synergy’s Partners 5-170 5.37.2 Synergy’s Customers 5-170 5.37.3 Synergy and TietoEnator 5-171
5.38 TIBCO 5-171 5.38.1 TIBCO Products 5-172 5.38.2 Professional Services 5-173 5.38.3 Partners 5-173 5.38.4 HP/TIBCO 5-174 5.38.5 TIBCO / IDS Scheer 5-174 5.38.6 TIBCO Financial Data 5-175 5.38.7 Tibco 2005 Revenue 5-176
5.39 Vitria 5-176 5.39.1 Products 5-177 5.39.2 Vitria’s Partners 5-180 5.39.3 Vitria / Volante 5-180 5.39.4 Vitria Financial Data 5-181 5.39.5 7751Vitria 2005 Revenue 5-182
5.40 webMethods 5-182 5.40.1 Products 5-182 5.40.2 Solutions 5-182 5.40.3 webMethods / Vinculum Japan 5-183 5.40.4 webMethods / Blue Agave Software 5-184 5.40.5 webMethods 2005 Revenue 5-186
5.41 Zebra Technologies 5-188 5.41.1 Zebra’s Products 5-188 5.41.2 Customers 5-189 5.41.3 Zebra Financial Data 5-190 5.41.4 Zebra Technologies 2005 Revenue 5-191 5.41.5 Zebra/IBM 5-191
WINTERGREEN RESEARCH, INC.
REPORT # SH29821478 494 PAGES 150 TABLES AND FIGURES 2006 $3,200
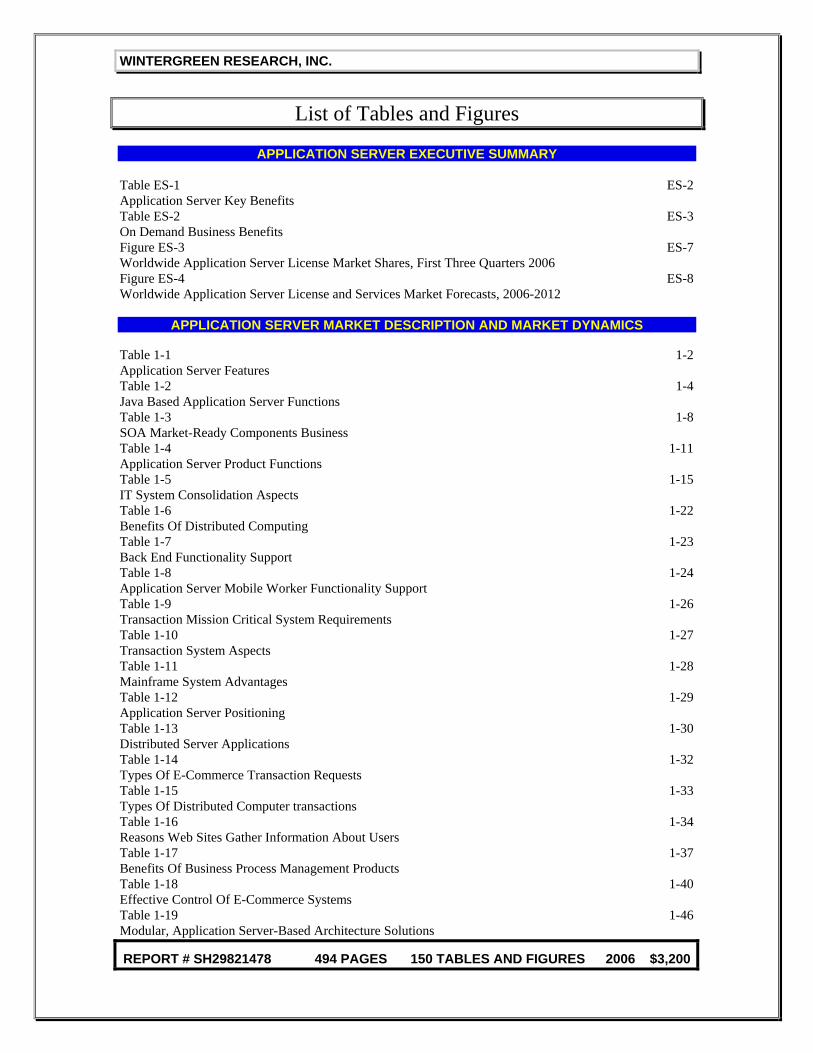
List of Tables and Figures
APPLICATION SERVER EXECUTIVE SUMMARY Table ES-1 ES-2 Application Server Key Benefits Table ES-2 ES-3 On Demand Business Benefits Figure ES-3 ES-7 Worldwide Application Server License Market Shares, First Three Quarters 2006 Figure ES-4 ES-8 Worldwide Application Server License and Services Market Forecasts, 2006-2012
APPLICATION SERVER MARKET DESCRIPTION AND MARKET DYNAMICS Table 1-1 1-2 Application Server Features Table 1-2 1-4 Java Based Application Server Functions Table 1-3 1-8 SOA Market-Ready Components Business Table 1-4 1-11 Application Server Product Functions Table 1-5 1-15 IT System Consolidation Aspects Table 1-6 1-22 Benefits Of Distributed Computing Table 1-7 1-23 Back End Functionality Support Table 1-8 1-24 Application Server Mobile Worker Functionality Support Table 1-9 1-26 Transaction Mission Critical System Requirements Table 1-10 1-27 Transaction System Aspects Table 1-11 1-28 Mainframe System Advantages Table 1-12 1-29 Application Server Positioning Table 1-13 1-30 Distributed Server Applications Table 1-14 1-32 Types Of E-Commerce Transaction Requests Table 1-15 1-33 Types Of Distributed Computer transactions Table 1-16 1-34 Reasons Web Sites Gather Information About Users Table 1-17 1-37 Benefits Of Business Process Management Products Table 1-18 1-40 Effective Control Of E-Commerce Systems Table 1-19 1-46 Modular, Application Server-Based Architecture Solutions

WINTERGREEN RESEARCH, INC.
REPORT # SH29821478 494 PAGES 150 TABLES AND FIGURES 2006 $3,200
Table 1-20 1-47 Application Server Solutions Table 1-21 1-53 Business Process Application Server Drivers
APPLICATION SERVER MARKET SHARES AND MARKET FORECASTS Table 2-1 2-2 Application Server Key Benefits Table 2-2 2-3 On Demand Business Benefits Table 2-3 2-6 Application Server Market Positioning Table 2-4 2-7 Market Driving Forces for Applications Servers Table 2-5 2-8 E-Commerce Target Markets Figure 2-6 2-10 Worldwide Application Server License Market Shares, First Three Quarters 2006 Table 2-7 2-11 Worldwide Application Server License Market Shares, First Three Quarters 2006 Figure 2-8 2-12 Worldwide Application Server Services Market Shares, First Three Quarters 2006 Table 2-9 2-13 Worldwide Application Server Services Market Shares, First Three Quarters 2006 Figure 2-10 2-14 Worldwide Application Server License and Services Market Shares, First Three Quarters 2006 Table 2-11 2-15 Worldwide Application Server License and Services Market Shares, First Three Quarters 2006 Figure 2-12 2-17 Worldwide Application Server License Market Shares, 2005 Table 2-13 2-18 Worldwide Application Server License Market Shares, 2005 Figure 2-14 2-19 Worldwide Application Server Services Market Shares, 2005 Table 2-15 2-20 Worldwide Application Server Services Market Shares, 2005 Figure 2-16 2-21 Worldwide Application Server License and Services Market Shares, 2005 Table 2-17 2-22 Worldwide Application Server License and Services Market Shares, 2005 Table 2-18 2-27 Worldwide Application Server License and Services Market Forecasts, 2006-2012 Table 2-19 2-28 Worldwide Application Server License and Services Market Forecasts, 2006-2012 Figure 2-20 2-29 Worldwide High End Application Server License and Services Market Forecasts, Dollars, 2006-2012 Figure 2-21 2-31 Worldwide High End Application Server Market Forecasts, Units, 2006-2012 Figure 2-22 2-33 Worldwide Mid Range Application Server License and Services Market Forecasts, Dollars, 2006-2012 Table 2-23 2-34 Worldwide Mid Range Application Server Market Forecasts, Units, 2006-2012
WINTERGREEN RESEARCH, INC.
REPORT # SH29821478 494 PAGES 150 TABLES AND FIGURES 2006 $3,200
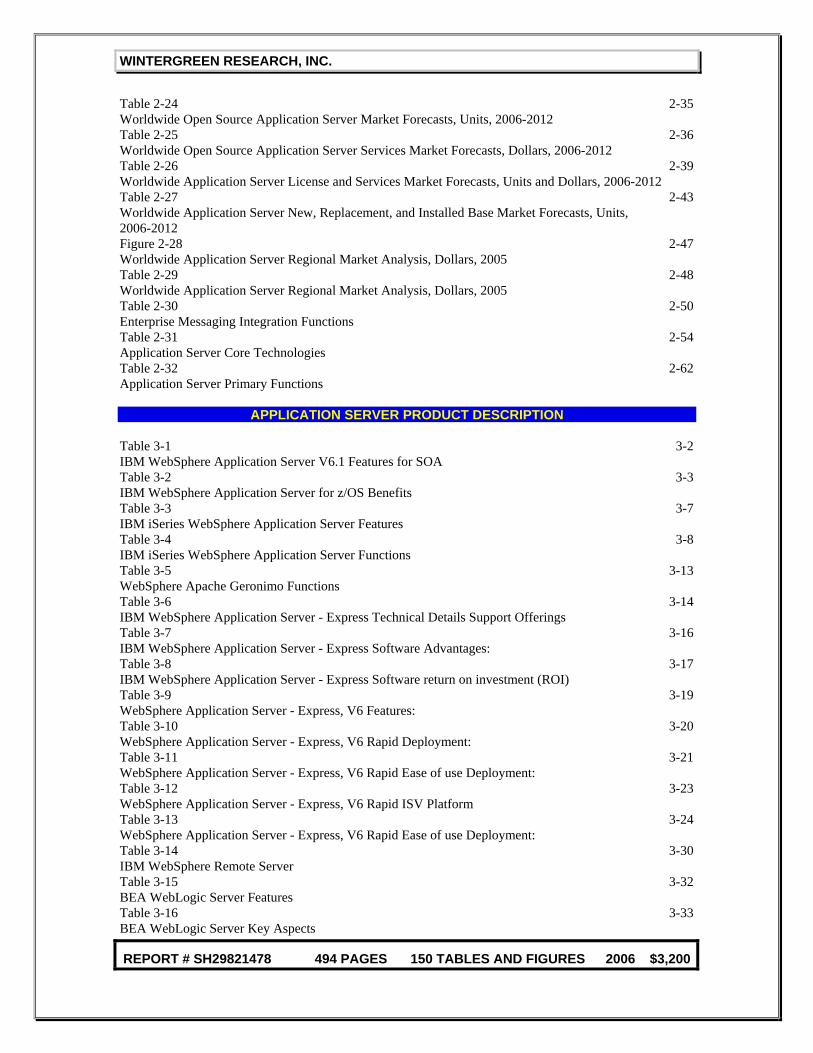
Table 2-24 2-35 Worldwide Open Source Application Server Market Forecasts, Units, 2006-2012 Table 2-25 2-36 Worldwide Open Source Application Server Services Market Forecasts, Dollars, 2006-2012 Table 2-26 2-39 Worldwide Application Server License and Services Market Forecasts, Units and Dollars, 2006-2012 Table 2-27 2-43 Worldwide Application Server New, Replacement, and Installed Base Market Forecasts, Units, 2006-2012 Figure 2-28 2-47 Worldwide Application Server Regional Market Analysis, Dollars, 2005 Table 2-29 2-48 Worldwide Application Server Regional Market Analysis, Dollars, 2005 Table 2-30 2-50 Enterprise Messaging Integration Functions Table 2-31 2-54 Application Server Core Technologies Table 2-32 2-62 Application Server Primary Functions
APPLICATION SERVER PRODUCT DESCRIPTION Table 3-1 3-2 IBM WebSphere Application Server V6.1 Features for SOA Table 3-2 3-3 IBM WebSphere Application Server for z/OS Benefits Table 3-3 3-7 IBM iSeries WebSphere Application Server Features Table 3-4 3-8 IBM iSeries WebSphere Application Server Functions Table 3-5 3-13 WebSphere Apache Geronimo Functions Table 3-6 3-14 IBM WebSphere Application Server - Express Technical Details Support Offerings Table 3-7 3-16 IBM WebSphere Application Server - Express Software Advantages: Table 3-8 3-17 IBM WebSphere Application Server - Express Software return on investment (ROI) Table 3-9 3-19 WebSphere Application Server - Express, V6 Features: Table 3-10 3-20 WebSphere Application Server - Express, V6 Rapid Deployment: Table 3-11 3-21 WebSphere Application Server - Express, V6 Rapid Ease of use Deployment: Table 3-12 3-23 WebSphere Application Server - Express, V6 Rapid ISV Platform Table 3-13 3-24 WebSphere Application Server - Express, V6 Rapid Ease of use Deployment: Table 3-14 3-30 IBM WebSphere Remote Server Table 3-15 3-32 BEA WebLogic Server Features Table 3-16 3-33 BEA WebLogic Server Key Aspects
WINTERGREEN RESEARCH, INC.
REPORT # SH29821478 494 PAGES 150 TABLES AND FIGURES 2006 $3,200
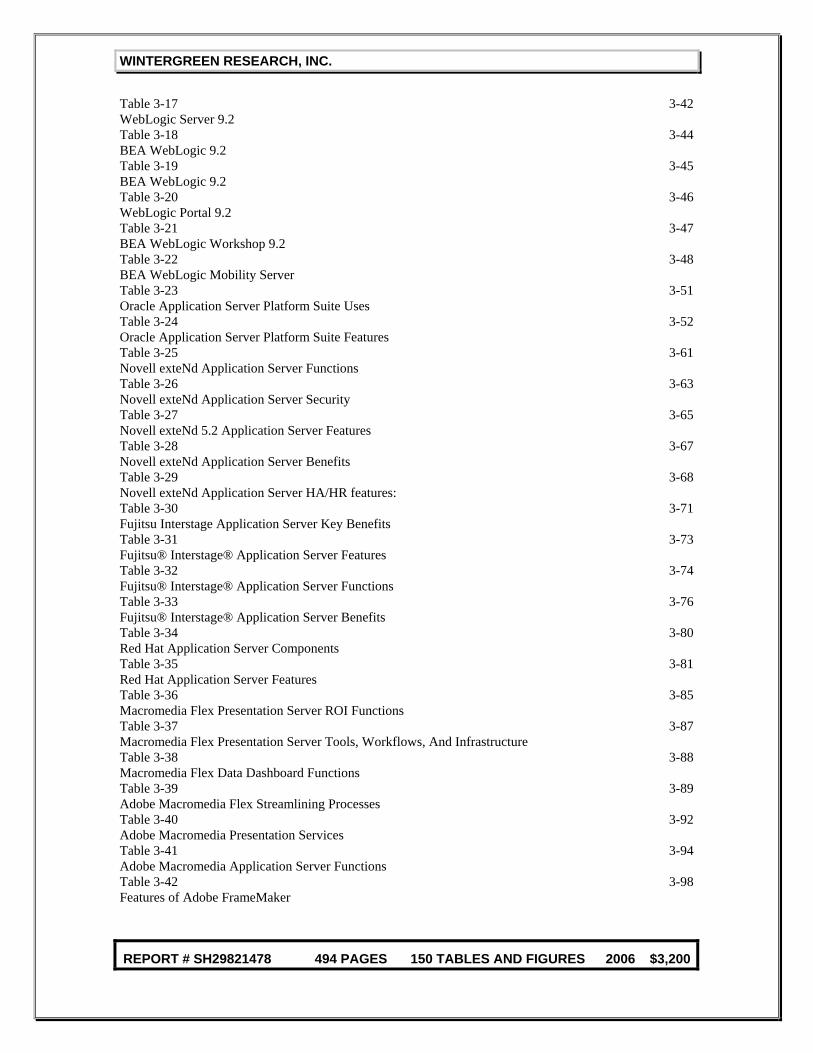
Table 3-17 3-42 WebLogic Server 9.2 Table 3-18 3-44 BEA WebLogic 9.2 Table 3-19 3-45 BEA WebLogic 9.2 Table 3-20 3-46 WebLogic Portal 9.2 Table 3-21 3-47 BEA WebLogic Workshop 9.2 Table 3-22 3-48 BEA WebLogic Mobility Server Table 3-23 3-51 Oracle Application Server Platform Suite Uses Table 3-24 3-52 Oracle Application Server Platform Suite Features Table 3-25 3-61 Novell exteNd Application Server Functions Table 3-26 3-63 Novell exteNd Application Server Security Table 3-27 3-65 Novell exteNd 5.2 Application Server Features Table 3-28 3-67 Novell exteNd Application Server Benefits Table 3-29 3-68 Novell exteNd Application Server HA/HR features: Table 3-30 3-71 Fujitsu Interstage Application Server Key Benefits Table 3-31 3-73 Fujitsu® Interstage® Application Server Features Table 3-32 3-74 Fujitsu® Interstage® Application Server Functions Table 3-33 3-76 Fujitsu® Interstage® Application Server Benefits Table 3-34 3-80 Red Hat Application Server Components Table 3-35 3-81 Red Hat Application Server Features Table 3-36 3-85 Macromedia Flex Presentation Server ROI Functions Table 3-37 3-87 Macromedia Flex Presentation Server Tools, Workflows, And Infrastructure Table 3-38 3-88 Macromedia Flex Data Dashboard Functions Table 3-39 3-89 Adobe Macromedia Flex Streamlining Processes Table 3-40 3-92 Adobe Macromedia Presentation Services Table 3-41 3-94 Adobe Macromedia Application Server Functions Table 3-42 3-98 Features of Adobe FrameMaker
WINTERGREEN RESEARCH, INC.
REPORT # SH29821478 494 PAGES 150 TABLES AND FIGURES 2006 $3,200
APPLICATION SERVER STRATEGY, TECHNOLOGY, AND INDUSTRY SPECIFIC APPLICATIONS
Table 4-1 4-3 Aspects Of Application Server Technology Table 4-2 4-5 Mainstream Application Servers Strategic Positioning Table 4-3 4-8 People Needing Tools To Implement Web Systems Table 4-4 4-16 Types Of BEA Strategic Alliances Table 4-5 4-19 BEA ISV Solution Providers Table 4-6 4-21 BEA dev2dev Offerings Table 4-7 4-26 Major Types Of Enterprise Beans Defined In EJB Table 4-8 4-35 Application Server Underlying Infrastructure Services Table 4-9 4-36 Major Types Of Enterprise Beans Table 4-10 4-39 Autonomic Features Table 4-11 4-41 Autonomic Functions Table 4-12 4-48 Distributed Transaction Functions Table 4-13 4-57 Portal Functions Table 4-14 4-59 Buy Or Build Decision Table 4-15 4-61 B2B Application Server Quantifiable Business Benefit Table 4-16 4-62 Trading Exchange Positioning Table 4-17 4-63 Integrated e-Market Benefits
APPLICATION SERVER COMPANY PROFILES Table 5-1 5-5 Condensed Consolidated Statements of Income Table 5-2 5-6 Business User Products Table 5-3 5-6 Consumer Products Table 5-4 5-7 Designer and Developer Products Table 5-5 5-9 AmberPoint’s Partners Table 5-6 5-19 BEA Product Categories Table 5-7 5-29
WINTERGREEN RESEARCH, INC.
REPORT # SH29821478 494 PAGES 150 TABLES AND FIGURES 2006 $3,200
Cape Clear Product Table 5-8 5-30 Cape Clear Customers Table 5-9 5-34 CAPE System’s Partners Table 5-10 5-40 Envoy’s Products Table 5-11 5-44 FileNet’s ECM suites Table 5-12 5-45 FileNet P8 Technologies Table 5-13 5-50 Fiorano’s Products Table 5-14 5-52 Fiorano Partner Categories Table 5-15 5-55 Fujitsu’s Products Categories Table 5-16 5-62 GXS’ Partners Table 5-17 5-77 WebSphere Product Categories Table 5-18 5-90 Inovis’ Products Table 5-19 5-92 Interwoven’s Solutions Table 5-20 5-98 Infravio’s Products Table 5-21 5-107 Microsoft business divisions Table 5-22 5-110 BizTalk Server Industries Table 5-23 5-116 MQ Software’s Products Table 5-24 5-123 Consolidated Unaudited Condensed Statements of Operations Table 5-25 5-125 Open Text’s Solution’s Categories Table 5-26 5-137 Progress Software’s Product Categories Table 5-27 5-144 Red Hat Operating System Platforms Table 5-28 5-147 Red Hat Subscription, Training and Services Quarterly Revenue Table 5-29 5-148 Red Hat Revenue for 2002-2006 Table 5-30 5-154 Savvion’s Solutions Categories Table 5-31 5-160 Sun’s Product Categories Table 5-32 5-178 BusinessWare’s Capabilities Table 5-33 5-185 webMethods and Blue Agave Partnership User Benefits Table 5-34 5-189
WINTERGREEN RESEARCH, INC.
REPORT # SH29821478 494 PAGES 150 TABLES AND FIGURES 2006 $3,200
Zebra’s Printers
ABOUT THE COMPANY
WINTERGREEN RESEARCH, HAS A UNIQUE RESEARCH STRATEGY THAT RELATES TO
IDENTIFYING MARKET TRENDS THROUGH READING AND INTERVIEWING OPINION LEADERS. BY READING THE
ELECTRONIC EQUIVALENT OF 40 FEET OF PAPER, WINTERGREEN RESEARCH SENIOR ANALYSTS CAN LEARN A
LOT MORE ABOUT MARKETS, A LOT FASTER THAN CAN BE LEARNED THROUGH EXPENSIVE SURVEYS AND
FOCUS GROUPS. THINKING ABOUT MARKET TRENDS IS A HIGH PRIORITY AT WINTERGREEN RESEARCH. AS
WITH ALL RESEARCH, THE VALUE PROPOSITION FOR COMPETITIVE ANALYSIS COMES FROM INTELLECTUAL
INPUT.
IT IS A LUXURY REALLY, AVAILABLE TO ONLY A VERY FEW PEOPLE, TO BE ABLE TO GATHER
INFORMATION, LOTS OF INFORMATION FROM READING MASSIVE AMOUNTS OF CONTENT, AND THEN TRYING
TO MAKE SENSE OF THAT CONTENT. THE ABILITY TO THINK ABOUT MARKET TRENDS IS ENHANCED BY DOING
IT OVER AND OVER FOR MANY DIFFERENT MARKETS. THAT IS WHAT WINTERGREEN RESEARCH IS ALL
ABOUT: READING AND THINKING IS AN ESSENTIAL ASPECT OF COMPETITIVE ANALYSIS. TALKING TO OPINION
LEADERS IS THE THIRD ESSENTIAL ASPECT OF PRODUCING GOOD, RELIABLE DATA.
WINTERGREEN RESEARCH, FOUNDED IN 1985, PROVIDES STRATEGIC MARKET ASSESSMENTS
IN TELECOMMUNICATIONS, COMMUNICATIONS EQUIPMENT, HEALTH CARE, INTERNET AND ADVANCED
COMPUTER TECHNOLOGY. INDUSTRY REPORTS FOCUS ON OPPORTUNITIES THAT EXPAND EXISTING MARKETS
OR DEVELOP MAJOR NEW MARKETS. THE REPORTS ASSESS NEW PRODUCT AND SERVICE POSITIONING
STRATEGIES, NEW AND EVOLVING TECHNOLOGIES, AND TECHNOLOGICAL IMPACT ON PRODUCTS, SERVICES,
AND MARKETS. MARKET SHARES ARE PROVIDED. LEADING MARKET PARTICIPANTS ARE PROFILED, AND
THEIR MARKETING STRATEGIES, ACQUISITIONS, AND STRATEGIC ALLIANCES ARE DISCUSSED. THE PRINCIPALS
OF WINTERGREEN RESEARCH HAVE BEEN INVOLVED IN ANALYSIS AND FORECASTING OF INTERNATIONAL
BUSINESS OPPORTUNITIES IN TELECOMMUNICATIONS AND ADVANCED COMPUTER TECHNOLOGY MARKETS
FOR OVER 30 YEARS.

WINTERGREEN RESEARCH, INC.
REPORT # SH29821478 494 PAGES 150 TABLES AND FIGURES 2006 $3,200
ABOUT THE PRINCIPAL AUTHORS ELLEN T. CURTISS, TECHNICAL DIRECTOR, CO-FOUNDER OF WINTERGREEN RESEARCH, CONDUCTS
STRATEGIC AND MARKET ASSESSMENTS IN TECHNOLOGY-BASED INDUSTRIES. PREVIOUSLY SHE WAS A
MEMBER OF THE STAFF OF ARTHUR D. LITTLE, INC., FOR 23 YEARS, MOST RECENTLY AS VICE PRESIDENT OF
ARTHUR D. LITTLE DECISION RESOURCES, SPECIALIZING IN STRATEGIC PLANNING AND MARKET
DEVELOPMENT SERVICES. SHE IS A GRADUATE OF BOSTON UNIVERSITY AND THE PROGRAM FOR
MANAGEMENT DEVELOPMENT AT HARVARD GRADUATE SCHOOL OF BUSINESS ADMINISTRATION. SHE IS
THE AUTHOR OF RECENT STUDIES ON WORLDWIDE TELECOMMUNICATIONS MARKETS, THE TOP TEN INTERNET
EQUIPMENT COMPANIES, THE TOP TEN CONTRACT MANUFACTURING COMPANIES, AND THE TOP TEN
TELECOMMUNICATIONS MARKET ANALYSIS AND FORECASTS.
SUSAN EUSTIS, PRESIDENT, CO-FOUNDER OF WINTERGREEN RESEARCH, HAS DONE RESEARCH IN
COMMUNICATIONS AND COMPUTER MARKETS AND APPLICATIONS. SHE HOLDS SEVERAL PATENTS IN
MICROCOMPUTING AND PARALLEL PROCESSING. SHE HAS THE ORIGINAL PATENTS IN ELECTRONIC VOTING
MACHINES. SHE HAS NEW PATENT APPLICATIONS IN FORMAT VARYING, MULITPROCESSING, AND ELECTRONIC
VOTING. SHE IS THE AUTHOR OF RECENT STUDIES OF THE REGIONAL BELL OPERATING COMPANIES'
MARKETING STRATEGIES, INTERNET EQUIPMENT, BIOMETRICS, A STUDY OF INTERNET EQUIPMENT,
WORLDWIDE TELECOMMUNICATIONS EQUIPMENT, TOP TEN TELECOMMUNICATIONS, DIGITAL LOOP
CARRIER, WEB HOSTING, WEB SERVICES, AND APPLICATION INTEGRATION MARKETS. MS. EUSTIS IS A
GRADUATE OF BARNARD COLLEGE.
WINTERGREEN RESEARCH, INC.
REPORT # SH29821478 494 PAGES 150 TABLES AND FIGURES 2006 $3,200
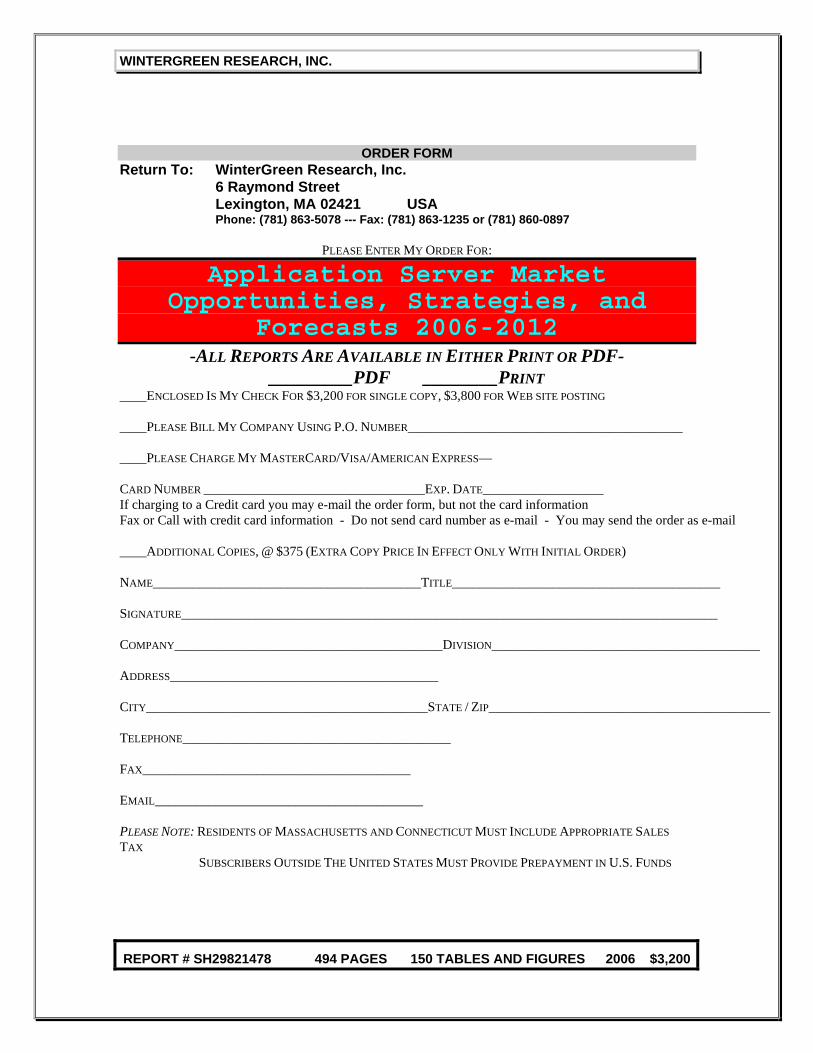
ORDER FORM Return To: WinterGreen Research, Inc.
6 Raymond Street Lexington, MA 02421 USA Phone: (781) 863-5078 --- Fax: (781) 863-1235 or (781) 860-0897
PLEASE ENTER MY ORDER FOR:
Application Server Market Opportunities, Strategies, and
Forecasts 2006-2012 -ALL REPORTS ARE AVAILABLE IN EITHER PRINT OR PDF-
_________PDF ________PRINT ____ENCLOSED IS MY CHECK FOR $3,200 FOR SINGLE COPY, $3,800 FOR WEB SITE POSTING ____PLEASE BILL MY COMPANY USING P.O. NUMBER_________________________________________ ____PLEASE CHARGE MY MASTERCARD/VISA/AMERICAN EXPRESS— CARD NUMBER _________________________________EXP. DATE__________________ If charging to a Credit card you may e-mail the order form, but not the card information Fax or Call with credit card information - Do not send card number as e-mail - You may send the order as e-mail ____ADDITIONAL COPIES, @ $375 (EXTRA COPY PRICE IN EFFECT ONLY WITH INITIAL ORDER) NAME________________________________________TITLE________________________________________ SIGNATURE________________________________________________________________________________ COMPANY________________________________________DIVISION________________________________________ ADDRESS________________________________________ CITY__________________________________________STATE / ZIP__________________________________________ TELEPHONE________________________________________ FAX________________________________________ EMAIL________________________________________ PLEASE NOTE: RESIDENTS OF MASSACHUSETTS AND CONNECTICUT MUST INCLUDE APPROPRIATE SALES TAX
SUBSCRIBERS OUTSIDE THE UNITED STATES MUST PROVIDE PREPAYMENT IN U.S. FUNDS