Application Performance Management with Symantec i...
38
Confidence in a connected world. WHITE PAPER: APPLICATION PERFORMANCE MANAGEMENT Application Performance Management with Symantec i 3 ™ for SAP
Transcript of Application Performance Management with Symantec i...

Confidence in a connected world.
WH
ITE
PA
PE
R: A
PP
LIC
AT
ION
PE
RF
OR
MA
NC
E M
AN
AG
EM
EN
T
Application Performance
Management with Symantec i3™
for SAP

Contents
Executive summary. . . . . . . . . . . . . . . . . . . . . . . . . . . . . . . . . . . . . . . . . . . . . . . . . . . . . . . . . . . . . . . . . . 4
Introduction . . . . . . . . . . . . . . . . . . . . . . . . . . . . . . . . . . . . . . . . . . . . . . . . . . . . . . . . . . . . . . . . . . . . . . . . 6
Typical environment . . . . . . . . . . . . . . . . . . . . . . . . . . . . . . . . . . . . . . . . . . . . . . . . . . . . . . . . . . . . . . . . . 6
Challenges of managing the environment . . . . . . . . . . . . . . . . . . . . . . . . . . . . . . . . . . . . . . . . . . . . . . 8
The Symantec i3 for SAP methodology . . . . . . . . . . . . . . . . . . . . . . . . . . . . . . . . . . . . . . . . . . . . . . . . 11
Symantec i3 for SAP solution set . . . . . . . . . . . . . . . . . . . . . . . . . . . . . . . . . . . . . . . . . . . . . . . . . . . . . 12
The Web browser component . . . . . . . . . . . . . . . . . . . . . . . . . . . . . . . . . . . . . . . . . . . . . . . . . . . . . . . . . 15
The network component . . . . . . . . . . . . . . . . . . . . . . . . . . . . . . . . . . . . . . . . . . . . . . . . . . . . . . . . . . . . . 15
The Enterprise Portal Web component . . . . . . . . . . . . . . . . . . . . . . . . . . . . . . . . . . . . . . . . . . . . . . . . . 16
The Web AS Java component . . . . . . . . . . . . . . . . . . . . . . . . . . . . . . . . . . . . . . . . . . . . . . . . . . . . . . . . . 16
The Web AS ABAP component . . . . . . . . . . . . . . . . . . . . . . . . . . . . . . . . . . . . . . . . . . . . . . . . . . . . . . . . 17
The database component . . . . . . . . . . . . . . . . . . . . . . . . . . . . . . . . . . . . . . . . . . . . . . . . . . . . . . . . . . . . 17
The storage devices component . . . . . . . . . . . . . . . . . . . . . . . . . . . . . . . . . . . . . . . . . . . . . . . . . . . . . . . 18
White Paper: Application Performance Management
Application Performance Management
Symantec i3™ for SAP

Contents (cont’d)
Symantec i3 for SAP features . . . . . . . . . . . . . . . . . . . . . . . . . . . . . . . . . . . . . . . . . . . . . . . . . . . . . . . . 18
Proactive management through exceptions . . . . . . . . . . . . . . . . . . . . . . . . . . . . . . . . . . . . . . . . . . . . . 19
End-user experience and SLAs . . . . . . . . . . . . . . . . . . . . . . . . . . . . . . . . . . . . . . . . . . . . . . . . . . . . . . . . 21
Correlated end-to-end view. . . . . . . . . . . . . . . . . . . . . . . . . . . . . . . . . . . . . . . . . . . . . . . . . . . . . . . . . . . 21
Understanding and correlating SAP Web AS activity . . . . . . . . . . . . . . . . . . . . . . . . . . . . . . . . . . . . . . 23
Investigating the SAP ABAP application tier . . . . . . . . . . . . . . . . . . . . . . . . . . . . . . . . . . . . . . . . . . . . . 24
Investigating the SAP database tier . . . . . . . . . . . . . . . . . . . . . . . . . . . . . . . . . . . . . . . . . . . . . . . . . . . . 27
Long-term analysis. . . . . . . . . . . . . . . . . . . . . . . . . . . . . . . . . . . . . . . . . . . . . . . . . . . . . . . . . . . . . . . . . . 29
An SAP operations dashboard . . . . . . . . . . . . . . . . . . . . . . . . . . . . . . . . . . . . . . . . . . . . . . . . . . . . . . . . 30
Putting it all together—a typical scenario . . . . . . . . . . . . . . . . . . . . . . . . . . . . . . . . . . . . . . . . . . . . . 31
Benefits of Symantec i3 for SAP . . . . . . . . . . . . . . . . . . . . . . . . . . . . . . . . . . . . . . . . . . . . . . . . . . . . . . 35
Summary . . . . . . . . . . . . . . . . . . . . . . . . . . . . . . . . . . . . . . . . . . . . . . . . . . . . . . . . . . . . . . . . . . . . . . . . . 36

White Paper: Application Performance Management with Symantec i3™ for SAP
4
Executive summary
The introduction of SAP NetWeaver has fundamentally changed architecture and use of SAP
environments. NetWeaver allows interconnection of multiple SAP applications in order to manage
complex business processes. As an example, mySAP ERP 6.0 and mySAP SCM 2005 can be set
up to communicate and jointly drive the supply-chain processes of a car manufacturer. The
advent of SAP Enterprise Portal has also revolutionized the way end users connect to and work
with SAP systems. SAP end users now connect with their Web browser to Enterprise Portal first
and find a customized environment that is designed to support the user’s individual role in the
business process. Once logged in, users have access to backend SAP applications. However,
many SAP customers still rely on the SAP graphic user interface (GUI). There is no doubt that
the SAP world is becoming increasingly complex, interconnected, and based on Java™ and
other Internet technologies. The number of different SAP architectures und usage patterns
found in the industry is also rising. Management of these environments is more challenging
due to the number of technologies and application tiers involved (e.g., both ABAP and Java on
the application server side), multiple points of failure, and a greater number of components to
manage. The major challenge facing SAP Basis administrators today is defining a systematic
process for understanding application behavior, usage patterns, service levels, and alerts. The
new SAP technologies demand more knowledge, understanding, and responsiveness than the less
complex, traditional ones in order to adhere to service-level commitments and maintain end-user
productivity. On the other hand, maintaining 24x7 availability and the best possible end-user
response time is imperative given the increasing pace of business and the critical nature of SAP
systems in enterprises. Experienced SAP personnel recognize the need to include best practices
for application performance management throughout the entire application lifecycle.
The introduction of new technology from SAP and the ensuing complex architecture can
impose new challenges on organizations that wish to upgrade to these newer versions. Should
such an upgrade happen, the organization may expect it to require an outlay of as much as 50%
of their initial SAP investment—in terms of both cost and time. One primary challenge of such an
upgrade is to be able to forecast and plan the infrastructure capacity necessary to track the usage
patterns and performance of the old version, and to be able to compare the loads, usage, and
performance of the new implementation with the old one, already adopted by the enterprise.

5
White Paper: Application Performance Management with Symantec i3™ for SAP
Symantec i3™ for SAP helps to address those challenges by providing industry-leading
functionality:
• Permanent collection of high-quality metrics from each SAP application tier
• Support for Java- and ABAP-based SAP applications
• Long-term data storage in a central database called the Performance Warehouse
• Service and response time from an end-user perspective (SAP Enterprise Portal and SAP GUI)
• Response-time breakdown by application tier
• Performance and availability analysis by SAP entity: applications, transactions, clients,
workload types, users, application servers, database servers, organizations, and locations
• Availability- and response time–based SLAs
• Historical baselines representing “normal” SAP load and response time as seen in the past
• Performance trend analysis to support landscape capacity planning and to take corrective
action before an issue can affect production
• Comprehensive reports on availability, response times, and other SAP key performance
indicators
• End-to-end data correlation capabilities, allowing SAP activities to be tracked through the
applications tiers in order to quickly pinpoint the root cause of a performance issue
Symantec i3 fulfills today’s needs to guarantee the performance of business-critical SAP
applications and helps to optimize return on investment (ROI) and total cost of ownership (TCO)
by maximizing utilization of existing hardware and deferring hardware investments. It is certified
by SAP to help ensure proper SAP integration and compliance with all standards.

White Paper: Application Performance Management with Symantec i3™ for SAP
6
Introduction
The introduction of SAP NetWeaver has enabled companies to build complex SAP landscapes
consisting of a number of interconnected SAP and third-party systems that, together, drive
sophisticated business processes. SAP Enterprise Portal has revolutionized the way end users
access those SAP landscapes. Everybody can connect from anywhere, using a Web browser. For
the end user, NetWeaver means more flexibility, functionality, and convenience—but for SAP
Basis administration teams, it means more responsibility and complexity. In such environments,
Application Performance Management is a vital necessity in order to achieve optimal SAP
availability and end-user response time as well as SLA compliance.
Many problems can occur in a complex environment—whether in the network, the Web
components, the SAP application servers, the database, or the storage devices. To make the
situation worse, problems tend to be inconsistent (i.e., they can appear and disappear) or to occur
only when a certain load is reached. Managing these environments is a challenging task.
It is crucial to run 24x7 health checks for notification of potential problems before end
users are affected. It is important to understand the application behavior and the usage of the
organization from a performance point of view to verify that business objectives are met, find
where bottlenecks are, and determine the required next step to fix them.
Sometimes, companies rush to finish the SAP implementation phase—which includes
customizations and changes—and pay less attention to performance issues, scalability, and load.
Once the system has gone “live” and performance problems have begun, it is very expensive to
fix them. Symantec has developed an application performance management solution for SAP—
Symantec i3 for SAP—that monitors the entire SAP application landscape, including Web AS 7.00
and mySAP ERP 6.0.
Typical environment
SAP R/3 customers typically run on traditional ABAP 3-tier architecture consisting of a smaller
number of production systems (together with development and test systems) with several ABAP
application servers, a dedicated database instance and SAP GUI clients. However, the introduction
of SAP NetWeaver and the new generation of mySAP Business Suite applications has led to more
complex customer implementations, including more application tiers, more SAP applications, and
more interconnections.

7
White Paper: Application Performance Management with Symantec i3™ for SAP
The example below shows a typical SAP system landscape, which is based on NetWeaver
7.0 and mySAP ERP 6.0. There are two machines in this environment. One of them is running an
SAP Enterprise Portal (EP) and other components requiring SAP Web AS Java application server
infrastructure. The other machine functions as the back end and runs a mix of ABAP and Java
components, namely ECC (Enterprise Central Component, the core of ERP 6.0), several add-ons
for mySAP ERP, and Business Intelligence (BI). From an infrastructure perspective, running these
components on one host requires a Web AS “Add-In” application server installation, consisting
of both ABAP and Java execution stacks. For simplicity, no additional application servers for EP
and ERP are included in the figure, but they exist in almost every customer environment. Also,
depending on load and scalability requirements, BI could run on a separate machine. Each SAP
system (ERP and EP) has its private database instance. SAP end users typically connect via Web
browser to Enterprise Portal, which provides a role-based environment for each user group and
connects the end users to the back-end system. However, there are still many “traditional” SAP
environments where end users use the SAP GUI to access ABAP-based SAP systems such as R/3.
Figure 1. Typical SAP environment with NetWeaver 7.0 and mySAP ERP 6.0

White Paper: Application Performance Management with Symantec i3™ for SAP
8
Challenges of managing the environment
The management of SAP, spread across multiple tiers and multiple interconnected applications,
makes it extremely difficult to pinpoint the source of a performance problem. There are significant
challenges to managing these environments, including:
• Defining, measuring, and committing to organizational business objectives and SLAs, as
associated with the real organization users, working from multiple geographic locations
• Finding the SAP users, transactions, application modules, programs, functions, and screens
that impact the performance and those that are most easily influenced by performance
degradation
• Defining baselines of normal and abnormal application and usage behavior
• A comprehensive, yet straightforward, way to measure the user’s experience
• Identifying problem patterns and characteristics before the user is affected proactively, through
alerts, while maintaining satisfactory service levels
• Maintaining historical data for trending, exception, and capacity planning analysis
• 24x7, real-time, low-overhead collection and correlation of performance metrics across the SAP
infrastructure
• Correlating SAP application metrics such as user-activated URLs, invoked transactions, and
database SQL statements across the whole SAP infrastructure
• The ability to break down response times by tier and application component to determine the
amount of time spent in each component
• Determining the time spent in Java vs. ABAP vs. SQL statement processing
• Presenting one integrated, correlated view of all SAP infrastructure components, from the Web
user through the network, SAP Web Application Server, database, and storage devices
• Ability to focus on application server bottlenecks, such as waits while work processes complete,
memory issues, inefficient database access, high CPU utilization, etc.

9
White Paper: Application Performance Management with Symantec i3™ for SAP
• Tracking the performance of local and remote geographical locations
• Coping with unpredictable load periods and handling massive transaction and data volumes
• Aiding SAP Basis administrators in analyzing performance issues and suggest remedies
These challenges are not covered by system management frameworks or by traditional
management tools—which only provide uncorrelated snapshots from various servers within the
SAP application infrastructure.
System management frameworks focus on system parameters, availability, and utilization.
Their primary focus is monitoring the system and the system elements’ health. Frameworks are
well suited for detecting system- and network-level issues, such as servers and applications with
high utilization, high packet rates, and numerous retries. Unfortunately, frameworks don’t focus
on the end-user experience, transactions, and usage—so, when all the system parameters look
acceptable, how can you tell why location X suffers from poor response time, or why certain SAP
URLs are slow?
The “stovepipe approach,” which takes isolated snapshots from various servers, does not
resolve the problem either. Snapshots provide very coarse information consisting of generic
statistics taken from each tier separately. For example, you can look at Java components, SAP
application servers, or Oracle® metrics and still not understand which component is causing a
bottleneck. By following the real end-user transaction across the SAP tiers, snapshots can tell you
that the average Java object, SAP transaction, and SQL response time are acceptable, but they
cannot tell which SQL statements belong to which transactions and, therefore, cannot help much
in isolating the problem.
Traditional SAP tools are limited in their ability to meet the performance management
challenges of today’s business. Because these tools have adopted a “stovepipe approach,” they
have a limited ability to correlate performance between the different infrastructure components.
The additional technologies (e.g., Web, Java) that are deployed in the latest release will only
compound the problems for these traditional methods. “Stovepipe” solutions force technical
experts to spend an excessive amount of time correlating multiple metrics to pinpoint the root
cause of performance degradation. Even as traditional tools link various GUIs to create loosely
integrated “suites,” it is still not enough to solve the problem.

White Paper: Application Performance Management with Symantec i3™ for SAP
10
Compounding this issue, many of the data collectors deployed sample too infrequently
(e.g., once every five to ten minutes), and as a result they rarely gather enough information to
perform meaningful analysis. Performance problems are the toughest and most costly to pinpoint
and resolve. This is particularly true if the tools used do not collect enough of the necessary
information.
Metrics for end-to-end application analysis must be captured with agents that have
application knowledge and visibility and those that reflect the user experience. Real-time
performance metrics should be collected 24x7, with extreme efficiency and low overhead,
and correlated across the SAP infrastructure path to enable problem isolation and root cause
identification. Additionally, historic information must be kept for long-term analysis, exceptions,
baselines, trends, and capacity planning. Using historic data, we can calculate typical SAP
behavior—for example, there may be peaks each Monday morning for some transactions.
Knowledge of typical behavior facilitates generating exceptions for abnormal behavior and
setting the right service-level agreement (SLA) thresholds. This information also helps calculate
database table growth—allowing us to allocate enough space in advance of a slowdown or create
appropriate indexes to reduce the fetch times.
In short, typical infrastructure frameworks provide important system and network
management bottoms-up detail, but do not look at necessary end-user and transaction activity.
Traditional tools look at each tier separately—providing generic statistics for that tier—but do not
perform any correlation between tiers. These approaches lack the power to find, isolate, and focus
on the root cause of the problem or help to identify the real user response-time experience.
Symantec i3 for SAP fills this gap by providing the actual user experience and application
end-to-end response-time contribution detail. This enables SAP administrators to “see” how their
applications are performing from the perspective of their users, and to correlate that experience
with the underlying application components in terms of end-to-end performance.

11
White Paper: Application Performance Management with Symantec i3™ for SAP
The Symantec i3 for SAP methodology
It is vital for all organizations to understand the importance of a systematic approach to coping
with performance problems, and to realize the inherent ineffectiveness of ad-hoc problem solving.
The foundation of the Symantec i3 for SAP solution is a proven methodology designed to facilitate
the rapid detection, isolation, analysis, correction, and verification of application performance
problems. All organizations can benefit from the discipline that Symantec i3 for SAP brings to
the application performance management process. The Symantec application performance
management methodology comprises five stages:
• Detect—Proactively identify the symptoms that could indicate a performance problem
• Find—Identify the problematic tier and application component
• Focus—Discover the root cause of the problem
• Improve—Take the steps required to improve performance
• Verify—Make sure the steps taken have achieved the desired goal
These stages combine to form a process that takes a systematic approach to finding and
resolving all kinds of performance issues—both predictable and unforeseen.
For example, the methodology begins with an automated proactive detection (Detect)
through baselines and SLAs, using the product’s alert capabilities. Alerts can be directed to the
appropriate infrastructure framework, organization, or person based on what was detected.
Depending on the issue detected, the SAP Basis administrator can view the application, end-
to-end, and isolate (Find) the problematic tier and application component that are the source of
the degradation. Problems could be caused by network delays, long-running servlets, RFC calls,
long-running transactions on an ABAP application server, or long database access times. The
process of finding the problematic component is end-user focused, so that we actually follow the
end-user transaction from the time it was activated by the user.

White Paper: Application Performance Management with Symantec i3™ for SAP
12
After the problematic component is found, an in-depth analysis of that component is done
in order to focus on the root-cause of the problem (Focus). For example, after finding out that a
particular ABAP application server is the problematic component, we would like to identify the
top users and transactions, and determine whether the problem is due to a long queue wait time
for a work process or application processing time, or to a long database call. As another example,
in the case of Java issues, we would look at the different methods that are called and understand
whether the issue is due to a specific method or an expensive JDBC call.
After focusing on the problem’s root cause comes the actual fixing of the problem (Improve).
For example, allocating additional work processes fixes a long queue time waiting for a work
process to complete; adding an index to a database table fixes a long-running SQL statement
problem.
Once the fix has been applied, it is vital to confirm that the problem is indeed fixed and
that it will not reappear (Verify). Utilizing long-term information kept in the Symantec i3 for SAP
Performance Warehouse, we can compare service times before and after the fix was applied.
Doing this shows whether or not we fixed the problem and if service times are as expected.
Symantec i3 for SAP solution set
Symantec i3 for SAP focuses on providing your organization with the ability to completely manage
your application performance end to end—including the browser, the Portal, SAP Web AS (which
includes J2EE and ABAP execution stacks), database, and even the physical storage. Conceptually,
Symantec i3 for SAP is composed of Insight, Indepth, and Inform functionality. Figure 2 following
depicts the architectural components.

13
White Paper: Application Performance Management with Symantec i3™ for SAP
Symantec Insight provides the agents and logic required to enable your IT organization to
see the end-to-end response time contributions across the client, network, application server,
and database server and to isolate those components that are responsible for slowdowns. The
process starts by measuring the actual end-user response time at the application, transaction, or
Web-page level. Then, upon detection of a response-time objective (RTO) or baseline breach, the
problematic tier and component are found, as described earlier in the methodology section.
Symantec Indepth™ provides in-depth drill-downs to identify the root cause of problems.
It collects and correlates detailed component information (e.g., application server utilization
and workload, top-heavy transactions, J2EE specific information, methods, Oracle resource
consumption breakdown, slowest SQL statements, etc.).
Figure 2. Architectural components of Symantec i3 for SAP

White Paper: Application Performance Management with Symantec i3™ for SAP
14
Symantec Inform provides the real-time alerts that are driven by the baselines and
thresholds defined. Symantec Inform also includes the reporting components of Symantec i3 for
SAP. This rich report capability enables the presentation of ad hoc and scheduled reports. These
reports are useful for service levels, trends, and exceptions.
Symantec i3 for SAP includes the Symantec Performance Warehouse, which provides the
common repository for long-term history, collected by the different Symantec agents along the
SAP application path. The collected history facilitates trend analysis, long-term capacity planning,
baseline calculations using historical data, and correlated reports over time. Symantec i3 for
SAP includes all necessary functionality to see the actual user’s response time and analyze the
correlated contributors from end to end. These include:
• The actual service delivered to any SAP user over any given time period
• Discovery and monitoring of all SAP users and the performance of their transactions
• Enterprise Portal URLs
• Java method invocations, response times, and throughput
• SQL statements activated by specific SAP transactions
• Database resource consumption breakdown and linking of logical database access to physical
storage
• SAP ABAP application server metrics such as CPU usage, load average, page faults, connected
users, and active users
The remainder of this section provides more detail on the functionality and data entities
collected from each tier and component across the SAP application infrastructure.

15
White Paper: Application Performance Management with Symantec i3™ for SAP
The Web browser component
The best way to measure service-level objectives (SLOs) is from the end-user point of view, at
the browser level, measuring real SAP activity response times. Symantec has developed a unique
technology that sends a tiny piece of code that is attached to each Web page and monitors the
end-user performance from the end-user browser—collecting performance metrics 24x7 from
all users. No installation is required at the end-user desktop. Main data entities collected by this
component include:
• Response time—the time from first byte through rendering time
• SLOs—both warning and critical
Other data entities are collected as well, including connection type (LAN vs. dial-up), protocol type
(HTTP vs. HTTPS), http method, and browser type.
The network component
Symantec i3 for SAP monitors the network response times for SAP clients at multiple geographical
locations. This enables problem detection of remote users and sites as well as differentiation
between front-end network time and back-end time. (Back-end time refers to the components
from the portal server to the database.) Main data entities collected by this component include:
• Client IP network addresses
• Request service times
• Front-end network time vs. back-end time differentiation
• Number of requests and throughput
• Number of bytes sent/received
• Response time to remote geographical locations

White Paper: Application Performance Management with Symantec i3™ for SAP
16
The Enterprise Portal Web component
Symantec i3 for SAP measures URL response times at the Enterprise Portal Web server tier. It is
important to understand which URLs are the heaviest from a response-time perspective, as well as
the top URLs from a resource-consumption perspective. Starting from SAP Web AS 6.20, the Web
server component comes as part of the Web AS. Main data entities collected by this component
include:
• URL service times (time to retrieve a specific URL by the Web server and the back-end system)
• Web server machines and Web server instances
• Domains
• URL file types
• Client IP address that requested the URL
• Response time to remote geographical locations
The Web AS Java component
SAP runs various J2EE components in Web AS Java application servers. It is important to analyze
that activity to find potential slowdowns. The main data entities that Symantec i3 for SAP collects
from this component include:
• Java Virtual Machine (JVM) health data
• Top HTTP service requests
• Servlet response time and throughput
• Drill-down and correlation of called methods
• JDBC request response-time and SQL statements in case of direct database access
• CPU time, JVM memory, and garbage collection information as well as Java Management
Extensions (JMX) metrics
17
White Paper: Application Performance Management with Symantec i3™ for SAP
The Web AS ABAP component
The Web AS ABAP application server, where SAP transactions are executed, plays a key role
in the SAP architecture. A transaction being executed can have several potential performance
problems at the application server tier, starting from waiting for the dispatcher and work process,
continuing with internal enqueue waits, and ending with long database access times. It is
important to monitor the system continuously for performance degradations. Main data entities
collected by this component include:
• SAP users and transactions
• Work types—dialogs and batch
• Transaction processing times, wait times, and database access times
• ABAP application modules
• ABAP programs and functions
It is possible to view the information and performance by several different categories, such as
SAP systems, organizational business units, locations, and application servers.
The database component
SAP Web AS (ABAP and Java) uses the database to access required business information. An
untuned database could cause many performance problems. It is important to monitor the
database continuously and collect the right performance metrics. It is equally important to
analyze the database access and see if we can improve its performance. Main data entities
collected by this component include:
• Database resource consumption breakdown (CPU, I/O, buffer waits, etc)
• Database users, programs, and objects
• Executed SQL statements
• Database objects, internal locks, and events as accessed by ABAP/SQL statements, as well as
their performance
• SAP users and transactions issuing the SQL requests

White Paper: Application Performance Management with Symantec i3™ for SAP
18
It is important to emphasize the link between problematic SQL statements and their initiating
SAP users and transactions. This enables us to map SAP users and transactions to resource-
consuming SQL activities at the database level, which can dramatically accelerate root cause
analysis.
The storage devices component
One of the primary reasons for performance issues has always been inefficient physical device
access. Problems could be of several types—for example, poor balance of files on devices and
contention between files on the same device, among others. It is beneficial to be able to map
logical database objects access to physical devices in order to understand I/O device access
problems. Mapping logical Oracle I/O requests to physical storage devices becomes more crucial
in RAID-based architectures where a file can spread over multiple physical devices, using
striping techniques. Symantec has developed mapping to EMC Symmetrix® and CLARiiON®,
IBM® TotalStorage, HP® StorageWorks XP, and Hitachi Data Systems Lightning, Thunder, and
TagmaStore® Universal Storage Platform systems.
Symantec i3 for SAP features
The StartPoint screen enables a full end-to-end view of all applications tiers in the SAP
environment. StartPoint provides an alert overview of the various components by category, in a
simplified way so as to facilitate communication by team members—for example, performance or
load alerts at the database. The next step is to launch one of the Symantec i3 for SAP components
(Insight, Indepth, or Inform).
A typical scenario could start with a user launching Symantec Indepth for SAP to get an
overall view of the SAP environment—or receiving a proactive alert indicating that a service-
level threshold has been exceeded. Long-term trend analysis and information on top resource
consumers could easily be obtained through reports using long-term metrics stored in the
Performance Warehouse.

19
White Paper: Application Performance Management with Symantec i3™ for SAP
Proactive management through exceptions
Managing a large SAP application infrastructure with hundreds or thousands of users is difficult,
to say the least. The only way to do so effectively is to work proactively rather than reactively.
Symantec i3 for SAP provides the way to do this through the use of exceptions, based on
automatically computed SLAs and baselines. When an exception is detected by Symantec i3 for
SAP, the user is alerted about the normative deviation. In addition, Symantec i3 for SAP provides
capacity trending that will alert the user should future unforeseen loads and performance issues
impact the overall SLA and performance. The graphics below show an alert generated on a SAP
transaction code that has breached the SLA.
Figure 3. Symantec i3 for SAP StartPoint screen

White Paper: Application Performance Management with Symantec i3™ for SAP
20
Figure 4. Inform/Alerts showing SAP alerts
Figure 5. Alert detail indicating an end-user performance issue

21
White Paper: Application Performance Management with Symantec i3™ for SAP
End-user experience and SLAs
End-user satisfaction is extremely important: If end users are satisfied, application managers are
satisfied. Symantec i3 for SAP provides a way to measure response times as experienced by end
users and to define SLA thresholds on those metrics.
Correlated end-to-end view
Launching Symantec Insight provides an end-to-end overview of the different tiers and
components. This view is correlated across components, which means you can view, for example,
the J2EE components invoked by a specific URL or the SQL statements executed by a specific user
or transaction. The graphic below shows an example of an Insight overview screen for a multi-tier
SAP environment.
Figure 6. Inspection of users of slow transaction VA01

White Paper: Application Performance Management with Symantec i3™ for SAP
22
On the upper left-hand side of figure 7, Service Time Comparison, we see the different tiers for
Web, J2EE, ABAP, and Oracle. In this example we can identify the Web tier as the main contributor
to response time impact (bars in this chart are cumulative). Just below that, we can see the SAP
application App Tiers Data Flow, from the Portal server to the database. The center part of the
screen displays the main data entities for the selected component: URLs for the Portal server,
J2EE objects for Java-based application servers, transactions running in the application server
for ABAP application servers, SQL statements for Oracle or MS SQL database. In this case, the
main screen is showing the various transactions, users, and work types—dialogs, updates, and
application servers. The information is broken out by network time, queue time, work time, and
database time. This provides an overview of what is going on in the SAP application servers.
Figure 7. Example overview screen

23
White Paper: Application Performance Management with Symantec i3™ for SAP
Understanding and correlating SAP Web AS activity
Symantec Insight provides us with an end-to-end view as well as segmentation of activity across
tiers. Moreover, we can get high-level details on a tier we would like to focus on. To explore more
on information on J2EE activity within the SAP Web AS, let’s choose J2EE on the top menu.
Performance metrics for the SAP Web AS and JVM are displayed.
We can view the different invocation methods. In the screen above we see one method called
com.sapmarket. We can also see, on the left side of the screen, details regarding the JVM and its
scalability—i.e., how SAP Web AS is able to cope with increased load.
Figure 8. Example screen: drilling down into J2EE

White Paper: Application Performance Management with Symantec i3™ for SAP
24
More detailed information can be obtained by drilling down into the J2EE stack. Drilling down
shows the different URLs invoked, correlating these with executed servlets and methods invoked.
By instrumenting the right J2EE classes, we can continue to drill down and view the different
methods invoked.
Investigating the SAP ABAP application tier
To get more detailed information on the SAP ABAP application tier, we can launch the Symantec
Indepth for SAP component. This component provides details on the SAP application server
load, availability, and response times, broken by systems, locations, organization units, users,
transactions, SAP application modules (e.g., SD, FI, etc.), program names, screen numbers, and
more. The next screens present such examples.
Figure 9. Example: application server inspection of system FICO-PRD

25
White Paper: Application Performance Management with Symantec i3™ for SAP
For each transaction, we can view its network, application, and database times as well as its
response time vs. a predefined SLA.
Figure 10. Example: details on worst-performing transactions executed for a specific production environment

White Paper: Application Performance Management with Symantec i3™ for SAP
26
Figure 11. Example: the top worst-performing batch jobs sorted by total duration
Figure 12. Detail view of a selected batch job with its parameters

27
White Paper: Application Performance Management with Symantec i3™ for SAP
Information on additional application server resources, as well as recommended values for
important metrics, can be obtained in a similar way.
Investigating the SAP database tier
At the database level, detailed resource consumption breakdowns, SQL statements, users, and
programs are provided. Moreover, a unique integration between Sybase Indepth for SAP and
Sybase Indepth for Oracle allows for direct correlation of the SAP workload from a high-level
SLA view all the way down to a SQL statement that was executed in the database and even
into the underlying storage where the data file exists. This gives us an understanding of which
organization or location is responsible for the poor response time. Figure 13 shows a detailed
resource consumption view of an SQL statement generated by a SAP ABAP application server.
Figure 13. Unique SQL statement generated by a transaction; in this case, the statement shows a long Oracle CPU time

White Paper: Application Performance Management with Symantec i3™ for SAP
28
We can now review the execution plan and its history of the problematic SQL statement.
In this case we see that the time spent in Oracle for this SAP transaction increased after the
execution plan changed.
Symantec i3 for SAP also provides a complete database analysis technology that includes
“what-if” simulation, SmarTune recommendations, and an index-tuning advisor that helps with
index creation as well as simulation of the index’s impact before the index is actually created.
Figure 14. Execution plan and history of a SQL statement
29
White Paper: Application Performance Management with Symantec i3™ for SAP
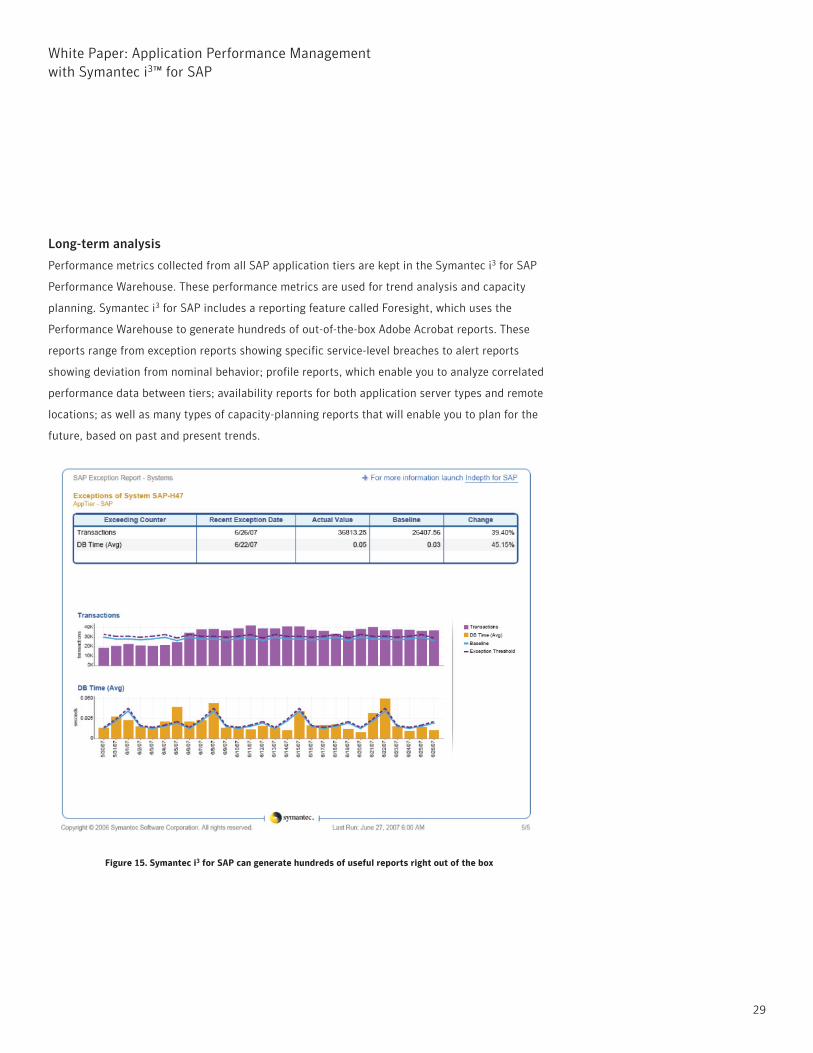
Long-term analysis
Performance metrics collected from all SAP application tiers are kept in the Symantec i3 for SAP
Performance Warehouse. These performance metrics are used for trend analysis and capacity
planning. Symantec i3 for SAP includes a reporting feature called Foresight, which uses the
Performance Warehouse to generate hundreds of out-of-the-box Adobe Acrobat reports. These
reports range from exception reports showing specific service-level breaches to alert reports
showing deviation from nominal behavior; profile reports, which enable you to analyze correlated
performance data between tiers; availability reports for both application server types and remote
locations; as well as many types of capacity-planning reports that will enable you to plan for the
future, based on past and present trends.
Figure 15. Symantec i3 for SAP can generate hundreds of useful reports right out of the box

White Paper: Application Performance Management with Symantec i3™ for SAP
30
For example, the screen in figure 15 depicts an exception report that details the number of
transactions and database time, over time, and shows how these metrics deviate from baselines.
Baselines capture “normal” application behavior, as seen in the past. Using baselines, it is easy
to differentiate short-term performance spikes for real issues and to identify performance/usage
trends. By using exception thresholds, one can configure the level of deviation from baselines,
causing exceptions to be generated.
An SAP operations dashboard
The Application Service Dashboard (ASD) is a new way to access Symantec i3 for SAP through a
portal-based GUI infrastructure. It relies on open standards and provides a highly customizable
dashboard. It aggregates data from multiple sources (e.g., database, storage, and application
server tools) across the Symantec i3 for SAP product suite to deliver next-generation performance-
management capabilities on a single console. ASD comes with a set of predefined SAP portlets,
which can be utilized to configure customized and personalized SAP landscape views, meeting
the requirements of the different roles involved in SAP management and operations, such as
monitoring and Basis or database administration. Working that way, all people can see what they
need to see in the way they want to see it. Figure 16 shows an example of a SAP ASD view.
Figure 16. Symantec ASD showing a top-level summary of SAP environments, transactions, and SLA compliance

31
White Paper: Application Performance Management with Symantec i3™ for SAP
Putting it all together—a typical scenario
Now that we are familiar with Symantec i3 for SAP, let’s look at a typical scenario, including the
components SAP NetWeaver 7.0, SAP ERP 6.0, and Oracle. Our scenario starts with a call into
the help desk. A SAP user from the sales department is complaining about slow response time as
sales orders are entered into the ERP 6.0 system. The user mentions that, normally, the response
time is excellent and that it seems to have gotten worse “in the last few days.” Unfortunately, the
user has no quantitative definition of what “worse” is, so normally our help-desk staff would have
no idea whether this user’s subjective judgment about response time is better or worse than the
company’s established service-level standards. It should be noted that without a solution such as
Symantec i3 for SAP in place, the help desk’s only recourse is to open a ticket and assign it to the
SAP Basis team. In this case, however, our help desk can first refer to a Foresight exception report
(figure 17), which shows that this user has an established baseline dialog response time of 0.45
seconds, but that in the last few days it has jumped to over 9 seconds—an increase of more than
2000%.
Figure 17. Foresight “exception” report for a top SAP user

White Paper: Application Performance Management with Symantec i3™ for SAP
32
At this point, having gone through one level of triage, the help desk opens a trouble ticket
and forwards it to the Basis team—which, upon receiving the trouble ticket, views the user’s
exception report and uses Symantec i3 for SAP’s in-context launch capability (the link in the upper
right-hand corner of the exception report) to automatically start Symantec Indepth for SAP and go
directly to the time period and transaction in question, so they can zero in on the problem.
It is important to note that, in this scenario, had the user’s response time been within the
service-level threshold, the help desk could have resolved the issue without opening a ticket.
Looking more closely at the previous screen, we can see that this user has a high transaction
load and recently has been spending a larger amount of time waiting for the database to respond
to requests. Symantec Indepth for SAP also tells us this particular user predominantly executed
transaction VA01.
Figure 18. High dialog response time for a specific transaction

33
White Paper: Application Performance Management with Symantec i3™ for SAP
Now that we know that the user’s response time increase is due to a poorly performing
transaction VA01 in the database, we can begin exploring the problem in the database tier. Once
again, with the integration available in Symantec i3 for SAP, we can launch Symantec Indepth for
Oracle (or Indepth for SQL) carrying the context of our current investigation into the database tier.
Figure 20. Using Symantec Indepth for Oracle to examine the SQL statements of the SAP transaction and its history
Figure 19. Graph showing a recent increase in database response time

White Paper: Application Performance Management with Symantec i3™ for SAP
34
The previous screen reveals that the SQL statement associated with the poorly performing
transaction has a very high I/O wait time. We can drill down further to the spindle level to
investigate why exactly the I/O contention is taking place, or how other storage-related problems
might be contributing to the problem.
To summarize, Symantec i3 for SAP began from a static high-level user report that indicated
extremely high end-user response time. We launched our investigation in context through the SAP
NetWeaver architecture, including both the application server tier and Oracle. We found that the
user’s primary workload over the last ten days included transaction that performed very poorly
in the last two of those days, and further, that the transaction’s poor response time was directly
attributable to poor database response time. The database problem was then narrowed down to
high database I/O wait times.
Figure 21. Symantec i3 for SAP using Symantec Indepth for Oracle to investigate the SQL statement

35
White Paper: Application Performance Management with Symantec i3™ for SAP
In order to investigate the above problems, we had to have the knowledge of correlating SAP
applications, all the way from the SAP GUI to the database and even the storage array. We also
had to be able to correlate SAP transactions with invoked SQL statements. Having this information
is fundamental for segmenting a response-time problem across the various SAP tiers.
Benefits of Symantec i3 for SAP
From a business perspective, using Symantec i3 for SAP can help organizations significantly
reduce performance slowdowns, defer hardware investments, and, therefore, achieve rapid ROI
while maintaining low TCO. Symantec i3 for SAP significantly helps organizations to:
• Understand who is using SAP, which applications and transactions they are using, and when
and where they are using them
• Proactively detect potential problems before they can negatively impact end users
• Improve end-user satisfaction with the application
• Increase ROI
• Detect, find, and solve problems more quickly
• Defer hardware investments by fully leveraging existing hardware
• Reduce TCO—both by significantly reducing the amount of staff, time, and effort involved in
the problem management process; and by allowing less experienced staff to participate in that
process without negatively affecting the quick isolation and resolution of problems
• Verify adherence to business-level objectives
• Conduct organizational health checks through baselines and service-level exceptions
• Effectively communicate the service-level achievements and improvements to the organization
• Eliminate “blamestorming” between IT organizations
• Manage and tune the application to utilize system resources more effectively

White Paper: Application Performance Management with Symantec i3™ for SAP
36
• Use just-in-time capacity, deferring equipment and associated software licenses and support
costs until they are actually needed
• Better understand future capacity requirements, based on current SAP usage and growth
patterns
In summary, Symantec i3 for SAP is an excellent vehicle for measuring and improving
performance objectives, and it provides the necessary mechanisms to realize significant savings in
cost and effort while effectively managing application performance.
Summary
SAP has become an essential part of many organizations—and this trend continues to grow
with the introduction of NetWeaver, incorporating new technologies such as Enterprise Portal
for end-user access and the Web AS Java architecture. While this is a great advance for end-
users—improving business efficiency, productivity, and satisfaction—it poses great challenges for
SAP administrators and others who are responsible for the smooth management of these complex
applications. More than ever before, managing SAP performance is a challenge.
In this environment, delivering the right levels of service has become very challenging as well.
Managing the new SAP architecture is fundamentally more difficult due to the inherent complexity
introduced by its multiple tiers, its mixture of new and legacy technologies in the path, and its
database calls and storage access.
Experience has shown a direct correlation between an organization’s provided service levels
and its productivity (internal) and revenue generation (external). There is also a direct correlation
between targeted service levels and the expense incurred to achieve those service levels. The
penalty for not meeting the users’ performance expectations may mean a loss of user productivity,
loss of revenue, and the failure to realize an ROI on the system investment.
Symantec i3 for SAP offers a unique solution to these challenges. It addresses the
complexities of managing SAP performance, and it actually simplifies the deployment and ongoing
maintenance of SAP systems. Using Symantec i3 for SAP helps companies manage service levels,
contain costs, and maximize the effectiveness of their operational investments.
37
White Paper: Application Performance Management with Symantec i3™ for SAP
Symantec i3 for SAP is one of the industry’s first solutions to provide a way to quickly and
efficiently capture and correlate SAP application metrics such as URLs, J2EE objects, RFC calls,
ABAP transaction activity, and SQL statements across the SAP infrastructure. It presents these
important metrics in a manner that enables crisp communication and rapid proactive or reactive
detection, correction, and verification throughout the application lifecycle.
Symantec i3 for SAP sets a new milestone in SAP performance management by delivering a
comprehensive integrated software solution that addresses the major challenges associated with
the management of SAP multi-tier application components.
For specific country offices and
contact numbers, please visit
our Web site. For product
information in the U.S., call
toll-free 1 (800) 745 6054.
Symantec Corporation
World Headquarters
20330 Stevens Creek Boulevard
Cupertino, CA 95014 USA
+1 (408) 517 8000
1 (800) 721 3934
www.symantec.com
About Symantec
Symantec is a global leader in
infrastructure software, enabling
businesses and consumers to have
confidence in a connected world.
The company helps customers
protect their infrastructure,
information, and interactions
by delivering software and services
that address risks to security,
availability, compliance, and
performance. Headquartered in
Cupertino, Calif., Symantec has
operations in 40 countries.
More information is available at
www.symantec.com.
Copyright © 2007 Symantec Corporation. All rights reserved. Symantec, the Symantec logo, i3, and Indepth are trademarks or registered trademarks of Symantec Corporation or its affiliates in the U.S. and other countries. HP is a registered trademark of Hewlett-Packard Development Company, L.P. IBM is a registered trademark of IBM Corporation. Oracle is a registered U.S. trademark of Oracle Corporation. Java is a trademark of Sun Microsystems, Inc. Other names may be trademarks of their respective owners. 10/07 12875757