Application of Wind Tunnel Device for Evaluation of ...
18
symmetry S S Article Application of Wind Tunnel Device for Evaluation of Biokinetic Parameters of Running Brane Širok 1 , Jurij Gostiša 1 , Matej Seˇ cnik 1 , Krzysztof Mackala 2, * and Milan ˇ Coh 3 Citation: Širok, B.; Gostiša, J.; Seˇ cnik, M.; Mackala, K.; ˇ Coh, M. Application of Wind Tunnel Device for Evaluation of Biokinetic Parameters of Running. Symmetry 2021, 13, 505. https:// doi.org/10.3390/sym13030505 Academic Editors: Jan Awrejcewicz and Sergei D. Odintsov Received: 31 January 2021 Accepted: 16 March 2021 Published: 19 March 2021 Publisher’s Note: MDPI stays neutral with regard to jurisdictional claims in published maps and institutional affil- iations. Copyright: © 2021 by the authors. Licensee MDPI, Basel, Switzerland. This article is an open access article distributed under the terms and conditions of the Creative Commons Attribution (CC BY) license (https:// creativecommons.org/licenses/by/ 4.0/). 1 Faculty of Mechanical Engineering, University of Ljubljana, Askerˇ ceva cesta 6, 1000 Ljubljana, Slovenia; [email protected] (B.Š.); [email protected] (J.G.); [email protected] (M.S.) 2 Department of Track and Field, University School of Physical Education, Wroclaw, Ul. Paderewskiego 35, 51-612 Wroclaw, Poland 3 Faculty of Sport, University of Ljubljana, Gortanova ul. 22, 1000 Ljubljana, Slovenia; [email protected] * Correspondence: [email protected] Abstract: The aim of the study was the application of high-tech wind tunnel device to identify the changes in the biokinetic parameters of running performed on the specially designed treadmill. The research was carried out in the “Planica Nordic Centre—PNC” in the wind tunnel system, where the AirRunner Assault treadmill, which was equipped with four sensors measuring the vertical and horizontal ground reaction forces, was installed. To obtain biokinetic data, the runners performed the treadmill’s run under conditions of airflow directed at each participant’s back (backwind speeds +3 m/s and +5 m/s) and the chest (headwind speeds -5 m/s and -7 m/s). The runner’s speed was measured via image analysis using a DSLR camera and markers on the belt of the treadmill. Additionally, a high-speed camera synchronised to the force acquisition system was used to analyse the contact phase via comparison of foot placement and time series of the ground reaction forces. The contact phases of the running step were found to be longer than the flight phases, with their duration ranging from 0.15 to 0.20 s and the maximum forces at take-off were found to be greater than when running with the backwind. It should be noted that the application of high-tech devices wind tunnel and treadmill were found to be sufficiently accurate to perform kinetic measurements of running parameters in changing conditions, such as resistance and assistance (facilitating). Keywords: running; kinematics; wind tunnel; kinetics; air resistance; technique 1. Introduction Running is a key factor of performance in many sports, so it is often the focus of sports science. It is a natural human movement, but it is a complex skill that is defined by many motor and functional abilities as well as neuro-muscular mechanisms. The most rational running training methods, employing the lowest energy consumption, have resulted in performance improvements in the sprint and in middle- and long-distance runs. These methods mainly depend on accessible technologies at a given time. They differ in whether the runs are performed in the scope of assistance training or resistance training methods. Utilising assistance training running methods (running by pulling, running downhill, and sprint accelerators) makes it possible to improve speed, especially the parameter of step frequency [1,2]. Using resistance training methods (dragging sleds, running uphill, running on sand, and parachute running), it is possible to specifically develop running power. Both of the methods increase the running potential of runners and other athletes. The disadvantage of these methods, on the other hand, is the lack of precise experimental technologies for monitoring the effects of training. Therefore, the application of high-tech devices such as treadmill and wind tunnel allow a better understanding of the above-mentioned issues. Over the years, there has been an increasing interest in the application of the motorized treadmill for walking and running analysis. The evaluation of explosive power output Symmetry 2021, 13, 505. https://doi.org/10.3390/sym13030505 https://www.mdpi.com/journal/symmetry
Transcript of Application of Wind Tunnel Device for Evaluation of ...
symmetryS S
Article
Application of Wind Tunnel Device for Evaluation of BiokineticParameters of Running
Brane Širok 1, Jurij Gostiša 1, Matej Secnik 1, Krzysztof Mackala 2,* and Milan Coh 3
�����������������
Citation: Širok, B.; Gostiša, J.; Secnik,
M.; Mackala, K.; Coh, M. Application
of Wind Tunnel Device for Evaluation
of Biokinetic Parameters of Running.
Symmetry 2021, 13, 505. https://
doi.org/10.3390/sym13030505
Academic Editors: Jan Awrejcewicz
and Sergei D. Odintsov
Received: 31 January 2021
Accepted: 16 March 2021
Published: 19 March 2021
Publisher’s Note: MDPI stays neutral
with regard to jurisdictional claims in
published maps and institutional affil-
iations.
Copyright: © 2021 by the authors.
Licensee MDPI, Basel, Switzerland.
This article is an open access article
distributed under the terms and
conditions of the Creative Commons
Attribution (CC BY) license (https://
creativecommons.org/licenses/by/
4.0/).
1 Faculty of Mechanical Engineering, University of Ljubljana, Askerceva cesta 6, 1000 Ljubljana, Slovenia;[email protected] (B.Š.); [email protected] (J.G.); [email protected] (M.S.)
2 Department of Track and Field, University School of Physical Education, Wroclaw, Ul. Paderewskiego 35,51-612 Wrocław, Poland
3 Faculty of Sport, University of Ljubljana, Gortanova ul. 22, 1000 Ljubljana, Slovenia; [email protected]* Correspondence: [email protected]
Abstract: The aim of the study was the application of high-tech wind tunnel device to identify thechanges in the biokinetic parameters of running performed on the specially designed treadmill. Theresearch was carried out in the “Planica Nordic Centre—PNC” in the wind tunnel system, wherethe AirRunner Assault treadmill, which was equipped with four sensors measuring the vertical andhorizontal ground reaction forces, was installed. To obtain biokinetic data, the runners performedthe treadmill’s run under conditions of airflow directed at each participant’s back (backwind speeds+3 m/s and +5 m/s) and the chest (headwind speeds −5 m/s and −7 m/s). The runner’s speedwas measured via image analysis using a DSLR camera and markers on the belt of the treadmill.Additionally, a high-speed camera synchronised to the force acquisition system was used to analysethe contact phase via comparison of foot placement and time series of the ground reaction forces. Thecontact phases of the running step were found to be longer than the flight phases, with their durationranging from 0.15 to 0.20 s and the maximum forces at take-off were found to be greater than whenrunning with the backwind. It should be noted that the application of high-tech devices wind tunneland treadmill were found to be sufficiently accurate to perform kinetic measurements of runningparameters in changing conditions, such as resistance and assistance (facilitating).
Keywords: running; kinematics; wind tunnel; kinetics; air resistance; technique
1. Introduction
Running is a key factor of performance in many sports, so it is often the focus ofsports science. It is a natural human movement, but it is a complex skill that is definedby many motor and functional abilities as well as neuro-muscular mechanisms. Themost rational running training methods, employing the lowest energy consumption, haveresulted in performance improvements in the sprint and in middle- and long-distanceruns. These methods mainly depend on accessible technologies at a given time. Theydiffer in whether the runs are performed in the scope of assistance training or resistancetraining methods. Utilising assistance training running methods (running by pulling,running downhill, and sprint accelerators) makes it possible to improve speed, especiallythe parameter of step frequency [1,2]. Using resistance training methods (dragging sleds,running uphill, running on sand, and parachute running), it is possible to specificallydevelop running power. Both of the methods increase the running potential of runners andother athletes. The disadvantage of these methods, on the other hand, is the lack of preciseexperimental technologies for monitoring the effects of training. Therefore, the applicationof high-tech devices such as treadmill and wind tunnel allow a better understanding of theabove-mentioned issues.
Over the years, there has been an increasing interest in the application of the motorizedtreadmill for walking and running analysis. The evaluation of explosive power output
Symmetry 2021, 13, 505. https://doi.org/10.3390/sym13030505 https://www.mdpi.com/journal/symmetry

Symmetry 2021, 13, 505 2 of 18
during running on motorized treadmill showed up difficulties in data comparison becauseof different methodological approaches. Therefore, the correct treadmill should be utilisedto improve the quality of the research. In the present study, the problems that are associatedwith motorized treadmills have been minimized by applying a non-motorized treadmill(NMT) type Assault AirRunner, manufactured by US company Assault Fitness. NMT areparticipant driven and they allow it a stronger impact on ground locomotion by enablingrapid acceleration and deceleration, gradual variation in gait, and pace changes [3–5].Several recent studies have proved that NMTs to be a practical, valid, and reliable advicefor evaluation a range of movement structure, mainly running and walking [6,7]. Addi-tionally, to comprehensively investigate the biomechanics of running in changing windconditions, the NMT was placed in a wind tunnel. Several wind tunnel testing methodshave already been described and provided the essential information [8–10], however onlya few investigated the aerodynamics as a crucial factor in various aspects of sports [11,12].Ito [11] experimentally studied drag reduction in the wind tunnel using thre-componentload cells and smoke visualization. Furthermore, he performed numerical investigationexplaining the aerodynamic phenomena of group formation running where the coefficientof drag was, in some cases, reduced by the factor of 10. In the study by Hirata [12], optimaltandem-running formation was studied and, recently, Tatsuya [13] developed a movingbelt system to investigate the air drag effects, where a 10% increase was found in the caseof solo running. The use of a wind tunnel is one of the most effective activities aimed atboth explaining the flows around runners and assessing the impact of air as resistanceor assistance and, therefore, analysing changes in the kinematic parameters of the run,according to Tatsuya [13].
Running efficiency depends on various biomechanical factors of movement [13–15],athletes’ physiological characteristics, psychological readiness, equipment, and externalconditions [16,17], among which airflow interacting with a runner’s movement is of greatimportance [18,19]. The significance of each of these factors is different and interconnected.Therefore, in the present investigation, we focused on the kinematics of running in termsof step frequency, stride length over a longer time interval, and the presence of airflowsof different intensities and directions. Moreover, the study addresses monitoring of thevertical and horizontal components of the runner’s ground reaction force. The progressionof the contact phases is examined by the simultaneous observation of each contact phase’skinetics of the left and right legs. In doing so, a synchronised high-speed imaging andforce measurement is used to analyse the forces that are exerted by the feet on the runningsurface during the contact phases of the runner’s feet on the treadmill surface.
The approach used in the current study is based on previous wind tunnel runningresearch that was presented by various authors [20–22]. Shanebrook and Jaszczak [21]studied the power dissipation with respect to air drag in the wind tunnel and measuredthe power dissipation of 0.33–0.49 HP at 10 m/s. Furthermore, the drag effects of runningbehind another athlete was investigated by Kyle [22], who found that running velocitycan be improved by 0.1 m/s and energy consumption reduced by 2–4%. Overall, theresearchers investigated the effects of airflow on the runner, based on a model, highlightingthe impact of airflow on running parameters, including the dynamics in the turbulentmarginal layer between the running surface, the runner, and the airflow in the plane abovethe treadmill. Therefore, the application of high-tech wind tunnel device to identify changesin the biokinetic parameters of running performed on the specially designed AirRunnerAssault treadmill, equipped with custom force measurement device, was the main goal ofthe study.
2. Materials and Methods2.1. Study Design
In the present study, we examine the biomechanics of running in the wind tunnel atvarious airflow speeds and directions (headwind vs. backwind in relation to the runneron the treadmill). The experiment is performed when considering homogeneous airflow

Symmetry 2021, 13, 505 3 of 18
at selected nominal speeds, achieved using different integral parameters of axial fansembedded in the wind tunnel. The measurement apparatus built upon the AirRunnerAssault treadmill is set up in the “Planica Nordic Centre—PNC”. Three trained middle-distance runners were included in this experiment to verify the adequacy of the proposedmeasurement method. The developed expert system allows for the measurement oflongitudinal and vertical reaction forces that formed in the contact phases of running. Therunning speed was determined using a marker that was mounted onto the treadmill surface.Based on the length of the running belt and the number of camera frames per second, wewere able to calculate the athlete’s speed. DSLR camera Nikkon D 3000, manufactured byUS company Nikkon was used to record markers on the treadmill belt, with the frequencyof 60 Hz, in order to determine the speed of the treadmill. Additionally, step frequency,and especially step length, depends mainly on an athlete’s body height, or the length of theleg and the force developed by the hip extensors.
2.2. Participants
None of the three trained middle-distance runners who participated in the experimentwere reported to have an injury to the musculoskeletal system. All of them were informed ofthe purpose of the study and the measurement procedures involved. All of the participantssigned an informed consent form, in accordance with the Helsinki-Tokyo Declaration,stating that their cooperation was voluntary and that they could choose to stop theirparticipation in the study at any time. The Human Ethics Committee of the University ofLjubljana approved the study design (Code:14_2020-1442). The participants understoodthat taking part in the study was voluntary and that they may terminate their participationat any time. The key characteristics of the participants are summarized in the Table 1.
Table 1. Descriptive Data of Selected Anthropometric Characteristic of Male Athletes.
Athlete 1 Athlete 2 Athlete 3
Age (years) 26 22 28Height [cm] 171 186 183
Body Mass [kg] 58 72 741500 m (PR) * 03.59, 0 03.58, 75 03.58, 8
* Personal record in the 1500 m run.
2.3. The Basic Characteristics of the Wind Tunnel
The research of the impact of airflow on runners was carried out in the wind tunnel ofthe “Planica Nordic Centre” (PNC). The NCP wind tunnel is a closed-circuit tunnel, wherethe airflow circulates through the vertical portion of the wind tunnel—the vertical section(1), which is primarily intended for parachute training, as shown in Figure 1. This section isfollowed by the horizontal portion of the wind tunnel—the horizontal section (2), which isintended to train ski jumpers and alpine skiers. In the latter part of the wind tunnel, studiesof running, cycling, and cross-country skiing can also be carried out. Two axial fans with atotal power of 2.2 MW (3) are installed in the lower portion of the flow system to generateairflow in the wind tunnel. The volume flow rate is regulated by the frequency regulatoron the installed fans. Figure 1A,B show the wind tunnel flow tract with the listed vitalsegments of the wind tunnel (1–3) that are connected by optimally designed flow channels.The shape of the entire flow tract was designed and selected following computational fluiddynamics (CFD) studies (Figure 1B) that were experimentally verified on a wind tunnelmodel (Figure 1A), ensuring the geometric and kinematic similarity between the modeland the prototype of the wind tunnel at the NCP facility.

Symmetry 2021, 13, 505 4 of 18
Symmetry 2021, 13, x FOR PEER REVIEW 4 of 18
following computational fluid dynamics (CFD) studies (Figure 1B) that were experimen-tally verified on a wind tunnel model (Figure 1A), ensuring the geometric and kinematic similarity between the model and the prototype of the wind tunnel at the NCP facility.
(A) (B)
Figure 1. (A) represents the wind tunnel’s physical model, tested by the water flow in the model with an M:1:36 ratio (wind tunnel designed size: wind tunnel model size); (B) represents the computational fluid dynamics (CFD) model of the airflow in the wind tunnel flow tract.
Airflow straighteners are installed at the inlet and exit of the horizontal section, providing a homogeneous field of airflow. A diagram of the velocity field of the horizontal section of the wind tunnel is presented on the right side of Figure 2. This parameter was measured to show the velocity profile in the plane in which the runner on the treadmill was moving when the experiment being carried out. The average airflow velocity of the measuring plane during the velocity distribution control measurement was <v> = 10.5 m/s. This value was controlled by the integral measurement value of the wind tunnel v = f(n), which was previously determined for the purposes of regulating the airflow velocity in the vertical section of the wind tunnel, depending on the rotational frequency of the in-stalled axial fans. Tables 2 and 3 present the functional parameters of the wind tunnel.
(A) (B)
Figure 2. Treadmill positioning (A) with marginal conditions—airflow velocity profile in the meridian plane (B).
Figure 1. (A) represents the wind tunnel’s physical model, tested by the water flow in the model with an M:1:36 ratio (windtunnel designed size: wind tunnel model size); (B) represents the computational fluid dynamics (CFD) model of the airflowin the wind tunnel flow tract.
Airflow straighteners are installed at the inlet and exit of the horizontal section,providing a homogeneous field of airflow. A diagram of the velocity field of the horizontalsection of the wind tunnel is presented on the right side of Figure 2. This parameter wasmeasured to show the velocity profile in the plane in which the runner on the treadmillwas moving when the experiment being carried out. The average airflow velocity of themeasuring plane during the velocity distribution control measurement was <v> = 10.5 m/s.This value was controlled by the integral measurement value of the wind tunnel v = f (n),which was previously determined for the purposes of regulating the airflow velocity in thevertical section of the wind tunnel, depending on the rotational frequency of the installedaxial fans. Tables 2 and 3 present the functional parameters of the wind tunnel.
Symmetry 2021, 13, x FOR PEER REVIEW 4 of 18
following computational fluid dynamics (CFD) studies (Figure 1B) that were experimen-tally verified on a wind tunnel model (Figure 1A), ensuring the geometric and kinematic similarity between the model and the prototype of the wind tunnel at the NCP facility.
(A) (B)
Figure 1. (A) represents the wind tunnel’s physical model, tested by the water flow in the model with an M:1:36 ratio (wind tunnel designed size: wind tunnel model size); (B) represents the computational fluid dynamics (CFD) model of the airflow in the wind tunnel flow tract.
Airflow straighteners are installed at the inlet and exit of the horizontal section, providing a homogeneous field of airflow. A diagram of the velocity field of the horizontal section of the wind tunnel is presented on the right side of Figure 2. This parameter was measured to show the velocity profile in the plane in which the runner on the treadmill was moving when the experiment being carried out. The average airflow velocity of the measuring plane during the velocity distribution control measurement was <v> = 10.5 m/s. This value was controlled by the integral measurement value of the wind tunnel v = f(n), which was previously determined for the purposes of regulating the airflow velocity in the vertical section of the wind tunnel, depending on the rotational frequency of the in-stalled axial fans. Tables 2 and 3 present the functional parameters of the wind tunnel.
(A) (B)
Figure 2. Treadmill positioning (A) with marginal conditions—airflow velocity profile in the meridian plane (B). Figure 2. Treadmill positioning (A) with marginal conditions—airflow velocity profile in the meridian plane (B).

Symmetry 2021, 13, 505 5 of 18
Table 2. Nominal Wind Tunnel Parameters.
Nominal volume flow rate in the wind tunnel 510 m3/sCross-section of the vertical section Φ 3.6 mMaximum airflow velocity in the vertical section of the wind tunnel 61 m/sNominal total pressure differential on installed fans 4300 PaAir density range in the wind tunnel 1.1–1.2 kg/m3
Nominal electrical power of fans 2.2 MW
Table 3. Nominal Wind Tunnel Parameters-Horizontal Section.
Nominal volume flow rate in the wind tunnel 124 m3/sTransverse section of horizontal section A 10.5 m2
Maximum airflow velocity in the verticalsection of the wind tunnel 45 m/s
2.4. Experimental Procedure
In the horizontal section of the wind tunnel, an Assault AirRunner treadmill (AssaultFitness, Carlsbad, CA, USA) was installed for the purpose of the study. The treadmillwas attached to the wind tunnel through consoles for measuring vertical and longitudinalreaction forces, as shown in the Figures 2 and 3. The measuring consoles were fixated usingscrew joints to measure the Fx longitudinal reaction force, at two supporting points, andfour vertical Fy reaction forces at all the supporting points of the treadmill on the windtunnel’s lower horizontal tunnel platform. The installation allowed for the treadmill to berotated for 180◦ around its vertical axis. In this way, measurements of the reaction forceson the measuring consoles were performed with respect to the airflow direction-headwind,as shown on the left of Figure 2, and backwind if the treadmill was rotated for 180◦.
Symmetry 2021, 13, x FOR PEER REVIEW 6 of 18
rear part of the treadmill was freely mounted in a horizontal direction (Figure 3). The measuring sensors were wired to a data capture system, which was developed at the Fac-ulty of Mechanical Engineering, University of Ljubljana. The system allows for the simul-taneous capture of individual load sensors. The force acquisition was performed with sampling frequency of 1200 Hz. To provide a detailed description of force-step interde-pendence, the mini UX100 high-speed camera, manufactured by Photron (West Wycombe /UK), was utilised to perform visualization synchronous to force measurement. The cam-era was mounted perpendicularly to the meridian plane of the horizontal wind tunnel, approximately 3 m from the runner on the treadmill and approximately 3 m from the front of the runner to analyse the frontal view of the contact phase. The image capture frequency was 1000 Hz, and the camera was synchronised with a computer system recording the time signals of forces acting on the treadmill sensors, as shown in Figure 4. Force meas-urements and high-speed camera images were postprocessed using the LabView pro-gram, allowing for the synchronisation of the camera with the force data capture system.
(A) (B)
Figure 3. The horizontal x-oriented force sensors and the vertically oriented sensors–schematic representation (A); images of the sensors in the x orientation and y orientation (B).
(A) (B)
Figure 4. Snapshot of the step load of the runner time series, consisting of the left—L and right—R leg load on the treadmill. original signal (A); a snapshot of the time series specifying the time limits of the foot’s contact with the surface of the treadmill (B).
Qualitative and quantitative running analyses of the results of the kinematic meas-urements and the dynamics of the runner on the treadmill, in the presence of stationary aerodynamic characteristics of the airflow-velocity <vnom> in the wind tunnel, are pre-sented below. The basic parameters of the run are first provided in the introductory por-tion of the analysis. A description of the methodology for evaluating the time course of the horizontal and vertical loads on the treadmill sensors, depending on the time course
Figure 3. The horizontal x-oriented force sensors and the vertically oriented sensors–schematic representation (A); imagesof the sensors in the x orientation and y orientation (B).
The left photo of Figure 2 shows the layout of the treadmill with the runner in thehorizontal section of the wind tunnel. On the right side of Figure 2, a diagram of thelocal velocity at the PCN location, in the horizontal direction of the wind tunnel at thetreadmill position, depending on the vertical position y. The velocity was measured usinga Schiltknecht MiniAir 20 anemometer (Schiltknecht Messtechnik AG, Gossau/ZH). Theflow velocity was measured at 1 m from the treadmill entry in the airflow direction of themeridian plane, which was positioned on the longitudinal axis of the treadmill.
Airflow velocity measurements were performed at integral parameters of the windtunnel: volume flow V = 110 m3/s with a nominal average velocity calculated from thevolume flow <vnom> (m3/s) and the surface of the flow tunnel A = 10.5 m2; <vnom> = V/A.The velocity was measured at 1 m from the entry to the treadmill running belt in thedirection of the airflow in the meridian plane, positioned on the treadmill’s longitudinalaxis. The measurement uncertainty of the recorded and nominal velocities was within the

Symmetry 2021, 13, 505 6 of 18
[+−
]2% limit. The running speed was determined using a marker that was mounted
onto the treadmill surface. Based on the length of the running belt and the number ofcamera frames per second, we were able to calculate the athlete’s speed. To determinethe speed of the treadmill, we used a Nikkon D 3000 camera to record the markers on thetreadmill belt, with a frequency of 60 Hz.
Measuring cells or force sensors allows for detection of eccentric loads. Force sensorswith load capacity of 60 and 100 kg, and C2/C3 accuracy class, manufactured by XNQElectric Company (Shenzen/CN) were used. Force sensors with a load capacity of 100 kgwere used to detect forces in the horizontal plane, while sensors with a load capacity of60 kg were used to detect forces in the vertical plane. The horizontal force components weremeasured at four points. Horizontal sensors were attached to the underside of a metal plate,allowing for better stability. Vertical sensors were installed on the front measuring pointsand then fixated onto the lower part of the treadmill (Figure 3, right). The rear part of thetreadmill was freely mounted in a horizontal direction (Figure 3). The measuring sensorswere wired to a data capture system, which was developed at the Faculty of MechanicalEngineering, University of Ljubljana. The system allows for the simultaneous capture ofindividual load sensors. The force acquisition was performed with sampling frequencyof 1200 Hz. To provide a detailed description of force-step interdependence, the miniUX100 high-speed camera, manufactured by Photron (West Wycombe /UK), was utilisedto perform visualization synchronous to force measurement. The camera was mountedperpendicularly to the meridian plane of the horizontal wind tunnel, approximately 3 mfrom the runner on the treadmill and approximately 3 m from the front of the runner toanalyse the frontal view of the contact phase. The image capture frequency was 1000 Hz,and the camera was synchronised with a computer system recording the time signals offorces acting on the treadmill sensors, as shown in Figure 4. Force measurements andhigh-speed camera images were postprocessed using the LabView program, allowing forthe synchronisation of the camera with the force data capture system.
Symmetry 2021, 13, x FOR PEER REVIEW 6 of 18
rear part of the treadmill was freely mounted in a horizontal direction (Figure 3). The measuring sensors were wired to a data capture system, which was developed at the Fac-ulty of Mechanical Engineering, University of Ljubljana. The system allows for the simul-taneous capture of individual load sensors. The force acquisition was performed with sampling frequency of 1200 Hz. To provide a detailed description of force-step interde-pendence, the mini UX100 high-speed camera, manufactured by Photron (West Wycombe /UK), was utilised to perform visualization synchronous to force measurement. The cam-era was mounted perpendicularly to the meridian plane of the horizontal wind tunnel, approximately 3 m from the runner on the treadmill and approximately 3 m from the front of the runner to analyse the frontal view of the contact phase. The image capture frequency was 1000 Hz, and the camera was synchronised with a computer system recording the time signals of forces acting on the treadmill sensors, as shown in Figure 4. Force meas-urements and high-speed camera images were postprocessed using the LabView pro-gram, allowing for the synchronisation of the camera with the force data capture system.
(A) (B)
Figure 3. The horizontal x-oriented force sensors and the vertically oriented sensors–schematic representation (A); images of the sensors in the x orientation and y orientation (B).
(A) (B)
Figure 4. Snapshot of the step load of the runner time series, consisting of the left—L and right—R leg load on the treadmill. original signal (A); a snapshot of the time series specifying the time limits of the foot’s contact with the surface of the treadmill (B).
Qualitative and quantitative running analyses of the results of the kinematic meas-urements and the dynamics of the runner on the treadmill, in the presence of stationary aerodynamic characteristics of the airflow-velocity <vnom> in the wind tunnel, are pre-sented below. The basic parameters of the run are first provided in the introductory por-tion of the analysis. A description of the methodology for evaluating the time course of the horizontal and vertical loads on the treadmill sensors, depending on the time course
Figure 4. Snapshot of the step load of the runner time series, consisting of the left—L and right—R leg load on the treadmill.original signal (A); a snapshot of the time series specifying the time limits of the foot’s contact with the surface of thetreadmill (B).
Qualitative and quantitative running analyses of the results of the kinematic mea-surements and the dynamics of the runner on the treadmill, in the presence of stationaryaerodynamic characteristics of the airflow-velocity <vnom> in the wind tunnel, are presentedbelow. The basic parameters of the run are first provided in the introductory portion of theanalysis. A description of the methodology for evaluating the time course of the horizontaland vertical loads on the treadmill sensors, depending on the time course of the load on

Symmetry 2021, 13, 505 7 of 18
the runner’s feet on the surface of the running belt, follows. The results are provided withtime series Fvert(t) and Fvert(t), which were obtained as the load sum of the four verticalforce sensors and the two horizontal force sensors:
Fvert =4
∑1
Fvert.i (1)
Fhori =2
∑1
Fhori.i (2)
Both time series, as calculated by Equations (1) and (2), represent quasi-periodicallyrepetitive loads of the force sensors upon contact (contact between the runner’s left or rightfoot with the running belt). The analysis assumes that the measured values on the sensorsare equal to the force values—the foot load on the surface of the belt.
Figure 4 presents a typical example of the load of a runner on a treadmill. The diagrampresents a snapshot from the measured time series, capturing loads of the left (L) and right(R) feet at any selected stride length t0D. A detailed description of the course of the forces’time signals is presented below with the kinesiological results of the runner’s movementon the treadmill. Down below, the equations for calculation of the running parametersare listed:
– Vertical reaction impulse Jvert, braking impulse Jdec, and accelerator impulse Jacc:
Jvert =∫ t1
t0
Fvert dt (3)
Jdec =∫ t2
t3
Fhor dt (4)
Jacc =∫ t4
t2
Fhor dt (5)
– Contact time:
tk(i) = t2L (i)− t0L(i) + t2D(i)− toD(i), tkD(i) = t2D(i)− toD(i), tkL(i) = t2L(i)− toL(i) (6)
– Time-averaged contact time:tk = ∑
itk,i/N (7)
– Running frequency:
f (i) =1
(t0Di+1)− (t0Di)∼=
1(t0Li+1)− (t0Li)
(8)
– Time-averaged frequency:〈 fi〉 = 1/N ∑i fi (9)
– Stride length
Li =∑N
i=1vi
t2D,i−toL,i
N(10)
– Time-averaged stride length:
〈Li〉 = 1/NN
∑i=1
Li (11)
These equations allow for the analysis of running on the integral and differentialscales, as determined by the frequency of force measurement by the experimental systemat specific time intervals of running, which were determined by the study protocol

Symmetry 2021, 13, 505 8 of 18
3. Results3.1. Simultaneous Analysis of the Running Topology and the Measured Forces of the Athlete on theRunning Surface
The images following the diagrams show that the position of the runner’s foot variesaccording to the surface of the running belt; from the outer side of the foot, being markedby the red circle in Figure 5, through the initial contact phase, to the transition to the innerside of the foot, marked by the red circle in Figures 6 and 7, and then to the final stage ofthe contact phase, at the tip of the toe, as shown in Figure 8.
Symmetry 2021, 13, x FOR PEER REVIEW 8 of 18
⟨ ⟩ = 1/ (11)
These equations allow for the analysis of running on the integral and differential scales, as determined by the frequency of force measurement by the experimental system at specific time intervals of running, which were determined by the study protocol
3. Results 3.1. Simultaneous Analysis of the Running Topology and the Measured Forces of the Athlete on the Running Surface
The images following the diagrams show that the position of the runner’s foot varies according to the surface of the running belt; from the outer side of the foot, being marked by the red circle in Figure 5, through the initial contact phase, to the transition to the inner side of the foot, marked by the red circle in Figures 6 and 7, and then to the final stage of the contact phase, at the tip of the toe, as shown in Figure 8.
Figure 5. Initial contact of the right foot.
Figure 6. Achieving the local extreme of the on its outer side. the Fy force load on the inner side of the foot.
Figure 5. Initial contact of the right foot.
Symmetry 2021, 13, x FOR PEER REVIEW 8 of 18
⟨ ⟩ = 1/ (11)
These equations allow for the analysis of running on the integral and differential scales, as determined by the frequency of force measurement by the experimental system at specific time intervals of running, which were determined by the study protocol
3. Results 3.1. Simultaneous Analysis of the Running Topology and the Measured Forces of the Athlete on the Running Surface
The images following the diagrams show that the position of the runner’s foot varies according to the surface of the running belt; from the outer side of the foot, being marked by the red circle in Figure 5, through the initial contact phase, to the transition to the inner side of the foot, marked by the red circle in Figures 6 and 7, and then to the final stage of the contact phase, at the tip of the toe, as shown in Figure 8.
Figure 5. Initial contact of the right foot.
Figure 6. Achieving the local extreme of the on its outer side. the Fy force load on the inner side of the foot.
Figure 6. Achieving the local extreme of the on its outer side. the Fy force load on the inner side ofthe foot.
Symmetry 2021, 13, 505 9 of 18
Symmetry 2021, 13, x FOR PEER REVIEW 9 of 18
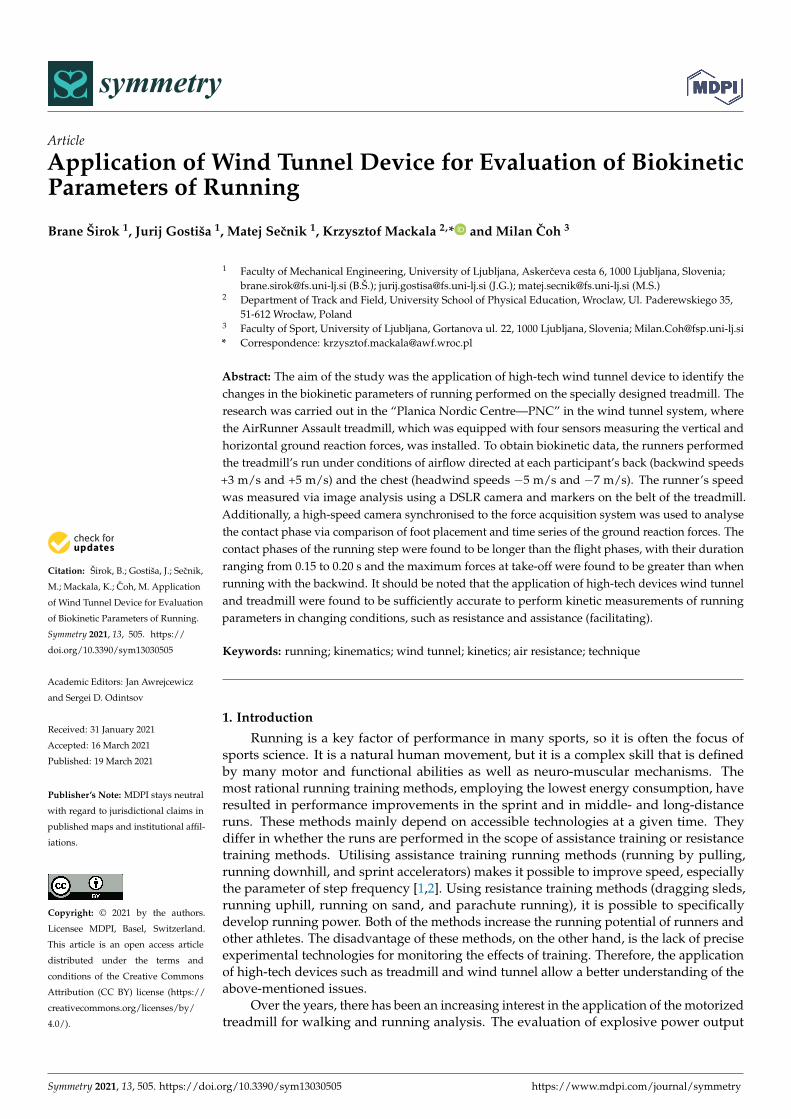
Figure 7. Transition into the take-off phase.
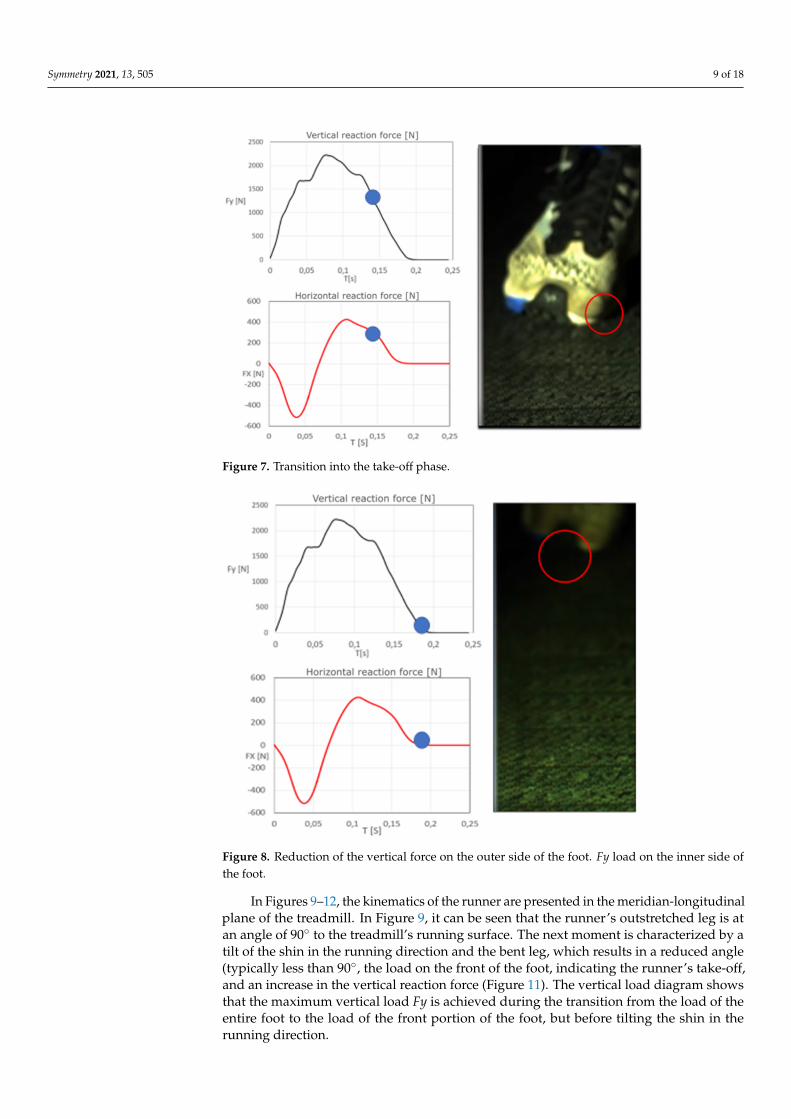
Figure 8. Reduction of the vertical force on the outer side of the foot. Fy load on the inner side of the foot.
In Figures 9–12, the kinematics of the runner are presented in the meridian-longitu-dinal plane of the treadmill. In Figure 9, it can be seen that the runner’s outstretched leg is at an angle of 90° to the treadmill’s running surface. The next moment is characterized by a tilt of the shin in the running direction and the bent leg, which results in a reduced angle (typically less than 90°, the load on the front of the foot, indicating the runner’s take-off, and an increase in the vertical reaction force (Figure 11). The vertical load diagram shows that the maximum vertical load Fy is achieved during the transition from the load of the entire foot to the load of the front portion of the foot, but before tilting the shin in the running direction.
Figure 7. Transition into the take-off phase.
Symmetry 2021, 13, x FOR PEER REVIEW 9 of 18
Figure 7. Transition into the take-off phase.
Figure 8. Reduction of the vertical force on the outer side of the foot. Fy load on the inner side of the foot.
In Figures 9–12, the kinematics of the runner are presented in the meridian-longitu-dinal plane of the treadmill. In Figure 9, it can be seen that the runner’s outstretched leg is at an angle of 90° to the treadmill’s running surface. The next moment is characterized by a tilt of the shin in the running direction and the bent leg, which results in a reduced angle (typically less than 90°, the load on the front of the foot, indicating the runner’s take-off, and an increase in the vertical reaction force (Figure 11). The vertical load diagram shows that the maximum vertical load Fy is achieved during the transition from the load of the entire foot to the load of the front portion of the foot, but before tilting the shin in the running direction.
Figure 8. Reduction of the vertical force on the outer side of the foot. Fy load on the inner side ofthe foot.
In Figures 9–12, the kinematics of the runner are presented in the meridian-longitudinalplane of the treadmill. In Figure 9, it can be seen that the runner’s outstretched leg is atan angle of 90◦ to the treadmill’s running surface. The next moment is characterized by atilt of the shin in the running direction and the bent leg, which results in a reduced angle(typically less than 90◦, the load on the front of the foot, indicating the runner’s take-off,and an increase in the vertical reaction force (Figure 11). The vertical load diagram showsthat the maximum vertical load Fy is achieved during the transition from the load of theentire foot to the load of the front portion of the foot, but before tilting the shin in therunning direction.

Symmetry 2021, 13, 505 10 of 18
Symmetry 2021, 13, x FOR PEER REVIEW 10 of 18
Figure 9. Initial foot contact phase.
Figure 10. Transition to running acceleration.
Figure 11. The take-off phase and lifting the foot.
Figure 9. Initial foot contact phase.
Symmetry 2021, 13, x FOR PEER REVIEW 10 of 18
Figure 9. Initial foot contact phase.
Figure 10. Transition to running acceleration.
Figure 11. The take-off phase and lifting the foot.
Figure 10. Transition to running acceleration.
Symmetry 2021, 13, x FOR PEER REVIEW 10 of 18
Figure 9. Initial foot contact phase.
Figure 10. Transition to running acceleration.
Figure 11. The take-off phase and lifting the foot. Figure 11. The take-off phase and lifting the foot.
Symmetry 2021, 13, 505 11 of 18Symmetry 2021, 13, x FOR PEER REVIEW 11 of 18
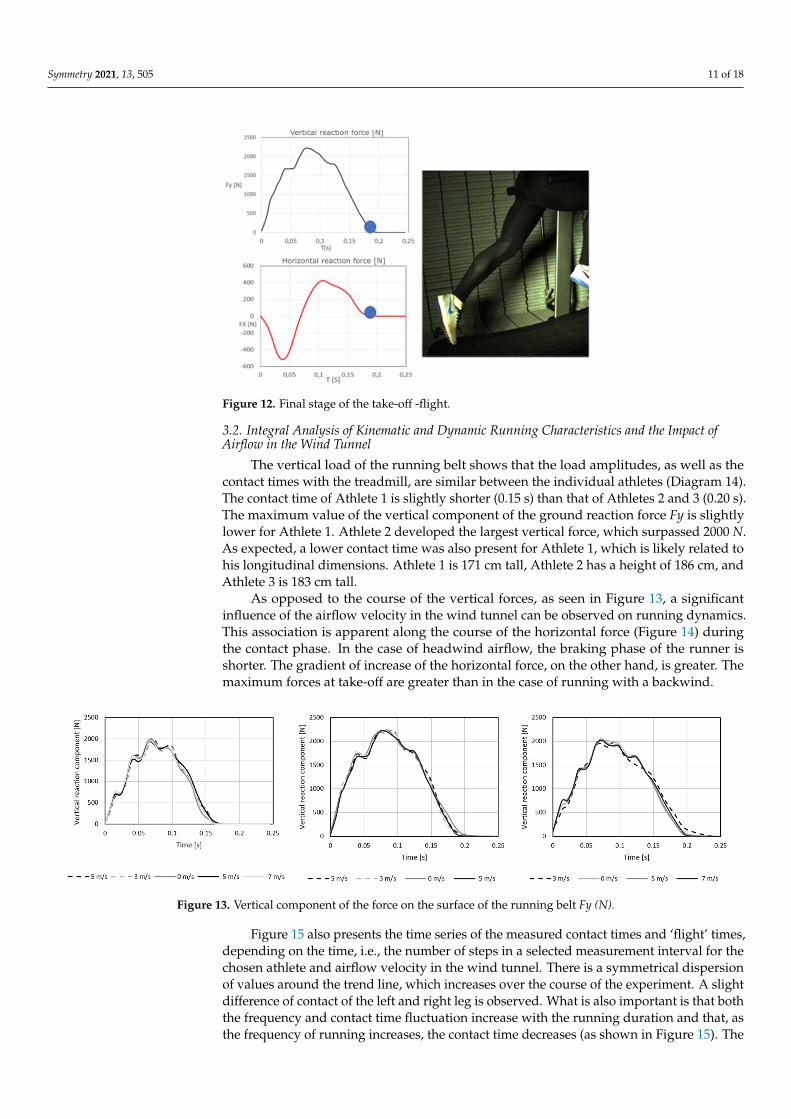
Figure 12. Final stage of the take-off -flight.
3.2. Integral Analysis of Kinematic and Dynamic Running Characteristics and the Impact of Airflow in The Wind Tunnel
The vertical load of the running belt shows that the load amplitudes, as well as the contact times with the treadmill, are similar between the individual athletes (Diagram 14). The contact time of Athlete 1 is slightly shorter (0.15 s) than that of Athletes 2 and 3 (0.20 s). The maximum value of the vertical component of the ground reaction force Fy is slightly lower for Athlete 1. Athlete 2 developed the largest vertical force, which surpassed 2000 N. As expected, a lower contact time was also present for Athlete 1, which is likely related to his longitudinal dimensions. Athlete 1 is 171 cm tall, Athlete 2 has a height of 186 cm, and Athlete 3 is 183 cm tall.
As opposed to the course of the vertical forces, as seen in Figure 13, a significant influence of the airflow velocity in the wind tunnel can be observed on running dynamics. This association is apparent along the course of the horizontal force (Figure 14) during the contact phase. In the case of headwind airflow, the braking phase of the runner is shorter. The gradient of increase of the horizontal force, on the other hand, is greater. The maxi-mum forces at take-off are greater than in the case of running with a backwind.
Figure 13. Vertical component of the force on the surface of the running belt Fy (N).
Figure 12. Final stage of the take-off -flight.
3.2. Integral Analysis of Kinematic and Dynamic Running Characteristics and the Impact ofAirflow in the Wind Tunnel
The vertical load of the running belt shows that the load amplitudes, as well as thecontact times with the treadmill, are similar between the individual athletes (Diagram 14).The contact time of Athlete 1 is slightly shorter (0.15 s) than that of Athletes 2 and 3 (0.20 s).The maximum value of the vertical component of the ground reaction force Fy is slightlylower for Athlete 1. Athlete 2 developed the largest vertical force, which surpassed 2000 N.As expected, a lower contact time was also present for Athlete 1, which is likely related tohis longitudinal dimensions. Athlete 1 is 171 cm tall, Athlete 2 has a height of 186 cm, andAthlete 3 is 183 cm tall.
As opposed to the course of the vertical forces, as seen in Figure 13, a significantinfluence of the airflow velocity in the wind tunnel can be observed on running dynamics.This association is apparent along the course of the horizontal force (Figure 14) duringthe contact phase. In the case of headwind airflow, the braking phase of the runner isshorter. The gradient of increase of the horizontal force, on the other hand, is greater. Themaximum forces at take-off are greater than in the case of running with a backwind.
Symmetry 2021, 13, x FOR PEER REVIEW 11 of 18
Figure 12. Final stage of the take-off -flight.
3.2. Integral Analysis of Kinematic and Dynamic Running Characteristics and the Impact of Airflow in The Wind Tunnel
The vertical load of the running belt shows that the load amplitudes, as well as the contact times with the treadmill, are similar between the individual athletes (Diagram 14). The contact time of Athlete 1 is slightly shorter (0.15 s) than that of Athletes 2 and 3 (0.20 s). The maximum value of the vertical component of the ground reaction force Fy is slightly lower for Athlete 1. Athlete 2 developed the largest vertical force, which surpassed 2000 N. As expected, a lower contact time was also present for Athlete 1, which is likely related to his longitudinal dimensions. Athlete 1 is 171 cm tall, Athlete 2 has a height of 186 cm, and Athlete 3 is 183 cm tall.
As opposed to the course of the vertical forces, as seen in Figure 13, a significant influence of the airflow velocity in the wind tunnel can be observed on running dynamics. This association is apparent along the course of the horizontal force (Figure 14) during the contact phase. In the case of headwind airflow, the braking phase of the runner is shorter. The gradient of increase of the horizontal force, on the other hand, is greater. The maxi-mum forces at take-off are greater than in the case of running with a backwind.
Figure 13. Vertical component of the force on the surface of the running belt Fy (N).
Figure 13. Vertical component of the force on the surface of the running belt Fy (N).
Figure 15 also presents the time series of the measured contact times and ‘flight’ times,depending on the time, i.e., the number of steps in a selected measurement interval for thechosen athlete and airflow velocity in the wind tunnel. There is a symmetrical dispersionof values around the trend line, which increases over the course of the experiment. A slightdifference of contact of the left and right leg is observed. What is also important is that boththe frequency and contact time fluctuation increase with the running duration and that, asthe frequency of running increases, the contact time decreases (as shown in Figure 15). The
Symmetry 2021, 13, 505 12 of 18
flight phase times are longer than the contact phases, due to the specific nature of runningon the treadmill.
Symmetry 2021, 13, x FOR PEER REVIEW 11 of 18
Figure 12. Final stage of the take-off -flight.
3.2. Integral Analysis of Kinematic and Dynamic Running Characteristics and the Impact of Airflow in The Wind Tunnel
The vertical load of the running belt shows that the load amplitudes, as well as the contact times with the treadmill, are similar between the individual athletes (Diagram 14). The contact time of Athlete 1 is slightly shorter (0.15 s) than that of Athletes 2 and 3 (0.20 s). The maximum value of the vertical component of the ground reaction force Fy is slightly lower for Athlete 1. Athlete 2 developed the largest vertical force, which surpassed 2000 N. As expected, a lower contact time was also present for Athlete 1, which is likely related to his longitudinal dimensions. Athlete 1 is 171 cm tall, Athlete 2 has a height of 186 cm, and Athlete 3 is 183 cm tall.
As opposed to the course of the vertical forces, as seen in Figure 13, a significant influence of the airflow velocity in the wind tunnel can be observed on running dynamics. This association is apparent along the course of the horizontal force (Figure 14) during the contact phase. In the case of headwind airflow, the braking phase of the runner is shorter. The gradient of increase of the horizontal force, on the other hand, is greater. The maxi-mum forces at take-off are greater than in the case of running with a backwind.
Figure 13. Vertical component of the force on the surface of the running belt Fy (N).
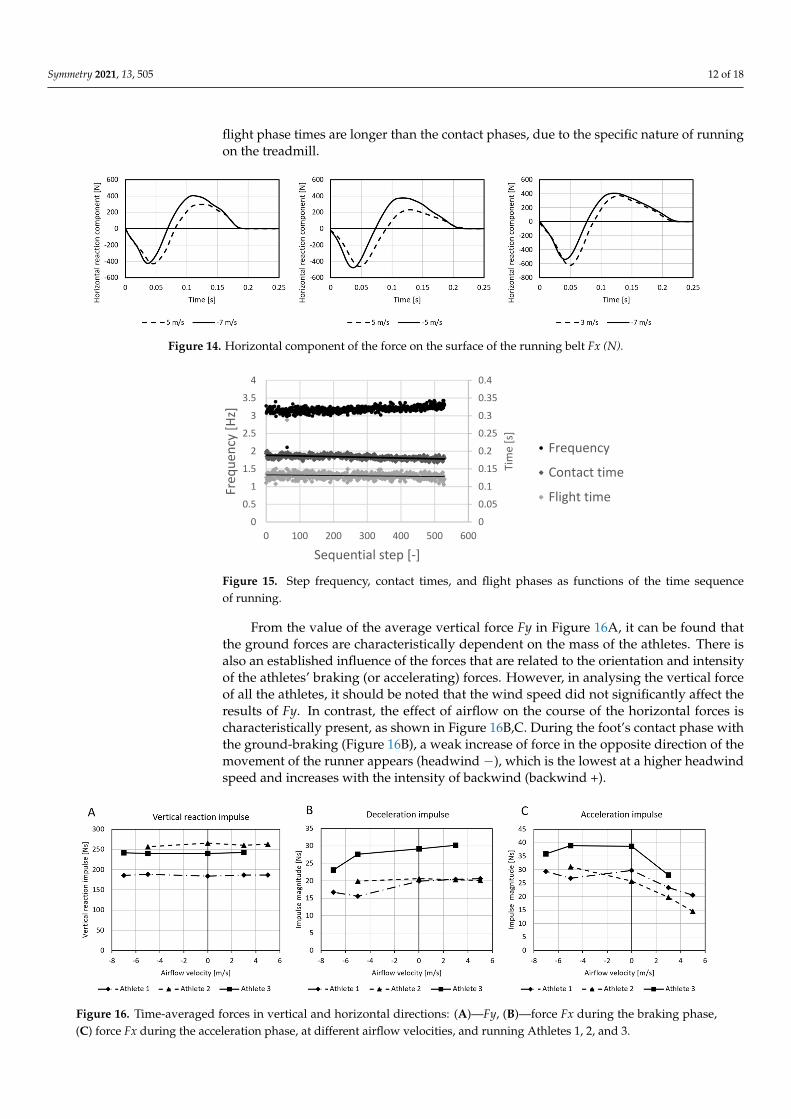
Figure 14. Horizontal component of the force on the surface of the running belt Fx (N).
Symmetry 2021, 13, x FOR PEER REVIEW 12 of 18
Figure 14. Horizontal component of the force on the surface of the running belt Fx (N).
Figure 15 also presents the time series of the measured contact times and ‘flight’ times, depending on the time, i.e., the number of steps in a selected measurement interval for the chosen athlete and airflow velocity in the wind tunnel. There is a symmetrical dis-persion of values around the trend line, which increases over the course of the experiment. A slight difference of contact of the left and right leg is observed. What is also important is that both the frequency and contact time fluctuation increase with the running duration and that, as the frequency of running increases, the contact time decreases (as shown in Figure 15). The flight phase times are longer than the contact phases, due to the specific nature of running on the treadmill.
Figure 15. Step frequency, contact times, and flight phases as functions of the time sequence of running.
From the value of the average vertical force Fy in Figure 16A, it can be found that the ground forces are characteristically dependent on the mass of the athletes. There is also an established influence of the forces that are related to the orientation and intensity of the athletes’ braking (or accelerating) forces. However, in analysing the vertical force of all the athletes, it should be noted that the wind speed did not significantly affect the re-sults of Fy. In contrast, the effect of airflow on the course of the horizontal forces is char-acteristically present, as shown in Figure 16B,C. During the foot’s contact phase with the ground-braking (Figure 16B), a weak increase of force in the opposite direction of the movement of the runner appears (headwind −), which is the lowest at a higher headwind speed and increases with the intensity of backwind (backwind +).
Figure 16. Time-averaged forces in vertical and horizontal directions: (A)—Fy, (B)—force Fx during the braking phase, (C) force Fx during the acceleration phase, at different airflow velocities, and running Athletes 1, 2, and 3.
00.050.10.150.20.250.30.350.4
00.5
11.5
22.5
33.5
4
0 100 200 300 400 500 600
Tim
e [s
]
Freq
uenc
y [H
z]
Sequential step [-]
Frequency
Contact time
Flight time
Figure 15. Step frequency, contact times, and flight phases as functions of the time sequenceof running.
From the value of the average vertical force Fy in Figure 16A, it can be found thatthe ground forces are characteristically dependent on the mass of the athletes. There isalso an established influence of the forces that are related to the orientation and intensityof the athletes’ braking (or accelerating) forces. However, in analysing the vertical forceof all the athletes, it should be noted that the wind speed did not significantly affect theresults of Fy. In contrast, the effect of airflow on the course of the horizontal forces ischaracteristically present, as shown in Figure 16B,C. During the foot’s contact phase withthe ground-braking (Figure 16B), a weak increase of force in the opposite direction of themovement of the runner appears (headwind −), which is the lowest at a higher headwindspeed and increases with the intensity of backwind (backwind +).
Symmetry 2021, 13, x FOR PEER REVIEW 12 of 18
Figure 14. Horizontal component of the force on the surface of the running belt Fx (N).
Figure 15 also presents the time series of the measured contact times and ‘flight’ times, depending on the time, i.e., the number of steps in a selected measurement interval for the chosen athlete and airflow velocity in the wind tunnel. There is a symmetrical dis-persion of values around the trend line, which increases over the course of the experiment. A slight difference of contact of the left and right leg is observed. What is also important is that both the frequency and contact time fluctuation increase with the running duration and that, as the frequency of running increases, the contact time decreases (as shown in Figure 15). The flight phase times are longer than the contact phases, due to the specific nature of running on the treadmill.
Figure 15. Step frequency, contact times, and flight phases as functions of the time sequence of running.
From the value of the average vertical force Fy in Figure 16A, it can be found that the ground forces are characteristically dependent on the mass of the athletes. There is also an established influence of the forces that are related to the orientation and intensity of the athletes’ braking (or accelerating) forces. However, in analysing the vertical force of all the athletes, it should be noted that the wind speed did not significantly affect the re-sults of Fy. In contrast, the effect of airflow on the course of the horizontal forces is char-acteristically present, as shown in Figure 16B,C. During the foot’s contact phase with the ground-braking (Figure 16B), a weak increase of force in the opposite direction of the movement of the runner appears (headwind −), which is the lowest at a higher headwind speed and increases with the intensity of backwind (backwind +).
Figure 16. Time-averaged forces in vertical and horizontal directions: (A)—Fy, (B)—force Fx during the braking phase, (C) force Fx during the acceleration phase, at different airflow velocities, and running Athletes 1, 2, and 3.
00.050.10.150.20.250.30.350.4
00.5
11.5
22.5
33.5
4
0 100 200 300 400 500 600Ti
me
[s]
Freq
uenc
y [H
z]
Sequential step [-]
Frequency
Contact time
Flight time
Figure 16. Time-averaged forces in vertical and horizontal directions: (A)—Fy, (B)—force Fx during the braking phase,(C) force Fx during the acceleration phase, at different airflow velocities, and running Athletes 1, 2, and 3.

Symmetry 2021, 13, 505 13 of 18
All of the runners are characterised by a descending curve, from high wind speeds tothe chest (+8 m/s) to the lowest values of the ratio and high backwinds (−5 m/s). Fromthe curve courses of the diagram shown in Figure 17, the ratio of “useful force” representedby the acceleration force relative to the braking force is reduced.
Symmetry 2021, 13, x FOR PEER REVIEW 13 of 18
All of the runners are characterised by a descending curve, from high wind speeds to the chest (+8 m/s) to the lowest values of the ratio and high backwinds (—5 m/s). From the curve courses of the diagram shown in Figure 17, the ratio of “useful force” repre-sented by the acceleration force relative to the braking force is reduced.
Figure 17. Relationship between the acceleration and deceleration force for individual athletes under different aerodynamic conditions.
Figure 18 shows the time-averaged frequencies of individual athletes with different aerodynamic airflow characteristics in the wind tunnel. The course of the diagrams for the individual athletes shows a significant difference between the step frequencies of individ-ual athletes. However, we cannot conclude that the airflow velocity during running sig-nificantly affects frequency. For Athletes 1 and 2, there is a noticeably small increase in frequency when transitioning from the headwind to the backwind.
Figure 18. Running frequency of individual athletes, depending on aerodynamic characteristics.
When comparing contact and flight times as shown in the Figure 19, we can notice that the contact phase is significantly longer than the flight phase for all athletes. A recip-rocal course of values is also noticeable, which means that those variables’ curves are mir-rored according to wind speed. This characteristic is most pronounced in Athletes 2 and
Figure 17. Relationship between the acceleration and deceleration force for individual athletes underdifferent aerodynamic conditions.
Figure 18 shows the time-averaged frequencies of individual athletes with differentaerodynamic airflow characteristics in the wind tunnel. The course of the diagrams forthe individual athletes shows a significant difference between the step frequencies ofindividual athletes. However, we cannot conclude that the airflow velocity during runningsignificantly affects frequency. For Athletes 1 and 2, there is a noticeably small increase infrequency when transitioning from the headwind to the backwind.
Symmetry 2021, 13, x FOR PEER REVIEW 13 of 18
All of the runners are characterised by a descending curve, from high wind speeds to the chest (+8 m/s) to the lowest values of the ratio and high backwinds (—5 m/s). From the curve courses of the diagram shown in Figure 17, the ratio of “useful force” repre-sented by the acceleration force relative to the braking force is reduced.
Figure 17. Relationship between the acceleration and deceleration force for individual athletes under different aerodynamic conditions.
Figure 18 shows the time-averaged frequencies of individual athletes with different aerodynamic airflow characteristics in the wind tunnel. The course of the diagrams for the individual athletes shows a significant difference between the step frequencies of individ-ual athletes. However, we cannot conclude that the airflow velocity during running sig-nificantly affects frequency. For Athletes 1 and 2, there is a noticeably small increase in frequency when transitioning from the headwind to the backwind.
Figure 18. Running frequency of individual athletes, depending on aerodynamic characteristics.
When comparing contact and flight times as shown in the Figure 19, we can notice that the contact phase is significantly longer than the flight phase for all athletes. A recip-rocal course of values is also noticeable, which means that those variables’ curves are mir-rored according to wind speed. This characteristic is most pronounced in Athletes 2 and
Figure 18. Running frequency of individual athletes, depending on aerodynamic characteristics.
When comparing contact and flight times as shown in the Figure 19, we can noticethat the contact phase is significantly longer than the flight phase for all athletes. A re-ciprocal course of values is also noticeable, which means that those variables’ curves aremirrored according to wind speed. This characteristic is most pronounced in Athletes 2and 3. Because of the specific conditions of the treadmill, runners generally have longercontact phases and shorter flight phases, regardless of the aerodynamic conditions in thewind tunnel.

Symmetry 2021, 13, 505 14 of 18
Symmetry 2021, 13, x FOR PEER REVIEW 14 of 18
3. Because of the specific conditions of the treadmill, runners generally have longer contact phases and shorter flight phases, regardless of the aerodynamic conditions in the wind tunnel.
Figure 19. Contact times (A) and flight phases (B) of individual athletes depending on aerody-namic characteristics.
4. Discussion In the present study, the biomechanics of running in the wind tunnel was studied
with respect to airflow velocity and direction (headwind vs. backwind in relation to the runner on the treadmill). The experiment assumed homogeneous airflow at selected nom-inal speeds, which was achieved while using different integral parameters of axial fans that were embedded in the wind tunnel. However, it is worth noting that running is a complex cyclic movement, predominantly determined by step frequency and stride length. Both parameters are interdependent and individually determined by central regula-tory processes of movement, biomotor abilities, energy processes, and morphological charac-teristics [13–15,19,22].
Figure 19. Contact times (A) and flight phases (B) of individual athletes depending on aerody-namic characteristics.
4. Discussion
In the present study, the biomechanics of running in the wind tunnel was studiedwith respect to airflow velocity and direction (headwind vs. backwind in relation tothe runner on the treadmill). The experiment assumed homogeneous airflow at selectednominal speeds, which was achieved while using different integral parameters of axialfans that were embedded in the wind tunnel. However, it is worth noting that runningis a complex cyclic movement, predominantly determined by step frequency and stridelength. Both parameters are interdependent and individually determined by centralregulatory processes of movement, biomotor abilities, energy processes, and morphologicalcharacteristics [13–15,19,22].
4.1. The Analysis of the Running Topology and the Forces Measurement on the Treadmill Surface
The time series of the vertical force on the running belt (blue) shows the typical courseof force Fvert(t) of the left—L and right—R foot, which is repeated throughout the course ofthe experiment in seemingly stationary chronological sequence. Minor differences betweenthe loads of the left and right foot can be observed. This is expected based on the trainingpattern of the athletes. According to some studies, trained runners generally have verylittle asymmetry of force development between the left and right leg; the asymmetryis less than 1.5% [13,18,23]. The red curve on the diagram represents the braking andaccelerating phase of the runner’s take-off on the running belt. The time series betweent0 to t2 represents the braking phase, and the t2 to t3 interval represents the accelerationphase. At this point, it is worth noting that, during the analysis of the dynamics shownin Figure 4 (the transition from A to B), time segments were selected when the runner’sleft or right leg generated a vertical force on the surface of the running belt. Figure 4Billustrates the occurrence of a “delayed” horizontal force signal behind the vertical force, atits transitional point where the values shift from positive to negative. This phenomenonis attributed to the force transfer properties from the running belt to the runner’s foot (atcontact) onto the horizontal force sensors. This transfer occurs due to the deformabilityof the belt, mechanical transmissions between the belt and the underlying support rollers,and the force sensors. It is assumed that the time delay is a function of the mechanicalproperties of the set of individual elements and the airiness between each of them, whichresults in the time delay of the measured signal. We also estimate that this phenomenondoes not significantly affect the amplitude of the measured horizontal forces.
Based on the analysis of Figure 5 through Figure 8, the kinematics of a runner’s rightfoot, during the contact phase, can be determined in the frontal view. Figure 5 capturesthe moment that the runner’s foot touches the running belt. This moment is part of theinitial contact phase. As such, a vertical force appears on the sensors, which decreases to a

Symmetry 2021, 13, 505 15 of 18
value of 0 in Figure 8 via the extreme of the Fx force in Figure 6, when the contact phase iscompleted. In turn, in Figures 9–12, we can track the transfer of foot load from the heel,over the entire foot, through to the take-off phase, which ends on the front of the foot. Indoing so, the leg is again extended in the ankle, knee, and hip joints. The analysed contactphase was selected from the captured running segment when the airflow velocity in thewind tunnel was equal to v = 0. Each of the images consist of a snapshot of the foot onthe running belt and the corresponding value of the vertical force Fy, and the horizontalforce Fx, which is marked for a given time series by a point on the diagram of forces Fx(t)and Fy(t). In this section of the analysis, we focused on the momentary position of thefoot on the running belt and the corresponding values of the forces that represent the footreaction forces onto the belt. The curves in each figure represent the course of the Fx andFy reaction forces on the running surface, as measured by the built-in sensors during thetime interval of the stride, consisting of the right foot’s take-off from the belt. The redcurve illustrates the Fy reaction force’s course in the vertical direction, and the blue curverepresents the course of the horizontal Fx reaction force. Each of these curves representsthe momentary sum of the measured values: the red curve—the sum of four values in thevertical direction, calculated according to Equation (1); the blue curve—the sum of theforces, calculated according to Equation (2), in the horizontal wind tunnel. Points on thediagrams of the momentary force values that belong to the displayed image are shownnext to the diagrams.
4.2. The Impact of Airflow on Kinematic and Dynamic Characteristics of Running
Wind direction is determined by the sign (+ for backwind) and (− headwind). Table 4shows that each runner only completed a certain number of tests, which is be presentedbelow in the analysis. The diagrams presented in Figure 13 show the distributions of thevertical loads-reaction forces Fy at the time intervals of the runner’s contact phase withthe running belt. The curves represent the average force values at intervals over the entireduration of the run at individually selected airflow velocities in the wind tunnel.
Table 4. Average Wind Speeds in the Meridian Plane of the Wind Tunnel.
V1 (m/s) V2 (m/s) V3 (m/s) V4 (m/s) V5 (m/s)
Athlete 1 5 3 0 −5 −7Athlete 2 5 3 0 −5Athlete 3 3 0 −5 −7
In order to understand the importance of ground reaction forces (GRF), which aredirectly related to an athlete’s acceleration during a run, it is necessary to incorporateexperimental methods that allow for the measurement of acceleration using differenttime and locational scales. On this topic, we would like to mention the contributionsof Morin [18,24], who, together with his co-authors, introduced a new method wherebasic kinetics and sprinter forces are analysed simultaneously on a 60 m surface. Thedeveloped expert system allows for the measurement of longitudinal and vertical reactionforces that formed in the contact phases of running. However, it should be noted thatthe interacting effects of the airflow around the runner, which, through the forces ofaerodynamic resistance, affect the production of longitudinal and vertical reaction forces,and the associated energy efficiency of the run. The maximum impact of airflow is presentfor the horizontal force Fx, during the acceleration phase of the take-off from the runningsurface (Figure 16C). The maximum take-off forces are present at high airflow velocities atthe runner’s chest (headwind−). In contrast, the take-off force is the smallest at high airflowvelocities directed at the runner’s back (backwind +). This phenomenon is present for allrunners. The ratio between acceleration force and braking force for individual athletesunder different aerodynamic conditions is an important measure of running efficiency.
This can be interpreted as meaning that the energy (which is proportional to theabove-mentioned ratio) required to run with a backwind is lower. Hence, less effort is

Symmetry 2021, 13, 505 16 of 18
needed for the runner to run. The contact phase is undoubtedly a key kinematic factor,which defines the sprinting efficiency in terms of the relationship between the braking andthe propulsive (useful) phase. This ratio should be 40%: 60% [18,25,26]. The shorter thebraking phase, the lower the reduction of the horizontal velocity of the runner.
It is worth noting that running is a complex cyclic movement, which is predominantlydetermined by step frequency and stride length. Both parameters are interdependent andindividually determined by central regulatory processes of movement, biomotor abilities,energy processes, and morphological characteristics [13–15]. Running, as a movementstereotype, consists of repeating steps in a unit of time. The stride length mainly dependson an athlete’s body height, or the length of the leg and the force developed by theextensors of the hip, knee, and ankle joints during the contact phase. Moreover, it shouldbe emphasised that reducing this ratio results in the reduction of the runner’s energyconsumption. Rationalisation while running under specific conditions (running in water,running downhill, duet running) is a trend in the current training programs for runners thatavoids overloading the knee and ankle joints, the muscular system, and the feet [11–13].Subsequently, we can conclude that the frequency largely depends on an athlete’s geneticsand less on the marginal conditions of the airflow in which the running takes place. Toa large extent, the frequency depends on the stride length; as the stride length increases,the frequency decreases as compensation. This principle is organised by a “movementprogram” in the central nervous system [26,27].
The contact phase’s execution is one of the most important generators of runningefficiency [13,28]. The contact phase must be as short as possible with an optimal ratiobetween the braking and propulsion phases. In recent times, this problem has beenexperimentally and analytically researched by Morin et al. [17], who have found thatsprinters are faster the more they produce the maximum amount of horizontal net pulseper unit of a runner’s body weight. The execution of the contact phase is one of the mostimportant running speed efficiency generators [13,29–32]. The contact phase must beas short as possible with an optimal ratio between the braking and propulsion phases.The relationship between the contact time and flight time for each runner is individuallydefined and automatic. In as short contact phase as possible, the runner must develop asmuch ground reaction force as possible. The flight phase directly depends on the groundreaction force [31]. Our experiment showed that the contact time differs between runners.That of Athlete 1 is slightly shorter (0.15 s) than that of Athletes 2 and 3 (0.20 s). The contacttimes are significantly longer on the treadmill than, under normal circumstances, whenrunning on an athletic tartan track. The average contact time of middle-distance runners ona standard tartan track is 112 milliseconds, and 80 milliseconds for sprinters [15,19,28,33].Based on Figure 13, we can see that, on average, our athletes have contact times longerthan 0.15 s. Therefore, efficient running speed is basically the optimal ratio between contacttime and the flight phase [34,35]
5. Conclusions
The results show changes in the ratio of contact and flight phases, and lower runningloads in the vertical direction. The maximum forces at take-off are greater than whenrunning with a backwind. Step frequency could not be found to depend on airflow. Inthe future, research should be continued and improved by synchronising kinetics andkinematics, improving airflow control, and increasing the number of participants in themeasuring sample, enabling a greater generalisation of the research results. Understandingthe biomechanics of running can undoubtedly represent a significant contribution to thetraining design, both in efficiency and injury prevention. Additionally, the field of sportsbiomechanics, as well as certain other areas of sports science, depend on the progress oftechnologies that are available for human movement research.
Symmetry 2021, 13, 505 17 of 18
Author Contributions: Conceptualization, B.Š., M.C.; methodology, B.Š.; M.C.; software, M.S.; J.G.;formal analysis, M.C.; investigation, M.C., B.Š., J.G.; M.S.; a resources, M.C., B.Š.; M.C.; data curation,J.G.; M.C.; writing—original draft preparation, K.M., M.C.; B.Š.; writing-review and editing, B.Š.;K.M., M.C.; B.Š.; K.M.; supervision, K.M., B.Š.; M.C. All authors have read and agreed to the publishedversion of the manuscript.
Funding: This research was financially support by the Slovenian Research Agency (ARRS).
Institutional Review Board Statement: The study design was approved by the Human EthicsCommittee of the University of Ljubljana.
Informed Consent Statement: Informed consent was obtained from all subjects involved in the study.
Data Availability Statement: The data presented in this study are openly available on [repository]and on request from the corresponding author.
Acknowledgments: We would like to thank the runner for participating in the experiment and thehead of NC Planica Jelko Gros for allowing us to perform the experiments in the wind tunnel.
Conflicts of Interest: The authors have no conflict of interest to declare. The results do not constituteendorsement of any product or device. The authors would like to thank the sprinters who participatedin this study.
References1. Davis, C.T. Effects of wind assistance and resistance on the forward motion of a runner. J. Appl. Physiol. 1980, 48, 702–709.
[CrossRef]2. Saraslanidis, P. Training for the improvement of maximum speed: Flat running or resistance training? New Stud. Athl. 2000,
15, 45–51.3. De Witt, J.K.; Lee, S.M.; Wilson, C.A.; Hagan, R.D. Determinants of time to fatigue during nonmotorized treadmill exercise. J.
Strength Cond. Res. 2009, 23, 883–890. [CrossRef] [PubMed]4. Fullenkamp, A.M.; Matthew Laurent, C.; Campbell, B.M. Automated gait temporal-spatial assessment fromnon-motorized
treadmill belt speed data. Gait Posture 2015, 41, 141–145. [CrossRef] [PubMed]5. Stevens, C.J.; Hacene, J.; Wellham, B.; Sculley, D.V.; Callister, R.; Taylor, L.; Dascombe, B.J. The validity of endurance running
performance on the Curve 3TM non-motorised treadmill. J. Sports Sci. 2014, 33, 1141–1148. [CrossRef]6. Gonzalez, A.M.; Wells, A.J.; Hoffman, J.R.; Stout, J.R.; Fragala, M.S.; Mangine, G.T.; McCormack, W.P.; Townsend, J.R.; Jajtner,
A.R.; Emerson, N.S.; et al. Reliability of the Woodway curve non-motorized treadmill for assessing anaerobic performance. J.Sports Sci. Med. 2013, 12, 104–108. [PubMed]
7. Mangine, G.T.; Hoffman, J.R.; Gonzalez, A.M.; Wells, A.J.; Townsend, J.R.; Jajtner, A.R.; McCormack, W.P.; Robinson, E.H.; Fragala,M.S.; Fukuda, D.H.; et al. Speed, force, and power values produced from nonmotorized treadmill test are related to sprintingperformance. J. Strength Cond. Res. 2014, 28, 1812–1819. [CrossRef]
8. Rae, W.H.; Pope, A. Low-Speed Wind Tunnel Testing, 2nd ed.; John Wiley & Sons: New York, NY, USA, 1984.9. National Aeronautics and Space Administration. Wind-Tunnel Model Systems Criteria; Langley Research Center: Hampton, VA,
USA, 2015.10. Placek, R. Errors and problems while conducting research studies in wind tunnel-selected examples. Trans. Inst. Aviat. 2016,
4, 69–177.11. Ito, S. Aerodynamic effects by marathon pacemakers on a main runner. Trans. Jpn. Soc. Mech. Eng. Ser. B 2006, 73, 1975–1980.
[CrossRef]12. Hirata, K.; Okayama, T.; Teraoka, T.; Funaki, J. Precise aerodynamic measurement of track runner using a wind-tunnel moving-belt
system. Procedia Eng. 2012, 34, 32–37. [CrossRef]13. Tatsuya, I.; Takafumi, O.; Takahiro, T.; Satoshi, M.; Hirata, K. Wind-tunnel experiment on aerodynamic characteristics of a runner
using a moving-belt system. Cogent Eng. 2016, 3, 1231–1389.14. Mero, A. Force-Time Characteristics and Running Velocity of Male Sprinters during the Acceleration Phase of Sprinting. Res. Q.
1988, 59, 94–98. [CrossRef]15. Gambetta, V. Essential consideration for development of teaching model for 100 m sprints. New Stud. Athl. 1991, 1, 36–42.16. Donatti, A. The development of stride lenght and frequency in sprinting. New Stud. Athl. 1995, 10, 51–66.17. Morin, J.B.; Sève, P. Sprint running performance: Comparison between treadmill and field conditions. Eur. J. Appl. Physiol. 2011,
111, 1695–1703. [CrossRef]18. Morin, J.B.; Samozino, P.; Bonnefoy, R.; Edouard, P.; Belli, A. Direct measurement of power during one single sprint on treadmill.
J. Biomech. 2010, 43, 1970–1975. [CrossRef]19. Novacheck, T. The biomechanics of running. Gait Posture 1998, 7, 77–95. [CrossRef]20. Mero, A.; Komi, P.; Gregor, R. Biomechanics of Sprint Running. Sport Med. 1992, 13, 376–392. [CrossRef] [PubMed]21. Shanebrook, J.R.; Jaszczak, R.D. Aerodynamic drag analysis of runners. Med. Sci. Sports Exerc. 1976, 8, 43–45. [CrossRef]

Symmetry 2021, 13, 505 18 of 18
22. Kyle, C. Reduction of wind resistance and power output of racing cyclists and runners travelling in groups. Ergonomics 1979,22, 387–397. [CrossRef]
23. Mackała, K.; Fostiak, M. Acute effects of plyometric intervention—Performance improvement and related changes in sprintinggait variability. J. Strength Cond. Res. 2015, 29, 1956–1965. [CrossRef]
24. Mann, R.; Sprague, P. A kinetic analysis of the ground leg during sprint running. Res. Q. Exerc. Sport 1980, 51, 334–348. [CrossRef]25. Mero, A.; Komi, P. Electromyographic activity in sprinting at speed ranging from sub-maximal to supra-maximal. Med. Sci. Sports
Exerc. 1987, 19, 266–274. [CrossRef]26. Morin, J.B.; Dalleau, G.; Kyrolainen, H.; Jeannin, T.; Belli, A. A simple method for measuring stiffness during running. J. Appl.
Biomech. 2011, 21, 167–180. [CrossRef] [PubMed]27. Luhtanen, P.; Komi, P. Force-, power- and elasticity-velocity relationship in walking, running and jumping. Eur. J. Appl. Physiol.
1980, 44, 79–289. [CrossRef]28. Morin, J.B. Sprint Running Mechanics New technology, new concepts, new perspectives. Aspetar Sports Med. J. 2020, 2, 326–332.29. Young, W. Laboratory strength assessment of athletes. New Stud. Athl. 1995, 10, 89–96.30. Bret, C.; Rahmani, A.; Dufour, A.; Messonnier, L.; Lacour, J. Leg strength and stiffness as ability factors in 100 m sprint running. J.
Sports Med. Phys. Fit. 2002, 42, 274–281.31. Delecluse, C.; Coppenolle, H.; Goris, M. A model for the scientific preparation of high level sprinters. New Stud. Athl. 1992,
7, 57–64.32. Prampero, P.; Fusi, S.; Sepulcri, J.; Morin, B.; Belli, A.; Antonutto, G. Sprint running: A new energetic approach. J. Exp. Biol. 2005,
208, 2809–2816. [CrossRef]33. Cronin, J.; Hansen, T. Strength and power predictors of sports speed. J. Strength Cond. Res. 2005, 19, 349–357. [PubMed]34. Nicol, C.; Avela, J.; Komi, P. The Stretch-Shortening Cycle. Sports Med. 2006, 36, 977–999. [CrossRef] [PubMed]35. Hay, J. The Biomechanics of Sports Techniques, 4th ed.; Prentice Hall: Upper Saddle River, NJ, USA, 1993.