7th Biennial Stormwater Research and Watershed Management Conference

Application of the
Watershed Treatment Model for a
Countywide Watershed Implementation Plan in the
Chesapeake BayNick Lindow
Biohabitats, Inc.
Meosotis Curtis and Steve ShofarMontgomery County DEP
September 27, 2011

OverviewI. The New Framework
i. Locationii. Regulationsiii. Restoration
II. History of the Practice
III. Environmental Site Design Approach
IV. Modeling Framework
V. Targeting Strategy
VI. Results and Lessons Learned

Location
• Montgomery County, MD
– 500 sq. miles
– 940,000 people
– About 12% impervious cover
• Second only to Baltimore City within
MD in average people per square mile
• Potomac and Patuxent River
Watersheds

Regulations
• 2010 NPDES Stormwater Permit– Restoration – 20% Retrofit– TMDL Wasteload Allocations– Trash Reduction– Develop Implementation Plans*– Track Progress*
• 2010 MDE Stormwater Manual – requirements for new and re-development have changed – ESD to the MEP

History of the Practice
Pre-1984 Stormwater LawPre-1984 Stormwater Law
1984 Stormwater Law- 2000 Stormwater Manual1984 Stormwater Law- 2000 Stormwater Manual
2010- ESD to the MEP Required2010- ESD to the MEP Required

ESD Approach

History of the Practice

Bacteria?
ESD = 75% Removal
Fecal Coliforms
Fecal Coliforms
E. ColiE. Coli
EnterrococciEnterrococci

Trash?

Modeling Framework

Watershed Treatment Model
BMPs• Performance
Code• Removal
Efficiency
Discount Factors• BMP specific• Treatability
Factor
Pollutant Reduction• Applied to
baseline load
Land Use• EMC
(Urban)• Unit Load
(Non-urban)
Soils & Rainfall• Annual
Runoff Volume
Pollutant Load• Before• treatment

TMDL “Calibration”
• TMDL Onion– Land use discrepancies with Waste Load
Allocations– Differences in Pollutant Sources– Watershed-specific EMCs or loading rates
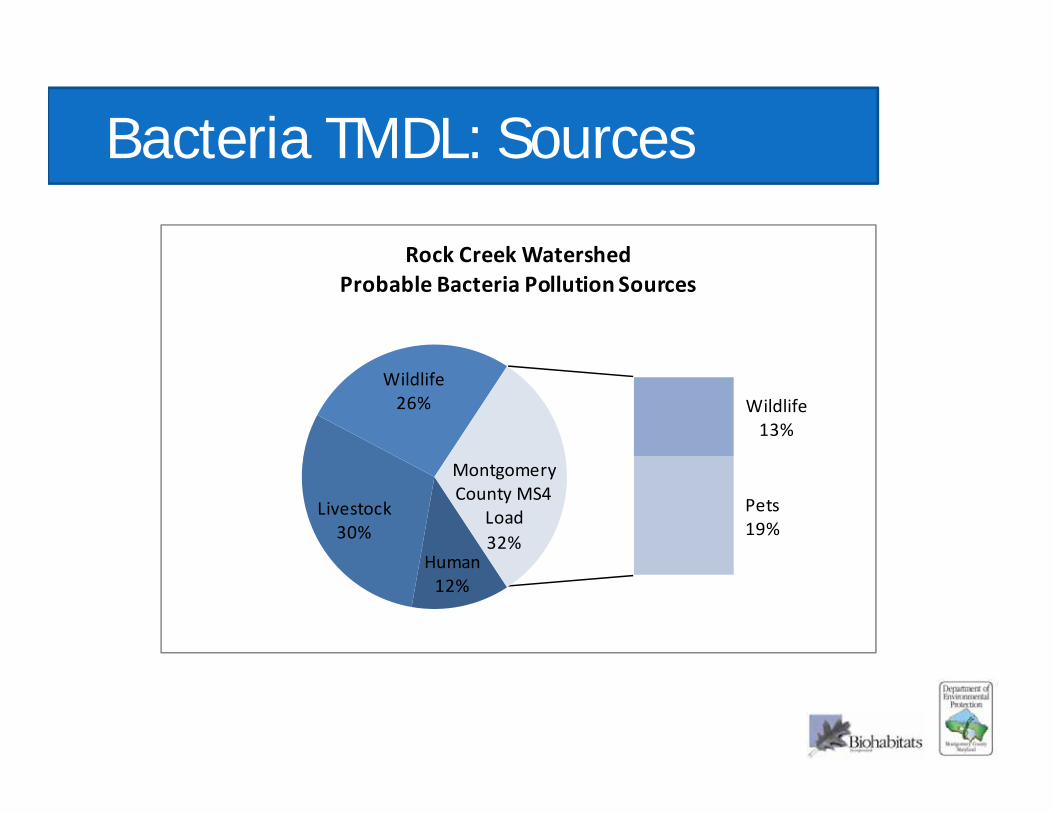
Bacteria TMDL: Sources
Human12%
Livestock30%
Wildlife26% Wildlife
13%
Pets19%
Montgomery County MS4
Load32%
Rock Creek Watershed Probable Bacteria Pollution Sources

Strategies
• Structural Management Practices• Habitat Restoration
– Reforestation– Stream Restoration
• Programmatic Practices– Pet Waste Education– Lawn Care Education– Street Sweeping

Targeting Strategy
• Hotspots

Targeting Strategy
• Impervious Surfaces

Targeting Strategy
• County-owned Land
Targeting Strategy
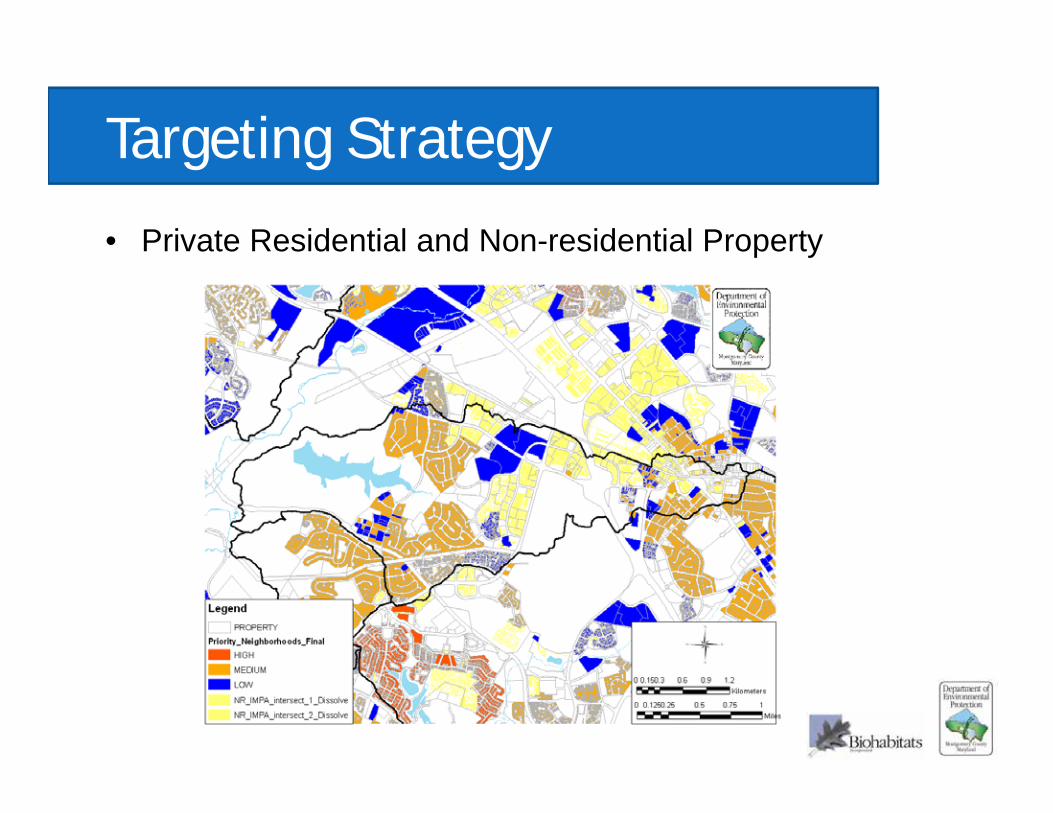
• Private Residential and Non-residential Property
Targeting Strategy
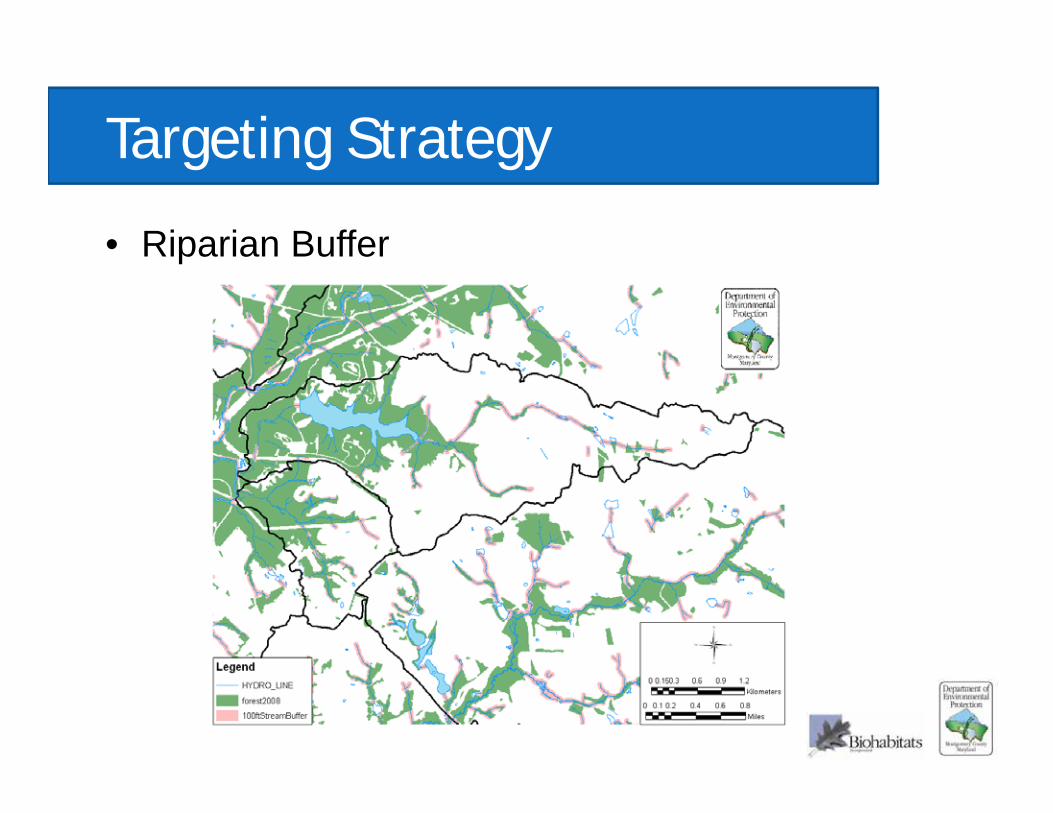
• Riparian Buffer

Targeting Strategy
• Outreach and Education

Bacteria TMDL: Tracking Progress
$- $100 $200 $300 $400 $500 $600 $700 $800 $900
0%10%20%30%40%50%60%70%80%90%
100%
Cos
t (M
illio
n $)
Bac
teria
l Red
uctio
n (%
of B
asel
ine)
Implementation Phase
Bacterial Load Reduction
TMDL WLA Target
Cost

Cost of Restoration

Lessons Learned
• Don’t bite off more than you can chew– Technical and Financial Assistance Required– Local government leadership– Better and more incentives– Third party (e.g., watershed organizations, HOAs,
community groups) support and involvement• Restoration will require more than ESD
– Integration of green infrastructure with stormwatermanagement practices/techniques
– Habitat creation & land conversion– Programmatic Practices & Education
• Human behavior– Increased conservation and preservation ethic