Application of Statistical Techniques in Group Insurance · Moving Forward to the 21 st Century...
32
Application of Statistical Techniques in Group Insurance Chit Wai Wong, John Low, Keong Chuah & Jih Ying Tioh © AIA Australia This presentation has been prepared for the 2016 Financial Services Forum. The Institute Council wishes it to be understood that opinions put forward herein are not necessarily those of the Institute and the Council is not responsible for those opinions.
Transcript of Application of Statistical Techniques in Group Insurance · Moving Forward to the 21 st Century...

Application of Statistical Techniques in Group Insurance
Chit Wai Wong, John Low, Keong Chuah & Jih Ying Tioh
© AIA Australia
This presentation has been prepared for the 2016 Financial Services Forum.
The Institute Council wishes it to be understood that opinions put forward herein are not necessarily those of the Institute and the Council is not
responsible for those opinions.

Agenda • Background and Motivation • Stochastic Claims Techniques and Applications • Generalised Linear Models and Applications • GLM Case Study: Understanding What Drives TPD Claim Delays

Some Relevant Developments within General Insurance
1993
Thomas Mack Standard Error of
Chain Ladder
England & Verrall Stochastic Claims
Reserving
2002
Research with applications in
pricing? Based on non-aggregated
data?
2008
Mario Wüthrich Stochastic Claims
Reserving for Solvency Purposes
To Date 1970’s
Basic Chain
Ladder
Generalised Linear
Models

Moving Forward to the 21st Century
Anticipated Improvements in
data quality, Volume of data
available
Significant Improvements in
Computing power
Accessibility of Statistical packages
Further insights to be gained from using individual member data

Suggested Statistical Package R with RStudio as Integrated Development Environment
• Widely used by practising statisticians and researchers for statistical analysis
• Various built-in packages assessable to users who might not have very strong coding experience
• Has active user groups where questions can be asked and are often quickly responded to
• Free of charge and open source

Analysis Capabilities Need to Expand… The chain ladder and its deterministic variants are heavily used in almost all aspects of group insurance related work, but…
Deterministic chain ladder
GLM
Stochastic methods
Additional insights potentially lead to
Enhanced pricing, reserving and capital
management
Optimised Return on Capital

STOCHASTIC CLAIMS TECHNIQUES AND APPLICATIONS

Stochastic Claims Models
Simplified Models • Reflective of key drivers of claims profile • Reduced policy/member data and
computing requirements • Setting of homogenous groups with
sufficient credibility
Full Models • Most reflective of claims profile • Needs policy/member data • Needs computing power
• Many variants of stochastic models have emerged over the last 30 years in the general insurance area
• Most of these models are chain ladder based
• Some are easy to implement in spreadsheets through bootstrapping method
• Full models using individual data could be more popular as computing power increases

Why Stochastic Claims Models?
99.5%
Provide measure of variability
Provide predictive distribution - Provide more than just mean and variance - Link probability to amount at risk - Useful in setting risk margins – pricing, capital - Could be extended to enterprise value at risk
Produce asymmetric distributions - Avoid understating the tail
Pricing options and guarantees - Profit share for group life business

Capital Risk Margins Calibration • Stochastic chain ladder models could be
used to understand IBNR distributions at the aggregated level or by accident/incurred years
• Support the calibration of risk margins on IBNR
• Most models can produce asymmetric distributions to avoid understating the tail
• Some variations could be implemented in Excel
• R has a very comprehensive package
AY/DY 1 2 3 4 5 6 7
2007 3,855 3,428 2,057 1,374 1,037 598 340
2008 3,979 3,538 2,123 1,418 1,070 618 272
2009 4,263 3,791 2,274 1,519 1,146 615 270
2010 3,992 3,549 2,129 1,423 986 710 163
2011 4,217 3,750 2,250 2,139 901 742 232
2012 5,108 4,542 2,618 2,067 1,214 921 356
2013 6,283 5,812 3,191 2,424 1,415 915 295
IBNR distributions by incurred year All Years 2011 2012 2013
#ChainLadder package
https://cran.r-project.org/web/packages/ChainLadder/ChainLadder.pdf
Simulate

Profit Share Pricing • Profit share arrangement
creates asymmetric return for the insurer
• The variability of claim outcomes will need to be considered when setting the cost of the profit share
Profit Share Pricing
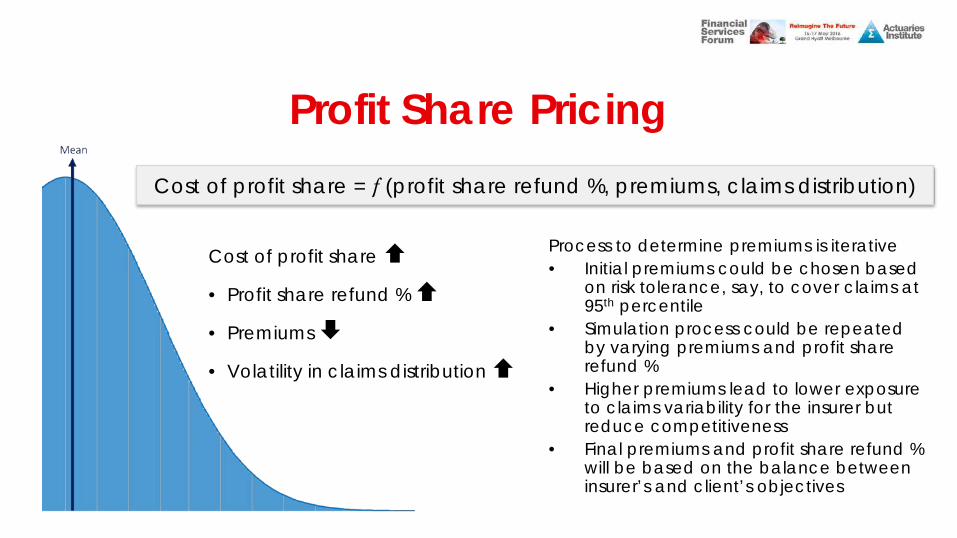
Process to determine premiums is iterative • Initial premiums could be chosen based
on risk tolerance, say, to cover claims at 95th percentile
• Simulation process could be repeated by varying premiums and profit share refund %
• Higher premiums lead to lower exposure to claims variability for the insurer but reduce competitiveness
• Final premiums and profit share refund % will be based on the balance between insurer’s and client’s objectives
Cost of profit share = f (profit share refund %, premiums, claims distribution)
Cost of profit share • Profit share refund % • Premiums
• Volatility in claims distribution

GENERALISED LINEAR MODEL AND APPLICATIONS

A statistical model that relates a response variable to a set of explanatory variables (rating factors)
Generalised Linear Model
Response Variables Examples
Incidence rate
Lodgement delay
Lapse rate
Termination rate
Explanatory Variables Examples
Age
Smoking status
Gender
Policy Duration

Why Use Generalised Linear Model?
Moving away from one-way analysis
One way analysis does not take into account of correlations between factors
GLM is multivariate which allows for correlations and interactions between factors. Rating factors can be ranked and discovery of new rating factors is made easier using statistical packages.
3

/ =Link ratio
Why Use Generalised Linear Model?
Moving from aggregated data to individual data Group insurance claims analysis
are typically performed using aggregated data using the chain ladder approach. This approach will inform whether the delays are longer or shorter but not necessarily help us understand the drivers that are causing the delays.
The advantages: Further insights could be generated by identifying what drives claim delays using individual claims data. Volume and richness of data will continue to grow.
3
Claim ID Member ID Loss Date Reported Date Claim Paid Delay0005 M61868 5/06/2012 5/07/2012 200000 1.03005 M003 18/07/2014 16/10/2014 150000 3.003656 M30540 6/09/2010 25/03/2011 80000 6.69873 M2168 1/07/2011 29/10/2011 400000 3.9

Questions GLM Can Help Answer
Which are the most important
drivers of experience?
Which customer segments should
the business target?
Are there any interactions
between rating factors?
What is the optimal
grouping of rating factors?
What is the impact of rating factors on the
dependent variable?

Sourcing data for GLM analysis • GLM analysis not limited to data that is only available internally. • External sources of data can be linked to internal
data using postcodes to extend analysis.
Source: abs.gov.au and employment.gov.au
• Mitchell LGA example: – Community profiles: Top
employing industry is manufacturing, occupation profile light blue
– Economic data: Unemployment rate of 7.5% at Dec-15 quarter
– Socio-Economic Indexes for Areas (SEIFA): Area is not disadvantaged 2011
Can these factors help
explain claims
experience?

R can be used to visualise analysis.
Visualisations Higher Delay
+ Internal
Data
+ ABS Digital Boundaries
Data for Australia

CASE STUDY UNDERSTANDING WHAT DRIVES TPD CLAIM DELAYS? Using Generalised Linear Models

Background and Motivation
Can we utilise member level claims data to gain further insights into what could be driving claims delay?
With anticipated continued improvement in data quality and availability of external data..
Volatility in claim delay drives uncertainty in pricing, profit and capital reporting for Group Insurance
Incidence Lodgement
Claim Delay
Mis-estimation of claim delays by a few months could cost millions!

What Drives Claim Delay? Level of awareness often cited but can we dig deeper?
Level of Awareness
Cause of Claim
Claim Delay
Level of Unemployment
Age
Exposure to aggressive
lawyer advertising?
Level of Education
GLM was identified as the appropriate tool to: Uncover and test new factors Rank these factors by importance Define the appropriate banding for these
factors (eg. Age) Estimate the impact that the factors might
have on the claim delay

A forward selection algorithm may be used to identify rating factors. The process stops there are no improvement in explanatory power by adding more factors.
One-factor model
•Fit each of the remaining rating factors in turn
•Select the one-factor model that best fits the data
Multi-factor model
•Final model with statistically significant factors
Searching for Relevant Factors and Ranking them by Importance
Age Level of Awareness
Cause of
Claim
Claim Delay
Level of Unemployment
Age Exposure to aggressive
lawyer advertising?
Level of Education
Education
Fit additional factors, some may drop off..
#forward package https://cran.r-project.org/web/packages/forward/forward.pdf

[0,30) [30,40) [40,50) [50,55) [55,60) [60,70)
Rela
tive
Dela
y
Age Band
Longer
Shorter
Results presented relative to
Preservation Age
Indifferent? retirement is still far away
Q1: Are older members potentially more reliant on their cover and therefore may be more aware of their cover?
Claim Delay and Age
Level of Awareness
Cause of
Claim
Claim Delay
Level of Unemployment
Age Exposure to aggressive
lawyer advertising?
Level of Education
***
*** ***
R can be used to identify the appropriate age bands: Start with a model with an explanatory variable that contains all raw ages. R will highlight the ages that are statistically significantly different and will inform how the ages should be grouped.
Darker toned bars indicated higher numbers of claims in the group Higher number of * indicates higher statistical significance

Q2: Are certain causes of claim susceptible to longer delays?
Claim Delay and Cause of Claim Re
lativ
e De
lay
Longer
Shorter
*
*
* **
Small number of claims with significant
longer delays related to more
complicated conditions
Level of Awareness
Cause of
Claim
Claim Delay
Level of Unemployment
Age Exposure to aggressive
lawyer advertising?
Level of Education
Results presented relative to Conclusive diagnosis is potentially complex and could take time?
Social perception?
*** *
Cause of Claim Darker toned bars indicated higher numbers of claims in the group
Higher number of * indicates higher statistical significance

Q3: Are claimants who reside in areas where unemployment rates are high have relatively shorter claim delays?
Claim Delay and Unemployment
Higher Unemployment
Shorter Delay
High Unemployment
Shorter Claim Delay. Higher reliance?
Level of Awareness
Cause of
Claim
Claim Delay
Unemployment
Age Exposure to aggressive
lawyer advertising?
Level of Education Visualisation using

Q4: Do Solicitor Advertising affect the claim delay? Claims with solicitor representation may come in late as claimants were initially unaware of their cover.
Claim Delay and Solicitor Advertising
Yes Unknown No
Rela
tive
Dela
y
Solicitor Representation
Longer
Shorter ***
***
Level of Awareness
Cause of
Claim
Claim Delay
Level of Unemployment
Age Exposure to aggressive
lawyer advertising?
Level of Education
Late onset awareness influenced by advertising?
Higher number of * indicates higher statistical significance
Results presented relative to

Other factors to consider…
Level of Awareness
Claim Delay
Whether the member have
access to a financial planner?
Frequency and form of communication
between Superannuation funds
and its members
Other transactional data (payment
reminder notices)
Socio-economic status (consumer
profiling based on residential address) Claims
management process
Type of cover: Default vs. Opt-in vs. Underwritten
Cover

Additional Insights and Potential Benefits
Age
Better segmentation of risk, assessment of ultimate claim cost
and trends in awareness levels
Cause of Claim
Unemployment
Additional Rating Factors
More accurate reserving
Enhanced pricing based on
characteristics of customers under the
scheme
Optimised return on capital
Inform
Potential Benefits
and others…

Conclusion • Stochastic claims models and GLM are tools that can be used to
unravel useful additional insights • With the continued increase in computing power and increased
access to quality data, these techniques become easier to implement
• Results should not be viewed mechanically without judgement
No models are correct, but some are useful!

DISCLAIMER The content is current as at the date set out on the cover page of this presentation and may be subject to change. This presentation provides general information only, without taking into account the objectives, financial situation, needs or personal circumstances of any individual. This presentation may contain projections concerning financial information and statements concerning future economic performance and events, plans and objectives relating to management, operations, products and services, and assumptions underlying these projections and statements. It is possible that actual results and financial conditions may differ, possibly materially, from the anticipated results and financial condition indicated in these projections and statements.
Thank You

References England, PD and Verrall, RJ (2002) Stochastic Claims Reserving in General Insurance Abs.gov.au Demographic profiles, Socio economic indexes Employment.gov.au Unemployment rate https://cran.r-project.org/web/packages/ChainLadder/ChainLadder.pdf Chain Ladder R package https://cran.r-project.org/web/packages/forward/forward.pdf Forward search R package