Application of Servqual Method for Evaluate Service Quality of Saderat...
13
POLISH JOURNAL OF MANAGEMENT STUDIES Khodaparasti R.B., Gharebagh M.K. 2015 Vol.11 No2 37 APPLICATION OF SERVQUAL METHOD FOR EVALUATE SERVICE QUALITY OF SADERAT BANK IN URMIA, IRAN Khodaparasti R.B., Gharebagh M.K. * Abstract: This research was conducted to evaluate the quality of services offered to customers at Saderat bank branches by using SERVQUAL model. In this research, survey level of the gap between expectations and service perceived by Saderat bank customers in each of the five dimensions of service quality. The ranking of service quality dimensions in order of importance from standpoint of customers and understanding level of customers' satisfaction with the quality of services offered by Saderat bank, as the main objectives of the research are considered. The research statistical population consisted of all the customers of Saderat Bank in Urmia City and 228 customers of this bank were sampled. To test the research hypotheses, software SPSS 18 and Paired-Samples T-Test, Wilcoxon test and Friedman test were used. The results of this research show that in all aspects, Saderat bank customers’ expectation is higher than their perceptions of the quality of services offered. It means that in all of the five dimensions of service quality, there are gaps. Thus the bank failed in any of these dimensions to meet their customers' expectations. Key words: SERVQUAL, service quality, banking services, perception, expectations. Introduction Better quality of services provided by the bank has a positive influence on satisfaction of its customers and it directly contributes to profitability of banking industry (Ladhari et al., 2011). Good quality of service provides numerous benefits to banking industry like better corporate image, enhancement in customer satisfaction, cross selling opportunities, decreased customers defection, increased chances of word to mouth recommendation and facilitates the maintenance of long term and good customer relationships (Bauman et al., 2007; Ehigie, 2006; Hawke and Heffernan, 2006; Wang et al., 2003). In modern banking system maintaining and developing long term customer relationships is essential for competitive business (Camarero, 2007). SERVQUAL is a well-known research instrument for evaluating service quality in banking industry. SERVQUAL perfectly covers the dimensions that are considered by a customer in evaluating quality of service in a bank. SERVQUAL can generally be applied for evaluating service quality in any service sector (Parasuraman et al., 1988). Most of the studies have utilized SERVQUAL for evaluating service quality of banking industry (Arasli et al., 2005; Zhou 2004; Chi Cui et al., 2003; Lam, 2002; Zhou et al., 2002; Othman and Owen, 2001). Many alternative instruments to SERVQUAL have also been applied in * Ramin Bashir Khodaparasti, PhD, Assistant professor in Urmia University, Faculty of Economics and Management, Department of Management, Morteza Kheirazar Gharebagh, Master of Arts Collegian, University of Urmia, Faculty of Economics and Management, Department of Management. corresponding author: nima_ramin85yahoo.com
Transcript of Application of Servqual Method for Evaluate Service Quality of Saderat...

POLISH JOURNAL OF MANAGEMENT STUDIES
Khodaparasti R.B., Gharebagh M.K.
2015
Vol.11 No2
37
APPLICATION OF SERVQUAL METHOD FOR EVALUATE
SERVICE QUALITY OF SADERAT BANK IN URMIA, IRAN
Khodaparasti R.B., Gharebagh M.K. *
Abstract: This research was conducted to evaluate the quality of services offered to
customers at Saderat bank branches by using SERVQUAL model. In this research, survey
level of the gap between expectations and service perceived by Saderat bank customers in
each of the five dimensions of service quality. The ranking of service quality dimensions in
order of importance from standpoint of customers and understanding level of customers'
satisfaction with the quality of services offered by Saderat bank, as the main objectives of
the research are considered. The research statistical population consisted of all the
customers of Saderat Bank in Urmia City and 228 customers of this bank were sampled. To
test the research hypotheses, software SPSS 18 and Paired-Samples T-Test, Wilcoxon test
and Friedman test were used. The results of this research show that in all aspects, Saderat
bank customers’ expectation is higher than their perceptions of the quality of services
offered. It means that in all of the five dimensions of service quality, there are gaps. Thus
the bank failed in any of these dimensions to meet their customers' expectations.
Key words: SERVQUAL, service quality, banking services, perception, expectations.
Introduction
Better quality of services provided by the bank has a positive influence on
satisfaction of its customers and it directly contributes to profitability of banking
industry (Ladhari et al., 2011). Good quality of service provides numerous benefits
to banking industry like better corporate image, enhancement in customer
satisfaction, cross selling opportunities, decreased customers defection, increased
chances of word to mouth recommendation and facilitates the maintenance of long
term and good customer relationships (Bauman et al., 2007; Ehigie, 2006; Hawke
and Heffernan, 2006; Wang et al., 2003). In modern banking system maintaining
and developing long term customer relationships is essential for competitive
business (Camarero, 2007). SERVQUAL is a well-known research instrument for
evaluating service quality in banking industry. SERVQUAL perfectly covers the
dimensions that are considered by a customer in evaluating quality of service in
a bank. SERVQUAL can generally be applied for evaluating service quality in any
service sector (Parasuraman et al., 1988). Most of the studies have utilized
SERVQUAL for evaluating service quality of banking industry (Arasli et al., 2005;
Zhou 2004; Chi Cui et al., 2003; Lam, 2002; Zhou et al., 2002; Othman and Owen,
2001). Many alternative instruments to SERVQUAL have also been applied in
* Ramin Bashir Khodaparasti, PhD, Assistant professor in Urmia University, Faculty of
Economics and Management, Department of Management, Morteza Kheirazar
Gharebagh, Master of Arts Collegian, University of Urmia, Faculty of Economics and
Management, Department of Management.
corresponding author: nima_ramin85yahoo.com

2015
Vol.11 No2
POLISH JOURNAL OF MANAGEMENT STUDIES
Khodaparasti R.B., Gharebagh M.K.
38
banking sector (Guo et al., 2008; Karapte et al., 2005; Jabnoun and Al-Tamimi,
2003; Aldlaigan and Buttle, 2002; Bahia and Nantel, 2000).
Literature review
The customer judgment of overall excellence about service quality of a service
sector is termed as perceived service quality (Parasuraman et al., 1988). This
judgment is based on difference that what a customer expect from his service
provider and what the actual service he receives from it (Parasuraman et al., 1988).
Numerous research instruments exists for measurement of service quality and
SERVQUAL is a well-known model (Ladahri, 2009) and it is assumption based that
comparison between the customer belief that what quality of service should be
provided by service deliver and the actual service received will give us the
perceived service quality of customer (Gronroos, 1984). SERVQUAL deals with
five service quality dimensions (Tangibles, Reliability, Responsiveness, Assurance,
and Empathy).The tangible elements deal with the availability of physical facilities,
equipment and personnel. Reliability is the ability of the service provider to
perform a service dependably and accurately. Responsiveness is concerned with
the willingness of service provider to assist customers and deliver prompt services.
Assurance means that customers can put their trust in service provider employees
and Empathy is individualized care and attention that customer receives from
service deliver (Parasuraman et al., 1988).
Review of some accomplished studies
Service quality of banking sector in Bangladesh was evaluated by Mizenur
Rahaman, et al. (2011). This study measuring service quality of PCBs (Private
Commercial Banks) in Bangladesh mainly studied on client expectation and
perception about the services on different five dimensions. The results of this
research show that PCBs have taken proper steps to ensure the clients satisfaction
on their services through quick response, reliable service, and giving assurance to
fulfil their expected requirements.
Bank service quality, customer satisfaction and loyalty in Ethiopian banking Sector
were investigated by Shanka (2012). The major aim of the research paper is to
measure the quality of service offered by private banks operating in Ethiopia. The
research proves that empathy and responsiveness plays the most important role in
customer satisfaction level followed by tangibility, assurance, and finally the bank
reliability. The research findings also indicate offering high quality service increase
customer satisfaction, which in turn leads to high level of customer commitment
and loyalty.
Ilyas, et al. (2013) evaluated the “perceived service quality” of banks in Pakistan.
In order to find the perceived service quality the mean score was obtained which
showed that “Empathy” had the highest value in expectation with 4.877 followed by
“Assurance” and “Responsiveness” and similarly on the perception side

POLISH JOURNAL OF MANAGEMENT STUDIES
Khodaparasti R.B., Gharebagh M.K.
2015
Vol.11 No2
39
“Reliability” had highest value with 4.85 followed by “Responsiveness” and
“Assurance”. Females are dissatisfied in tangibles as gap is negative but males are
satisfied in the same dimensions similarly in “Responsiveness” males are
dissatisfied but females are satisfied in this dimension which shows that perceived
service quality varies gender wise. The results of this research show that the
banking institutions are exceeding customer expectations in three dimensions i.e.
“Tangibles”, “Reliability” and “Responsiveness” and lacking other two dimensions
“Assurance” and “Empathy”. R. Ulewicz (2014) investigated the quality of
educational services at the University of higher education in management and
production engineering at the Faculty of Management of the Czestochowa
University of Technology using SERVQUAL method. The result of study shows
that the completion of the university with an established reputation can help in
a graduate career. There is therefore a necessity, not only statutory but also market,
to research quality and integrity of provided educational services.
The conceptual model of the research
The following conceptual model has been used in this article.
Figure 1. Research Conceptual model (Hagigi et al., 2004)
Research objectives
Evaluating the quality of services offered to customers’ at Saderat bank
branches by using SERVQUAL model;
The ranking of service quality dimensions in order of importance from
standpoint of customers;
Understanding level of customers’ satisfaction with the quality of services
offered by Saderat bank.
Hypotheses of research
From the above mentioned conceptual model and research objectives, the
following hypotheses are developed:
Tangibles
Reliability
Responsiveness
Assurance
Empathy
Perception
Expectation
Perceived Service Quality

2015
Vol.11 No2
POLISH JOURNAL OF MANAGEMENT STUDIES
Khodaparasti R.B., Gharebagh M.K.
40
Main hypothesis
There are significant differences between customers' expectations and
perceptions of service quality of Saderat bank.
Sub-hypothesis
There are significant differences between Saderat Bank customers' expectations
and perception of the tangibles dimention;
There are significant differences between Saderat Bank Customers’
expectations and perceptions of the reliability dimension;
There are significant differences between Saderat Bank Customers’
expectations and perceptions of the responsiveness dimension;
There are significant differences between Saderat Bank Customers’
expectations and perceptions of the assurance dimention;
There are significant differences between Saderat Bank Customers’
expectations and perceptions of the empathy dimention;
There are significant differences between the five dimention of quality in order
of importance from standpoint of Saderat Bank customers’.
Methodology of research
The present research in terms of target is applied research. Because the results of
this research can be useful for improving the quality of Saderat bank services.
Method of data collection is descriptive – survey. It means that in terms of data
collection method is descriptive research and survey on the basis of cross sectional.
In this research, the selected branches of cluster sampling and random method are
used. The statistical population of this research is customers of Saderat Bank
branches in Urmia, Iran. Since the statistical population was unlimited, therefore
the following formula was used to get the size of the sample:
The variance of the obtained answers from the primary sample was 0.148, and by
putting it in the above mentioned formula, the reliability level (α) was 95 percent,
and estimate accuracy (d) was 0.05, and the sample size was 228.
Information gathering tool
Information gathering tool in the present study were library studies and the questionnaires
that general framework is derived from the SERVQUAL model. The research
questionnaire consisted of two main parts. The first part was on specifications of
the respondent. Second part for evaluation customers' expectations and perceptions
of service quality of Saderat bank branches in Urmia. The second part of the
questionnaire consisted of 26 questions that measure five dimensions of service
quality of Saderat bank based on five-point Likert scale. The above mentioned
POLISH JOURNAL OF MANAGEMENT STUDIES
Khodaparasti R.B., Gharebagh M.K.
2015
Vol.11 No2
41
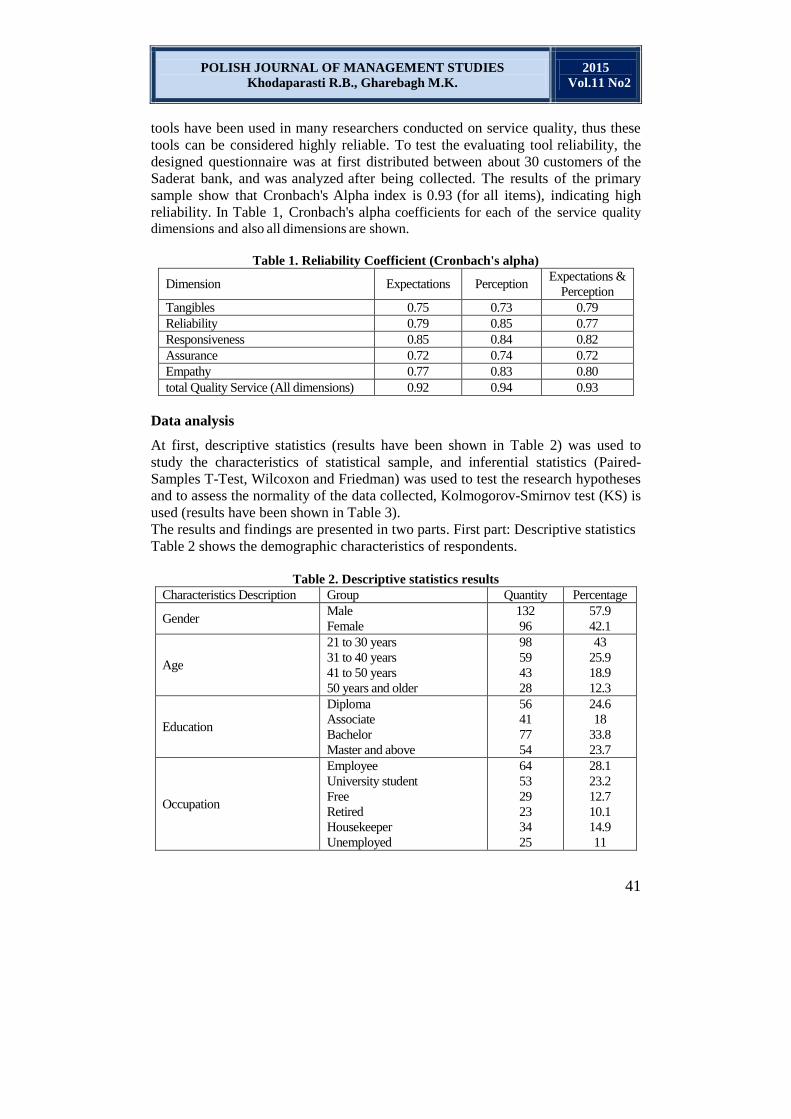
tools have been used in many researchers conducted on service quality, thus these
tools can be considered highly reliable. To test the evaluating tool reliability, the
designed questionnaire was at first distributed between about 30 customers of the
Saderat bank, and was analyzed after being collected. The results of the primary
sample show that Cronbach's Alpha index is 0.93 (for all items), indicating high
reliability. In Table 1, Cronbach's alpha coefficients for each of the service quality
dimensions and also all dimensions are shown.
Table 1. Reliability Coefficient (Cronbach's alpha)
Expectations &
Perception Perception Expectations Dimension
0.79 0.73 0.75 Tangibles
0.77 0.85 0.79 Reliability
0.82 0.84 0.85 Responsiveness
0.72 0.74 0.72 Assurance
0.80 0.83 0.77 Empathy
0.93 0.94 0.92 total Quality Service (All dimensions)
Data analysis
At first, descriptive statistics (results have been shown in Table 2) was used to
study the characteristics of statistical sample, and inferential statistics (Paired-
Samples T-Test, Wilcoxon and Friedman) was used to test the research hypotheses
and to assess the normality of the data collected, Kolmogorov-Smirnov test (KS) is
used (results have been shown in Table 3).
The results and findings are presented in two parts. First part: Descriptive statistics
Table 2 shows the demographic characteristics of respondents.
Table 2. Descriptive statistics results
Percentage Quantity Group Characteristics Description
57.9
42.1
132
96
Male
Female Gender
43
25.9
18.9
12.3
98
59
43
28
21 to 30 years
31 to 40 years
41 to 50 years
50 years and older
Age
24.6
18
33.8
23.7
56
41
77
54
Diploma
Associate
Bachelor
Master and above
Education
28.1
23.2
12.7
10.1
14.9
11
64
53
29
23
34
25
Employee
University student
Free
Retired
Housekeeper
Unemployed
Occupation

2015
Vol.11 No2
POLISH JOURNAL OF MANAGEMENT STUDIES
Khodaparasti R.B., Gharebagh M.K.
42
20.2
28.9
27.6
23.2
46
66
63
53
Up to 3 years
3 to 5 years
5 to 10 years
More than 10 years
Activity background With
Bank Saderat
89.9
10.1
205
23
Account in other banks
No accounts in other banks
Customers relationship with
other banks
Second part: Inferential statistics
Hypotheses testing should be done before the test of normality. In this study, for
test of normality, statistical hypotheses as follows:
H0: The distribution of data for each variable is normal.
H1: The distribution of data for each variable is not normal.
If the Kolmogorov-Smirnov Z test yields a significance level of more (>) than 0.05,
it means that the distribution is normal. According to the results in table 3, the
significance level in all dimensions except assurance, are more (>) than 0.05. It
means that the distribution of data for assurance variable is not normal and
therefore for hypothesis testing of this dimension (the fourth sub-hypothesis), the
Wilcoxon test was used. Due to normal distribution of the five other dimensions, to
test the hypotheses related to this five dimension, Paired-Samples T-Test is used.
Table 3. Kolmogorov-Smirnov Test results
Asymp. Sig. (2-tailed) Kolmogorov-Smirnov Z Dimension
0.10 1.22 Tangibles
0.06 1.30 Reliability
0.23 1.03 Responsiveness
0.02 1.49 Assurance
0.46 0.84 Empathy
0.72 0.69 total Quality Service (All dimensions)
Research Hypotheses Test
Main hypothesis testing
There are significant differences between customers' expectations and perceptions
of service quality of Saderat bank.
Thus, H0 and H1 hypotheses are set as follows:
H0: There are no significant differences between customers' expectations and
perceptions of service quality of Saderat bank ( ).
H1: There are significant differences between customers' expectations and
perceptions of service quality of Saderat bank ( ).
To test main hypothesis, Paired-Samples T-Test was used. As can be seen in Table 4, the calculated significance level is almost zero is less than 0.05 of error level. Thus
hypothesis H0 is rejected and hypothesis H1 is verified. So we can say with 95%
confidence that there are significant differences between customers' expectations

POLISH JOURNAL OF MANAGEMENT STUDIES
Khodaparasti R.B., Gharebagh M.K.
2015
Vol.11 No2
43
and perceptions of service quality of Saderat bank and customer’s expectation is
more than Bank’s performance.
Table 4. Paired Samples Test for main hypothesis testing
Paired Differences
t df Sig.
(2 tailed) Mean Std.
Deviation
Std.
Error
Mean
95% Confidence
Interval of the
Difference
Lower Upper
Pair 1 Expectation
- Perception 0.89 0.72 0.04 0.80 0.99 18.70 227 0.000
First Sub-hypothesis testing
There are significant differences between Saderat bank customers' expectations and
perceptions of the tangibles dimension.
Thus, H0 and H1 hypotheses are set as follows:
H0: There are no significant differences between Saderat bank customers' expectations and perceptions of the tangibles dimension ( ).
H1: There are significant differences between Saderat bank customers' expectations
and perceptions of the tangibles dimension ( ).
To test First Sub-hypothesis, Paired-Samples T-Test was used. As can be seen in
Table 5, the calculated significance level is almost zero is less than 0.05 of error
level. Thus hypothesis H0 is rejected and hypothesis H1 is verified. So we can say
with 95% confidence that there are significant differences between Saderat bank
customers' expectations and perceptions of the tangibles dimension.
Table 5. Paired Samples Test for first Sub-hypothesis testing
Paired Differences
t df Sig.
(2 tailed) Mean Std.
Deviation
Std.
Error
Mean
95% Confidence
Interval of the
Difference
Lower Upper
Pair 1
Tangibles
(Expectation)
Tangibles
(Perception)
0.81 0.76 0.05 0.71 0.91 16.31 227 0.000
Second Sub-hypothesis testing
There are significant differences between Saderat bank customers' expectations and
perceptions of the reliability dimension.
Thus, H0 and H1 hypotheses are set as follows:
H0: There are no significant differences between Saderat bank customers'
expectations and perceptions of the reliability dimension ( ).
2015
Vol.11 No2
POLISH JOURNAL OF MANAGEMENT STUDIES
Khodaparasti R.B., Gharebagh M.K.
44
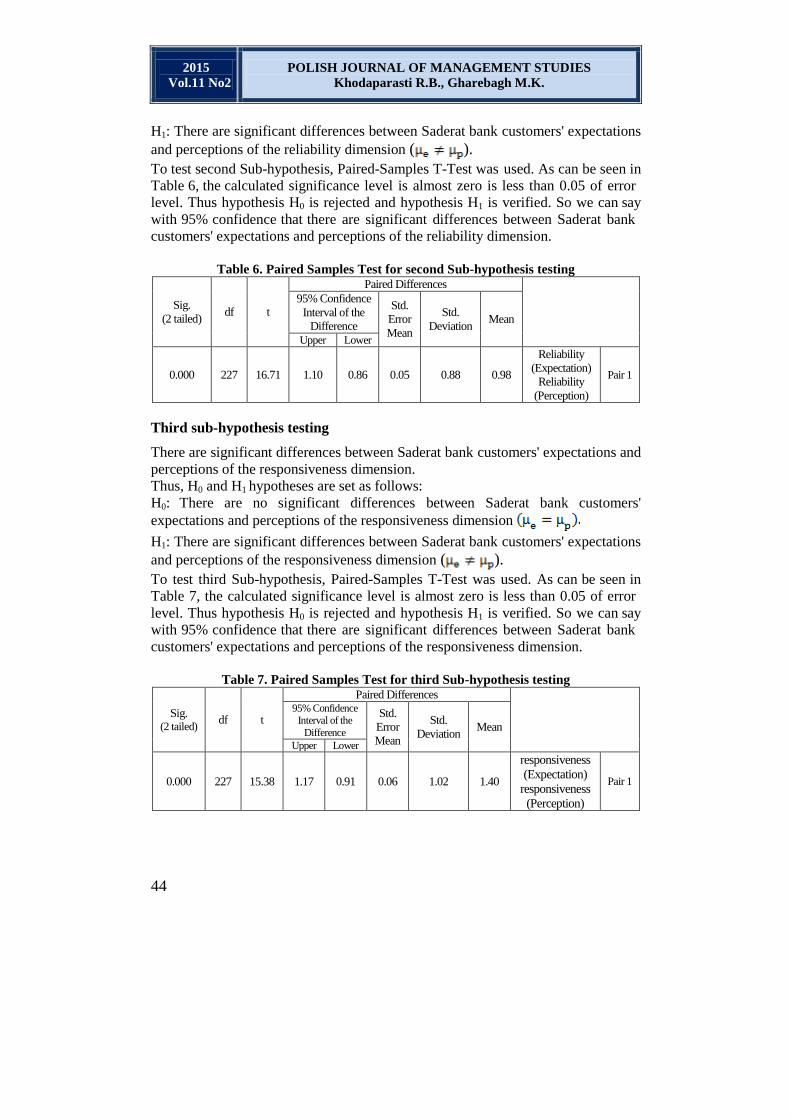
H1: There are significant differences between Saderat bank customers' expectations
and perceptions of the reliability dimension ( ).
To test second Sub-hypothesis, Paired-Samples T-Test was used. As can be seen in
Table 6, the calculated significance level is almost zero is less than 0.05 of error
level. Thus hypothesis H0 is rejected and hypothesis H1 is verified. So we can say
with 95% confidence that there are significant differences between Saderat bank
customers' expectations and perceptions of the reliability dimension.
Table 6. Paired Samples Test for second Sub-hypothesis testing
Paired Differences
t df Sig.
(2 tailed) Mean Std.
Deviation
Std.
Error
Mean
95% Confidence
Interval of the
Difference
Lower Upper
Pair 1
Reliability
(Expectation)
Reliability
(Perception)
0.98 0.88 0.05 0.86 1.10 16.71 227 0.000
Third sub-hypothesis testing
There are significant differences between Saderat bank customers' expectations and
perceptions of the responsiveness dimension.
Thus, H0 and H1 hypotheses are set as follows:
H0: There are no significant differences between Saderat bank customers'
expectations and perceptions of the responsiveness dimension
H1: There are significant differences between Saderat bank customers' expectations
and perceptions of the responsiveness dimension ( ).
To test third Sub-hypothesis, Paired-Samples T-Test was used. As can be seen in
Table 7, the calculated significance level is almost zero is less than 0.05 of error
level. Thus hypothesis H0 is rejected and hypothesis H1 is verified. So we can say
with 95% confidence that there are significant differences between Saderat bank
customers' expectations and perceptions of the responsiveness dimension.
Table 7. Paired Samples Test for third Sub-hypothesis testing
Paired Differences
t df Sig.
(2 tailed) Mean Std.
Deviation
Std.
Error
Mean
95% Confidence Interval of the
Difference
Lower Upper
Pair 1
responsiveness
(Expectation)
responsiveness
(Perception)
1.40 1.02 0.06 0.91 1.17 15.38 227 0.000
POLISH JOURNAL OF MANAGEMENT STUDIES
Khodaparasti R.B., Gharebagh M.K.
2015
Vol.11 No2
45
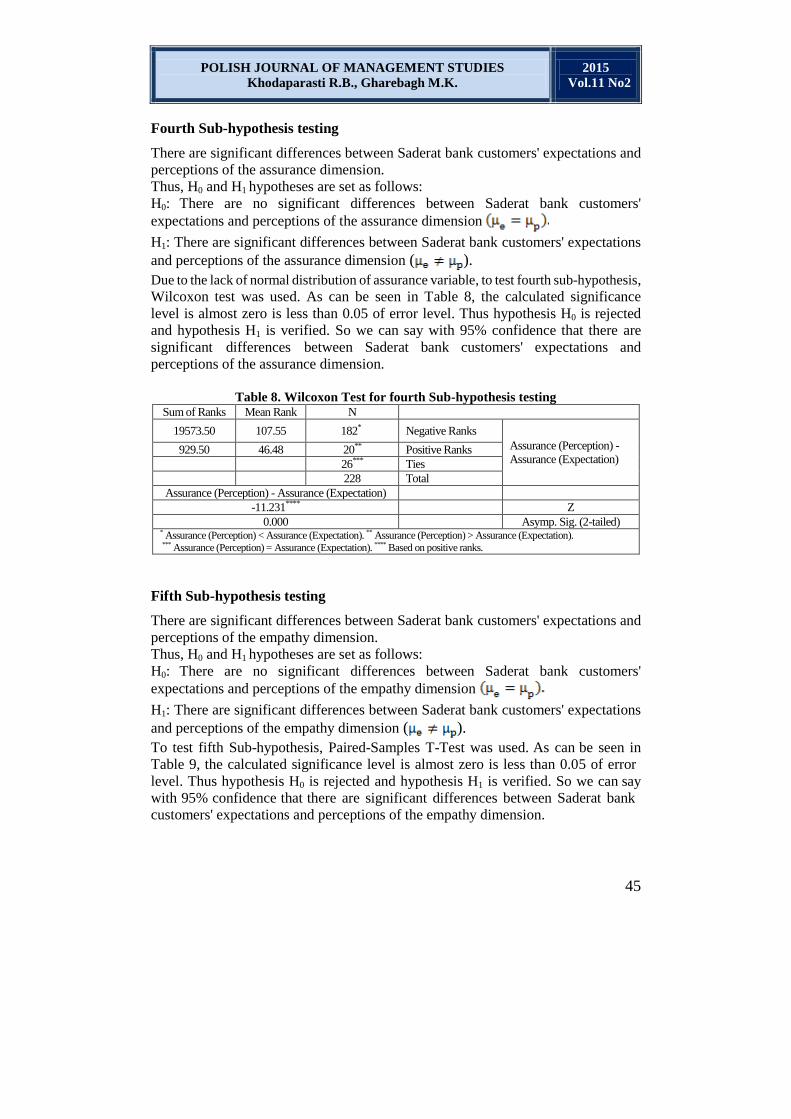
Fourth Sub-hypothesis testing
There are significant differences between Saderat bank customers' expectations and
perceptions of the assurance dimension.
Thus, H0 and H1 hypotheses are set as follows:
H0: There are no significant differences between Saderat bank customers'
expectations and perceptions of the assurance dimension
H1: There are significant differences between Saderat bank customers' expectations
and perceptions of the assurance dimension ( ).
Due to the lack of normal distribution of assurance variable, to test fourth sub-hypothesis,
Wilcoxon test was used. As can be seen in Table 8, the calculated significance
level is almost zero is less than 0.05 of error level. Thus hypothesis H0 is rejected
and hypothesis H1 is verified. So we can say with 95% confidence that there are
significant differences between Saderat bank customers' expectations and
perceptions of the assurance dimension.
Table 8. Wilcoxon Test for fourth Sub-hypothesis testing
N Mean Rank Sum of Ranks
Assurance (Perception) -
Assurance (Expectation)
Negative Ranks 182* 107.55 19573.50
Positive Ranks 20** 46.48 929.50
Ties 26***
Total 228
Assurance (Perception) - Assurance (Expectation)
Z -11.231****
Asymp. Sig. (2-tailed) 0.000 * Assurance (Perception) < Assurance (Expectation). ** Assurance (Perception) > Assurance (Expectation).
*** Assurance (Perception) = Assurance (Expectation). **** Based on positive ranks.
Fifth Sub-hypothesis testing
There are significant differences between Saderat bank customers' expectations and
perceptions of the empathy dimension.
Thus, H0 and H1 hypotheses are set as follows:
H0: There are no significant differences between Saderat bank customers'
expectations and perceptions of the empathy dimension
H1: There are significant differences between Saderat bank customers' expectations
and perceptions of the empathy dimension ( ).
To test fifth Sub-hypothesis, Paired-Samples T-Test was used. As can be seen in
Table 9, the calculated significance level is almost zero is less than 0.05 of error
level. Thus hypothesis H0 is rejected and hypothesis H1 is verified. So we can say
with 95% confidence that there are significant differences between Saderat bank
customers' expectations and perceptions of the empathy dimension.
2015
Vol.11 No2
POLISH JOURNAL OF MANAGEMENT STUDIES
Khodaparasti R.B., Gharebagh M.K.
46
Table 9. Paired Samples Test for fifth Sub-hypothesis testing
Paired Differences
t df Sig.
(2 tailed) Mean Std.
Deviation
Std.
Error
Mean
95% Confidence
Interval of the
Difference
Lower Upper
Pair 1
Empathy
(Expectation)
Empathy
(Perception)
0.78 0.89 0.05 0.66 0.89 13.27 227 0.000
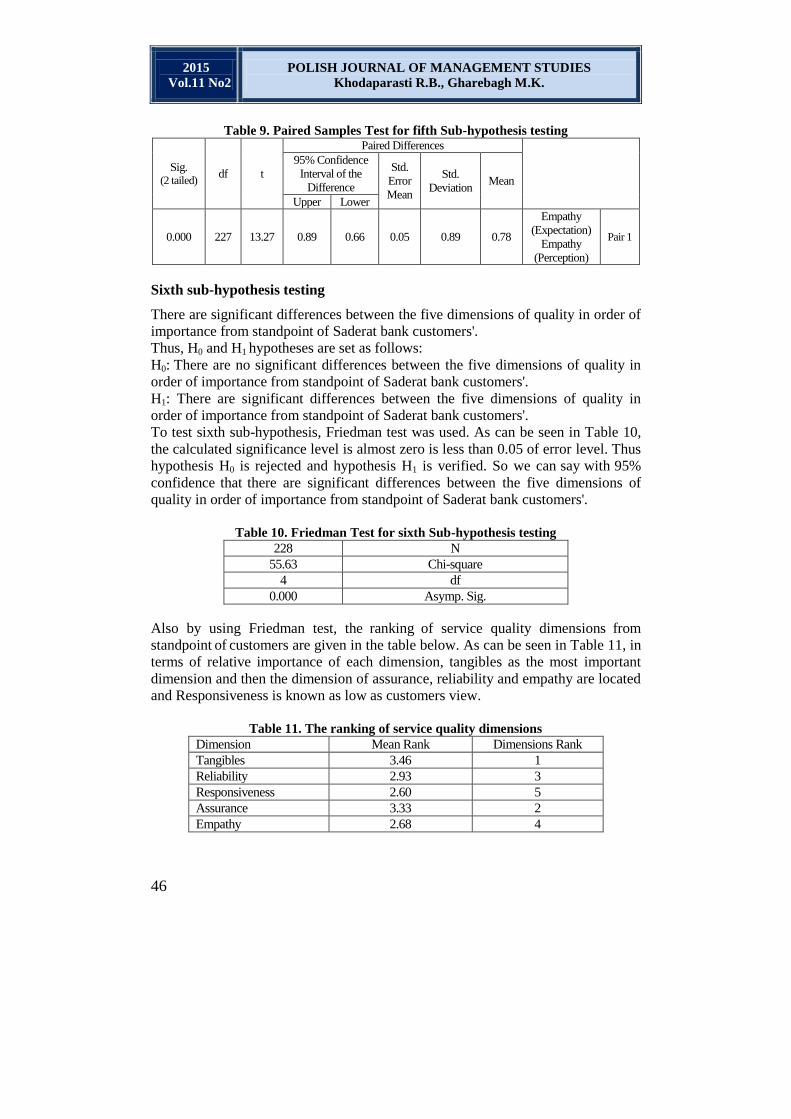
Sixth sub-hypothesis testing
There are significant differences between the five dimensions of quality in order of
importance from standpoint of Saderat bank customers'.
Thus, H0 and H1 hypotheses are set as follows:
H0: There are no significant differences between the five dimensions of quality in
order of importance from standpoint of Saderat bank customers'.
H1: There are significant differences between the five dimensions of quality in
order of importance from standpoint of Saderat bank customers'.
To test sixth sub-hypothesis, Friedman test was used. As can be seen in Table 10,
the calculated significance level is almost zero is less than 0.05 of error level. Thus
hypothesis H0 is rejected and hypothesis H1 is verified. So we can say with 95%
confidence that there are significant differences between the five dimensions of
quality in order of importance from standpoint of Saderat bank customers'.
Table 10. Friedman Test for sixth Sub-hypothesis testing
N 228
Chi-square 55.63
df 4
Asymp. Sig. 0.000
Also by using Friedman test, the ranking of service quality dimensions from
standpoint of customers are given in the table below. As can be seen in Table 11, in
terms of relative importance of each dimension, tangibles as the most important
dimension and then the dimension of assurance, reliability and empathy are located
and Responsiveness is known as low as customers view.
Table 11. The ranking of service quality dimensions
Dimensions Rank Mean Rank Dimension
1 3.46 Tangibles
3 2.93 Reliability
5 2.60 Responsiveness
2 3.33 Assurance
4 2.68 Empathy

POLISH JOURNAL OF MANAGEMENT STUDIES
Khodaparasti R.B., Gharebagh M.K.
2015
Vol.11 No2
47
Determine the level of the gap for five dimensions of service quality
In Table 12 Mean scores expectations, perception, and service quality gap in each
dimension have been shown. As can be seen in this table, the most negative quality
gap are in the responsiveness dimension, followed by the reliability, assurance and
tangibles dimensions, and the least negative quality gap are in the empathy
dimension.
Table 12. Mean scores of expectations, perception and service quality gap in each
dimension
Gap Score (P-E) Perception Expectations Dimension
-0.81 3.43 4.24 Tangibles
-0.99 3.24 4.23 Reliability
-1.05 3.09 4.14 Responsiveness
-0.86 3.34 4.20 Assurance
-0.78 3.09 3.87 Empathy
-0.90 3.23 4.13 Total Quality Service (All dimensions)
Conclusion
The main purpose of this research is to evaluate the quality of services offered to
customers at Saderat bank branches by using SERVQUAL model. In this model,
service quality comes from the gap between customers' expectations and
perceptions of service received. The results of this research show that Saderat bank
customers’ expectation, are higher than their perceptions of the quality of services
offered. It means that the bank failed to meet their customers' expectations and
therefore customers are not satisfied with the services offered. also the results of the
sub-hypothesis related to dimensions of service quality show that all five
dimensions (tangibles, reliability, responsiveness, assurance and empathy) is
effective on customer satisfaction and in all aspects, Saderat bank customers’
expectation, are higher than their perceptions of the quality of services offered. It
means that in all of the five dimensions of service quality, there are gaps. Thus the
bank failed in any of these dimensions to meet their customers' expectations. It
represents customer dissatisfaction from the quality of services offered by bank.
The results of this research show the weaknesses and gaps related to quality of
services offered at Saderat bank. According to the results of this study, we can
formulate plans to improve quality. But it should be noted that service quality
evaluations should be perform periodically in order to being aware of the processes
of service quality improvement.
References
Aldlaigan A., Buttle F., 2002, SYSTRA-SQ: a new measure of bank service quality,
“International Journal of Service Industry Management”, 13(4).
Arasli H., Mehtap-Smadi S., Katircioglu S., 2005, Customer service quality in the Greek
Cypriot banking industry, “Managing Service Quality”, 15(1).
2015
Vol.11 No2
POLISH JOURNAL OF MANAGEMENT STUDIES
Khodaparasti R.B., Gharebagh M.K.
48
Bahia K., Nantel J., 2000, A reliable and valid measurement scale for the perceived service
quality of banks, “International Journal of Bank Marketing”, 18(2).
Baumann C., Burton S., Elliott G., Kehr H., 2007, Prediction of attitude and behavioural
intentions in retail banking, “International Journal of Bank Marketing”, 25(2).
Camarero C. , 2007, Relationship orientation or service quality?: What is the trigger of
performance in financial and insurance services?, “International Journal of Bank
Marketing”, 25(6).
Chi Cui C., Lewis B., Park W., 2003, Service quality measurement in the banking sector in
South Korea, “International Journal of Bank Marketing”, 21(4).
Ehigie B., 2006, Correlates of customer loyalty to their bank: a case study in Nigeria,
“International Journal of Bank Marketing”, 24(7).
Gronroos C., 1984, A service quality model and its marketing implications, “European
Journal of Marketing”, 18.
Guo X., Duff A., Hair M., 2008, Service quality measurement in the Chinese corporate
banking market, “International Journal of Bank Marketing”, 26(5).
Hawke A., Heffernan T., 2006, Interpersonal liking in lender-customer relationships in the
Australian banking sector, “International Journal of Bank Marketing”, 24(3).
Hagigi M., Mogimi M., Kimiyasi M., 2004, Loyalty service: The effects of service quality
and customer satisfaction mediator, Tehran, Knowledge Management, Iran.
Ilyas A., Nasir H., Rizwan Malik M., Mirza U., Munir S., Sajid A., 2013, Assessing the
service quality of Bank using SERVQUAL model, “Interdisciplinary Journal of
Contemporary Research in Business”, 4(11).
Jabnoun N., Al-Tamimi H., 2003, Measuring perceived service quality at UAE commercial
banks, “International Journal of Quality & Reliability Management”, 20(4). Karatepe O., Yavas U., Babakus E., 2005, Measuring service quality of banks: scale
development and validation, “Journal of Retailing and Consumer Services”, 12.
Ladhari R., 2009, A review of twenty years of SERVQUAL research, 1(2).
Ladhari R., Ladhari I., Morales M., 2011, Bank service quality: comparing Canadian and
Tunisian customer perceptions, “International Journal of Bank Marketing”, 29(3).
Lam T.K., 2002, Making Sense of SERVQUAL’s Dimensions to the Chinese Customers in
Macau, “Journal of Market-Focused Management”, 5.
Mizenur Rahaman M., Abdullah M., Rahman A., 2011, Measuring Service Quality using
Servqual Model: A Study on PCBs (Private Commercial Banks) in Bangladesh,
”Business Management Dynamics”, 1(1).
Othman A., Owen L., 2001, Developing an instrument to measure customer service quality
SQ in Islamic banking, “International Journal of Islamic Financial Services”, 3(1). Parasuraman A., Zeithaml V., Berry L., 1988, SERVEQUAL: a multiple item scale for
measuring Perception of service quality, “Journal of Retailing”, 64(1).
Shanka M.S., 2012, Bank Service Quality, Customer Satisfaction and Loyalty in Ethiopian
Banking Sector, “Journal of Business Administration and Management Sciences
Research”, 1(1).
Ulewicz R., 2014, Application of SERVQUAL method for evaluation of quality of
educational services at the University of higher education, “Polish Journal of
Management Studies”, 9.
Wang Y., Lo H.-P., Hui Y., 2003, The antecedents of service quality and product quality
and their influences on bank reputation: evidence from the banking industry in China,
“Managing Service Quality”, 13(1).

POLISH JOURNAL OF MANAGEMENT STUDIES
Khodaparasti R.B., Gharebagh M.K.
2015
Vol.11 No2
49
Zhou L., 2004, A dimension-specific analysis of performance-only measurement of service
quality and satisfaction in China's retail banking, “Journal of Services Marketing”,18(7).
Zhou L., Zhang Y., Xu J., 2002, A critical assessment of SERVQUAL’s applicability in the
banking context of China, “Asia Pacific Advances in Consumer Research”, 5.
WYKORZYSTANIE METODY SERVQUAL DO OCENY JAKOŚCI
USŁUG BANKU SADERAT W MIEŚCIE URMIA W IRANIE
Streszczenie: Niniejsze badanie zostało przeprowadzone w celu oceny jakości usług
oferowanych klientom w oddziałach banku Saderat przy użyciu modelu SERVQUAL.
W badaniu tym, przedstawiono poziom luki pomiędzy oczekiwaniami i obsługi
postrzeganej przez klientów Banku Saderat w każdym z pięciu wymiarów jakości usług. Za
główne cele badań uznano ranking wymiarów jakości obsługi w kolejności ich znaczenia
z punktu widzenia klientów i poziom zrozumienia satysfakcji klientów wraz z jakością
usług oferowanych przez bank Saderat. Badanie populacji statystycznej składało się ze
wszystkich klientów Banku Saderat w Mieście Urmia i 228 klientów tego banku zostało
objętych próbą. Do testowania hipotez badawczych, wykorzystane zostało oprogramowanie
SPSS 18 i sparowane próbki T-testu, test Wilcoxona i test Friedmana. Wyniki niniejszego
badania pokazują, że we wszystkich aspektach oczekiwania klientów banku Saderat są
wyższe, niż ich postrzeganie jakości oferowanych usług. Oznacza to, że w każdym z pięciu
wymiarów jakości usług, istnieją luki. Tym samym bankowi nie udało się sprostać
oczekiwaniom swoich klientów w żadnym z tych wymiarów.
Słowa kluczowe: Servqual, jakość usług, usługi bankowe, postrzeganie, oczekiwania.
作者SERVQUAL方法應用程序確定SADERAT銀行在烏爾米耶,伊朗服
務質量
摘要:本研究是利用SERVQUAL模型來評估提供給客戶Saderat銀行分行服務的質量。
在這項研究中,期望和服務深受Saderat銀行客戶在每一個服務質量的五個維度感知之
間的差距的調查水平。服務質量維度,以便從客戶和客戶的滿意度與Saderat銀行所提
供的服務質量水平的理解角度來說的重要性的排名,作為研究的主要目標被認為是
。統計人口由Saderat銀行在所有城市烏爾米耶的客戶和客戶228這家銀行的研究進行
了採樣。為了檢驗研究假設,軟件SPSS
18和配對樣本T檢驗,Wilcoxon檢驗和弗里德曼的測試中使用。這項研究的結果表明
,在所有方面,Saderat銀行客戶的期望比所提供的服務質量的看法更高。這意味著,
在所有的服務質量的五個維度中,有差距。因此,銀行在沒有任何這些尺寸,以滿
足客戶的期望
關鍵詞:SERVQUAL,服務質量,銀行服務,感知,期望