Application of Satellite Land Measurements in...
42
Application of Satellite Land Measurements in Improving NCEP Numerical Weather Prediction Weizhong Zheng 1,2 , Michael Ek 1 , Jiarui Dong 1,2 , Yuhua Wu 1,2 , Helin Wei 1,2 , Jesse Meng 1,2 , Xiwu Zhan 3 , Yueyun Yu 3 , Marco Vargas 3 and Ivan Csiszar 3 1 NOAA/NCEP/Environmental Modeling Center , College Park, MD 20740, USA 2 IMSG @NOAA/NCEP/EMC, College Park, MD 20740, USA 3 NOAA/NESDIS/STAR, College Park, MD 20740, USA \ The 1st International Surface Working Group, Montery CA, July 19-20, 2017
Transcript of Application of Satellite Land Measurements in...

Application of Satellite Land Measurements in Improving NCEP Numerical Weather Prediction
Weizhong Zheng1,2, Michael Ek1 , Jiarui Dong1,2, Yuhua Wu1,2, Helin Wei1,2,
Jesse Meng1,2, Xiwu Zhan3, Yueyun Yu3, Marco Vargas3 and Ivan Csiszar3
1NOAA/NCEP/Environmental Modeling Center , College Park, MD 20740, USA
2IMSG @NOAA/NCEP/EMC, College Park, MD 20740, USA
3NOAA/NESDIS/STAR, College Park, MD 20740, USA\
The 1st International Surface Working Group, Montery CA, July 19-20, 2017

ClimateCFS
Motivation
Objective: To improve satellite data utilization over land in NCEP forecast models and data assimilation system and then improve the numerical weather prediction (NWP).
Land satellite data assimilation: – Utilization of satellite data sets in the models (e.g., GVF, snow, burning area, albedo, emissivity, LST, radiation, vegetation and soil type, etc.)
– Assimilation of satellite products (e.g, Soil moisture (SMAP, SMOPS); snow);
– Direct radiance assimilation (Tb) Requiring a forward radiative transfer model (RTM) to calculate Tb with input of model atm profiles and sfc parameters. (sfc emissivity, sfc parameters). (Understand the interaction and feedback between land and atmosphere, and then improve NWP and DA)
2

Satellite Obs. in Monitoring and LDAS
Monitoring: GOES / VIIRS LST (Yu), Sfc Rad. flux verification (Laszlo).
LDAS: GLDAS (Jesse Meng), NLDAS (Youlong Xia)
NLDAS (Youlong Xia):
-- IMS snow cover data help NLDAS Noah model upgrade; -- GOES skin temperature; -- GOES downward shortwave radiation in next NLDAS upgrade; -- Some snowpack, soil moisture, and terrestrial water storage assimilation is in CTB NLDAS resarch, which will be considered as NLDAS-3.0 implementation two years later.
3

The NESDIS Geostationary Surface and Insolation Product (GSIP) of surface shortwave flux is used for the EMC model verification.
Model predicted diurnal cycles of surface shortwave fluxes at seven sites across US are compared with GSIP and surface observations on daily basis.
Istvan Laszlo (NESDIS)Jesse Meng (EMC)
NESDIS GSIP for GFS/NAMSurface Shortwave Flux Verification
Courtesy Jesse Meng
4

Weekly Real-time VIIRS GVF
NCEP Operations: Monthly 0.14-deg (16-km) global climatology of GVF from AVHRR. (Gutman & Ignatov, 1998).
Weekly GVF: VIIRS near real-time weekly global 0.036-deg (4-km) GVF (Marco Vargas team@NESDIS). It starts from Sep. 2012 to current.
Three data sets: (a) Weekly climatology GVF; (b) Monthly climatology GVF; (c) Near real-time weekly GVF
The other GVF data sets are also examined: (a) Near real-time weekly AVHRR (Le Jiang et al., NESDIS); (b) Near real-time weekly MODIS (Xiaoyang Zhang, SD State U.).
5

Multi-year mean VIIRS GVF over CONUS
6

Average VIIRS GVF over CONUS: Near Real-Time
7
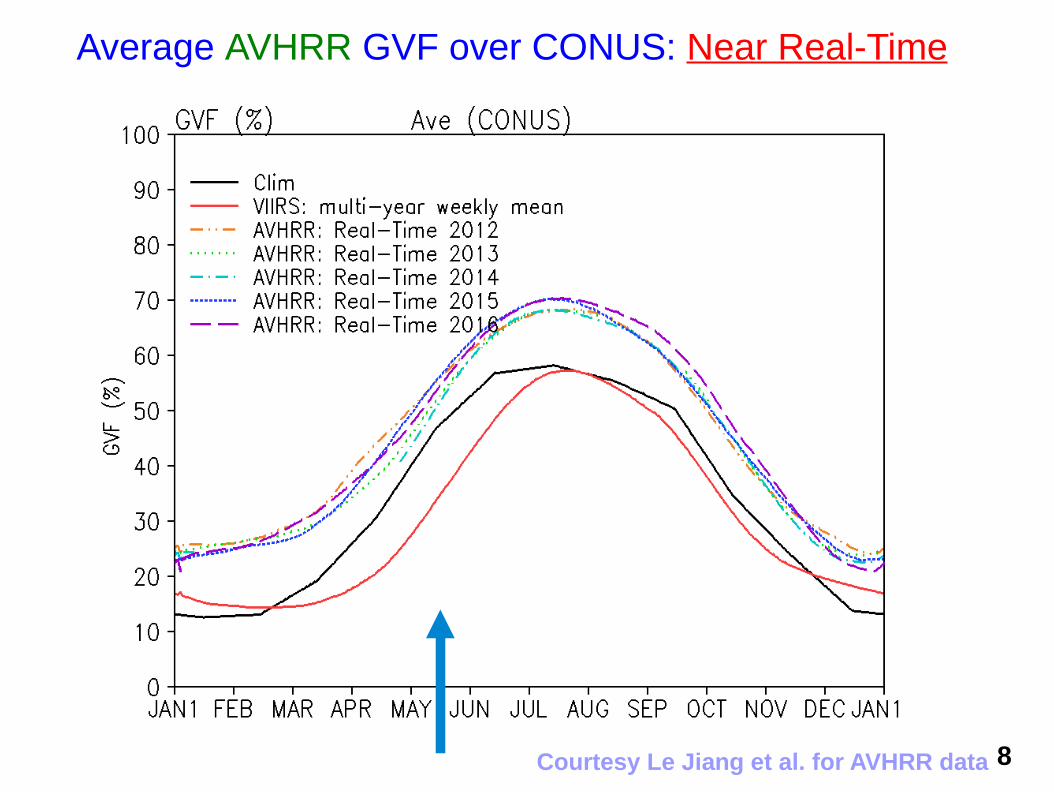
Average AVHRR GVF over CONUS: Near Real-Time
Courtesy Le Jiang et al. for AVHRR data 8

Average MODIS GVF over CONUS: Near Real-Time
Courtesy Xiaoyang Zhang for MODIS data9

VIIRS GVF (4-y monthly mean) test:
5/02 – 6/02, 2016
10

GVF: AVHRR monthly clim and VIIRS data: 15 May 2016
Old Clim 4-y mean
Real-time
– Near real-time VIIRS GVF is similar
to the 4-year VIIRS monthly mean;
– Both are lower than the old AVHRR
monthly climatology.
11

GVF: AVHRR monthly clim and VIIRS data: 15 May 2016
Old Clim 4-y mean
Real-time
– Near real-time VIIRS GVF is similar
to the 4-year VIIRS monthly mean;
– Both are lower than the old AVHRR
monthly climatology.
12

VIIRS GVF (4-y monthly mean) test: 5/02 – 6/02, 2016
Precipitation Skill Scores over CONUS: f12-f36AC: HGT 500 hPa G2/NHX
VIIRS test: positive impact for light precipitation
VIIRS test: Improve AC score @500 hPa.
13

T2m bias and rmse over E. &W. CONUS 5/02-6/02, 2016
VIIRS:Increase warm bias and RMSE!
West CONUS
East CONUS
14

VIIRS: Increase warm bias and RMSE!
Temp Bias Temp RMSE
Temperature fits to Obs over CONUS 5/02-6/02, 2016
15

Td2m bias and rmse over E. &W. CONUS 5/02-6/02, 2016
West CONUS
East CONUS
16
VIIRS:
East CONUS:Reduce wet bias and RMSE.
West CONUS:Increase dry bias and RMSE.
VIIRS GVF (4-y monthly mean) test:
5/13 – 6/15, 2014
17

AC: HGT 500 hPa G2/NHX 5/13-6/15 2014
VIIRS test: Improve AC score @500 hPa.
18

Precipitation Skill Scores over CONUS: 5/13-6/15 2014
19

East CONUS
West CONUS
VIIRS:
East CONUS:Reduce RMSE.
West CONUS:Increase warm bias.
T2m bias and rmse over E. &W. CONUS 5/13-6/15, 2014
20

VIIRS:
East CONUS:Reduce wet bias and RMSE.
West CONUS:Increase dry bias.
East CONUS
West CONUS
DPT bias and rmse over E. &W. CONUS 5/13-6/15, 2014
21

Temperature fits to Obs over CONUS 5/13-6/15, 2014
Temp Bias Temp RMSE
VIIRS: Increase warm bias and RMSE!
22

1/1/14 4/11/14 7/20/14 10/28/14-0.5
0
0.5
1
1.5
2
2.5
3
3.5
4
4.5
ClimoRGVFClimoRGVF
Real time GVF can reduce Dew point temperature wet bias in NAM
VIIRS GVF test in NAM (two 84h runs /Mon) : Jan -- Dec, 2014
Courtesy Yihua Wu
1/1/142/20/14
4/11/145/31/14
7/20/149/8/14
10/28/1412/17/14
-0.5
0
0.5
1
1.5
2
2.5
3
3.5
Climo RGVF Climo
RGVF
Temp Bias & RMSE
23
VIIRS: Reduce wet bias and RMSE. VIIRS: Increase warm bias and RMSE. (some cold bias is reduced).
DPT Bias & RMSE

Soil Moisture Data Assimilation
Schematic representation of assimilating satellite soil moisture products from NESDIS/SMPOS into NCEP Global Forecast System (GFS)
24

WindSat SMOS ASCAT
Blended
SMOPS Daily Product Sample
25

GFS Top Layer SM Validation GFS Top Layer SM Validation With USDA-SCAN Measurements With USDA-SCAN Measurements
1-30 of April, 20121-30 of April, 2012
East CONUS (26 sites) West CONUS (25 sites) Whole CONUS
RMSE Bias Corr-Coef RMSE Bias Corr-Coef RMSE Bias Corr-Coef
CTLCTL 0.135 0.046 0.565 0.124 0.033 0.448 0.129 0.040 0.508
EnKFEnKF 0.130 -0.031 0.613 0.114 -0.021 0.549 0.123 -0.031 0.587
26

27
Analysis on Anomaly Correlation at 500 hPa: Day5
500 hPa HGT:
Reduced the bias; Reduced
the rmse after day 4.
Bias RMSE 27

NESDIS SMOPS 3.0System Layer Data Flow
Courtesy Jerry Zhan 28SMOPS: add GMI, SMAP NRT TB & NASA SMAP SM

AFWA/LIS/GFS vs DI & EnKF
Direct Insertion EnKF
Courtesy Jiarui Dong
Demonstration of LIS land DA of AFWA Snow Depth
Global
EnKF method: Reduce bias and RMSE.29

• GBP 20-type land classifications and STASGO 19-type soil classifications
• The new MODIS-based snow free albedo from BostonU/Mark-Friedl (JCSDA funded)
• The new MODIS-based maximum snow albedo from UAZ/Xubin (JCSDA funded)
• Diurnal albedo treatment
• Unify two snow fields between radiation driver and Noah LSM
•Snow cover
•Snow albedo
• Fix excessive cooling of T2m during sunset
• Increase ground heat flux under the deep snow
Land Surface Changes for Q3FY17 NEMS GFS
Courtesy Helin Wei 30

Courtesy Helin Wei
31
New Albedo: Reduce bias of surface upward SW.
New Albedo: Surface Upward SW
NEMS
GFS

GSI analysis assimilates satellite obs Tb in various IR and MW channels Analysis increment: derived from difference of observed and simulated Tb Simulated Tb is product of CRTM radiative transfer applied to GFS forecast of
atmospheric states and earth surface states (land, ice, sea)
Example expression for simulated Tb for a microwave channel:
For surface sensitive channels (aka “window channels”):atmospheric absorption (α) is weak, so Tsurf & sfc emissivity (ξ) are key factorsSurface emissivity (ξ) is strong function of land surface states:snow cover/density, vegetation cover/density, soil moisture amount,soil moisture phase (frozen vs. liquid)If LST has a large error, Tb would have a large error too.
Radiance DA: Satellite Brightness Temperatures (Tb)
α = atmospheric absorption
Kenneth Mitchell
32
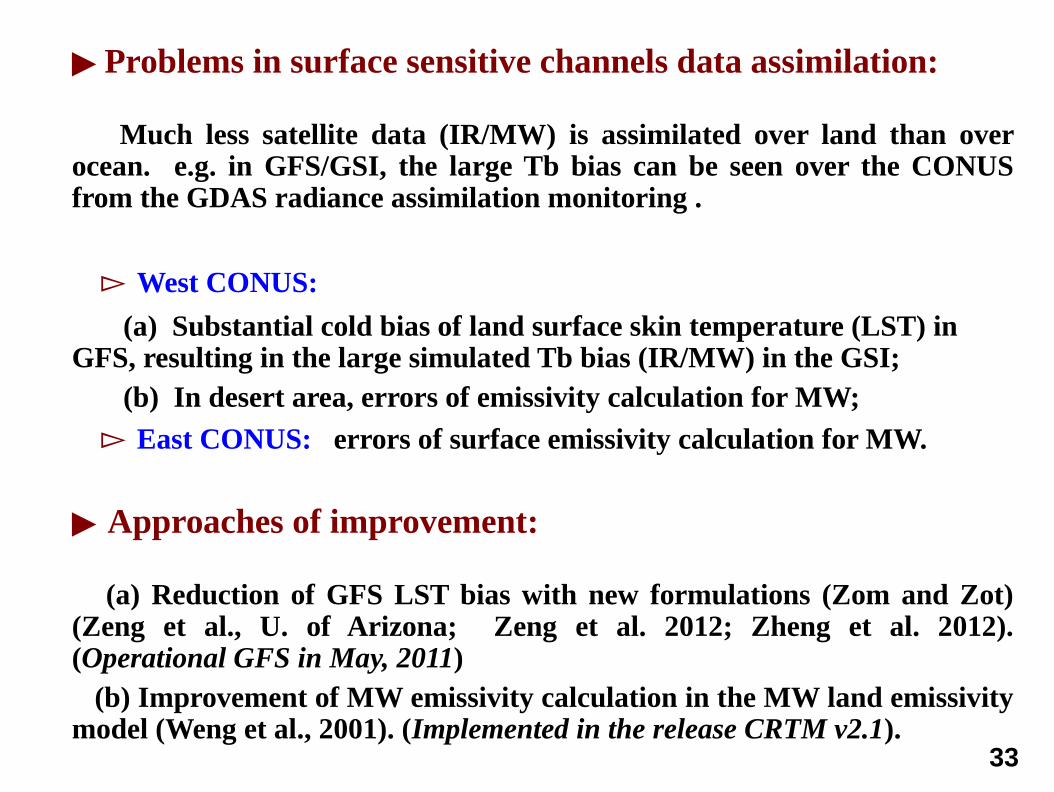
▶ Problems in surface sensitive channels data assimilation:
Much less satellite data (IR/MW) is assimilated over land than over ocean. e.g. in GFS/GSI, the large Tb bias can be seen over the CONUS from the GDAS radiance assimilation monitoring .
▻ West CONUS:
(a) Substantial cold bias of land surface skin temperature (LST) in GFS, resulting in the large simulated Tb bias (IR/MW) in the GSI; (b) In desert area, errors of emissivity calculation for MW;
▻ East CONUS: errors of surface emissivity calculation for MW.
▶ Approaches of improvement:
(a) Reduction of GFS LST bias with new formulations (Zom and Zot) (Zeng et al., U. of Arizona; Zeng et al. 2012; Zheng et al. 2012). (Operational GFS in May, 2011) (b) Improvement of MW emissivity calculation in the MW land emissivity model (Weng et al., 2001). (Implemented in the release CRTM v2.1).
33

Comparisons of Tb Bias and RMSE and Number of Obs Assimilated in GSI
Red: CTLBlue: SEN
34

LST [K] Verification with GOES and SURFRAD 3-Day Mean: July 1-3, 2007
GFS-GOES: CTR GFS-GOES: New Zot
Large cold bias
GFS-GOES: New Zom,t
Improved significantly during daytime!
ChLST
(a) (b)
(d)(c)
Aerodynamic conductance: CTR vs Zom,t35

Tb: NOAA-18 AMSU_A Ch15 Tb: NOAA-17 HIRS3 Ch8
CTR
Zom,t
Zom,t + ε
CTR Zom,t
CTR: Less data used in GSICTR: Less data used in GSIEXP: ImprovedEXP: Improved
LST Impact on Data Assimilation: Tb simulation
Zheng et al. 201236

GFS Excessive Cold Bias of Tskin and T2m (late pm & night)
GFS Test: Tskin, T2m and T profiles @ KALB
CTL: Little downward heat transport (atmos-->land) during the night decoupling period results in accumulation of exess heat and as a result, the warm bias exists above the first model level.
CTL: Large difference between T1 and T2m (or Tskin) during a period of nighttime on 2/18.
37
T2mT2m T2m
Zheng et al. 2017
GFS CTL
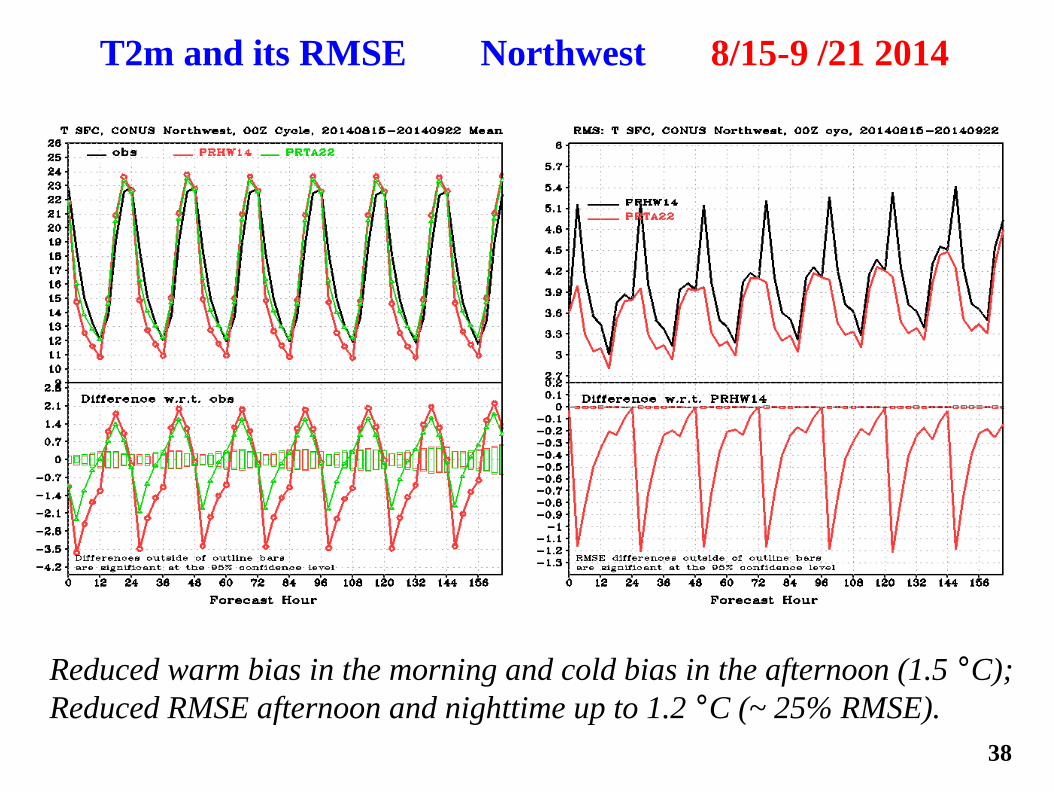
T2m and its RMSE Northwest 8/15-9 /21 2014
Reduced warm bias in the morning and cold bias in the afternoon (1.5 °C);Reduced RMSE afternoon and nighttime up to 1.2 °C (~ 25% RMSE).
38
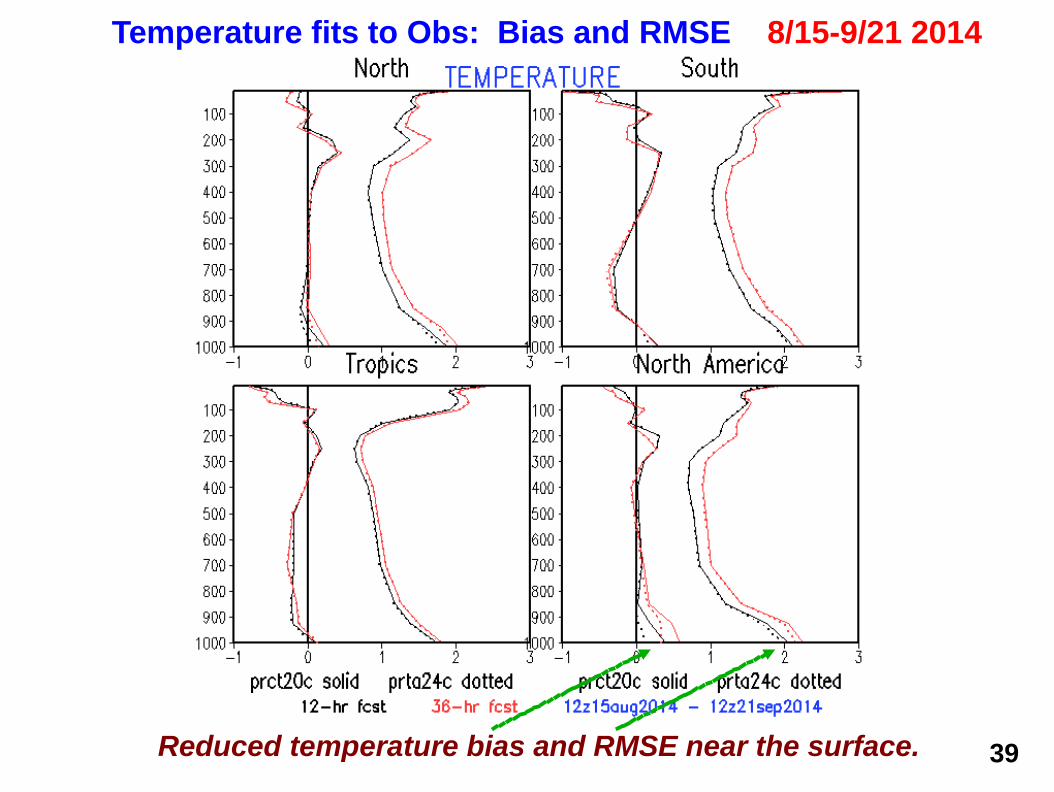
Reduced temperature bias and RMSE near the surface.
Temperature fits to Obs: Bias and RMSE 8/15-9/21 2014
39
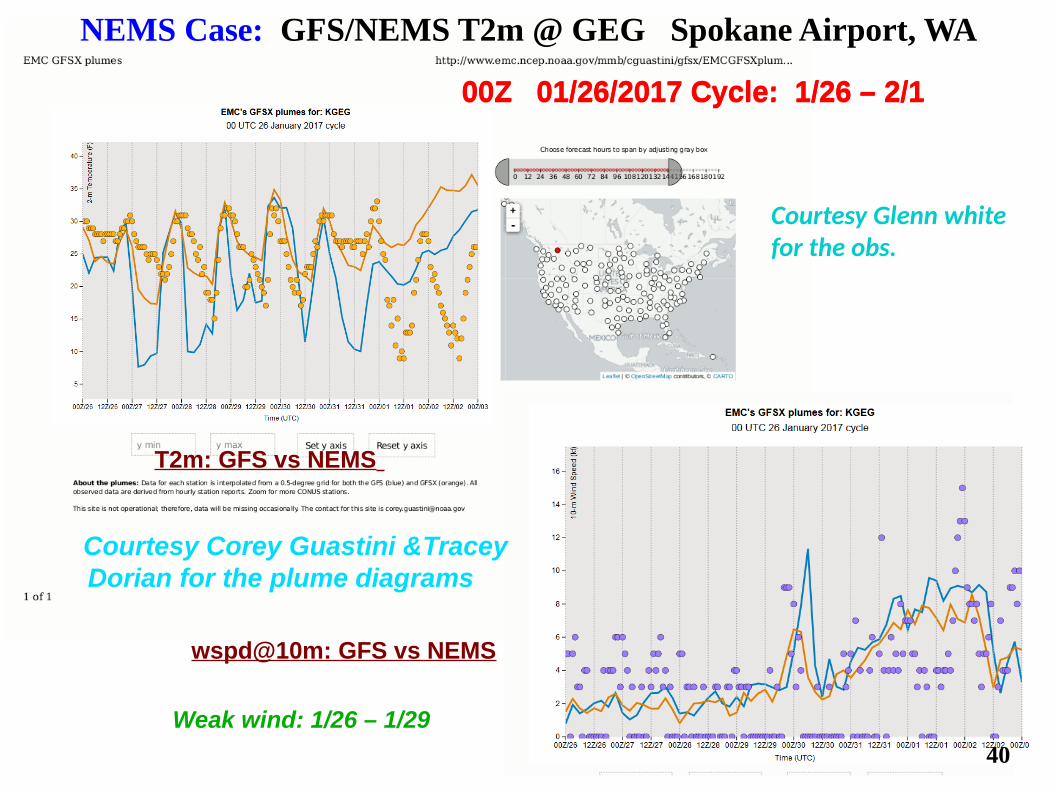
NEMS Case: GFS/NEMS T2m @ GEG Spokane Airport, WA
00Z 01/26/2017 Cycle: 1/26 – 2/1
T2m: GFS vs NEMS
wspd@10m: GFS vs NEMS
Weak wind: 1/26 – 1/29
Courtesy Corey Guastini &Tracey Dorian for the plume diagrams
00Z 01/26/2017 Cycle: 1/26 – 2/1
Courtesy Glenn white for the obs.
40

41
Summary and Future Plan
Several satellite data sets developed recently (e.g., GVF, snow, burning area, albedo, radiation, soil and vegetation type) have been tested in the NCEP models. The results show good improvements, compared with the current data sets; However, some data sets need further validation with ground measurements, and consistence of all these data sets is required.
The SMOPS soil moisture data assimilation in GFS have been continuously examined; More tests will be done after NESDIS further validate the blended SMOPS products.
Large cold bias of surface temperatures in GFS was identified and substantially reduced by the proposed solution, which resulted in improvement of Tb in GSI/CRTM;
We will continue our efforts and working together with several research teams to improve satellite data utilization and data assimilation and then improve NCEP NWP.
41

Thank You !
Any questions/comments?
1442