Application of Passive Infrared Thermography for the ... · Application of Passive Infrared...
12
1 Application of Passive Infrared Thermography for the Detection of Defects in Concrete Bridge Elements Tarek Omar, PhD Candidate Department of Civil and Environmental Engineering Western University London, Ontario, Canada N6A 5B9 Email: [email protected] Moncef L. Nehdi, Professor Department of Civil and Environmental Engineering Western University London, Ontario, Canada N6A 5B9 Email: [email protected] Paper prepared for presentation at the Structures Session of the 2016 Conference of the Transportation Association of Canada Toronto, ON ABSTRACT The premature deterioration of concrete bridges is one of the most serious problems currently facing several highway authorities. The detection of subsurface fracture planes, or delaminations, is necessary when prioritizing bridges for repair. Delaminations are commonly detected by manual methods, such as a sounding rod or a chain drag, which are subjective, tedious and require expensive lane closures. Infrared thermography (IRT) is a recognized non-destructive testing and remote sensing technique for evaluating concrete bridge elements, such as bridge decks and piers and has proven to be capable of detecting subsurface anomalies owing to temperature differentials between sound and unsound concrete. In the present study, IRT was employed to inspect a deteriorated concrete bridge located in the province of Quebec, Canada. The survey was conducted on the bridge deck as well as within the bridge soffit, which is critical for traditional inspection methods due to the traffic passing under the bridge. The collected IR images of the bridge deck were enhanced using image processing algorithms to reduce noise and improve thermal contrasts. The images were subsequently stitched to produce a mosaic view of the entire bridge deck using several Matlab codes. The delaminated areas were identified based on thresholding classification and mapped using a commercial mapping software. The results demonstrate that IRT can yield both quantitative and qualitative indications of subsurface delamination defects, thus assisting transportation agencies to identify critical deficiencies and focus limited funding on the most deserving bridge decks. In addition, the ability to inspect difficult access areas can assist in adding this invaluable thermal technique to the bridge inspector’s tool box.
Transcript of Application of Passive Infrared Thermography for the ... · Application of Passive Infrared...

1
Application of Passive Infrared Thermography for the Detection of Defects in Concrete Bridge Elements
Tarek Omar, PhD Candidate
Department of Civil and Environmental Engineering Western University
London, Ontario, Canada N6A 5B9 Email: [email protected]
Moncef L. Nehdi, Professor
Department of Civil and Environmental Engineering Western University
London, Ontario, Canada N6A 5B9 Email: [email protected]
Paper prepared for presentation at the Structures Session
of the 2016 Conference of the Transportation Association of Canada
Toronto, ON
ABSTRACT The premature deterioration of concrete bridges is one of the most serious problems currently facing several highway authorities. The detection of subsurface fracture planes, or delaminations, is necessary when prioritizing bridges for repair. Delaminations are commonly detected by manual methods, such as a sounding rod or a chain drag, which are subjective, tedious and require expensive lane closures. Infrared thermography (IRT) is a recognized non-destructive testing and remote sensing technique for evaluating concrete bridge elements, such as bridge decks and piers and has proven to be capable of detecting subsurface anomalies owing to temperature differentials between sound and unsound concrete. In the present study, IRT was employed to inspect a deteriorated concrete bridge located in the province of Quebec, Canada. The survey was conducted on the bridge deck as well as within the bridge soffit, which is critical for traditional inspection methods due to the traffic passing under the bridge. The collected IR images of the bridge deck were enhanced using image processing algorithms to reduce noise and improve thermal contrasts. The images were subsequently stitched to produce a mosaic view of the entire bridge deck using several Matlab codes. The delaminated areas were identified based on thresholding classification and mapped using a commercial mapping software. The results demonstrate that IRT can yield both quantitative and qualitative indications of subsurface delamination defects, thus assisting transportation agencies to identify critical deficiencies and focus limited funding on the most deserving bridge decks. In addition, the ability to inspect difficult access areas can assist in adding this invaluable thermal technique to the bridge inspector’s tool box.

2
INTRODUCTION One of the major challenges for a bridge owner is the condition assessment of bridge components. Delamination caused by corrosion of embedded reinforcing steel is a serious form of deterioration in reinforced concrete bridges. If repairs are not made in a timely fashion, the delamination progresses to create spalls. With continued corrosion, this process will eventually affect the structural integrity of the bridge. Condition assessment tools that can detect these delaminations before spalling occurs are needed to ensure bridge safety and identify maintenance and repair needs. Closing the bridge to traffic, safety, and time consuming data collection are some of the major issues during visual bridge inspections and evaluation using conventional sounding techniques. In addition, these methods typically yield primarily qualitative data and subjective decisions Nondestructive testing (NDT) provides engineers and bridge owners with the ability to rapidly and effectively inspect and monitor bridge aging infrastructure. NDT methods used to access subsurface defects in concrete bridge elements vary in complexity and reliability. Infrared Thermography (IRT) has been used to detect characteristic thermal signatures associated with delaminations, in concrete bridge components (Maser and Roddis, 1990). Delaminations are detected by measuring the difference in surface temperature that may exist between a region of sound concrete and a delamination region of concrete under certain environmental conditions. For instance, solar loading can provide a strong radiant heating source that establishes a thermal gradient in bridge decks. Subsurface defects such as a delamination disrupt the heat transfer through the concrete, and if sufficient thermal gradient exists, then a variation in the surface temperature of the concrete in the area above the delamination can be detected (Manning and Holt, 1982). RESEARCH OBJECTIVES The goal of this study is to evaluate the capability and reliability of using passive IRT technology as a bridge inspection tool for the detection of delaminated areas of concrete bridges in the field. The primary objectives are: (1) studying the capability of IRT to detect delaminated areas in bridge decks; (2) assessing the ability of IRT to detect delaminated areas in bridge soffits; and (3) quantifying the delaminated areas detected in bridge decks and soffits using IRT testing.
BACKGROUND Delaminations in Concrete Bridges Delaminations are subsurface horizontal fracture planes, parallel to the surface of the concrete surface. They often develop due to the swelling and expansion of the reinforcing steel during corrosion processes. Delaminations may be localized or extend over a substantial area, especially if the concrete cover is thin (Huston et al., 2002). As corrosion damage advances, these subsurface delaminations can mechanically de-bond and

3
separate from the concrete structure. Spalling in the soffit area of overpass concrete bridges can fall and present a hazard to the traffic below. Therefore, the corrosion-induced spalling of concrete has been a concern for transportation agencies due to the potential serviceability and safety issues for concrete bridge structures. Detection of this type of damage in its initial stages before spalling occurs is critical to ensure public safety, effective decision making and allocation of financial resources for repair and rehabilitation goals of deteriorated bridges.
Bridge Evaluation Techniques Visual Inspection
Visual inspection is one of the most versatile methods of NDE and is usually one of the primary methods used in evaluating different bridge components. A key benefit of visual inspection is that it is low cost, relatively quick and requires minimal training. However, visual inspection has several limitations such as its inability to detect hidden defects and the requirement of a vehicle to gain adequate access to some areas of the bridge. In addition, the quality and consistency of the results of visual inspection greatly depend on the motivation, qualification and equipment of those conducting such inspections. Research results indicate that assessing a bridge condition by visual inspection is unreliable, being unable to identify correctly the repair priorities. For instance, a research study by Moore et al., (2001) showed a significant discrepancy in documenting inspection information during routine visual inspection. Hammer Sounding and Chain Drag Testing A number of hand tools, including hammers, steel rods, and chains have been widely used to inspect concrete bridge elements. A delamination in the concrete causes a dull sound when the deck surface is struck. This is a low-cost method, but the interpretation of the sound produced is subject to the operator’s judgment and experience. Such techniques require hands-on access and can be a labor-intensive and time-consuming for large areas of concrete. Traffic control must also be in place so that inspectors can safely access the concrete element. These limitations have motivated pursuing advanced NDE techniques for more effective and reliable bridge inspection. Advanced NDT Technologies Advanced NDT technologies are increasingly being considered for inspecting concrete bridge components. These methods enable the detection of deterioration processes at its early stages and can be incorporated into the inspection process to evaluate hidden defects such as reinforcing steel corrosion, delamination and crack propagation. Data collected from the NDT of bridge elements can help gain a better understanding of their life-cycle costs and deterioration mechanisms. A number of techniques introduced exploit

4
various physical phenomena (acoustic, seismic, electric, electromagnetic, and thermal, etc.) to detect and characterize specific deterioration processes or defects. The most commonly used NDT methods in the onsite assessment and evaluation of concrete bridges are the half-cell potential (HCP), impact echo (IE), ultrasonic pulse velocity (UPV), ground penetrating radar (GPR), and IRT. In general, all these techniques utilize an approach where the objective is to learn about the characteristics of the medium from its response to the applied excitation (Gucunski et al., 2013). IRT is the only method that does not require direct access to the surface under inspection because images can be captured from distance using appropriate optical lenses. However, the principles, instrumentations, data analysis techniques, and the inherent limitations of these technologies are provided in an American Concrete Institute Report (ACI 228.2R, 2013). Infrared Thermography Technology Heat transfer takes place in three modes: conduction, convection and radiation. The internal properties of a material play important roles in governing its temperature at equilibrium with its surroundings. For instance, heat capacity is defined as the amount of heat needed to raise the temperature of a unit mass of a material by one degree and describes its ability to store heat. Thermal conductivity is the rate at which heat flows through a material. Thermal diffusivity, on the other hand, is the rate at which temperature changes occur in a material. A high thermal diffusivity means that heat transfer through a material will be rapid and the amount of storage will be small. Conversely, low thermal diffusivity indicates a slower rate of heat transfer and a large amount of heat storage (Bagavathiappan et al., 2013). There are two testing approaches for IR thermography based on the source of heat. The active approach uses an external thermal stimulus to induce the required heat flow condition on the concrete under testing. Based on the external stimulus, different methods of active thermography have been developed such as pulse thermography, step heating, lock-in thermography and vibro-thermography. The passive approach uses natural heat sources such as solar heating and ambient temperature changes (Robert, 1982). Infrared thermography (IRT) is a technology to detect thermal radiation emitted from materials. It creates an image of surface temperatures based on the emitted radiation. Thermal IR radiant energy is emitted from all objects that have a temperature greater than absolute zero. The rate at which this energy is emitted is a function of the temperature of the material and its emissivity. A material’s emissivity is the ability of its surface to emit energy by radiation relative to a black body and has a value between 0 and 1. This value is typically greater than 0.9 for concrete. The concept behind the application of IRT in concrete bridge evaluation is that subsurface defects such as delamination disrupt the heat transfer through the concrete. When the temperature of the concrete increases, such as during daytime when the sun and ambient environment are heating the concrete, the surface area above a subsurface delamination warms up at a faster rate than that of surface areas where the concrete is intact. Delaminations can be detected as “hot spots” on the surface of the material, relative to intact concrete. Conversely, during nighttime,

5
the air temperatures usually decrease and the material cools. Thus, the surface area above the delaminations cool at a faster rate than the intact concrete and appear as “cold spots” relative to the intact concrete (Washer et al., 2009).
ASTM D4788-03, (2013) describes the standard procedure and equipment necessary for conducting passive IR testing for detecting delaminations in bridge decks. Time of data collection is the most critical factor in a passive IR survey. In a study conducted by Washer et al., (2009) on concrete bridges, it was found that the effective time to perform a thermal IR test depends on the depth of the delamination. The most contrast appears on the thermal IR image approximately 4 hr after sunrise for a 2 in. deep delamination and 7 hr after sunrise for a 3 in. deep delamination. Environmental conditions, such as wind speed, solar energy, humidity and ambient temperature also have an influence on the results from a thermal IR bridge inspection (Washer et al., 2009). Although radiated energy is the parameter that is measured by a thermal IR camera, the heat conductivity within the concrete and heat convection around the concrete can also influence this measurement. Therefore, areas such as bridge soffits, which typically are not exposed to direct sunshine, can be warmed over the course of the day through convective heating if the temperature increase is sufficient. Though the temperature contrasts are smaller than those for solar exposed surfaces, subsurface delaminations can be imaged. However, this application of infrared imaging is much less common than for solar exposed surfaces (Vladimir, 2014).
RESEARCH METHODOLOGY The methodology adopted for achieving the objectives of the present study consists of: (1) conducting passive IRT testing on concrete bridge deck and soffit; (2) enhancing the captured IR images; (3) stitching the images to produce a thermal thermogram for the entire bridge deck; (4) thresholding classification based on the recorded thermal contrast values; (5) producing a bridge deck map identifying the delaminated areas; (6) quantifying the delaminated areas within the bridge deck; (7) studying the IR images and quantifying the delaminated areas within the bridge soffit; and (8) ) validating the achieved results. BRIDGE INSPECTION USING IRT TESTING Field testing was conducted in this study on an in-service reinforced concrete bridge located in the province of Quebec, Canada and scheduled, by the Ministry of transportation of Quebec for rehabilitation. Delamination, corrosion and high chloride ion content were recently indicated through a condition survey of the bridge. Therefore, the bridge was considered as a good candidate for evaluation study using thermal IR to detect subsurface anomalies within the bridge deck and soffit. The bridge was constructed in 1969, and the critical characteristics of the deck include a total length of 147 ft with a transverse width of 29.53 ft, which translates into 26.25 ft of drivable surface (supports one lane of traffic in each direction) with one side shoulder. Figure 1 shows the surveyed bridge in this study.

6
Figure 1: Illustration of the surveyed concrete bridge.
Data Collection
The most important parameters that must be considered before choosing an IR camera include the spectral range, spatial resolution, temperature range and frame rate. For observing objects at ambient temperature, a long wave length band (7.5–14 μm) are preferable to detect small thermal contrasts. The spatial resolution of an IR camera primarily depends on the object-to-camera distance, lens system and detector size. An advanced infrared thermal camera, FLIR T650sc, was utilized in this survey. The camera has uncooled microbolometer detector, 5 MP built-in digital camera, and displays thermal images with a resolution of 640 x 480 pixels. The thermal IR camera was mounted on a vehicle at a height of 8.5 ft oriented facing straight-down to the concrete deck surface. A calibrated 13.1 mm focal lens (45⁰ wide lens) was utilized. This allowed a 7 ft x 5.3 ft field of view (FOV) for each image and to survey each single lane with only two paths. The vehicle was driven at low speed over the center of each pass of the bridge deck. The images were taken every 3 ft and hence, a total of 392 thermal and digital images were collected, which covers the entire bridge deck. The survey was conducted on October 27th, 2015 at 1 PM, 6 hours after sunrise. During the survey indicated, the ambient temperature was 56⁰ F, relative humidity was 26%, and wind speed was 5 mph. Bridge deck dryness was considered during data collection since surface moisture can reduce the thermal contrast on the thermal IR images. Sun direction was also considered to avoid shadows on images. The total time of data collection was about two hours. The Matlab image acquisition toolbox was utilized to initialize acquisition and storage of the IR data.
It has suggested that Thermal IR can also be used for bridge soffits and girders (Washer et al., 2013; Ahlborn et al., 2012). The field test in this study involved collecting thermal images of the bridge soffit. The survey was conducted on October 24th, 2015 at 2 PM, 7 hours after sunrise, to maximize contrast on the images. IR images were captured for the bridge soffit from the ground level, without need for a bridge access vehicle or controlling traffic under the bridge. The images were taken as snapshots using the available 13.1 mm focal lens. This allowed a 22 ft x 17 ft FOV and hence, a total of 48 thermal and digital images were collected, which covers the entire bridge soffit. During the survey indicated, the ambient temperature was 60⁰ F, relative humidity was 32%, and wind speed was 6 mph. The total time of data collection was about one hour. The digital images were used

7
to separate patches and surface defects from subsurface anomalies. Figure 2 illustrates the utilized camera and the vehicle mounted setup to survey the bridge deck.
Figure 2: Illustration of the FLIR T650sc IR camera and vehicle mounted setup system.
DATA ANALYSIS AND RESULTS The captured IR images of the bridge deck were enhanced where several functions in the FLIR Tools+ and ResearchIR software were utilized to improve the images’ quality. For instance, the Gaussian smoothing filter was used to reduce noise where the software selects the size of the filter automatically. Histogram equalization function was used to distribute the intensities on the histogram, which in turn enhanced the image’s thermal contrast. The thermal MSX function (multi-spectral dynamic imaging) was also utilized. It is a fusion algorithm that embosses visible spectrum details (from the digital camera) onto the infrared image, enabling sharper-looking images and quicker target orientation. This pre-processing was required for further analysis and to differentiate delaminated areas from surface features (discoloration, oil stains, sand and rust deposits, etc.) that appear in the infrared image, yet are unrelated to subsurface conditions. The temperature data of each image was then saved in a separate excel file. The FLIR ResearchIR Max software was utilized for this purpose. To create a mosaicked thermogram of the entire bridge deck from the individual images, a selected window from each image was extracted and stitched together with the extracted window from the next image and so on. The height of each stitch window is the number of pixels that are equivalent to the images’ spacing. Hence, this appending process produces continuous data for each survey pass. The dimension in pixels depends upon the pixel resolution in each direction. For the surveyed bridge, the dimension of the stitched strip was 600 x 13,230 pixels and 2400 x 13,230 = 31.75 million pixels for the entire 2-lanes deck. A Matlab code was written to extract and stitch the selected pixels from each image. For visualization and to simplify the further processing,

8
it was necessary to scale-down the data dimension of the mosaic. This was achieved by assuming the entire deck divided into small boxes of 10 cm x 10 cm dimension, where the temperature does not change within each box, then, computing the average of pixels, which represents the resolution within the selected dimension. This resulted in a reduced file with 80 x 450 = 36,000 pixels. The mean function in Matlab was modified and a new code to calculate the mean for specified dimension of input data was written. Another Matlab code was also written to identify the co-ordinates of each pixel in the temperature data file and arrange the data in a column order with (x, y) temperature values of each pixel. The origin point (0, 0) was assigned to the corner of the bridge deck where the survey started and then to all the other pixels in the file. Thresholding classification using the saved temperature values was implemented in the present study to identify the defective areas in the concrete deck. Firstly, the thermal contrasts were calculated from the temperature values of the mosaicked thermogram. The max thermal contrast of the recorded data was 7.7 ⁰ C. It was then necessary to select a threshold value for the calculated thermal contrasts that could indicate where delamination was likely to be detectable. A 1°C threshold was selected for two reasons: (1) it is 20 times higher than the sensitivity of the utilized camera such that much smaller variations in surface temperature were easily detectable; (2) it is twice the ASTM D4788-03 requirement (0.5°C minimum contrast between sound concrete and a defect). The pixels with a higher temperature than this threshold value were highlighted because delaminations appear with a higher temperature. Finally, the temperature values were grouped and a condition map was plotted using a commercial mapping software to construct a high contrast image, accurately delineating the location of subsurface defects. Figure 3 illustrates the created map of the surveyed bridge deck.
Figure 3: Map of the surveyed bridge deck indicating delaminated areas.
The detection of delaminations in areas not exposed to direct sunlight such as the bridge soffit was one of the study objectives. The developed procedure for producing a mosaic plan of the bridge deck was not applicable for the soffit case as the images were taken at different angles. Applying stitching algorithms available in some commercial software depends on comparing the pixels’ features in the images to be grouped and requires exact overlap. In addition, parallax and geometric distortions, which often occur when an image is captured using a handheld camera, make the creation of such a mosaic a difficult task. Therefore, the images of the bridge soffit were processed individually to identify the
9
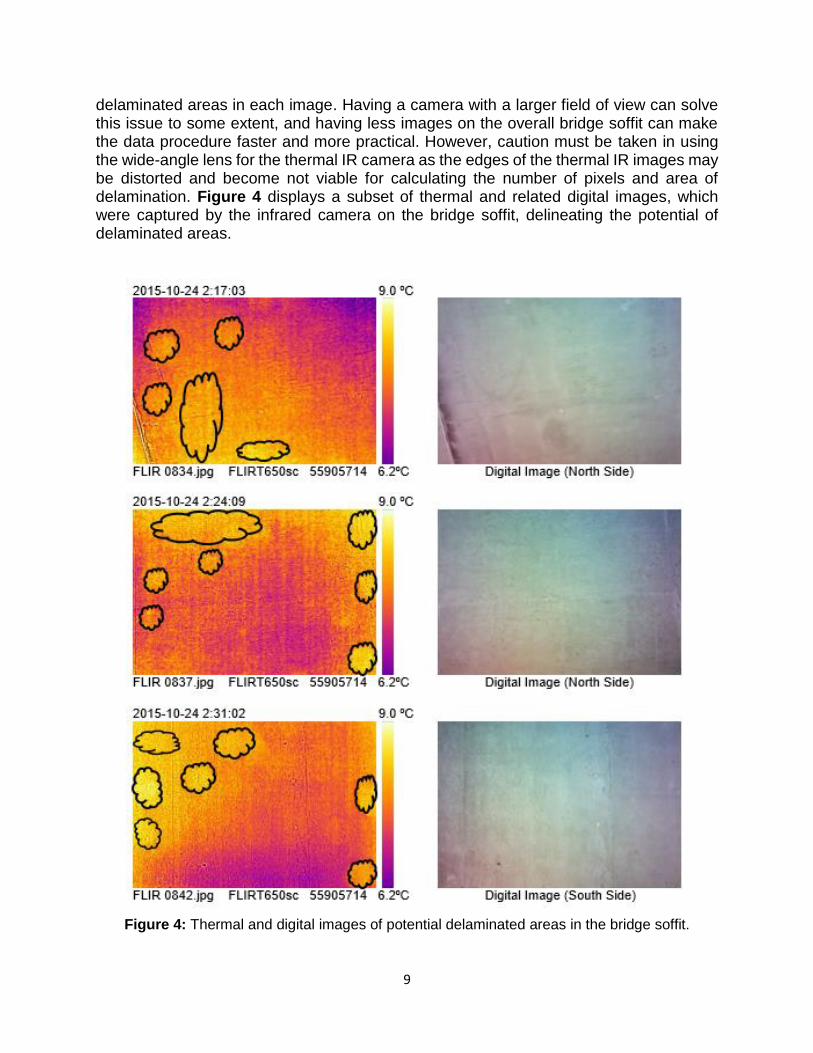
delaminated areas in each image. Having a camera with a larger field of view can solve this issue to some extent, and having less images on the overall bridge soffit can make the data procedure faster and more practical. However, caution must be taken in using the wide-angle lens for the thermal IR camera as the edges of the thermal IR images may be distorted and become not viable for calculating the number of pixels and area of delamination. Figure 4 displays a subset of thermal and related digital images, which were captured by the infrared camera on the bridge soffit, delineating the potential of delaminated areas.
Figure 4: Thermal and digital images of potential delaminated areas in the bridge soffit.

10
DISCUSSION The majority of passive IRT testing performed in previous research studies was based on testing specimens prepared in the laboratory with stimulated defects, and then exposing them to solar energy. Hence, several processing algorithms to extract information were developed based on the temperature of the pre-defined defects’ locations and sizes with respect to the temperature of the surrounding sound concrete. Conversely, when conducting IRT testing on full-scale bridges in the real world, the defects’ characteristics are unknown and extracting quantitative measures of subsurface defective areas depends on the analyzer’s experience. The rationale of the analysis in this study is that creating a plan view mosaic of the entire bridge deck facilitates the application of thresholding classification to identify defective areas. The pixels with higher temperatures than a threshold value were highlighted within specific boundaries to produce the delamination map. It can be observed in Fig. 3 that the location and geometry of subsurface defects regions were identified since the IR images were taken after the defect warmed up, thus appearing hotter than the surrounding concrete. However, it should be noted that the magnitude of the thermal contrast depends on the thickness of the delamination where increasing the delamination thickness increases the maximum thermal contrast. Manning and Holt (1982) also found that the magnitude of thermal contrast correlates with the depth of delamination. Calculating the total delaminated areas from the mosaicked thermogram provides a quantified basis for powerful decision making and hence, for prioritizing alternatives in a bridge deck rehabilitation plan. The total percentage of delaminated areas was determined by computing the total percentage of pixels in higher temperature areas over the total bridge deck. For concrete bridge components exposed to the environment, convective heat transfer can play a significant role. The thermal energy transfer by convection is a function of several parameters such as wind velocity, surface roughness, thermal properties of the air, and surface area. For solar-exposed surfaces, convective cooling may counteract the radiant heating of the sun, thus reducing the thermal gradient in concrete. Conversely, when the concrete surface is not exposed to radiant heating from the sun (non-solar loaded areas), increased convective heat transfer associated with higher wind speed helps increasing the thermal gradient in the concrete, thereby increasing the detectability of a subsurface delamination. This was demonstrated in the thermal images collected for the bridge soffit as indicated in Fig. 4. The total percentage of delaminated areas in the bridge soffit was computed for each image, similar to the procedure adopted for the bridge deck. However, it should be noted that it was very hard to locate delaminations at the intersection of the bridge soffit and the abutments. The delaminations in these areas had very small temperature differences from the sound concrete. A reason for this is the amount of concrete present in these areas acts as a large heat sink. Hence, a large temperature change is required to sufficiently affect the temperature of the concrete. Hammer sounding was conducted on the bridge deck and soffit by the bridge inspector, before conducting the IR survey. The created IR delamination map of the bridge deck

11
was compared with the hammer sounding results. It was found that the two methods provided very similar sizes and shapes of defects in the deck. The surveyed bridge was also GPR scanned on September, 2015 by a specialized consultant, as part of condition survey program. GPR evaluates the condition of concrete bridge decks based on the difference between reflection amplitudes of top rebar layer where strong reflection indicates sound concrete, while the area with high amplitude attenuation is commonly associated with concrete corrosion. The analysis of the GPR profiles identified the areas which have potential corrosion. Table 3 compares the results of the conducted IRT survey and the records of both hammer sounding and GPR scanning in terms of the percentage of the subsurface defects. The hammer sounding results showed 39% total delaminated areas on the bridge deck, whereas the total delaminated area calculated from the thermal infrared imagery survey was 36% of the total bridge deck area ( 36% of the total delaminations is common between these two surveys). Similarly, 32% and 28% total delaminated areas on the bridge soffit were identified by the hammer sounding and IRT, respectively. The GPR results indicate 24% total areas that have potential corrosion. This complies with the findings of Washer et al., (2013) who reported that not all delamination can be observed in GPR images and that GPR and IRT should be combined for accurate identification of anomalies in highway bridges. Thus, the IR survey and analysis in the present study identified the delaminated areas with superior degree of agreement with GPR and hammer sounding.
Table 1: Percentage of defective areas in the surveyed deck
Bridge Element
% Delaminated Areas (IRT)
% Delaminated Areas (Hammer Sounding)
% Potential Corrosion Areas (GPR)
Soffit 28% 32% Not Applied
Deck 36% 39% 24%
CONCLUSIONS The present study aimed to advancing infrared thermography as a reliable and time-saving tool for bridge inspection, allowing to improve the safety of highway bridges and better use of limited budgets of transportation agencies. Specifically, the application of IRT for detecting delaminations in concrete bridge components was explored. The deck and soffit of an aging concrete bridge located in Montreal were scanned using an IR camera. Data processing of the thermal IR images collected over the bridge deck involved creating a mosaicked thermogram of the entire bridge deck, locating subsurface defects and creating a delamination map. The percentage of delaminated areas was calculated in the scanned elements and compared with the survey records of other techniques. The results confirm previous findings and contribute additional evidence to establish thermal infrared imagery as a reliable and effective NDT technique for detecting delaminations in bridge decks and soffits and a key component in bridge inspection programs. However, it should be noted that weather conditions must be suitable to enable detection of subsurface features when using IRT testing. The benefits associated with the application

12
of thermal IR imagery on concrete bridge components include its ability to rapidly image large areas of concrete from distance, and ease of data collection and interpretation as compared with other NDT techniques. Remote sensing data collection of thermal IR imagery can reduce traffic disruption and lane closures on and underneath the bridge, since no direct contact is required. This has the advantage of reducing the time required to conduct inspection and the costs associated with using special access vehicles. By facilitating the early IRT detection of deterioration in bridge components, transportation agencies will be able to apply proactive maintenance actions to extend the remaining bridge life with lower life-cycle costs. REFERENCES ACI 228.2R-13 (2013). “Report on Nondestructive Test Methods for Evaluation of Concrete in
Structures.” ACI Committee 228, American Concrete Institute, Report, 83 p.
Ahlborn, T., Shuchman, R., Sutter, L., Harris, D., Brooks, C., and Burns, J. (2013). “Bridge Condition Assessment Using Remote Sensors.” Report, United States Department of Transportation – Research and Innovation Technology Administration, 296 p.
ASTM Standard D4788-03 (2013). “Standard Test Method for Detecting Delaminations in Bridge Decks Using Infrared Thermography.” ASTM International, West Conshohocken, PA. www.astm.org.
Bagavathiappan, B., Lahiri, T., Philip, J. and Jayakumar, T. (2014). “Infrared thermography for condition monitoring – A review.” J. of Infrared Physics and Technology. Vol. 60, pp: 35–55.
Gucunski, N., Imani, A., Romero, F., Nazarian, S., Yuan, D., Wiggenhauser, H., Shokouhi, P., Taffe, A., and Kutrubes, D. (2013). “Non-destructive testing to identify concrete bridge deck deterioration.” 92nd Annual Meeting, TRB, Washington, D.C. SHRP 2 Report, 96 p.
Huston, D., P. Fuhr, et al. (2002). "Nondestructive testing of reinforced concrete bridges using radar imaging techniques." Final Research Report NETC, pp: 94-92.
Manning, D., and Holt, F. (1982). "Detecting Delaminations in Concrete Bridge Decks." J. of Concrete International, Vol. 34, pp: 1-8.
Maser, K., and Roddis, W. (1990). "Principles of Thermography and Radar for Bridge Deck Assessment." J. of Transportation Engineering. Vol. 116 (5), pp: 583-601.
Moore, M., Phares, B., Graybeal, D., and Washer, G. (2001). “Reliability of visual inspection for highway bridges.” Report, FHWA-RD-01-020, pp: 1-4.
Robert, M. (1982). “Science behind Thermography-Thermal Infrared Sensing for Diagnostics and Control.” J. of Thermosense, Vol. 371, pp: 2-9.
Vladimir, V. (2014). “Thermal NDT: historical milestones, state-of-the-art and trends.” J. of Quantitative Infrared Thermography. Vol. 11 (1), pp: 66–83.
Washer, G., Fenwick, R., and Nelson, S. (2013). “Guidelines for the Thermographic Inspection of Concrete Bridge Components in Shaded Conditions.” 92nd Annual Meeting, TRB, Washington, D.C. pp: 1-14.
Washer, G., Fenwick, R., and Harper, J. (2009). “Effects of Environmental Variables on Infrared Imaging of Subsurface Features in Concrete Bridges.” J. of the Transportation Research Board. Vol. 2108/2109, pp: 107-114.