
Classifying rangeland vegetation type and coverage from NDVI time

12
Abyss. J. Sci. Technol. Vol. 1, No. 1, 2016, 12-17© 2016 Wollo University
Application of NDVI in Vegetation Monitoring Using GIS and RemoteSensing in Northern Ethiopian Highlands
Nurhussen Ahmed*
Department of Geography and Environmental Studies, Wollo University, Dessie, Ethiopia
ABSTRACT
Vegetation plays an important role in stabilizing global environment. Reliable information on the status ofvegetation using different techniques is necessary in solving environmental problems. NormalizedIndifference Vegetation Index (NDVI) is a new technique that helps in quantifying vegetation cover change.Hence the major objective of this paper is to apply NDVI in the assessment of vegetation monitoring usingGeographic Information System (GIS) and Remote Sensing (RS) in Bahir Dar Zuria District. In this case theNDVI analysis for vegetation cover change using 1986 and 2003 satellite images was analyzed. NDVIindicators like (NDVI minimum, maximum, mean, and standard deviation) are computed for the year 1986and 2003. The result of the present study showed that the maximum NDVI values are decreased from 0.9 in1986 to 0.16 in 2003. The minimum value of the NDVI increased from -0.8 in 1986 to -0.2 in 2003. Inaddition, the mean and standard deviation values decreased from 0.04 in 1986 to 0.03 in 2003 and from 0.06in 1986 to 0.05 in 2003 respectively. The result showed that the average vegetation cover was decreased in2003 when compared to that of 1986. This is due to an increased rate of deforestation which in turn causedby increasing population pressure. As a result, there should be a change in policy to prevent the negativeimpact of land use and cover change and increase the agricultural productivity per unit area and thevegetation cover through different forest rehabilitation mechanisms (afforestation and reforestation).
Keywords: Geographic Information System, Normalized Difference Vegetation Index, Remote Sensing,Vegetation.
INTRODUCTION
Vegetation plays an important role in providingdifferent ecosystem services and goods so as toadapt and mitigate the global climate change.Spectral vegetation index data have been used toinvestigate the interactions between climate andvegetation at the landscapes level, to assist landmanagement and sustainable utilization of forestand other vegetation resources and also toinvestigate climate change impacts and carbonsequestration by different vegetation types.However, global vegetation cover is decreased dueto anthropogenic interference mainly throughdeforestation by human beings which need the landfor different uses.
Ethiopia is one of the most well endowed countriesin Sub-Saharan Africa in terms of natural resources(Zeleke & Hurni 2001). The country’s forest
coverage is estimated to be 40% over a century agoand to less than 3% today (Gashaw et al., 2014).Natural resource degradation in Ethiopia has beengoing on for centuries (Zeleke & Hurni 2001).Food and Agricultural Organization of the UnitedNations (2010) estimates that 141,000 ha of foresthave been lost annually between 1990 and 2010and the average annual deforestation rate, based onforest cover change from 2005-2010, amounts to1.11% of total forest cover. This significantdecrease of vegetation cover is due to theexpansion of cultivated land (Zeleke & Hurni2001).
Environmental Protection Authority (1997)estimates that the annual deforestation in Ethiopiamainly for expansion of rain fed agriculture variesfrom 80,000 to 200,000 hector per annum. Thereare also different quantifications presented ondeforestation and level of vegetation in Ethiopia.This is due to the fact that the use of newtechnologies for natural resource assessment isvery limited.
Abyssinia Journal ofScience and Technology
*Corresponding Author.E-mail: [email protected]
13
Timely and reliable information on global trends inforest and vegetation areas have great importancefor researchers, research organizations, educationalorganization, governments, nongovernmentalorganizations and commercial sectors in furtherstudying and using the data for the organizationpurpose. Vegetation indices have long been used inremote sensing for monitoring temporal changesassociated with vegetation (Tarpley et al., 1984). Inrecent years, many different vegetation indiceshave been proposed for different purposes.Cunyong et al. (2011) employed NDVI, as anindicator to estimate percent vegetation cover inheterogeneous topographical features andvegetation cover at Muus sandy land, mid westchina.
Vegetation indices among other methods have beenreliable in monitoring vegetation change. The useof vegetation index can normalize the effects ofdifferential illumination of features in an area andcan also help in extracting specific vegetationclasses in an area (Reddy & Reddy, 2013). One ofthe most widely used indices for vegetationmonitoring is NDVI. Data on vegetation bio-physical characteristics can be derived fromVisible, Near Infrared Red and Mid-Infra Redportions of the electromagnetic spectrum(Campbell, 1987).
NDVI, an indicator of vegetation growth andcoverage, has been widely employed to describethe spatio-temporal characteristics of land use andland cover, including percent vegetation coverage(Kaufmann et al., 2003). The generation ofvegetation indexes calculated from the combinationof spectral bands stands out (Turner et al., 2003).NDVI relates spectral information of the red andnear infrared generating a variable able to estimatequantity, quality and development of vegetation(Pettorelli et al., 2005). The visible and nearinfrared bands on the satellite multi spectralsensors allow monitoring of the greenness or vigorof vegetation (Burrough, 1986). Cunyong et al.(2011) employed NDVI, an indicator to estimatepercent vegetation cover in heterogeneoustopographical features and vegetation cover atMuus sandy land, mid west china. Studies ofvegetation are often carried out using the so-calledvegetation index.
Normalized Vegetation indices are generallycalculated by rationing, differencing, summing,and linearly combining data from two or morespectral bands. They are dimensionless andradiometric measures that are intended to minimizethe solar irradiance and soil background whileenhancing the signal from vegetation (Reddy &
Reddy, 2013). GIS is a computer based that dealswith spatial collection, storage management,retrieval, conversion/changing, analysis, modelingand display information about the features thatmake up the earth’s surface (Abbas et al., 2010). Italso provided the potential for mapping andmonitoring the spatial extent of the builtenvironment and associated land/land coverchanges. It is also important for land degradationassessment, soil erosion modeling, and vegetationchange detection to mention few of them.However, the use of this powerful tool for naturalresource management is very much limited untilrecent years. Hence the major objective of thispaper is to apply the NDVI in the assessment ofvegetation monitoring by comparative study of1986 and 2003 satellite images using GIS andRemote Sensing in Bahir Dar Zuria District. In thestudy area, there is no previous studies done insimilar issues; hence this paper will helpresearchers, local government, Nongovernmentalorganizations that are working in similar issues andthe society at large. The paper can give an alarmfor every that direct or indirect contact withvegetation so as to use vegetations wisely withoutcompromising the need of the feature generation.
MATERIALS AND METHODS
Study area:
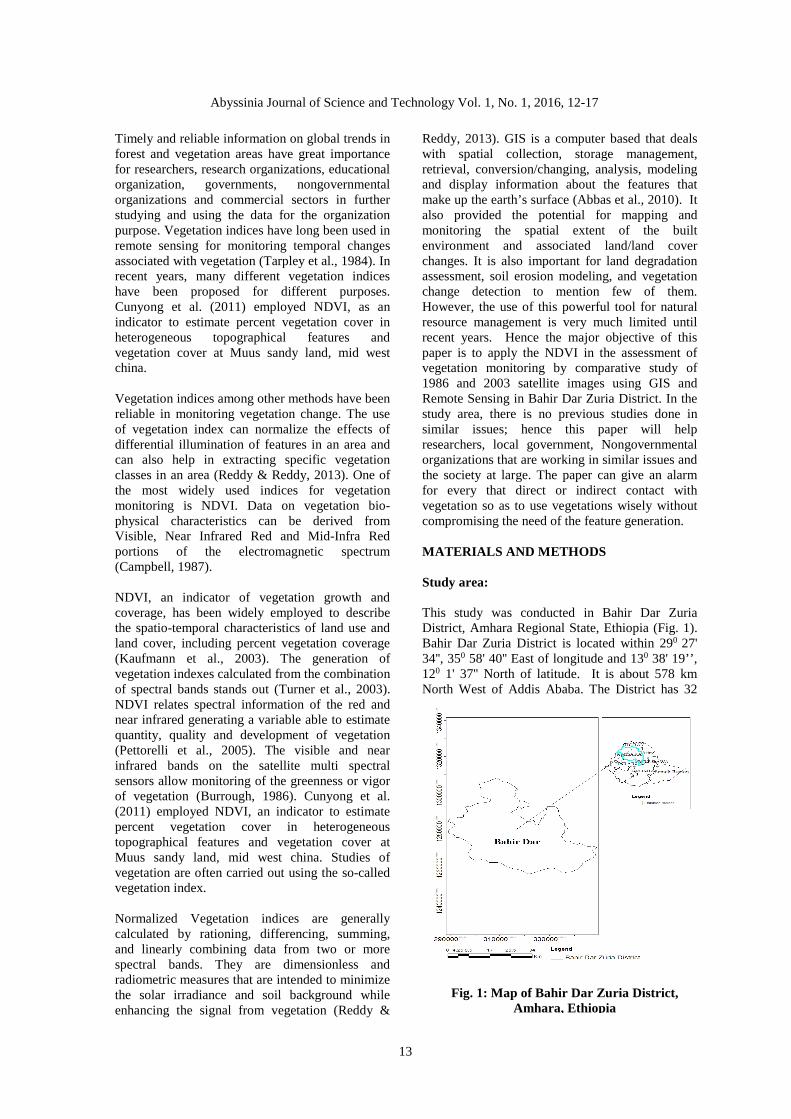
This study was conducted in Bahir Dar ZuriaDistrict, Amhara Regional State, Ethiopia (Fig. 1).Bahir Dar Zuria District is located within 290 27'34'', 350 58' 40'' East of longitude and 130 38' 19’’,120 1' 37'' North of latitude. It is about 578 kmNorth West of Addis Ababa. The District has 32
Fig. 1: Map of Bahir Dar Zuria District,Amhara, Ethiopia
Abyssinia Journal of Science and Technology Vol. 1, No. 1, 2016, 12-17

14
Kebelles and covers a total area of 128,360.48 ha.It is also located in West Gojjam zone, AmharaNational State, Ethiopia. It is bounded by LakeTana and North Gonder in North, Yilma and DenseDistrict in South, Metcha and Achefer District inWest and river Abay in East.
The area lies within the central highlandgeographic region of Ethiopia at elevations rangingbetween 1879 m and 2070 m. In addition to this,10, 2242 ha (79%) of the area is found in the slope<5% and 12,544.5ha (9.8%) is found in the slopebetween 5-10% and the rest share of the area isfound in the slope >10%. In relation to the climaticdata, the long term climatic data of the area showsthat, the area receives a mean annual rainfall of1447 mm ranging from a maximum of 2036 mm toa minimum of 895mm. The area also experiences awarm temperature climate, with averagetemperature of 21.3°C
Materials:
For the analysis of quantifying vegetation coverchange using NDVI, GIS and remote sensingtechniques Land sat TM of 1986 (specific locationof the area: path and row: 170p52r and 169p52r,with date of acquisition: 01-03-1986, and sevenbands) and Land Sat TM of 2003 (specific locationof the area: path and row 170p52r and 169p52r,with date of acquisition: 26-01-2003, and sevenbands) was used. After the data was collected, GISand remote sensing software’s was used for theprocess of the data like radiometric correction tocorrect atmospheric noises, image enhancement forbetter visualization, image layer stacking toanalyze all bands as one coordinated band, and subsetting to clip only parts of the image in thatspecific area. After the data was processed,analysis of the data using the techniques of NDVI,GIS and remote sensing was made.
Measurement of vegetation index:
Vegetation Index using NDVI is widely used, andhas been found to produce satisfactory results withrespect to describing vegetation density andcondition (Baldi et al., 2008). An imagedifferencing technique was used whereby NDVIvalues from two images were subtracted from eachother to obtain changes in NDVI. This wassubsequently converted to a NDVI (representingvegetation density) change map.
Thus, by using the NDVI result of two differentyears’s image (1986 and 2003) vegetation changeswere calculated with NDVI= (NIR-RED) /(NIR+RED) (Gashaw et al., 2014). Where NIR isthe near infrared band response for a given pixel
and RED is the red response. Green and healthyvegetation reflects much less solar radiation in thevisible (channel 1) compared to those in the near-infrared (channel 2). More importantly whenvegetation is under stress, the channel 1 value mayincrease and the channel 2 values may decrease.The NDVI were generated using the radiationmeasured in red and near infrared spectralchannels. Because of close relationship betweenvegetation and available soil moisture, NDVI waswidely used to evaluate drought condition bydirectly comparing it to precipitation or droughtindices. It is indicated that NDVI not onlyassessment the behavior of vegetation over time, itcan monitor the rainfall and drought situation. Thedata used in compiling the NDVIs are closelyrelated to the radiation absorbed and reflected byvegetation in the photosynthetic processes.
To calculate this index, it is possible to count onlifting decades of satellite sensor information,which highlights the potential of the Land Sat timeseries (Devries et al., 2015; Ding et al., 2014; Du etal., 2010; Maxwell & Sylvester, 2012; Zheng et al.,2015). Index values can range from -1.0 to 1.0,but vegetation values typically range between 0.1and 0.7. NDVI values little higher than zero, whichindicates the presence of vegetation classes,moderate and high values indicate stressedvegetation and healthy vegetation respectively;whereas near zero and negative values indicatenon-vegetation class such as water, snow, built- upareas and barren land. Only active vegetation has apositive NDVI being typically between about 0.1and 0.6 values at the higher end of the rangeindicating increased photosynthetic activity and agreater density of the canopy (Tarpley et al., 1984).In this case the NDVI analysis of 1986 and 2003images for Bahir Dar Zuria District was analyzed.NDVI indicators (NDVI minimum, maximum,mean, and standard deviation) are computed for theyear 1986 and 2003. Hence the changes in thevegetation of the two periods shows that thequantification of vegetation change in the twoperiods. The NDVI map of the 1986 and 2003 wasdesigned in addition to their statistics using theErdas Imagine 10 software. The map of the twoimages shows that the distribution of vegetationchanges in the study area.
RESULTS AND DISCUSSION
Comparison of NDVI results of 1986 and 2003:
The maximum values of the vegetation index werereduced from 0.9 in 1986 to 0.16 in 2003 (Table 1).This shows that the vegetation cover was by farreduced in some parts of the area from 1986 to2003. You can observe the result as well in the map
Abyssinia Journal of Science and Technology Vol. 1, No. 1, 2016, 12-17
15
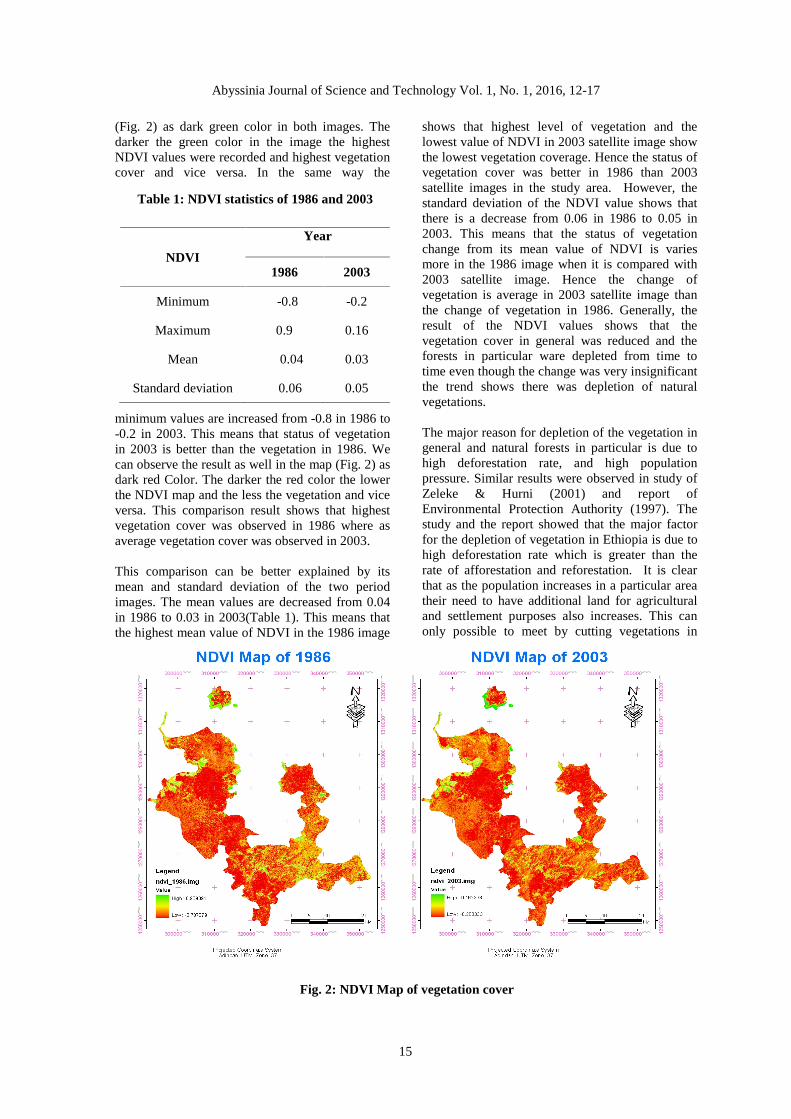
(Fig. 2) as dark green color in both images. Thedarker the green color in the image the highestNDVI values were recorded and highest vegetationcover and vice versa. In the same way the
minimum values are increased from -0.8 in 1986 to-0.2 in 2003. This means that status of vegetationin 2003 is better than the vegetation in 1986. Wecan observe the result as well in the map (Fig. 2) asdark red Color. The darker the red color the lowerthe NDVI map and the less the vegetation and viceversa. This comparison result shows that highestvegetation cover was observed in 1986 where asaverage vegetation cover was observed in 2003.
This comparison can be better explained by itsmean and standard deviation of the two periodimages. The mean values are decreased from 0.04in 1986 to 0.03 in 2003(Table 1). This means thatthe highest mean value of NDVI in the 1986 image
shows that highest level of vegetation and thelowest value of NDVI in 2003 satellite image showthe lowest vegetation coverage. Hence the status ofvegetation cover was better in 1986 than 2003satellite images in the study area. However, thestandard deviation of the NDVI value shows thatthere is a decrease from 0.06 in 1986 to 0.05 in2003. This means that the status of vegetationchange from its mean value of NDVI is variesmore in the 1986 image when it is compared with2003 satellite image. Hence the change ofvegetation is average in 2003 satellite image thanthe change of vegetation in 1986. Generally, theresult of the NDVI values shows that thevegetation cover in general was reduced and theforests in particular ware depleted from time totime even though the change was very insignificantthe trend shows there was depletion of naturalvegetations.
The major reason for depletion of the vegetation ingeneral and natural forests in particular is due tohigh deforestation rate, and high populationpressure. Similar results were observed in study ofZeleke & Hurni (2001) and report ofEnvironmental Protection Authority (1997). Thestudy and the report showed that the major factorfor the depletion of vegetation in Ethiopia is due tohigh deforestation rate which is greater than therate of afforestation and reforestation. It is clearthat as the population increases in a particular areatheir need to have additional land for agriculturaland settlement purposes also increases. This canonly possible to meet by cutting vegetations in
Table 1: NDVI statistics of 1986 and 2003
NDVI
Year
1986 2003
Minimum -0.8 -0.2
Maximum 0.9 0.16
Mean 0.04 0.03
Standard deviation 0.06 0.05
Fig. 2: NDVI Map of vegetation cover
Abyssinia Journal of Science and Technology Vol. 1, No. 1, 2016, 12-17

16
general and natural forests in particular.
Similar results were found in the studies of Gashawet al. (2014) in the studies of detection ofvegetation change using GIS techniques in HuletWegedamea area, Northern Ethiopia (nearer to mystudy area) from 1985 to 2011. According to hisresearch there is a demolishment of vegetationchange between the two periods. In addition to thisZeleke & Hurni (2001) indicated that there is adecrese in natural vegetation due to expansion ofcultivated land.
The research of Gashaw et al., (2014) is based onthe use of GIS techniques of NDVI values tocompare the quantification of vegetation change indifferent periods. However, their focus is only togive the mean NDVI value in relation to thequantification of vegetation change. In addition tothis the research of Zeleke & Hurni (2001) in theirstudy on implication of land use /land coverschange for mountain resource degradation showsthat there is a reasonable change of vegetation dueto expansion of agricultural land. Thus fullinformation in relation to the quantification ofvegetation change in addition to the possiblereasons for the problem should be addressed.Hence this research tried to combine the NDVIvalues with possible causes in the study area. Forthis purpose, the report of EnvironmentalProtection Authority (1997) and Zeleke & Hurni(2001) ware identified for the support of thepossible reasons for the problem.
In quantifying all biophysical changes, the timeseries land sat images using remote Sensing andGeographic Information System in conjunctionwith field observation can provide the degree,extent, and direction of vegetation index. TheNDVI analysis of the study area showed that thevegetation cover is decreasing from time to time.Different rehabilitation mechanisms for degradedlands should be motivated so as to reduce theproblem. Afforestation and reforestation ofdifferent species should be motivated by differentgovernmental and non-governmental organizations.Sound and practical policy with the participation ofthe society from its beginning to end is necessaryto increase the vegetation cover. In addition to thisemphasis should be given for areas that arerecorded as low NDVI values. The governmentalorganizations, the nongovernmental organizationsand other researchers should provide othercomplementary products that can substitute theneed of vegetations.
REFERENCES
Abbas, I., Muazu, M. & Ukoje, J. (2010). Mappingland use-land covers and change detection in Kafurlocal government, Katsina, Nigeria (1995- 2008)using remote sensing and GIS. ResearchJournal of Environmental and Earth Sciences, 2(1), 6-12.
Baldi, G., Nosetto, M. D., Aragón, R., Aversa, F.,Paruelo, J. M. & Jobbágy, E. G. (2008). Long-termsatellite NDVI data sets: Evaluating their ability todetect ecosystem functional changes in SouthAmerica. Sensor, 8(9), 5397-5425.
Burrough, P. A. (1986). Principals of geographicalinformation systems and land resourcesassessment. Clerandon Press, Oxford, England.
Campbell, J. B. (1987). Introduction to RemoteSensing. The Guilford Press, New York.
Cunyong, J., Tijiu, C., & Xiaohui, Y. (2011).Topography-based modeling to estimate percentvegetation cover in semi-arid Mu Us sandy land,China. Computers and Electronics in Agriculture,64 (2), 133–139.
Devries, B., Verbesselt, J., Kooistra, L. & Herold,M. (2015). Remote Sensing of EnvironmentRobust monitoring of smallscale forestdisturbances in a tropical montane forest usingLandsat time series. Remote Sensing ofEnvironment, 161, 107– 121.
Ding, Y., Zhao, K., Zheng, X. & Jiang, T. (2014).Temporal dynamics of spatial heterogeneity overcropland quantified by time-series NDVI, nearinfrared and red reflectance of Landsat 8 OLIimagery. International Journal of Applied EarthObservation and Geoinformation, 30, 139–145.
Du, H., Cui, R., Zhou, G., Shi, Y., Xu, X., Fan, W.& Lü, Y. (2010). The responses of Moso bamboo(Phyllostachys heterocycla var. pubescens) forestaboveground biomass to Landsat TM spectralreflectance and NDVI. Acta Ecologica Sinica, 30,257–263.
Environmental Protection Authority (1997).Environmental Policy. A report from The FederalDemocratic Republic of Ethiopia, Addis Ababa, 1-27.
Food and Agricultural Organization of the UnitedNations. (2010). Global Forest ResourceAssessment. Country Report Ethiopia. VialedelleTermedi Caracalla, Rome, Italy
Gashaw, T., Bantider, A. & Mahari, A. (2014).Evaluations of Land Use/Land Cover Changes andLand Degradation in Dera District, Ethiopia: GISand Remote Sensing Based Analysis. International
Abyssinia Journal of Science and Technology Vol. 1, No. 1, 2016, 12-17
17
Journal of Scientific Research in EnvironmentalSciences, 2(6), 199-208.
Gashaw, T., Fenatahun, T. & Dinkayoh, T. (2014).Detection of vegetation changes using GIStechniques in Northern Ethiopia. Merit ResearchJournal of Agricultural Science and Soil Sciences,2(6), 077-080.
Kaufmann, R. K., Zhou, L. M., Myneni, R. B.,Tucker, C. J., Slayback, D., Shabanov, N. V. &Pinzon, J. (2003). The effect of vegetation onsurface temperature: a statistical analysis of NDVIand climate data. Geophysical Research Letters,30, 21–47.
Maxwell, S. K. & Sylvester, K. M. (2012).Identification of “evercropped” land (1984-2010)using Landsat annual maximum NDVI imagecomposites: Southwestern Kansas case study.Remote Sensing of Environment, 121, 186–195.
Pettorelli, N., Vik, J. O., Mysterud, A., Gaillard, J.M., Tucker, C. J. & Stenseth, N. C. (2005). Usingthe satellite-derived NDVI to assess ecologicalresponses to environmental change. Trends inEcology and Evolution. 20, 503–510.
Reddy, A. S. & Reddy, M. J. (2013). NDVI basedassessment of land use land cover dynamics in arainfed watershed using remote sensing and GIS.International Journal of Scientific and EngineeringResearch, 4(12), 2229 – 5518.
Tarpley, J. D., Schneider, S. R., & Money, R. L.(1984). Global Vegetation Indices from theNOAA-7 Meteorological Satellite. Journal ofApplied Meteorology and Climatology, 23(3), 491-494.
Turner, W., Spector, S., Gardiner, N., Fladeland,M., Sterling, E. & Steininger, M. (2003). Remotesensing for biodiversity science and conservation.Trends in Ecology and Evolution, 18, 306–314.
Zeleke, G., & Hurni, H. (2001). Implications ofland use and land cover dynamics for mountainresource degradation in the NorthwesternEthiopian Highlands. Mountain Research andDevelopment. 21 (2), 184-191.
Zheng, B., Myint, S. W., Thenkabail, P. S. &Aggarwal, R. M., (2015). A support vectormachine to identify irrigated crop types using time-series Landsat NDVI data. International Journalof Applied Earth Observation and Geoinformation,34, 103–112.
Abyssinia Journal of Science and Technology Vol. 1, No. 1, 2016, 12-17


![Vegetation Indices NDVI (Normalized Difference Vegetation Index) NDVI = [ρ NIR -ρ red ] / [ρ NIR +ρ red ], where ρ NIR/red is the measured reflectance.](https://static.fdocuments.in/doc/165x107/5514ada4550346ea6e8b5fc3/vegetation-indices-ndvi-normalized-difference-vegetation-index-ndvi-nir-red-nir-red-where-nirred-is-the-measured-reflectance.jpg)


