Application of model tests to the determination of losses ... · PDF fileVanes in Design Form...
30
I LL INO S UNIVERSITY OF ILLINOIS AT URBANA-CHAMPAIGN PRODUCTION NOTE University of Illinois at Urbana-Champaign Library Large-scale Digitization Project, 2007.
Transcript of Application of model tests to the determination of losses ... · PDF fileVanes in Design Form...

I LL INO SUNIVERSITY OF ILLINOIS AT URBANA-CHAMPAIGN
PRODUCTION NOTE
University of Illinois atUrbana-Champaign Library
Large-scale Digitization Project, 2007.


UNIVERSITY OF ILLINOIS BULLETINIsSUED WuZLY
VoL XXXI April 24, 1934 NIo. 34[Entered as second-class matter December 11, 1912, at the post office at Urbana, Illinois, under
the Act of August 24, 112. Acceptace for mailing at the special rate of postage providedfor in section 1103, Act of October 8, 1917, authorized July 31, 1918.]
APPLICATION OF MODEL TESTS TO THEDETERMINATION OF LOSSES RESULT-
ING FROM THE TRANSMISSION OFAIR AROUND A MINE SHAFT-
BOTTOM BEND
bY
CLOYDE M. SMITH
BULLETIN No. 265ENGINEERING EXPERIMENT STATION
PusLIBsem BaT T UtnavsarrY or ItLINor, URBANA
PaIca: THnrT CENTs

SHE Engineering Experiment Station was established by actof the Board of Trustees of the University of Illinois on De-cember 8, 1903. It is the purpose of the Station to conduct
investigations and make studies of importance to the engineering,manufacturing, railway, mining, and other industrial interests of theState.
The management of the Engineering Experiment Station is vestedin an Executive Staff composed of the Director and his Assistant, theHeads of the several Departments in the College of Engineering, andthe Professor of Industrial Chemistry. This Staff is responsible forthe establishment of general policies governing the work of the Station,including the approval of material for publication. All members ofthe teaching staff of the College are encouraged to engage in scientificresearch, either directly or in co5peration with the Research Corpscomposed of full-time research assistants, research graduate assistants,and special investigators.
To render the results of its scientific investigations available tothe public, the Engineering Experiment Station publishes and dis-tributes a series of bulletins. Occasionally it publishes circulars oftimely interest, presenting information of importance, compiled fromvarious sources which may not readily be accessible to the clienteleof the Station, and reprints of articles appearing in the technical presswritten by members of the staff.
The volume and number at the top of the front cover page aremerely arbitrary numbers and refer to the general publications of theUniversity. Either above the title or below the seal is given the num-ber of the Engineering Experiment Station bulletin, circular, or reprintwhich should be used in referring to these publications.
For copies of publications or for other information addessTHE ENGINEERING EXPERIMENT STATION,
UNIVERSITY OF ILLINOIS,
URBANA, ILLINOIS

UNIVERSITY OF ILLINOIS
ENGINEERING EXPERIMENT STATION
BULLETIN No. 265 APRIL, 1934
APPLICATION OF MODEL TESTS TO THE DETER-MINATION OF LOSSES RESULTING FROM THE
TRANSMISSION OF AIR AROUND A MINESHAFT-BOTTOM BEND
BY
CLOYDE M. SMITHRESEARCH ASSISTANT PROFESSOR OF MINING ENGINEERING
ENGINEERING EXPERIMENT STATIONPUBLISHED BY THE UNIVERSITY OF ILLINOIS, URBANA

4000-3-34-5495-S UNNeIS sIOF ILLINOIS
TABLE OF CONTENTS
PAGE
I. INTRODUCTION . . . . . . . . . . . . . 5
1. Investigation by Means of Models . . . . . . 52. Object and Scope of This Investigation . . . . 53. Acknowledgments. . .. . . . . . . .. 7
II. MODEL AND AUXILIARY APPARATUS . . . . . . . 74. M odel . . . . . . . . . . . . . . 75. Auxiliary Apparatus . . . . . . . . . . 9
III. TESTING METHODS . . . . . . . . . . . . 116. Determination of Rate of Flow . . . . . . . 117. Measurement of Pressure Losses . . . . . . 12
IV. RESULTS OF TESTS . . . . . . . . . . . . 128. Direct Comparison of Losses . . . . . . . 129. Reynolds' Number . . . . . . . . . . 14
10. Coefficient of Resistance . . . . . . . . . 1511. Relation Between Coefficient of Resistance and Reyn-
olds' Number . . . . . . . . . . . 1512. Reversed Flow. . . . . . . . . ... . 1713. Velocity Distributions . . . . . . . . . 1814. Lines of Flow . . . . . . . . . . . . 19
V. SUMMARY AND CONCLUSIONS . . . . . . . . . 2115. Summary and Conclusions . . . . . . . . 21

LIST OF FIGURES
NO. PAGE
1. Elevation of Model and Air Duct. . .. . . . . . . ... . 62. Model of Shaft-Bottom . . . . . .. . . . . . . . . 83. Model of Main West Aircourse . . . .. . . . . ... . 94. Vanes in Design Form . . . . . . .. . . . . . . . . 105. Vanes in Mine Form . . . . . . . . . . . . . . . . 116. Relation Between Total Pressure Loss and Mean Velocity in Shaft . 137. Relation Between Coefficient of Resistance and Reynolds' Number . 158. Isovels, Section ai2 Without Vanes .... . . . . . . . 189. Isovels, Section aju With Vanes in Mine Form . . . . . . . . . 19
10. Isovels, Section a 1n With Vanes in Design Form . . . . . . . . 20

APPLICATION OF MODEL TESTS TO THE DETERMINATIONOF LOSSES RESULTING FROM THE TRANSMISSION OF
AIR AROUND A MINE SHAFT-BOTTOM BEND
I. INTRODUCTION
1. Investigation by Means of Models.-Within the past decade ortwo there has been a widespread increase in the use of models to pre-dict and to investigate the performance of full-scale appliances. Whilea great diversity of problems has been approached by this means,models have reached their highest development and widest applicationin problems involving the flow of fluids, notably in aeronautics andhydraulics.*
The recent increase in the use of models is attributable to a grow-ing appreciation of the economy and expediency with which proposeddesigns can be tested or new designs developed, coupled with a betterunderstanding of the principles of similarityt which underlie all modeltests. Such use has been further stimulated by the many recent re-searches which have greatly advanced our knowledge of the flow offluids.1
While it appears that little use has been made of models in at-tempting to solve the problems of mine ventilation, two instances maybe noted. In one of these,I a %4 -scale model was made of a portionof a straight aircourse in which the resistance to the flow of air had
been determined underground. In the other** a one-foot square ductwas lined with timber sets at various spacings and tested at each spac-ing. However, neither of these experiments established a completelysatisfactory correlation between the results of model testing and actualmine data.
2. Object and Scope of This Investigation.-In view of the attrac-
tive possibilities of models as a means of solving some of the major
problems which arise in connection with mine ventilation, such as the
*"Use of Models in Aerodynamics and Hydrodynamics," 0. G. Tietjens; Trans. A.S.M.E.vol. 54, No. 8, pp. 225-233, Sept. 30, 1932.
tL. Bairstow, "Applied Aerodynamics," Chapter VIII, 1920.V"Recent Results of Turbulence Research," L. Prandtl; Technical Memorandum, No. 720,
National Advisory Committee for Aeronautics, Washington, 1933. (Translation from German withbibliography.)
¶"Calculation and Measurement of Air Flow in Mines," J. L. Hodgson; Engineering, vol.122, pp. 58-9, 1926, and "Underground Tests on the Flow of Air at Rockingham Colliery,"Douglas Hay and W. R. Cooke; Transactions of the Institution of Mining Engineers, London,vol. LXXI, part 2, pp. 337-365, 1926.
*""Experiments on the Flow of Air in Ducts," W. E. Cooke and I. C. F. Statham; Trans-actions of the Institution of Mining Engineers, London, Vol. LXXIII, Part 1, pp. 78-103, 1927.

ILLINOIS ENGINEERING EXPERIMENT STATION
Fla. 1. ELEVATION OF MODEL AND AIR DucT
MODEL TESTS OF AIR ENERGY LOSSES IN MINES
best design for bends, splits, junctions, and air crossings, an attemptwas made to see how closely certain losses already measured under-ground could be duplicated in a small-scale model.
The best underground data available were those relating to theshaft-bottom bend in which vanes were recently installed.* A one-tenth scale model of this air shaft bottom was made and tested, bothwithout and with vanes, and the results were compared with thosewhich had been observed underground at corresponding conditions offlow.
3. Acknowledgments.-This work was carried on as a part of theregular work of the Engineering Experiment Station, of which ACTINGDEAN A. C. WILLARD is acting director, and the Department of Min-ing Engineering of which PROF. A. C. CALLEN is the head.
II. MODEL AND AUXILIARY APPARATUS
4. Model.-The model consists of three parts: (a) the lower partof the air-shaft compartment which leads into the shaft bottom, (b)the shaft bottom proper, and (c) the aircourse, which leads from it.The aircourse is known, in the mine, as the Main West aircourse (seeFig. 2, Bulletin 249). That part of the model which represents theshaft is made of %-inch ply board, as shown in Fig. 1, the insidedimensions of the model being one-tenth of the corresponding minedimensions.
. The concrete arch at the outlet of the shaft, (Fig. 2, Bulletin 249)was simulated by cutting a progressive series of arches out of thinwhite pine boards, ten thicknesses being required to represent the wall,which is 2.3 ft. thick. The shaft outlet had been cross-sectioned infour vertical north-south planes, and from the resulting four diagramsit was possible to interpolate, with a reasonable degree of accuracy,the shape of the arch for the successive wooden laminae used in theconstruction of the model. After the laminae had been glued andnailed together, the triangular gaps beneath their fiducial edges werefilled in and the entire surface was smoothed with modeling clay.Figure 2 illustrates the model of the shaft bottom with the arch inplace.
The model of the Main West aircourse was constructed of a seriesof rectangular frames of white pine boards 0.067 ft. thick and from0.2 to 0.3 ft. wide, each frame being 1.5 ft. or more in outside di-
*"The Effects on Mine Ventilation of Shaft-Bottom Vanes and Improvements in Aircourses,"Univ. of Ill. Eng. Expt. Sta. Bul. 249, 1932.

ILLINOIS ENGINEERING EXPERIMENT STATION
FIG. 2. MODEL OF SHAFT-BOTTOM
mensions. The outline of an entry cross-section was cut from theinside of each frame, as shown in Figs. 1 and 3. The outlines wereobtained either directly from the underground cross-sections (Fig. 2,Bulletin 249), or by interpolation between them.
The model vanes were cut from 23-gage sheet tin which is 0.00189ft. thick. Inasmuch as the mine vanes* were 16-gage, or 0.00502 ft.,thick, the model vanes were not to scale, being, relatively, about 3.8times too thick. It was felt that this discrepancy would not appre-ciably affect the flow of air, and that the greater thickness was neededto minimize distortion of the vanes at high air speeds. Instead of at-tempting to simulate the supporting angle irons used in the mine, threetabs about %-inch square were left on each end of each vane. Thesetabs were drilled and turned 90 degrees into a plane normal to the axisof the vane, making them coincide with the east to west walls of theshaft. After the position of the end of each vane had been marked on
*Univ. of Ill. Eng. Expt. Sta. Bul. 249, pp. 28-30.

MODEL TESTS OF AIR ENERGY LOSSES IN MINES
FIG. 3. MODEL OF MAIN WEST AIRCOURSE
the walls according to the relative dimensions of Fig. 13, Bulletin 249,the model vanes were fixed in place with small round-headed screws.
Tests were made with the vanes in the design form, then the vaneswere deformed to conform as nearly as possible to the shape of themine vanes.* Figure 4 shows the vanes before, and Fig. 5 shows themafter deformation.
A removable floor, made up of strips 0.1 ft. wide and running east-west, was provided for the sump, as the mine sump was floored in thismanner with 2 X 12-in. lumber just before the vanes were installed.
5. Auxiliary Apparatus.-Air was forced or drawn through themodel by a centrifugal fan, which was direct-connected to a variablespeed d-c motor. A modified form of Ward-Leonard control was usedfor the motor, which permitted it to operate over a wide range inspeed.
By suitable connections the fan discharged into a round duct whichterminated in a six-foot piece of 12-in. iron pipe, in which wasmounted an impact tube, as shown in Fig. 1. This tube was movable
*Univ. of Ill. Eng. Expt. Sta. Bul. 249, p. 30 and Fig. 14.

ILLINOIS ENGINEERING EXPERIMENT STATION
FIG. 4. VANES IN DESIGN FORM
so that its port could be placed anywhere along one diameter of thepipe. Three static pressure ports were equally spaced about the cir-cumference of the section through the port of the impact tube. Inter-connected, they gave the effect of a piezometer ring. The differencebetween the static pressure which they transmitted and the total pres-sure transmitted by the impact tube was the velocity pressure at theport of the impact tube.
This equipment permitted a velocity-pressure traverse to be madealong one diameter of the air stream. Provision was made for travers-ing a second diameter at right angles to the first, as provided in thestandard fan-testing code* by rotating the iron pipe 90 degrees aboutits longitudinal axis. The traverse section will be referred to as sec-tion t. From the end of the iron pipe an adapter conducted the airfrom the circular pipe to a rectangular galvanized-iron duct, whichled to the wooden model (Fig. 1).
*"Fan Engineering," 3d Edition, p. 573, 1933.

MODEL TESTS OF AIR ENERGY LOSSES IN MINES
FIG. 5. VANES IN MINE FORM
All pressures were read on inclined differential gages. These, withaccessory equipment, have been described previously* in Bulletin 158.
III. TESTING METHODS
6. Determination of Rate of Flow.-In testing the model the rateof air flow for each fan speed was calculated from readings of thecenter velocity pressure at section t by means of a center constant,which is the ratio of the mean velocity of flow through section t to
the velocity at the center of that section. This center constant (-)
was established by traversing section t at different fan speeds, withthe model in place, as shown in Fig. 1.
By following the routine calculations specified in the fan-testingcodet a mean center constant of 0.924 was derived. This permitted
*Univ. of Ill. Eng. Expt. Sta. Bul. 158, p. 8.tOp. cit.

ILLINOIS ENGINEERING EXPERIMENT STATION
center velocity pressure readings at section t to be translated directlyinto the rate of air flow, which is expressed in cubic feet per minute.
7. Measurement of Pressure Losses.-In the mine the losses be-tween two arbitrarily located cross-sections were attributed to theshaft-bottom bend. These sections were section A1 , in the shaft,51.5 ft. above the sump, and section A 2,, in the Main West aircourse,22.7 ft. west of the east wall of the shaft. In the model these dis-tances are 5.15 and 2.27 ft., and the sections are designated as sec-tions a, and a12, respectively.
In section A, in the mine a straight pitot tube was supported alongthe center line of the shaft by means of a 2 X 4-inch board suspendeddiagonally across the shaft. No attempt was made to simulate thismethod of support in the model, but a curved pitot tube was insertedalong the short axis of the model section and fixed with its static portsat the center of section a1 . The take-off tube used underground insection A2, was more closely simulated in the model by bringing acurved static-pressure tube up through the floor and fixing it with itsports at the point in section a, 2 corresponding to the take-off point insection A,1 . It is thought that the deviations from strict geometricalsimilarity involved in this mode of pressure take-off were not sufficientto affect significantly the registration of the static-pressure differentialbetween the two sections.
Inasmuch as the total pressure loss between these two sections canbe calculated from the observed static-pressure differential betweenthem, and the rate of flow, their cross-sectional areas being known, itwas only necessary to read two differential pressures in testing, i.e.,the center velocity pressure at section t, and the static-pressure differ-ential between sections a, and a12 .
For each model condition (with and without vanes) readings weretaken for each of five or six fan speeds at rates of flow ranging fromabout 1000 to 3000 ft. per min. in the shaft. The latter figure repre-sents the maximum capacity of the fan.
Psychrometric observations accompanied each test, and all pres-sures were converted to a basis of air of standard unit weight, 0.075pound per cubic foot.
IV. RESULTS OF TESTS
8. Direct Comparison of Losses.-The losses incurred in forcing airthrough the model are compared graphically with those of the mine
MODEL TESTS OF AIR ENERGY LOSSES IN MINES
AMek lVe/oc/gy /in S/x5/l /17 fV eler 1?71.
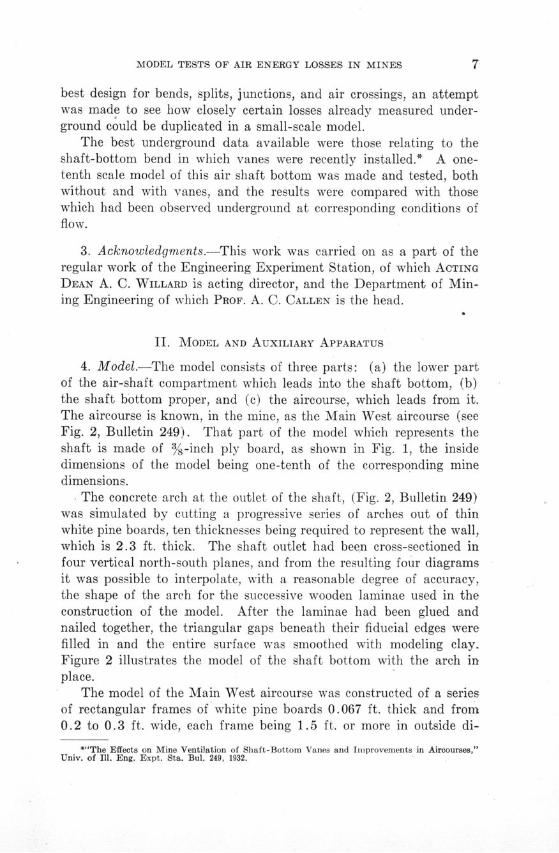
FIG. 6. RELATION BETWEEN TOTAL PRESSURE LOSS AND MEAN VELOCITY IN SHAFT
shaft-bottom in Fig. 6, where the total pressure loss between sectionsa, and a12 is plotted logarithmically against the mean velocity in theshaft. A typical test is represented for each of the three major testconditions, (a) without vanes, (b) with vanes in mine form and (c)with vanes in design form. The mine data for conditions (a) and (b)are included, there being no such data for condition (c). In both casesthe model losses were slightly greater than, or in agreement with themine losses.
The bottom curve shows that further savings would have beeneffected in the mine had it been possible to install the vanes in theirdesign form (see Bulletin 249, p. 30).

ILLINOIS ENGINEERING EXPERIMENT STATION
9. Reynolds' Number.-Figure 6 compares the total pressure lossin the model with that in the mine at like mean velocities, but this isnot in accord with the laws of dynamic similarity* which are applic-able to this case. They require that the resistance of the model becompared with that of the mine at like values of Reynolds' Number,tVD V Here
V = mean velocity of air flow, ft. per sec.D = diameter of the conduit, ft.v = kinematic viscosity of air, ft.2 per sec.
Reynolds' Number is, thus, a dimensionless coefficient, i.e., for agiven situation it has the same value in whatever self-consistent setof units (e.g., English or metric) the dimensions are expressed. Forair, v has a mean value of 0.00016 ft.2 per sec. As the only geomet-rically regular part of the model is the shaft, and since it is rectangularin cross-section and its true diameter is less easily determined than itshydraulic radius, the latter has been used to derive D in computingReynolds' Number. This is conventional procedure,t four times theratio of the cross-sectional area to the perimeter of the conduit being
4 4 100used for D. For the mine this is 4 100-= 9.77 ft., and for2 X (8+12.5)
the model it is one-tenth as great, or 0.977 ft. Dividing these valuesby v gives the following values for Reynolds' Number:
for the model shaft.............. :............ 6100Vfor the mine shaft............................ 61000V
This shows clearly that, to satisfy the requirements of the laws ofdynamic similarity, which specify the same Reynolds' Number formodel and full scale part, it would have been necessary to make themodel tests at ten times the mean velocity of the mine tests withwhich they were to be compared. Inasmuch as the minimum meanvelocity in the mine shaft was about 12 ft. per sec. (Reynolds' Num-ber = 733 000) while the maximum obtainable in the model shaft wasabout 55 ft. per sec. (Reynolds' Number - 336 000), it was not pos-sible to get the same Reynolds' Number for the model and the mine,so that the requirements of dynamic similarity were not fully met.
Unavoidably, this condition has been the rule rather than the ex-ception in model testing,¶ 10- to 20-fold extrapolations of the model
*Tietjens, op. cit.tIbid.:Hay and Cooke, op. cit.¶"The N.A.C.A. Variable-Density Wind Tunnel," Eastman N. Jacobs and Ira H. Abbott,
Report No. 416, p. 31, Nat. Advis. Com. for Aeronautics, 1932.
MODEL TESTS OF AIR ENERGY LOSSES IN MINES
i-.
4.0 - - -i -
3.0 -- -
09- - -
0.6 -o
WTes s
00000 00 000 s00 000 1000000 2000000Reyno/ds' AVC,'mber,-
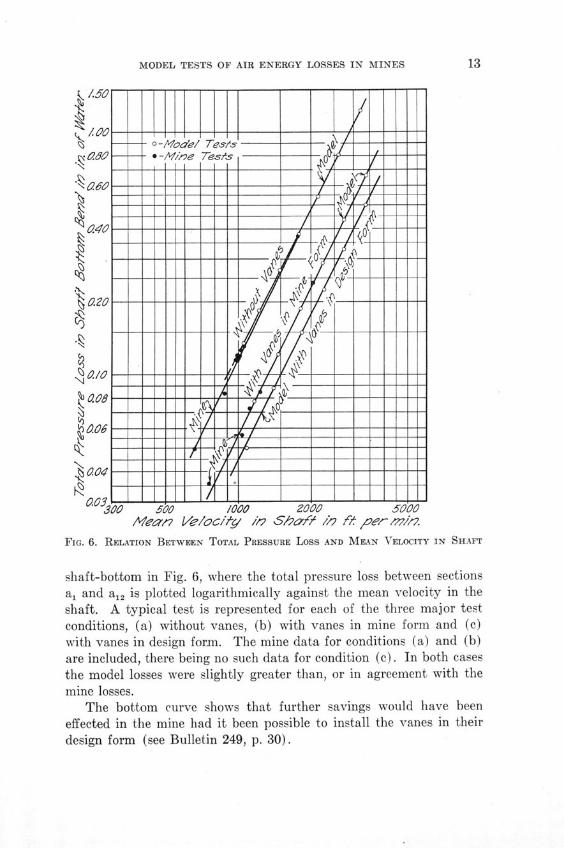
FIG. 7. RELATION BETWEEN COEFFICIENT OF RESISTANCE AND REYNOLDS' NUMBER
values having been found permissible in favorable cases. In this case,a 3-fold extrapolation would bring about a satisfactory overlap of themodel and the mine values of Reynolds' Number. Such extrapolationsare permissible when the flow is well beyond its critical stage orstages* and has attained a stable state of turbulence. Under theseconditions the coefficient of resistance to flow is nearly independent ofthe Reynolds' Number.
10. Coefficient of Resistance.-The foregoing discussion of Reyn-olds' Number has served only to establish a basis on which to com-pare the resistance of the model and its prototype. It has not dealtwith the resistance itself. Just as with Reynolds' Number, it is desir-able to express the resistance in terms of a dimensionless number. Theratio of the total pressure loss to the mean-velocity pressure in theshaft has been used as a coefficient of resistance, R. Both being pres-sures, measured in inches of water, their ratio is dimensionless.
11. Relation Between Coefficient of Resistance and Reynolds'Number.-The ratio R is plotted logarithmically against the Reynolds'Number in Fig. 7 for two mine conditions and three model conditions.The mine conditions are: without vanes, and with vanes in the mineform. A model condition corresponding to each of these is shown, andan additional one with the vanes in the design form.
*Reynolds, Osborne, Phil. Trans. Roy. Soc., 1883.

ILLINOIS ENGINEERING EXPERIMENT STATION
In contrast with Fig. 6, in which the slope of the lines is about 2.0,the curves of Fig. 7 are nearly horizontal. They would be strictly soif the total pressure loss varied as the square of the mean velocity,because the resistance is expressed as the ratio of the total pressureloss to the mean-velocity pressure, which in turn varies as the squareof the mean velocity, so that, if the total pressure loss also varied inthis way, the ratio R would be a constant, and independent of V andof Reynolds' Number. Where the curves of Fig. 7 slope down to theright, as for the model without vanes, the total pressure loss varies asa power of the mean velocity a little less than 2.0, the converse beingtrue where the curves slope upward.
The satisfactory alignment of the model test points indicates sta-bility of flow. The scattering of the mine points is probably attribut-able to errors in measuring small fluctuating pressures, rather than toactual flow characteristics. The mine points are more scattered inFig. 7 than in Fig. 6 because the steep slope of the curves of Fig. 6tends to obscure vertical deviations from the mean line; whereas suchdeviations appear in full effect in Fig. 7. Due to the scattering of themine points, no attempt has been made to establish a sloping meanline, a horizontal line having been arbitrarily drawn through the meanvalue of the resistances for each condition.
Extension of the model curves to the range of mine values ofReynolds' Number shows that for normal underground flow (Reynolds'Number about 1 000 000) the model resistances were a few per centgreater than the corresponding mine resistances. They are sum-marized as follows:
Coefficient of Excess of Model ResistanceResistance Coefficient over that of
Condition Mine Model Mineper cent
Without vanes........ 1.86 1.95 4.8With vanes in
mine form.......... 0.93 1.01 8.6
The fact that the coefficients of resistance obtained from the modelare greater than those obtained directly from the mine might at firstseem surprising, especially as the surfaces of the model are probablyrelatively smoother than the mine surfaces; but the increase in re-sistance coefficient with a decrease in Reynolds' Number here noted isin agreement with what is observed in the testing of airfoil models andother aerodynamic bodies, and is probably attributable to what istermed "scale effect." The more nearly the scale of the model ap-

MODEL TESTS OF AIR ENERGY LOSSES IN MINES
proaches that of the mine the more nearly will the model coefficientsagree with those from the mine.
Despite this discrepancy the order of agreement between the modeltest and the mine results is such as to indicate that useful data can beexpected from small-scale models of the distinctive parts of under-ground aircourses.
The third model condition tested, i.e., with the vanes in the designform, is an illustration of this. The lowest curve of Fig. 7, extrap-olated to the mine range shows that the coefficient of resistance couldhave been further reduced from 0.93 to 0.76, an additional 18 percent, had it been possible to install the vanes in the mine withoutdistortion. This would have increased the net annual savings attribut-able to the vanes from $200 to nearly $240 (see Bul. 249, p. 31).
Inasmuch as this design was an arbitrary adaptation of certainindustrial designs, rather than an attempted optimum solution for thecase at hand, the model may serve as a means of working out the bestmeans of deflecting the air current from the vertical shaft into thehorizontal aircourse.
12. Reversed Flow.-Provision is commonly made at mines forreversing the flow of air, which raises the question as to what effectsuch a reversal might have on the mine resistance. Since the passage-ways of a mine are usually irregular, offering an unsystematic se-quence of expansions and contractions to the air stream, and since agiven expansion or contraction will ordinarily offer a different re-sistance to flow in one direction from that experienced in the other, thetotal mine resistance may be expected to be different under reversedand normal air coursing, respectively.
To illustrate this the model was installed on the intake of the fan,and air was drawn in through the entry into the shaft. For the threetest conditions, without vanes, and with vanes in mine and in designform, the resistance of the shaft-bottom under reversed flow was foundto be from about two-thirds to one-half of that with normal flow.Since the cross-sectional area of the shaft is appreciably less than thatof the entry, the air stream contracts in going around the bend underreversed flow, but expands under normal flow. As contractions nor-mally occasion less resistance than corresponding expansions, theresult obtained is consistent with expectations.
No generalizations can be made from this case, however, beyondthe statement that the resistance of a mine under reversed flow maybe expected to differ from that under normal flow. To what extent,

ILLINOIS ENGINEERING EXPERIMENT STATION
0 4 6 8 /a -/1/ches
FiG. 8. ISOVELS, SECTION An WITHOUT VANES
or in which direction, it would differ would have to be determined foreach case individually.
13. Velocity Distributions.-Since the mine shaft was inaccessiblefor exploration nothing is known of the velocity distribution or lines
of flow within it, save that the center constant V" at section A1
was greater than unity, showing that a less-than-average velocityprevailed at the center of the section (see Bul. 249, p. 37). This wasnot true in section a,, in the model, where the center constant was lessthan unity. This shows that there was some dissimilarity betweenthe model and the mine with respect to the velocity distribution in theshaft. Whether or not this affected their comparative resistances isnot known.
The distribution of velocity within the entry model was investi-gated by subdividing section a 12 into twenty-five subsections, as shownin Fig. 8, and traversing it in the manner usually employed for under-ground work (see Bul. 158, p. 17). In this figure the locus of themean of the velocities found at the twenty-five traverse points is indi-cated by the line designated Vm, or 1.0. The remaining lines connect

MODEL TESTS OF AIR ENERGY LOSSES IN MINES
o E 4 6 8 /-//2ches
FIG. 9. ISOVELS, SECTION Ai WITH VANES IN MINE FORM
points having equal velocities bearing the designated ratio to the meanvelocity.
In many respects Fig. 8 shows the converse of a normal velocitydistribution, as its minimum velocities are near the center and itsmaximum velocities are near the periphery. The high velocities nearthe floor are a clear indication that most of the air coming down theshaft was carried to the lower part of the shaft bottom and flowed outalong the floor of the entry.
In comparison with Fig. 8, Fig. 9 shows how the vanes of the formused in the mine affected the velocity distribution in section a12. Thehigh-velocity area has been shifted from the floor to the ribs, leavinga vertical low-velocity area down the center. The distribution wasconsiderably improved by using vanes of the design form, as shown inFig. 10. The velocity in the lower half of the section is nearly uni-form, and there is only a small low-velocity area in the upper centralpart of the section.
14. Lines of Flow.-The lines of flow within the model were ob-served with a one-inch piece of thread attached to the end of anL-shaped piece of stiff wire.

ILLINOIS ENGINEERING EXPERIMENT STATION
0 4 6 WTH VANES N DESGN O
FIG. 10. ISOVELS, SECTION A, 2 WITH VANES IN DESIGN FORM
Without the vanes, the lines of flow in the model were quite likethose in the mine (see Bul. 249, Fig. 19). The two eddies in the backcorners of the shaft-bottom seemed to be more active in the modelthan in the mine, their currents rising in each corner to the mid-heightof the entry. All of the air discharging from the shaft-bottom intothe aircourse had a downward component, except that immediatelyadjacent to the sides.
In the form used in the mine the vanes were so deformed that theircentral parts more nearly approached flat sheets placed at 45 degreesto the horizontal than circular arcs. They were true to design at theirends, however.
The air flowed over vane No. 1, (see Fig. 1) in good lines, butdischarged at a downward angle ranging from a few degrees at theends of the vane to about 45 degrees centrally. Good flow conditionsalso prevailed in the lower one-fourth of the space between vanes 1and 2. In the remainder of the space eddying became increasinglymarked as the bottom of No. 1 vane was approached. In fact, therewas a re-entry of air under the lower part of No. 1 vane. The flowover vane No. 3 was much better than that over No. 2. There was

MODEL TESTS OF AIR ENERGY LOSSES IN MINES
some eddying just under vane No. 2 but no re-entry of air, as underNo. 1. The best flow conditions prevailed between vanes 3 and 4, thatbetween vanes 4 and 5 being rather sluggish, with some eddying alongthe surface of vane No. 5.
With the vanes in the design form, the flow over vanes 1, 2, and 3was considerably improved by a reduction in the downward com-ponents of discharge and in the re-entry or eddying just under thevanes.
In the model entry there was a regressive current of air flowingeast between the roof and the lagging near it (see Fig. 1). This airwas supplied by the main current at the west end of the lagging anddischarged into that current just west of the arch. A second badfeature of the flow in the entry was the existence of a helix of flow ineach upper corner. Both helices were dominantly progressive in theirflow, but their rotation was unmistakable. The north one rotatedcounter-clockwise and the south one clockwise as viewed in the direc-tion of flow. Such a pair of helices is frequently visible in a streamof smoke issuing into the wind from a vertical stack, and there areindications that helices of this kind are common in mine airflow. Inthe case of the model entry they are thought to be due to the crowdingof the air out of the high-velocity zone along the floor, up along theribs into the upper, low-velocity zone. This leaves an upper centralzone of eddying flow, which persisted under the best flow conditionswhich were obtained (see Fig. 10).
This analysis of the flow of air through the model shows that thevanes greatly improved the transmission of air around the shaftbottom bend, but that their greatest effectiveness was confined to theouter and lower currents. Considerable further improvement is desir-able in the inner and upper currents. This probably could be effectedby redesigning the arch and the upper part of the vane structure.
V. SUMMARY AND CONCLUSIONS
15. Summary and Conclusions.-In line with the increasing use ofmodels in other types of work, a one-tenth scale model of a mine shaftbottom of known resistance to airflow was tested under various con-ditions, to determine the validity of model tests in comparison withfull scale tests.
Air was forced through the model by a variable-speed centrifugalfan, the rate of flow being determined by traverse or center velocitypressure readings in the circular duct leading to the model. This rate

ILLINOIS ENGINEERING EXPERIMENT STATION
varied from about 1000 to 3000 feet per minute in the shaft for eachtest. Pressure losses were determined between a section in the shaftand one in the aircourse, each of which corresponded in position andconfiguration to a pressure-measuring section which had been used inthe mine. An arbitrary coefficient of resistance was established toserve as a function of Reynolds' Number. It is the ratio of the totalpressure loss to the mean-velocity pressure in the shaft. It wasplotted logarithmically against Reynolds' Number both for the modeland the mine (see Fig. 7). Extrapolation of the model results into therange of mine Reynolds' Numbers shows the model resistance coeffi-cient to be a few per cent greater than that of the mine for comparableconditions of flow. This might indicate some lack of similarity be-tween the model and the mine, or between their respective flows, butis probably due mainly to "scale effect."
The agreement was sufficiently close to indicate that useful resultscan be expected from small-scale models in designing such importantunits as bends and splits in the aircourses. Their use should also aidin the selection of a type and spacing of supporting timbers to com-bine the maximum of support with the minimum resistance to thepassage of air.
While vanes, as installed in the mine, reduced the resistance of theshaft bottom bend 50 per cent, the model tests indicated that if theyhad been installed in the design form they would have reduced theresistance more than 60 per cent. It also showed that the resistanceof the bend would be considerably less under reversed flow than it wasunder normal flow, either with or without vanes.
Finally, the model provided a ready means of analyzing the flowof air through the bend, and indicated where further improvementsin the design of the bend might be made.
RECENT PUBLICATIONS OFTHE ENGINEERING EXPERIMENT STATIONt
Bulletin No. 217. Washability Tests of Illinois Coals, by Alfred C. Callen andDavid R. Mitchell. 1930. Sixty cents.
Bulletin No. 218. The Friability of Illinois Coals, by Cloyde M. Smith. 1930.Fifteen cents.
Bulletin No. 219. Treatment of Water for Ice Manufacture, by Dana Burks, Jr.1930. Sixty cents.
Bulletin No. 220. Tests of a Mikado-Type Locomotive Equipped with NicholsonThermic Syphons, by Edward C. Schmidt, Everett G. Young, and Herman J.Schrader. 1930. Fifty-five cents.
Bulletin No. 221. An Investigation of Core Oils, by Carl H. Casberg and Carl E.Schubert. 1931. Fifteen cents.
Bulletin No. 222. Flow of Liquids in Pipes of Circular and Annular Cross-Sections, by Alonzo P. Kratz, Horace J. Macintire, and Richard E. Gould. 1931.Fifteen cents.
Bulletin No. 223. Investigation of Various Factors Affecting the Heating ofRooms with Direct Steam Radiators, by Arthur C. Willard, Alonzo P. Kratz, MauriceK. Fahnestock, and Seichi Konzo. 1931. Fifty-five cents.
Bulletin No. 224. The Effect of Smelter Atmospheres on the Quality of Enamelsfor Sheet Steel, by Andrew I. Andrews and Emanuel A. Hertzell. 1931. Ten cents.
Bulletin No. 225. The Microstructure of Some Porcelain Glazes, by Clyde L.Thompson. 1931. Fifteen cents.
Bulletin No. 226. Laboratory Tests of Reinforced Concrete Arches with Decks,by Wilbur M. Wilson. 1931. Fifty cents.
Bulletin No. 227. The Effect of Smelter Atmospheres on the Quality of DryProcess Enamels for Cast Iron, by A. I. Andrews and H. W. Alexander. 1931.Ten cents.
Circular No. 21. Tests of Welds, by Wilbur M. Wilson. 1931. Twenty cents.Bulletin No. 228. The Corrosion of Power Plant Equipment by Flue Gases,
by Henry Fraser Johnstone. 1931. Sixty-five cents.Bulletin No. 229. The Effect of Thermal Shock on Clay Bodies, by William R.
Morgan. 1931. Twenty cents.Bulletin No. 230. Humidification for Residences, by Alonzo P. Kratz. 1931.
Twenty cents.Bulletin No. 231. Accidents from Hand and Mechanical Loading in Some Illinois
Coal Mines, by Alfred C. Callen and Cloyde M. Smith. 1931. Twenty-five cents.Bulletin No. 232. Run-Off Investigations in Central Illinois, by George W.
Pickels. 1931. Seventy cents.Bulletin No. 233. An Investigation of the Properties of Feldspars, by Cullen W.
Parmelee and Thomas N. McVay. 1931. Thirty cents.Bulletin No. 234. Movement of Piers during the Construction of Multiple-Span
Reinforced Concrete Arch Bridges, by Wilbur M. Wilson. 1931. Twenty cents.Reprint No. 1. Steam Condensation an Inverse Index of Heating Effect, by
Alonzo P. Kratz and Maurice K. Fahnestock. 1931. Ten cents.Bulletin No. 235. An Investigation of the Suitability of Soy Bean Oil for Core
Oil, by Carl H. Casberg and Carl E. Schubert. 1931. Fifteen cents.Bulletin No. 236. The Electrolytic Reduction of Ketones, by Sherlock Swann,
Jr. 1931. Ten cents.Bulletin No. 237. Tests of Plain and Reinforced Concrete Made with Haydite
Aggregates, by Frank E. Richart and Vernon P. Jensen. 1931. Forty-five cents.Bulletin No. 238. The Catalytic Partial Oxidation of Ethyl Alcohol, by Donald
B. Keyes and Robert D. Snow. 1931. Twenty cents.Bulletin No. 2389. Tests of Joints in Wide Plates, by Wilbur M. Wilson, James
Mather, and Charles 0. Harris. 1931. Forty cents.*Bulletin No. 240. The Flow of Air through Circular Orifices in Thin Plates, by
Joseph A. Polson and Joseph G. Lowther. 1932. Twenty-five cents.
*A limited number of copies of bulletins starred are available for free distribution.tCopies of the complete list of publications can be obtained without charge by addressing the
Engineering Experiment Station, Urbana, Ill.

ILLINOIS ENGINEERING EXPERIMENT STATION
*Bulletin No. 241. Strength of Light I Beams, by Milo S. Ketchum and Jasper 0.Draffin. 1932. Twenty-five cents.
*Bulletin No. 242. Bearing Value of Pivots for Scales, by Wilbur M. Wilson,Roy L. Moore, and Frank P. Thomas. 1932. Thirty cents.
*Bulletin No. 248. The Creep of Lead and Lead Alloys Used for Cable Sheathing,by Herbert F. Moore and Norville J. Alleman. 1932. Fifteen cents.
*Bulletin No. 244. A Study of Stresses in Car Axles under Service Conditions,by Herbert F. Moore, Nereus H. Roy, and Bernard B. Betty. 1932. Forty cents.
*Bulletin No. 245. Determination of Stress Concentration in Screw Threads bythe Photo-Elastic Method, by Stanley G. Hall. 1932. Ten cents.
Bulletin No. 246. Investigation of Warm-Air Furnaces and Heating Systems,Part V, by Arthur C. Willard, Alonzo P. Kratz, and Seichi Konzo. 1932. Eighty cents.
*Bulletin No. 247. An Experimental Investigation of the Friction of ScrewThreads, by Clarence W. Ham and David G. Ryan. 1932. Thirty-five cents.
*Bulletin No. 248. A Study of a Group of Typical Spinels, by Cullen W. Parmelee,Alfred E. Badger, and George A. Ballam. 1932. Thirty cents.
*Bulletin No. 249. The Effects on Mine Ventilation of Shaft-Bottom Vanes andImprovements in Air Courses, by Cloyde M. Smith. 1932. Twenty-five cents.
*Bulletin No. 250. A Test of the Durability of Signal-Relay Contacts, by EverettE. King. 1932. Ten cents.
*Bulletin No. 251. Strength and Stability of Concrete Masonry Walls, by FrankE. Richart, Robert B. B. Moorman, and Paul M. Woodworth. 1932. Twenty cents.
*Bulletin No. 252. The Catalytic Partial Oxidation of Ethyl Alcohol in the VaporPhase. The Use of a Liquid Salt Bath for Temperature Control, by Donald B.Keyes and William Lawrence Faith. 1932. Ten cents.
Bulletin No. 253. Treatment of Water for Ice Manufacture, Part II, by DanaBurks, Jr. 1933. Forty-five cents.
Bulletin No. 254. The Production of Manufactured Ice at Low Brine Temper-atures, by Dana Burks, Jr. 1933. Seventy cents.
Bulletin No. 255. The Strength of Thin Cylindrical Shells as Columns, byWilbur M. Wilson and Nathan M. Nemark. 1933. Fifty cents.
Bulletin No. 256. A Study of the Locomotive Front End, Including Tests of aFront-End Model, by Everett G. Young. 1933. One dollar.
*Bulletin No. 257. The Friction of Railway Brake Shoes, Its Variation withSpeed, Shoe Pressure and Wheel Material, by Edward C. Schmidt and Herman J.Schrader. 1933. One dollar.
*Bulletin No. 258. The Possible Production of Low Ash and Sulphur Coal inIllinois as Shown by Float-and-Sink Tests, by D. R. Mitchell. 1933. Fifty cents.
*Bulletin No. 259. Oscillations Due to Ionization in Dielectrics and Methods ofTheir Dectection and Measurement, by J. Tykocinski Tykociner, Hugh A. Brown,and Ellery Burton Paine. 1933. Sixty-five cents.
*Bulletin No. 260. Investigation of Cable Ionization Characteristics with Dis-charge Detection Bridge, by Hugh A. Brown, J. Tykocinski Tykociner, and ElleryB. Paine. 1933. Fifty cents.
*Bulletin No. 261. The Cause and Prevention of Calcium Sulphate Scale inSteam Boilers, by Frederick G. Straub. 1933. Eighty-five cents.
*Bulletin No. 262. Flame Temperatures in an Internal Combustion EngineMeasured by Spectral Line Reversal, by Albert E. Hershey and Robert F. Paton.1933. Fifty-five cents.
Reprint No. 2. Progress in the Removal of Sulphur Compounds from WasteGases, by Henry Fraser Johnstone. 1933. Twenty cents.
*Bulletin No. 263. The Bearing Value of Rollers, by Wilbur M. Wilson. 1933.Forty cents.
*Circular No. 22. Condensation of Moisture in Flues, by William R. Morgan.1933. Thirty cents.
*Bulletin No. 264. The Strength of Screw Threads under Repeated Tension, byHerbert F. Moore and Proctor E. Henwood. 1933. Twenty-five cents.
*Bulletin No. 265. Application of Model Tests to the Determination of LossesResulting from the Transmission of Air Around a Mine Shaft-Bottom Bend, byCloyde M. Smith. 1934. Thirty cents.
*A limited number of copies of bulletins starred are available for free distribution.
UNIVERSITY OF ILLINOIS
Colleges and Schools at Urbana
COLLEGE OF LIBERAL ARTS AND SCIENCES.-General curriculum with majors in thehumanities and sciences; specialized curricula in chemistry and chemical en-gineering; general courses preparatory to the study of law and journalism;pre-professional training in medicine, dentistry, and pharmacy.
COLLEGE OF COMMERCE AND BUSINESS ADMINISTRATION.-Curricula in generalbusiness, trade and civic secretarial service, banking and finance, insurance,accountancy, transportation, commercial teaching, foreign commerce, indus-trial administration, public utilities, and commerce and law.
COLLEGE OF ENGINEERING.-Curricula in ceramics, ceramic engineering, chemicalengineering, civil engineering, electrical engineering, engineering physics, gasengineering, general engineering, mechanical engineering, metallurgical engi-neering, mining engineering, and railway engineering.
COLLEGE OF AGRICULTURE. -Curricula in agriculture, floriculture, general homeeconomics, and nutrition and dietetics.
COLLEGE OF EDUCATION. - Curricula in education, agricultural education, homeeconomics education, and industrial education. The University High Schoolis the practice school of the College of Education.
COLLEGE OF FINE AND APPLIED ARTs.-Curricula in architecture, landscape archi-tecture, music, and painting.
COLLEGE OF LAW.-Professional curriculum in law.
SCHOOL OF JOURNALISM.-General and special curricula in journalism.
SCHOOL OF PHYSICAL EDUCATION.-Curricula in physical education for men andfor women.
LIBRARY SCHOOL.-Curriculum in library science.
GRADUATE SCHOOL.-Advanced study and research.
Colleges in Chicago
COLLEGE OF MEDICINE.-Professional curriculum in medicine.
COLLEGE OF DENTISTRY.-Professional curriculum in dentistry.
COLLEGE OF PHARMACY.-Professional curriculum in pharmacy.
Experiment Stations and Scientific Bureaus at Urbana
AGRICULTURAL EXPERIMENT STATION STATE GEOLOGICAL SURVEY
ENGINEERING EXPERIMENT STATION STATE NATURAL HISTORY SURVEY
BUREAU OF BUSINESS RESEARCH STATE WATER SURVEY
BUREAU OF EDUCATIONAL RESEARCH
For general catalog of the University, special circulars,and other information, address
THE REGISTRAR, UNIVERSITY OF ILLINOIS,URBANA, ILLINOIS