Application of microneedles to enhance delivery of micro ... · PDF fileApplication of...
218
•
Transcript of Application of microneedles to enhance delivery of micro ... · PDF fileApplication of...

Loughborough UniversityInstitutional Repository
Application of microneedlesto enhance delivery of
micro-particles from geneguns
This item was submitted to Loughborough University's Institutional Repositoryby the/an author.
Additional Information:
• A Doctoral Thesis. Submitted in partial fulfilment of the requirementsfor the award of Doctor of Philosophy of Loughborough University.
Metadata Record: https://dspace.lboro.ac.uk/2134/13744
Publisher: c© Dongwei Zhang
Please cite the published version.

This item was submitted to Loughborough University as a PhD thesis by the author and is made available in the Institutional Repository
(https://dspace.lboro.ac.uk/) under the following Creative Commons Licence conditions.
For the full text of this licence, please go to: http://creativecommons.org/licenses/by-nc-nd/2.5/

1
Application of Microneedles to Enhance Delivery of
Micro-particles from Gene Guns
Dongwei Zhang
A Doctoral Thesis Submitted in Partial Fulfilment of the Requirements for the
Degree of Doctor of Philosophy (PhD)
Loughborough University
2009 - 2013

ii
Abstract
Gene gun assisted micro-particle delivery system is an excellent method for the delivery of
DNA into target tissue so as to carry out gene transfection in the target cells. The gene gun is
primarily a particle accelerator which accelerates DNA-coated micro-particles to sufficient
velocities to breach the target layer enabling the micro-particles to penetrate to a desired
depth and target the cells of interest to achieve gene transfer. However, an inevitable problem
in this process is the tissue/cell damage due to the impaction of the pressurized gas and
micro-particles on the target.
The purpose of this research is developing a new conceptual system which improves the
penetration depth of micro-particles at less imposed pressure and particle injection velocity.
This is achieved by applying a microneedle array and ground slide in the gene gun system,
thus a study involving microneedle assisted micro-particle delivery is conducted in this work.
Microneedle array is used to create holes in the target which allows a number of
micro-particles to penetrate through the skin which enhances the penetration depth inside
target. The ground slide is used to load a pellet of the micro-particles and prevent the
pressurized gas to avoid the impaction on the target. The operation principle is that the pellet
is attached to ground slide which is accelerated to a sufficient velocity by the pressurized gas.
The pellet is released from the ground slide which separates into individual micro-particles by
a mesh and penetrates to a desired depth inside the target.
An experimental rig to study various aspects of microneedle assisted micro-particle delivery
is designed in this PhD research. The passage percentage of the micro-particles and size of the
separated micro-particles are analysed in relation to the operating pressure, mesh pore size
and Polyvinylpyrrolidone (PVP) concentration to verify the applicability of this system for
the micro-particle delivery.
The results have shown that the passage percentage increases from an increase in the mesh
pore size and operating pressure and a decrease in PVP concentration. A mesh pore size of
178 μm and pellet PVP concentration of 40 mg/ml were used for the bulk of the experiments
in this study as these seem to provide higher passage percentage and the narrow size
distribution of the separated micro-particles. In addition, the velocity of the ground slide is
detected by the photoelectric sensor and shown that it increases from an increase in operating

iii
pressure and reaches 148 m/s at 6 bar pressure, A further analysis in the penetration depths of
the micro-particles to determine whether they achieve enhanced penetration depths inside the
target after using microneedles is carried out. A skin mimicked agarose gel is obtained from
comparing the viscoelastic properties of various concentration of agarose gel in comparison
with the porcine skin, which is assumed to mimic the human skin. These experiments are used
to relate the micro-particle penetration depth with the operating pressure, microneedle length
and particle size.
In addition, a theoretical model is developed based on the experimental data to simulate the
microneedle assisted micro-particle delivery which provide further understanding of the
microneedle assisted micro-particle delivery. The developed model was used to analyse the
penetration depth of micro-particles in relation to the operation pressure, target properties,
microneedle length and particle size and density. The modelling results were compared with
the experimental results to verify the feasibility of the microneedle assisted micro-particle
delivery for micro-particles delivery. As expected, both experimental and theoretical results
show that the micro-particles achieve an enhanced penetration depth inside target. The
maximum penetration depth of micro-particles is increased from an increase in operating
pressure, microneedle length, particle size and density.

iv
Acknowledgement
Firstly, I’m grateful to my co-supervisors Dr Diganta B Das and Professor Chris D Rielly.
Under their excellent supervision with valuable advice and guidance, I was able to develop
this project. Without their help, this project could not have progressed.
I would like to thank Mr Tony Eyre, Mr Mark Barron and Mr Jim Muddimer for the help of
the experimental rig. Moreover, I would like to thank Mr Dave Smith, Mr Graham Moody,
Mrs Kim Robertshaw and Mr Sean Creedon for their constant technical help for my lab work.
Furthermore I’d like to thank Mr Amish Patel and Mrs Sandhy Moise for their help in the
experiment.
I would like to thank the Loughborough University for the financial support. I would also like
to thank my dear friends - they have used their spare time to help me to improve my language.
I’d like to thank my fellow PhD students in room S169 and in the chemical engineering
department for their friendship and making my time here a memorable learning experience.
Finally, I’m grateful to my family for their continuous support for these years.

v
Nomenclature
Symbol Description Unit
ν Heat capacity ratio -
γ Strain -
γ 0 Strain amplitude %
μ Gas viscosity Pa· s
μt Friction coefficient between particle of the target Pa· s
μ’ Friction coefficient between particle and porcine skin tissue/gel Pa· s
ρ Density of air kg/m3
ρp Density of micro-particle kg/m3
ρt Density of target kg/m3
σy Yield stress of the target MPa
σ Stress Pa
σ 0 Stress amplitude Pa
δ A phase lag between the strain and stress degrees
ω Angular frequency rad/sec
θ The angle of boundary of the gap between mesh and skin degrees
d The penetration depth of micro-particle in the skin m
fd Drag force on the micro-particle in the target N
k Percentage of the axial component %
l Travelling distance between mesh and target m
lz Displacement of the separated micro-particle at axial component in
the deceleration stage
m
lr Displacement of the separated micro-particle at radial component in
the deceleration stage
m
m Mass of an individual micro-particle g
mp Mass of the pellet g
n Number of micro-particles in the pellet -
rp Radius of the micro-particle m
t Time s
u Velocity of the ground slide m/s
ud Velocity of the separated micro-particle in the target m/s
ur Velocity of the separated micro-particle at radial component m/s

vi
uz Velocity of the separated micro-particle at axial component m/s
u1 Velocity of the separated micro-particle after passing through the
mesh
m/s
u2 Velocity of the separated micro-particle in the space between mesh
and target
m/s
vi Velocity of the micro-particle m/s
x Percentage of energy loss during separation stage %
Ap Projected cross-sectional area of the separated micro-particle m2
Cd Air drag coefficient -
E Kinetic energy of the ground slide J
E1 Kinetic energy of the separated micro-particle J
Esfe Surface free energy of the pellet J
Ed Energy lose during micro-particle traveling through the space
between mesh and target due to the frictional drag force
J
Fd Air drag force N
Fy Yield force N
Ff Frictional force N
Fi Resistive inertial force of target material N
G’ Storage modulus Pa
G’’ Loss modulus Pa
I The impact point -
L Length of the barrel(the acceleration stage) m
L1 Space between the mesh and target m
M Mass of the pellet attached ground slide g
P1 Initial pressure to push the ground slide bar
P2 The pressure decreased from the initial pressure bar
R Radius of the ground slide/the barrel m
Re Reynolds number of separated particle -
V1 Initial volume of the receiver L
V2 The expanded volume L
Vi The velocity on impact m/s
Vri The radial velocity component on impact m/s
Vzi The axial velocity component on impact m/s
Vr The velocity on rebound m/s

vii
Vrr The radial velocity component on rebound m/s
Vzr The axial velocity component on rebound m/s
Vxi The tangential velocity component on impact m/s
Vyi The normal velocity component on impact m/s
Vxr The tangential velocity on rebound m/s
Vyr The normal velocity on rebound m/s

viii
Abbreviations
CDN Converging-diverging Nozzle,
CN Conical Nozzle
DNA Deoxyribonucleic acid
HDA Helium-driven Apparatus
LGG Light gas gun
Micro-CT Micro computed tomography
MN Microneedle
OCT Optical coherence tomography
PC Polycarbonate
PG Pneumatic Gun
PGA Poly-glycolic acid
PPG Powder Particle Gun
PS Photoelectric sensor
PT Pressure transducer
PTFE Polytetrafluoroethylene
PVA Poly (vinyl) alcohol
PVP Polyvinylpyrrolidone
SC Stratum Corneum
SEM Scanning electron microscope
VE Viable Epidermis

ix
Publications
Journals
Zhang D.W., Das D.B., Rielly C.D. (2013). Poteential of microneedle assisted
micro-particle delivery: A review. Drug Delivery (in press) (Chapeter 2)
Zhang D.W., Das D.B., Rielly C.D. (2013). An experimental study of microneedle
assisted micro-particle delivery, Journal of Pharmaceutical Sciences, 102(10):
3632-3644, DOI: 10.1002/jps.23665. (Chapter 3)
Zhang D.W., Das D.B., Rielly C.D. (2013). Microneedle assisted micro-particle
delivery: Experiments using skin mimicking agarose gel. Journal of Pharmaceutical
Sciences (revised version resubmitted) (Chapter 4)
Zhang D.W., Das D.B., Rielly C.D. (2013). Microneedle assisted micro-particle
delivery: Mathematical model formulation and experimental verification (submitted)
(Chapter 5)
Zhang D.W., Das D.B., Rielly C.D. (2013). Microneedle assisted micro-particle
delivery: Experiments and modelling on the effects of particle characteristics
(submitted) (Chapter 6)

x
List of Figures
Figure Title Page
2.1. Left: The commercial hand-held gene gun of SJ-500 (Biopex, 2013),
Right: The commercial Helios gene gun (Bio-rad, 2013)
7
2.2. A schematic sketch of the powder gun (redrawn from Klein et al.
(1987))
9
2.3. The layout of powder gene gun (redrawn from Zhou (1995)) 10
2.4. The schematic sketch of the high-voltage electric gene gun (redrawn
from Christou et al. (1990))
11
2.5. The schematic diagram and principle of high-pressure gas gene gun
(redrawn from Zhou (2000))
12
2.6. The schematic sketch of light gas gun (redrawn from Mitchell et al.
(2003))
12
2.7. The schematic sketch of helium-driven gene gun (redrawn from
Williams et al. (1991))
13
2.8. The schematic diagram of contoured shock tube (redrawn from
Kendall (2002))
13
2.9. A schematic diagram of the PowderJect (redrawn from Liu (2006)) 14
2.10. Gene transfer stages of the biolistic gene gun (redrawn from Zhang et
al. (2007)), La, Ls and Ld are the distance of acceleration, separation
and deceleration stages
14
2.11. The liquid gene sprayer: A: The liquid gene gun at energy storage state
B: The state of liquid gene gun after injection (redrawn from Zhou
(2006))
15
2.12. The schematic of the laser plasma jet (redrawn from Menezes et al.
(2012))
16
2.13. Schematic diagram of the extracellular and intercellular failure
mechanisms (a): extracellular failure mechanism for large particles (b):
intercellular failure mechanism for small particles (redrawn from
Mitchell et al. (2003)).
17
2.14. (a). Solid conical microneedle arrays (Henry et al., 1998) (b) Silicon
microneedle array used for gene delivery in skin (Mikszta et al., 2002).
22
2.15. (a): Solid MN array made with the help of PGA (Park et al., 2005) (b): 23

xi
Solid MN array made with the help of PVA (Donnelly et al., 2011)
2.16. (a) Hollow conical microneedle arrays on the right (Stoeber et al.,
2000) (b) hollow silicon microneedle array with sloping side walls
(Gardenier et al., 2003)
24
2.17. Hollow metal microneedles (Davis et al., 2004) 24
2.18. The structure of the skin (MacNeil., 2007) 26
2.19. Methylene blue staining of MN holes on the human skin (needle
height: 180 and 280 μm) (Haq et al., 2009)
27
2.20. (a): A 2D OCT image for the investigation of the effect of the MN
height on the penetration depth inside the porcine skin (A: 280 µm; B:
350µm; C: 600µm; D: 900µm) (Donnelly et al., 2010b) (b): A 2D
OCT image to analyse the effect of the application force on the
penetration depth of MN inside the porcine skin (A: 4.4 N (newton); B:
7.0 N; C: 11 N; D: 16.4 N) (Donnelly et al., 2010b) (c): A 3D OCT
image showing MN insertion in the skin (needle height: 600 µm; base
width: 300 µm; spacing: 300 µm) (Donnelly et al., 2011)
29
2.21. A possible structure of a microneedles assisted micro-particle delivery
system
30
2.22. A schematic cross-section of the skin: (a) the normally diffusion route
(b) route of solid MN assisted micro-particle delivery (c) route of
hollow MN assisted micro-particle delivery (d) route of normal
micro-particle penetration using a gene gun system (Kendall, 2006)
31
3.1. Schematic diagram of the experimental rig 40
3.2. The detected signal waves of the ground slide motion by a oscilloscope 43
3.3. The particle size distribution of uniform stainless steel powder by a
logarithmic scale from 0 to 900μm
44
3.4. SEM image of the uniform stainless steel micro-particles 45
3.5. The circumscribed and inscribed circles for different shape particles 46
3.6. Schematic diagram of the pellet press 48
3.7. The ground slide holder 48
3.8. (a) The realistic pellet press and the fabricated pellets
(b). SEM image of the top surface of the pellet
49
3.9. SEM images of the Adminpatch MN 1500: (a). The overall view (b). 50

xii
Top view of a single microneedle (c). Side view of a microneedle array
3.10. The velocity of solid PTFE ground slide against the operating pressure
of gas receiver for different lengths of barrel
52
3.11. The comparison of the effect of material on ground slide acceleration
in the wide and narrow barrel for two different diameters of
barrel/ground slide
53
3.12. The effect of operating pressure on the pellet separation for two
different PVP concentrations: (a). Passage percentage (b). Rebound
percentage (c). Stuck percentage
56
3.13. The PVP concentration effect on the particle passage percentage at
various pressures
57
3.14. The particle passage percentage against PVP concentrations for various
mesh sizes
58
3.15. SEM image of the separated particle size which is made of 40 mg/ml
PVP concentration and operated at 4.5 bar pressure: (a): 122 μm pore
size (mesh 120), (b) 178 μm pore size (mesh 80), (c) 310 μm pore size
(mesh 50)
60
3.16. SEM image of the separated particle size which is operated at 4.5 bar
pressure and mesh with pore size 178 μm: (a): 40 mg/ml PVP
concentration made of pellet, (b): 60 mg/ml PVP concentration made
of pellet, (c): 75 mg/ml PVP concentration made of pellet, (d): 90
mg/ml PVP concentration made of pellet
63
3.17. An image of the micro-particle sprayed on an agarose gel 64
3.18. Optical microscope image of stainless steel micro-particle penetration
into agarose gel (40 mg/ml PVP, 5 bar, Mesh with pore size 178 μm)
65
4.1. (a). A schematic diagram of the experimental rig which is an improved
version of the Figure 3.1;
(b). A schematic diagram of the agarose gel mold
73
4.2. A SEM image of the irregular stainless steel (biocompatible)
micro-particles
75
4.3. The image of MN arrays: (a) AdminPatch MN 1200 (b) In-house
fabricated MN array
77
4.4. Skin mimicking based on the dynamic viscoelastic properties by using
agarose gel: (a) storage modulus against angular frequency, (b) loss
81

xiii
modulus against angular frequency, (c) friction coefficient between
particle and porcine skin tissue/gel against angular frequency
4.5. The MN insertion in the various concentration of agarose gel 82
4.6. The effect of the mesh pore size on micro-particle penetration (a)
particles passed through a mesh of 178 μm pore size (b) particles
passed through a mesh of 310 μm pore size (operating pressure: 5 bar;
agarose gel concentration: 0.0265 g/ml)
85
4.7. The effect of the particle size and operating pressure on the penetration
depth (note: the 18 μm and 30 μm particles are the regular (spherical)
and irregular stainless steel micro-particle, respectively(agarose gel
concentration: 0.0265 g/ml)
87
4.8. The micro-particle penetration in the skin mimicked concentration of
agarose gel based on the application of AdminPatch MN 1500 (a)
Spherical micro-particle of 18 μm average diameter, and (b) irregular
micro-particles of 30 μm average diameter (operating pressure: 4.5 bar,
mesh pore size: 178 μm; agarose gel concentration: 0.0265 g/ml)
88
4.9. The effect of the MN length on the penetration depth (particle type:
spherical stainless steel micro-particle; agarose gel concentration:
0.0265 g/ml)
89
4.10. The effect of the agarose gel concentration on the penetration depth
(operating pressure: 4.5 bar; mesh pore size: 178 μm; particle type:
spherical stainless steel micro-particle)
90
4.11. The penetration route of micro-particles for the microneedle assisted
micro-particle delivery
91
5.1. The trajectory of particle impact on a planar wall 105
5.2. Structure of the deceleration stage (Adminpatch 1500) (a). The overall
view of the deceleration stage (b). The zooming view to show the skin
layers
111
5.3. Effect of the operating pressure on the ground slide velocity
(modelling results)
112
5.4. Comparison of modelling (this work) and experimental results
(obtained from section 3.4.1.1) of the ground slide velocity against the
operating pressure
113
5.5. The trajectories of the micro-particles in the deceleration stage for the 117

xiv
MN assisted micro-particle delivery: (a).The overall view of the
micro-particle trajectories (b).The particle penetration at the area
without needle hole (c). The particle penetration at the hole tip area
inside skin (d). -particle penetrates into the side surface of the needle
hole inside skin (stainless steel micro-particle of 30 diameter; pressure:
5 bar)
5.6. The travel distance of micro-particle in the skin against the velocity. 117
5.7. The distribution of the micro-particles in different layers of skin 118
5.8. The effect of the operating pressure on the penetration depth of the
micro-particle in the skin (stainless steel micro-particles: 18 and 30μm
average diameters; MN: Adminpacth MN 1500; solid line: primary y
axis; dashed line: secondary y axis)
120
5.9. The penetration depth of stainless steel micro-particle in side skin
against the particle diameter (operating pressure: 5 bar; MN:
Adminpacth MN 1500; solid line: primary y axis; dashed line:
secondary y axis)
120
5.10. A comparison between model and experimental results at various
operating pressures (stainless steel micro-particles: 18 and 30
diameters; MN: Adminpatch MN 1500; solid line: primary y axis;
dashed line: secondary y axis)
121
5.11. The effect of the microneedle length on the penetration depth of the
stainless steel micro-particle (30 μm)
123
6.1. A SEM image of irregular tungsten powder (Sauter mean diameter:
0.49 μm)
130
6.2. Micro-CT images of a stainless steel micro-particle pellet made of 40
mg/ml PVP concentration (a) reconstructed three dimension view of
the pellet (b) top internal view across the pellet at the position of 1.08
mm on the z axis (c) side internal view across the pellet at the position
of 1.08 mm on the y axis. The images show homogeneity of the
packing of the micro-particles
132
6.3. SEM image of the top surface of the pellet 133
6.4. The effect of operating pressure on the passage percentage of the pellet
separation
135
6.5. The effect of the operating pressure on the penetration depth of 136

xv
different type of particles (Mesh: 178 μm of pore size: Dash line:
Particle penetration without using MN; Solid line: Particle Penetration
with MN)
6.6. The penetration of tungsten micro-particles in the skin mimicking
agarose gel based on the assistance of MNs (a) Adminpatch MN 1500
(b) In-house fabricated MN 750
138
6.7. The maximum penetration depth of tungsten micro-particles in the skin
mimicking based on the assistance of MNs
139
6.8. The trajectories of the tungsten micro-particles in the deceleration
stage: (a). The overall view of the micro-particle trajectories (b).The
particle penetration at the area without needle hole (c).The view of the
micro-particle penetrate through the needle hole (pressure: 5 bar)
141
6.9. The effect of the operating pressure on the penetration of tungsten
particle
142
6.10. The effect of the tungsten particle size on the penetration depth
(operating pressure: 5 bar)
143
6.11. A comparison of penetration depth between model and experimental
results (particle type: tungsten micro-particle of 3 μm diameter)
143
6.12. The effect of the microneedle length on the maximum penetration
depth of the tungsten particle (operating pressure: 5 bar; particle type:
tungsten micro-particle of 3 μm diameter)
144
6.13. The effect of each resistive force on the maximum penetration depth of
micro-particles (stainless steel particle: 18 μm diameter; tungsten
particle: 3 μm diameter; hole length: 1149 μm)
146
6.14. The effect of the friction coefficient between particle and dermis layer
on the maximum penetration depth of micro-particles (operating
pressure: 5 bar; hole length: 1149 μm)
147
7.1. HEK-293 cells culture in agarose-medium gel (Yang et al., 2009) 155

xvi
List of Tables
Table Title Page
2.1. Illustration of the particle material and size for the relevant
gene gun systems
18
2.2. Illustration of the materials and size of micro-particles used
in gene gun systems
20
3.1. The used equipments and important parameter values for
the experiment
42
3.2. The size of the Adminpatch 1500 50
3.3. Important properties of the meshes 51
3.4. The key variable effect on the mass of the ground slide 52
3.5. The penetration depth of the micro-particles 64
4.1 The characterizations of the MN array used in this study 76
5.1. The meaning of each variable in Figure 5.1 105
5.2. Skin properties used in the model 107
5.3. Relevant constants used in the developed model 108
xvii
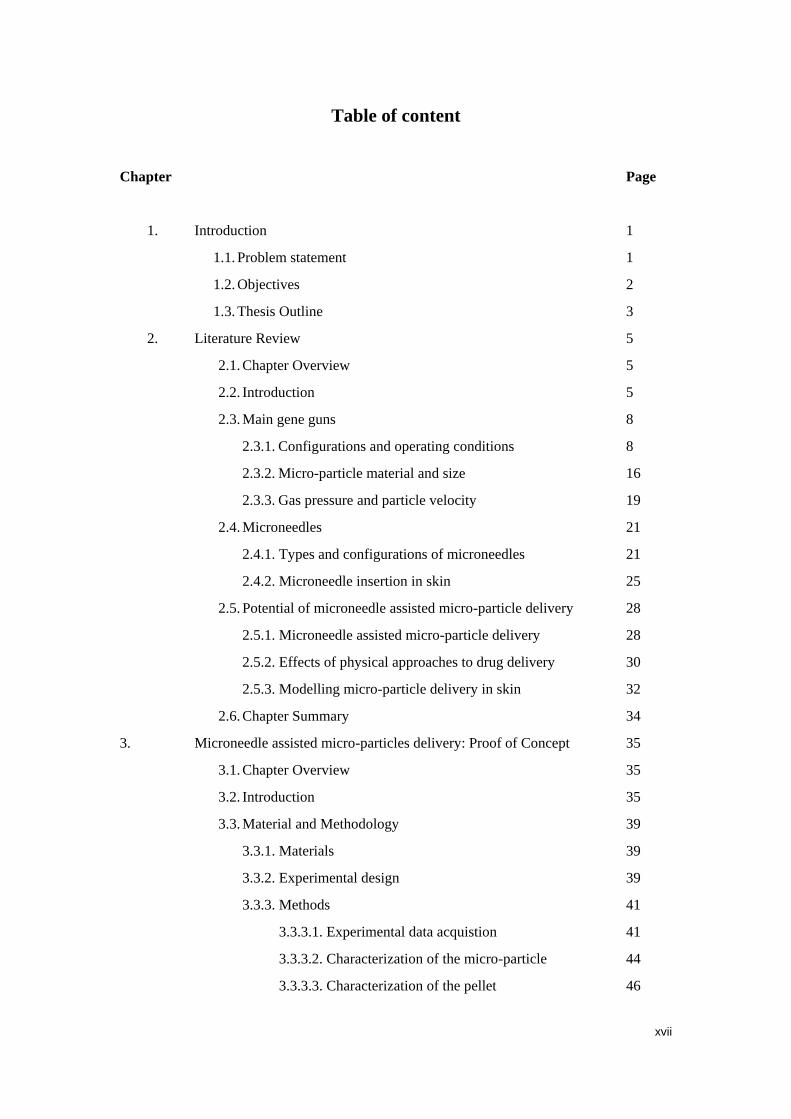
Table of content
Chapter
Page
1. Introduction 1
1.1. Problem statement
1.2. Objectives
1.3. Thesis Outline
1
2
3
2. Literature Review 5
2.1. Chapter Overview
2.2. Introduction
2.3. Main gene guns
2.3.1. Configurations and operating conditions
2.3.2. Micro-particle material and size
2.3.3. Gas pressure and particle velocity
2.4. Microneedles
2.4.1. Types and configurations of microneedles
2.4.2. Microneedle insertion in skin
2.5. Potential of microneedle assisted micro-particle delivery
2.5.1. Microneedle assisted micro-particle delivery
2.5.2. Effects of physical approaches to drug delivery
2.5.3. Modelling micro-particle delivery in skin
2.6. Chapter Summary
5
5
8
8
16
19
21
21
25
28
28
30
32
34
3. Microneedle assisted micro-particles delivery: Proof of Concept 35
3.1. Chapter Overview
3.2. Introduction
3.3. Material and Methodology
3.3.1. Materials
3.3.2. Experimental design
3.3.3. Methods
3.3.3.1. Experimental data acquistion
3.3.3.2. Characterization of the micro-particle
3.3.3.3. Characterization of the pellet
35
35
39
39
39
41
41
44
46

xviii
3.3.3.4. Characterization of the microneedle
3.3.3.5. Characterization of the meshes
3.4. Results and Discussions
3.4.1. Particle accleration stage
3.4.1.1. The velocity measurement of the ground slide
3.4.2. Particle separation stage
3.4.2.1. Effect of the operation pressure
3.4.2.2. Effect of PVP concentration
3.4.2.3. Effecy of the mesh pore size
3.4.2.4. The analysis of the separated particle size
3.4.3. Deceleration stage
3.4.3.1. The micro-particle penetration in agarose gel
3.5. Chapter Summary
49
50
51
51
51
54
54
55
57
58
63
63
65
4. Microneedle assisted micro-particle delivery: Experiments using skin
mimicking agarose gel
67
4.1. Chapter Overview
4.2. Introduction
4.3. Material and Methodology
4.3.1. Material
4.3.2. Experimental design
4.3.3. Experimental methods
4.3.3.1. Data acquistion
4.3.3.2. Characterization of the irregular stainless steel
micro-particles
4.3.3.3. Characterization of the microneedles
4.4. Results and Discussions
4.4.1. Preparation of skin mimicking agarose gel
4.4.1.1. Dynamic viscoelastic properties of porcine skin
4.4.1.2. Porcine skin mimicking agarose gel
4.4.2. Microneedle insertion
4.4.3. Measurements of the micro-particle penetration depth
4.4.3.1. Effect of the mesh pore size
4.4.3.2. Effect of the operating pressure and particle
size
67
67
70
70
71
71
71
74
75
77
77
78
79
81
83
83
85

xix
4.4.3.3. Effect of the microneedle length on particle
penetration depth
4.4.3.4. Effect of the agarose gel concentration on the
particle penetration depth
4.4.3.5. Further discussions
4.5. Chapter Summary
88
89
90
93
5. Microneedle assisted micro-particle delivery: Mathematical model
formulation and experimental verification
95
5.1. Chapter Overview
5.2. Introduction
5.3. Material and Methodology
5.3.1 Governing equations for micro-particle delivery in
various stage
5.3.1.1. Acceletration stage
5.3.1.2. Separation stage
5.3.1.3. Deceletration stage
5.3.2 Selection of modelling parameters
5.3.3 Model behaviour of microneedle assisted micro-particle
delivery
5.4. Results and Discussions
5.4.1. Acceleration stage
5.4.2. Deceleration stage
5.4.2.1. The trajectory of the micro-particles
5.4.2.2. Comparison with experimental results
5.5. Chapter Summary
95
95
98
98
98
99
100
107
109
111
111
114
114
118
124
6. Microneedle assisted micro-particle delivery: Experiments and
modelling on the effects of particle characteristics
126
6.1. Chapter Overview
6.2. Introduction
6.3. Material and experimental methods
6.3.1. Characterization of tungsten micro-particles
6.3.2. A further invertigation of the characterization of the
pellet
6.3.3. Modelling strategy and parameters
126
126
130
130
131
133

xx
6.4. Results and Discussions
6.4.1. Analysis of passage percentage
6.4.2. Experimental analysis of the penetration depth of
micro-particles
6.4.2.1. Effect of the operating pressure
6.4.2.2. Effect of the microneedle length
6.4.3. Modelling the penetration of micro-particles in skin
6.4.3.1. Modelling for the delivery of tungsten
micro-particles
6.4.3.2. The effect of the operating pressure and particle
size on the penetration depth
6.4.3.3. The effect of the microneedle length
6.4.3.4. Dependence of particle penetration depth to
particle size and density in relation to the
resistive forces in the dermis layer of the human
skin
6.4.3.5. Further Discussions
6.5. Chapter Summary
134
134
135
135
137
139
139
141
144
145
147
149
7. Conclusions and Further works
7.1. Conclusions
7.2. Further works
151
151
154
8. References 158
Appendix
Appendix A: The drag coefficient equations (Morsi et al, 1972)
Appendix B: The mathematical model of the microneedle assisted
micro-particle delivery
I
I
II

1
1. Introduction
1.1 Problem Statement
Particle gene transfer has been used for transferring genes into plant cells for many years, but
this technique has been modified so that it is suitable for use in mammalian cells too. It
requires a gene gun system which can accelerate deoxyribonucleic acid (DNA) coated
micro-particles to breach the skin and further deliver into biological cells to achieve gene
transfer. It indicates that the gene gun system is an advanced technology for the transdermal
gene delivery. However, the skin provides a great resistance on the process of the particle
delivery especially the top layer of stratum corneum, and the viable epidermis is the
applicable layer for gene therapy which means the micro-particles require penetrating into the
epidermis layer of the skin or further (Ziegler, 2008). This makes gene gun system an area of
very broad research where the research community attempts to seek out a variety of ways to
deliver DNA coated micro-particle to a deeper depth through the skin barrier.
In recent years various methods have been attempted to increases the penetration depth of the
micro-particle, which can vary the particle size, density and velocity. However, the maximum
penetration of the micro-particle only can breach the stratum corneum and end inside the
epidermis layer of the tissue for the existed gene gun systems. Therefore, the epidermis layer
is normally considered to be the target tissue for gene delivery due to its accessibility (Trainer
et. al. 1997). However, a high pressure is required for those gene gun systems, which might
damage the tissue after the impaction of the pressurized gas on the skin. In order to satisfy
both reduced tissue damage and increased penetration depth of the micro-particle in the target,
an innovative concept of combining microneedles with a particle delivery system, namely
microneedle assisted micro-particle delivery system, is proposed in this work. The operating
principle of micro-particle delivery is that a pellet of micro-particles is loaded on the ground
slide which is accelerated by the pressurized gas to a sufficient velocity. The pellet will be
released after the ground slide reaches the end of the barrel, separated to a narrow size
distribution of small micro-particles by a mesh, and then penetrated into the target.
Microneedle assisted micro-particle delivery is a novel field of gene gun system which
requires using solid microneedles to make some holes on the skin, and a number of
micro-particles may penetrate further through the holes. In addition, the system is used a
ground slide to prevent the pressurized gas to avoid the impaction on the skin to achieve the
purpose of less tissue damage. In order to exhibit the advantage of the microneedle assisted

2
micro-particle delivery, a quantitative analysis between the key variables of this system and
the particle penetration depth inside the target is required. Such is the major purpose of
microneedle assisted micro-particle delivery research.
1.2 Objectives
The overall aim of this research is to explore a low cost way for effective micro-particle
delivery into human body. Gold particle was widely used as micro carriers in biolistic
bombardment because of their high density, low toxicity and chemically inert. In our research,
the use of stainless steel and tungsten as a replacement for gold will be investigated due to the
lower cost, and the penetration depth of stainless steel and tungsten particles will be analysed
to verify the improvement of microneedle assisted micro-particle delivery if compared with
any other gene gun systems. As introduced, the major method being explored is via a new
injection system which is based on microneedles to overcome the tissue to achieve the
effectively particle delivery process to target. This involves gaining an understanding of the
micro-particle delivery process and microneedle insertion mechanics. The thesis
progressively present a theoretical model that has been developed in this research and reports
a microneedle assisted micro-particle delivery system which is based on this model.
The specific objectives of the research are as follows:
Design an experimental rig based on the purposed design of the microneedle assisted
micro-particle delivery.
Mimick the porcine skin by investigating a special concentration of agarose gel which
has close dynamic viscoelastic properties to porcine skin
Investigate the passage percentage of the pellet in relation to the operating pressure,
mesh pore size and PVP concentration, and further to find out the suitable mesh pore size
and PVP concentration for the microneedle assisted micro-particle delivery system based
on the analysis of the separated particle
Apply the skin mimicked concentration of agarose gel in the experiment to carry out
numerical analysis to identify the effects of various parameters on the particle
penetration depth. The parameters considered here are the size of the microneedle,
operating pressure, PVP concentration, mesh pore size and micro-particle density.
Compare the stainless steel particle penetration depth by using microneedle assisted
micro-particle delivery with particle penetration depths based on normal gene gun to

3
ensure the improvement of this system.
Develop a theoretical model to relate the microneedle assisted micro-particle delivery to
particle transfer process. Compare the theoretical results with the experimental results to
verify the applicability of the model.
Compare the penetration depth of tungsten micro-particles with stainless steel to
determine the density and size effects on the penetration depth based on the experimental
and theoretical studies.
1.3 Thesis Outline
There are a total of seven (7) chapters which make up this thesis including a final chapter on
the conclusion and recommendations from this thesis. Chapter 1 presents an introduction
which focus on the brief background, aims of the research and relevance of this research
work.
Chapter 2 gives a background on this research include gene gun systems, recommended
particle material and size, gas and particle, a description of the microneedle assisted
micro-particle delivery system, microneedle design, microneedle insertion in the skin, the
effect of the physical approaches on drug delivery, modelling micro-particle transport in skin
to understand the basic knowledge of gene gun system for micro-particle delivery and the
operation principle for the experimental rig.
Chapter 3 presents the method and materials of the experimental rig based on the purposed
design of the microneedle assisted micro-particle delivery. In this chapter, the applied
chemicals, and equipments are introduced. In addition, the detail experimental methods for
the detection of ground slide velocity and passage percentage of the pellet after separation are
explained. Based on the experimental rig, carry out numerical analysis to identify the effects
of various variables on the ground slide acceleration, passage percentage. The variables
considered on ground slide acceleration are materials and the size of the barrel. However, the
passage percentage analysis is the major purpose. These are analysed in relation to the
operating pressure, PVP concentration and mesh pore size. In addition, the pellet separation
condition is analysed based on the analysis of the separated particle size. Finally, the
micro-particle penetration in a 2 g/ml concentration of agarose gel is briefly discussed to
investigate the improvement of the microneedle assisted micro-particle delivery.

4
Chapter 4 presents the improved design of the experimental rig which is specific for the
analysis of the particle penetration. The upgraded experimental method and the methods of
the penetration depth measurement and skin mimicking are explained. The results of the
dynamic vsicoelastic property of the porcine skin and the agarose gel mimicking porcine skin
are discussed. The particle penetration in the skin mimicked concentration is major objective
which analysed in relation to the operating pressure, particle size, microneedle length mesh
gel concentration to further demonstrate the improvement compare with the existed gene gun
systems.
Chapter 5 shows the simulation study of the microneedle assisted micro-particle delivery. The
detailed parameters considered in the experimental rig are introduced; thereby a theoretical
model is developed based on these parameters. A comparison of the hollow and solid
microneedles assisted micro-particle delivery systems is discussed briefly to state the reason
to choose solid microneedles for the system using this model. Besides, a comparison of the
penetration depth of stainless steel particle between the model and experimental results is
detailed discussed to further to show the achievement of the enhanced penetration depth of
micro-particles and the reliability of the model for the solid microneedle assisted
micro-particle delivery system.
In Chapter 6 the tungsten micro-particle is applied to compare with the stainless steel
micro-particles. In the experiment, the effects of the operating pressure and microneedle
length on the penetration depth of the tungsten micro-particles are discussed. Besides, a
comparison of the penetration depth between stainless steel and tungsten particles has been
done. In the model, the penetration depth is analysed in relation to operating pressure, particle
size and microneedle length. The model results are compared with experimental result to
prove the advantage of microneedle assisted micro-particle delivery system and further to
demonstrate the applicability of the model. In addition, the passage percentage of the tungsten
pellet is illustrated and compared with the stainless steel pellet.
Conclusions and recommendations are presented in Chapter 7.

5
2. Literature review
2.1 Chapter Overview
Gene guns have been used to deliver deoxyribonucleic acid (DNA) loaded micro-particle and
breach the muscle tissue to target cells of interest to achieve gene transfection. This chapter
aims to discuss the potential of microneedle (MN) assisted micro-particle delivery from gene
guns, with a view to reducing tissue damage. Using a range of sources, the main gene guns
for micro-particle delivery are reviewed along with the primary features of their technology,
e.g., their design configurations, the material selection of the micro-particle, the driving gas
type and pressure. Depending on the gene gun system, the achieved penetration depths in the
skin are discussed as a function of the gas pressure, the type of the gene gun system, and
particle size, velocity and density. The concept of MN-assisted micro-particles delivery which
consists of three stages (namely, acceleration, separation and deceleration stage) is discussed.
In this method, solid MNs are inserted into the skin to penetrate the epidermis/dermis layer
and create holes for particle injection. Several designs of MN array are discussed and the
insertion mechanism is explored, as it determines the feasibility of the MN based system for
particle transfer. The review suggests that one of the problems of gene guns is that they need
high operating pressures, which may result in direct or indirect tissue/cells damage. MNs
seem to be a promising method which if combined with the gene guns may reduce the
operating pressures for these devices and reduce tissue/cell damages. There is sufficient
potential for MN-assisted particle develivery systems.
2.2 Introduction
A Gene gun, involving “particle bombardment” or “biolistic delivery” is a particle
accelerator, which can deliver deoxyribonucleic acid (DNA) loaded micro-particles at
sufficiently high velocitiesto breach the surface of target tissue and to penetrate to a depth to
achieve gene transfection in the cells. A Gene gun is considered to be a unique concept which
was first used to deliver genetic materials into plant cells (Klein et al., 1987; Klein et al.,
1992; Sanford et al., 1993; Svarovsky, 2008; Huang et al., 2011; O’Brien and Lummis, 2011;
Manjila et al., 2013). The technique has been used to transfer DNA-coated micro-particles to
achieve gene transfection into many types of cells and organs (e.g., Meacham et al., 2013;
Bennett et al., 1999), for example, mammals (Cao et al., 2013; Ettinger et al. 2012; Da’dara
et al., 2002; Kuriyama et al., 2000; Sakai et al., 2000; Williams et al., 1991), plants

6
(Kuriakose et al., 2012; Zuraida et al., 2010; Klein et al., 1992), artificially cultured cells
(O’Brien and Lummis, 2011; O’Brien and Lummis, 2006), fungi (Gu et al., 2011; Armaleo et
al., 1990) and bacteria (Nagata et al., 2010; Smith et al., 1992). A number of commercial
gene guns have been manufactured and used for in vivo gene transfection in plants, living
animals, cultured cells, e.g., the PowderJect system developed originally by the University of
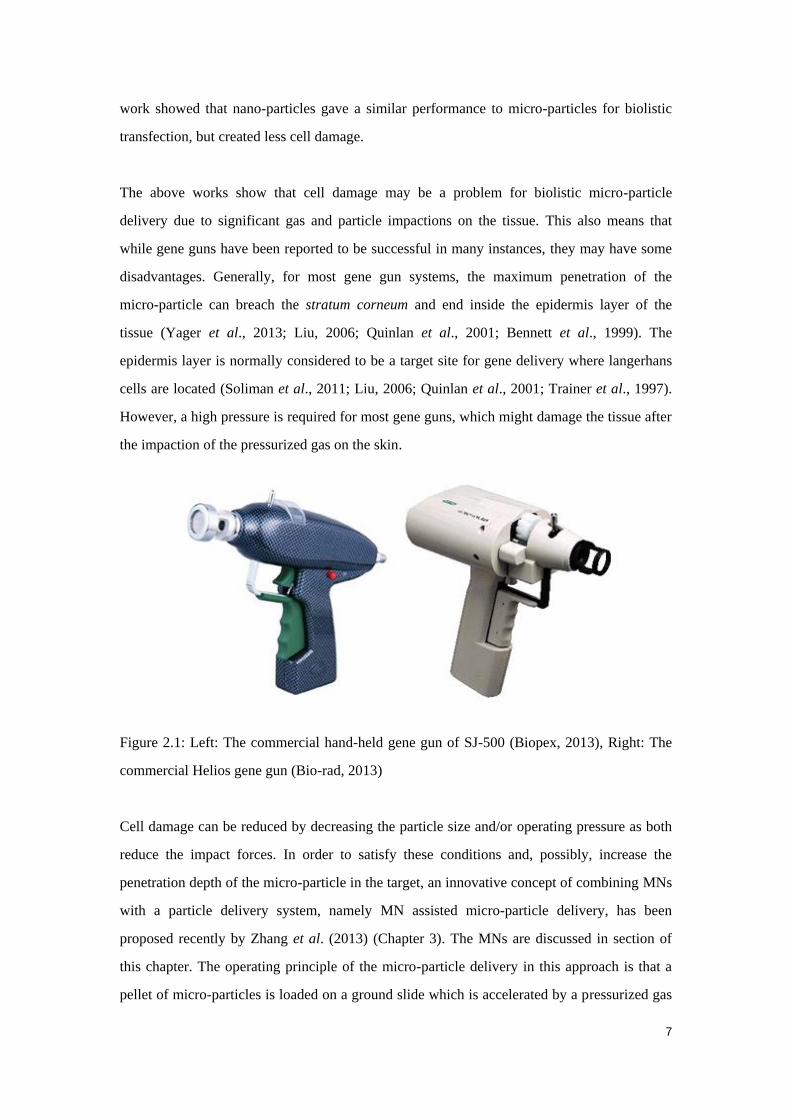
Oxford (UK) (Bellhouse et al., 2006), the Helios gene gun by Bio-rad, Hercules, CA (USA)
(Belyantseva, 2009), and the SJ-500 portable gene gun by Biotech instrument, New Jersey
(USA). The Helios and portable gene guns are shown in Figure 2.1. In a research context,
Da’dara et al. (2002) have used a Helios gene gun to delivery Sm23-pcDNA (an integral
membrane protein) to mice to evaluate the immunogenicity of the protective efficacy of the
DNA vaccination. Ahlen et al. (2013) have used a Helios gene gun to explore a method for
monitoring hepatitis B and C viruses (HBV/HCV) specific to immune responses in mouse.
Loading the micro-particles with DNA (for example onto gold particles) is an important step
in using this technology as discussed by Zhao et al. (2012), O’Brien and Lummis (2011,
2006), Rao (2010); Satish (2009) Svarovsky et al. (2008) and Thomas et al. (2001).
However, a detailed discussion on these issues is outside the scope of these research.
Such guns have been proposed for gene delivery in the treatment of some of the major
diseases such as cancer (Nguyen-Hoai et al., 2012; Aravindaram et al., 2009; Han et al., 2002;
Chen et al., 2002). These researchers have fired gene loaded micro-particles into mammalians
or cultured cells instead of humans to study gene expression and cell damage. For example,
Yoshida et al. (1997) used a gene gun to deliver DNA coated Au micro-particle into the liver
of living rat at 250 psi (17.2 bar) pressure, which resulted in a good gene expression but
caused a number of cell deaths. The work also showed that cell damage was not obtained
below 150 psi of pressure. Sato et al. (2000) have used various types of gene guns to transfer
genes into live rodent brain tissue, which confirmed gene expression but with mechanical
damage to cells. Uchida et al. (2009) have fired plasmid DNA into cultured mammalian cells
(e.g., human embryonic kidney (HEK293) cell, human breast adenocarcinoma (MCF7) cell)
using a gene gun, which showed that transfection is achieved in the cells but the cell damage
occurs at operating pressures greater than 200 psi (~13.8 bar). O’Brien and Lummis (2011)
have cultured HEK293 cells as a target for the biolistic transfection using a gene gun. Their
7
work showed that nano-particles gave a similar performance to micro-particles for biolistic
transfection, but created less cell damage.
The above works show that cell damage may be a problem for biolistic micro-particle
delivery due to significant gas and particle impactions on the tissue. This also means that
while gene guns have been reported to be successful in many instances, they may have some
disadvantages. Generally, for most gene gun systems, the maximum penetration of the
micro-particle can breach the stratum corneum and end inside the epidermis layer of the
tissue (Yager et al., 2013; Liu, 2006; Quinlan et al., 2001; Bennett et al., 1999). The
epidermis layer is normally considered to be a target site for gene delivery where langerhans
cells are located (Soliman et al., 2011; Liu, 2006; Quinlan et al., 2001; Trainer et al., 1997).
However, a high pressure is required for most gene guns, which might damage the tissue after
the impaction of the pressurized gas on the skin.
Figure 2.1: Left: The commercial hand-held gene gun of SJ-500 (Biopex, 2013), Right: The
commercial Helios gene gun (Bio-rad, 2013)
Cell damage can be reduced by decreasing the particle size and/or operating pressure as both
reduce the impact forces. In order to satisfy these conditions and, possibly, increase the
penetration depth of the micro-particle in the target, an innovative concept of combining MNs
with a particle delivery system, namely MN assisted micro-particle delivery, has been
proposed recently by Zhang et al. (2013) (Chapter 3). The MNs are discussed in section of
this chapter. The operating principle of the micro-particle delivery in this approach is that a
pellet of micro-particles is loaded on a ground slide which is accelerated by a pressurized gas

8
to a sufficient velocity. The pellet is released after the ground slide reaches the end of a barrel
in the system, and separates into micro-particles of a narrow size distribution by impaction on
an open mesh; these separated micro-particles then penetrate into the desired target. The
resistance of the target/skin to the penetration of the micro-particles is reduced using MN to
create a number of holes through which the micro-particles can enter without the need for
very high gas pressures.
MN assisted micro-particle delivery seems to be a promising approach for dry particulate
delivery but the potential of this method needs to be discussed thoroughly as it is still at an
early stage of development. To this end, the main types of gene gun systems for
micro-particle delivery and their operating principles are reviewed. The micro-particle
material and size for the previous gene guns are discussed, and the used gas and achieved
particle velocity are studied as well to enrich the background of the previous gene gun
systems.
In this chapter, MN arrays are discussed to understand how various geometries affect
penetration of the target material and formation of holes which remain after the needles are
removed. The discussion provides relevant background knowledge and a sound foundation
for further improvement of gene gun systems with the help ofMN assisted micro-particle
delivery. to achieve similar levels of the penetration depth, but with less cell damage. To
further understand the advantage of MN assisted micro-particle delivery, a comparison with
other physical cell targeting approaches is discussed. Finally, some simplified models of the
micro-particle delivery in the skin are described, which will be useful in predicting the
penetration depths achieved by MN assisted gene gun delivery.
2.3 Main gene guns
2.3.1 Configurations and operating conditions
Based on the principles of the operation process and driving forces, we define that the gene
guns can be divided into three types, namely: powder gene gun, high-voltage electric gene
gun and gas gene gun.
A powder gene gun is the original device which uses an ignition gunpowder as a driving force
to promote the movement of bullets of macro-projectiles, and thus accelerating the

9
micro-particles which are loaded on to the bullet (Huang et al., 2011; O’Brien and Lummis,
2007; Zhou, 1995; Klein et al., 1987; Sanford et al., 1987). An electric gene gun uses a high
voltage (HV) to vaporize water droplets; the expanding gas is used to achieve the acceleration
of micro-particle (Christou et al., 1990). A gas gene gun releases a high pressure to accelerate
the micro-particles (or micro-particles loaded ground slide) to a sufficient velocity to breach
the barrier of the target (Zhang et al., 2013; Soliman et al., 2011; Liu, 2007; Kendall et al.,
2002; Zhou, 2000).
Figure 2.2: A schematic sketch of the powder gun (redrawn from Klein et al. (1987))
Powder gene guns were originally developed to deliver genetic material coated
micro-particles into plant cells (Klein et al., 1987; Klein et al., 1992; Svarovsky, 2008;
O’Brien and Lummis, 2011; Manjila et al., 2013). As shown in Figure 2.2, an explosion of
gun powder accelerates DNA-coated micro-particles attached onto the front surface of the
macro projectile. Klein et al. used tungsten micro-particles of 4 μm average diameter, which
could be accelerated to 400 m/s. However, the explosion of the gun powder is noisy and may
cause cell/tissue damage.
Zhou (1995) improved the design of Klein et al. (1987) and patented a powder gun
(Figure 2.3) which is composed of a gun body, a gun barrel, a ground slide, a baffle plate and
a baffle plate fixed pipe.An ignition of gunpowder caused the bullet to accelerate and hit a
ground slide, which then impacts on a baffle plate. Thus, the micro-particles gain an initial
velocity to leave the ground slide, pass through the central hole of the baffle plate and
penetrate into the tissue. The advantage of this powder gene gun is that the use of ground
slide can reduce the explosion damage to tissue. The base is designed as a shock absorber to
reduce the recoil force, using a spring attached to the firing pin.
Blank Charge Micro-particles
Firing pin
Gun barrel
Nylon macro-projectile Vents Target

10
Christou et al. (1990) have used a type of electronic gene gun to deliver DNA-coated gold
micro-particles into soybean seeds;a schematic sketch of the high-voltage electric gene gun is
shown in Figure 2.4. Yang et al. (1990) have applied an electronic gene gun to transfer genes
into tissue and liver of amouse using 1-3 μm diameter golden particles. The disadvantage of
their gun is that a high voltage up to 18 kV is required to deliver a micro-particle
penetration depth of 125 μm. Recently, Ikemoto et al. (2012) used a type of high-voltage
electric gene gun, namely, an electrospray device to accelerate liquid droplets in a high
voltage (12 kV) to collide with DNA coated micro-particles and deliver them into living cells.
Figure 2.3: The layout of powder gene gun (redrawn from Zhou (1995))
Gas gene guns can be classified into two different delivery methods. The first uses a high
pressure gas to push the micro-particle coated ground slide to achieve the goal of particle
acceleration. The disadvantage is that a very high operating pressure is required to achieve the
desired micro-particle impact velocity. However, the advantage is that the ground slide
prevents the released gas from impacting on tissue. The second method mainly uses a high
pressure gas (e.g., N2, He) to directly push the DNA-coated micro-particles to a sufficient
velocity to breach the stratum corneum, penetrate into the epidermis layer of the skin or
deeper tissues. The disadvantage is that very high gas pressure may damage the tissue. The
advantage is that the micro-particle can reach a desired velocity under lower operation
pressure as the micro-particles have very small mass.
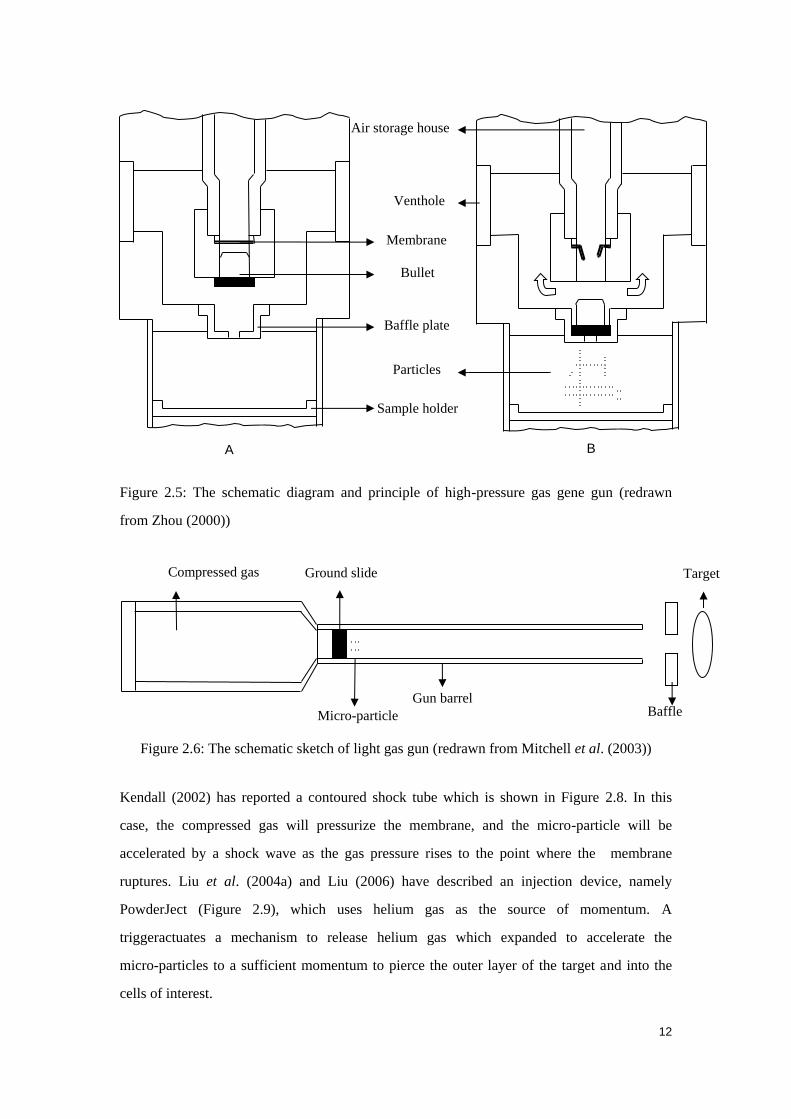
Using the principles of the first delivery method, Zhou (2000) has invented a kind of
high-pressure gene gun which consists of a casing, the compressed gas inlet pipe, emitting
cavity and bombarding cavity. The schematic diagram of this gun is shown in Figure 2.5
which shows both the states of the gun before and after operation. The emitting cavity
consists of an air storage house, membrane, bullet, baffle plate and sample holder. The
Baffle Plate Powder Screw Firing pin Gun barrel
Spring Bullet Gas outlet hole Ground slide Fixity

11
membrane will be ruptured when the air storage house reaches a certain pressure. High
pressure gas is able to accelerate the bullet to the baffle plate. Since the bullet is blocked by
the baffle plate, the coated particles will leave the surface of the bullet, go through the centre
hole of the baffle plate and launch into the sample, thus completing the gene injection. In
addition, the gas will be released from the vent hole. It has been claimed that this instrument
has good stability, high efficiency, does not produce impurities, and particles can also attain a
higher initial speed. However, it is generally applied for plant tissues.
Figure 2.4: The schematic sketch of the high-voltage electric gene gun (redrawn from
Christou et al. (1990))
Mitchell et al. (2003) have conducted many experimental and numerical studies on the light
gas gun (LGG) as shown schematically in Figure 2.6. The LGG uses a high pressure helium
gas to drive the micro-particle coated ground slide to a certain velocity. In this case, the
polystyrene particles of 99 μm diameter have been usedand the impact velocities of the
particles have been shown to reach 170, 250 and 330 m/s under 20, 40 and 60 bar operation
pressures.
Williams et al. (1991) have studies a helium-driven gene gun which is somewhat similar to
the design of Zhou’s (2000) as shown in Figure 2.7. In this case, a membrane in the system
breaks after the gas pressure reaches a certain value. The micro-projectiles are accelerated by
the helium gas and separated well by a stopping screen. In addition, the large particle is
blocked by a screen to avoid tissue damage. In this case, golden particles of 1 - 3 μm and 2 -
5 μm diameters have been fired and penetration depths of 150 μm and 200 μm have been
obtained in a mouse liver under 1300 psi operating pressure.
HV (-)
Water drop let Micro-particles
HV (+)
Stopping screen
Target
12
Figure 2.5: The schematic diagram and principle of high-pressure gas gene gun (redrawn
from Zhou (2000))
Figure 2.6: The schematic sketch of light gas gun (redrawn from Mitchell et al. (2003))
Kendall (2002) has reported a contoured shock tube which is shown in Figure 2.8. In this
case, the compressed gas will pressurize the membrane, and the micro-particle will be
accelerated by a shock wave as the gas pressure rises to the point where the membrane
ruptures. Liu et al. (2004a) and Liu (2006) have described an injection device, namely
PowderJect (Figure 2.9), which uses helium gas as the source of momentum. A
triggeractuates a mechanism to release helium gas which expanded to accelerate the
micro-particles to a sufficient momentum to pierce the outer layer of the target and into the
cells of interest.
Sample holder
Baffle plate
Membrane
Air storage house
Venthole
Bullet
Particles
A B
Baffle Micro-particle
Compressed gas
Gun barrel
Ground slide Target

13
Figure 2.7: The schematic sketch of helium-driven gene gun (redrawn from Williams et al.
(1991))
Figure 2.8: The schematic diagram of contoured shock tube (redrawn from Kendall (2002))
Zhang et al. (2007) have introduced the principle of the Helios gene gun which contains
acceleration, separation and deceleration stages. The process of micro-particle delivery is
shown in Figure 2.10. This gene gun uses helium gas to accelerate DNA-coated
micro-carriers which are separated by a stopping screen. The separated micro-particles exit
from the gene gun at high speed, penetrate the tissue to the targeting area, enter into the cell
and hit the nucleus membrane.
Screen
Stopping screen
Membrane
Helium gas inlet
Venthole
Microprojectiles
Tissue Tissue
Diaphragm
Shock tube Receiver Driver Nozzle

14
Figure 2.9: A schematic diagram of the PowderJect (redrawn from Liu (2006))
Figure 2.10: Gene transfer stages of the biolistic gene gun (redrawn from Zhang et al. (2007));
La, Ls and Ld are the distance of acceleration, separation and deceleration stages.
In addition, Zhou (2007) has created a special liquid gene sprayer (Figure 2.11) which is
different from the above three gene gun types. It has been used to deliver liquid-form
medication into the human bodyand consists of an interconnected casing and magazine. The
magazine comprises of a hollow cylinder and sliding piston rod set; emission holes are
arranged at the front end of the cylinder and the front end of the casing is fixed to rear end
opening. An energy-storage driving mechanism consists of a spring and impeller and set in
the internal cavity of the casing. The impeller moves backward to press the spring to store he
energy, and pushes forward by a driving force from the released spring. This device uses a
small volume energy storage device to inject the required amount of biological gene, and does
not need any separate air supply equipment; it is easy to handle and carry. It uses the liquid as
the DNA particle’s carrier and hence golden particles are not required in this device. The
DNA particles will be suspended in the liquid. Before using this device, the head of the
5ml BOC cylinder
Filter
Actuating pin
Parallel section
Trigger Sonic Throat Powder cassette
Tip housing
Targeting
area
Ld Ls
Deceleration
stage
Acceleration stage
La
Separation
stage
Source
Helium
Skin Body DNA-coated
micro-carriers
Conical section 10mm vented spacer

15
hollow cylinder is inserted into the DNA particle coated liquid, and the sliding piston rod is
pulled outto extract the liquid and load the gun. Then the spring is compressed very tightly,
storing energy, which is released to (see Figure 2.11a). accelerate the impeller and sliding
piston rod; then the DNA particle coated with liquid are pushed out from the emission hole
and penetrate into the tissue of plant or human to the target cells of interest. The state of the
liquid gene gun after injection is shown in Figure 2.11b.
Figure 2.11: The liquid gene sprayer: A: The liquid gene gun at energy storage state, B: The
state of liquid gene gun after injection (redrawn from Zhou (2007))
Recently, Menezes et al. (2012) have designed an advanced laser plasma jet (see Figure 2.12)
to deliver DNA-coated micro-particle. The operating principle is that a laser beam is fired
and ablates a thin aluminum foil, using lenses for focusing. The laser ablation is confined by
the BK7 glass overlay to improve performance. Thus, it causes the foil to evaporate into an
ionized vapor and the sudden blow-off causes a shock wave to breach the foil to accelerate
DNA coated micro-particles. The device provides micro-particles impact velocities of up to
1100 m/s, which is faster than other gen guns (e.g. CST, LLG). However, this technique is
costly due to the use of laser ablation.
Spring Stem Impeller Trigger Magazine Baffle Sliding piston
rod
a
b

16
Figure 2.12: The schematic of the laser plasma jet (redrawn from Menezes et al. (2012))
2.3.2 Micro-particle material and size
The materials and size of the micro-particles which are used in gene guns have significant
importance on the operation of the system, e.g. by determining the routes and extent of
particle penetration into tissue. In general, the routes of the micro-particle penetration in the
tissue are normally divided into two types, which are the extracellular and intercellular routes
(Bryan et al., 2013; Soliman, 2011; Mitchell et al., 2003). As presented in Figure 2.13(a-b),
the penetration routes of the micro-particles in tissue depend on the particle size. The
extracellular route is followed for large particle delivery, e.g., for epidermal powder
immunization (Soliman, 2011; Hardy et al., 2005). An illustration of the range of particle
material and sizes for the relevant gene gun systems is listed in Table 2.1. It shows that the
extracellular route is normally followed for the less dense materials (e.g., stainless steel,
polystyrene and glass) with diameters ranging from 15 to 99 μm. Hardy et al. (2005) have
reported that particle diameters ranging from 25 to 100 μm are expected to follow the
extracellular route, as their momentum is insufficient to breach the target barrier of target, due
to the combination of relatively low density and small size. It has been recommended that
stainless steel or polymer micro-particles should be used for extracellular routes, due to their
biocompatibility and low cost (Soliman, 2011; Sung et al., 2011; Singh and Dahotre, 2007;
Binyamin et al., 2006; Disegi et al., 2000).
Laser beam
Diverging lens
Collimating lens
Focusing lens
BK7 glass overlay
Thin Al foil
Laser ablation
Drug coated
micro-particles Soft target

17
In contrast, the intercellular route (e.g. for DNA immunization), uses smaller size, but much
more dense gold or tungsten micro-particles (Soliman, 2011; Mitchell et al., 2003). In order to
deliver DNA into cells effectively, dense materials are preferred which are prepared into
micro-particles of diameters ranging from 0.6 to 6 μm (Soliman, 2011; Rao, 2010; Hardy et
al., 2005) which are also smaller than the cell diameters. High-speed micro-particles breach
the skin and may penetrate through the individual cell membranes. It is well known that the
most recommended material of these micro-particles for gene gun system is gold due to its
high density, low toxicity and lack of chemical reactivity (Valenstein, 2012; Rosi et al., 2006;
Macklin, 2000). However, tungsten micro-particles have also been used as micro carriers in
gene gun systems, due to their lower cost. Tungsten particles have some disadvantages for
genetic transformation, such as non-biocompatibility and toxicity (Bastian et al., 2009;
Yoshimisu et al., 2009; Russell et al., 1992). Recently, Hou et al. (2013) have used titanium
dioxide (TiO2) for biolistic micro-particle delivery due to their biocompatibility (Singh and
Dahotre, 2007) and low density (2 g/cm3) which may reduce the cell damage after particle
impaction. The particle impaction may cause cell damage (O’Brien and Lummis, 2011; Sato
et al., 2000), which is a significant area for gene gun research.
Figure 2.13: Schematic diagram of the extracellular and intercellular failure mechanisms (a):
extracellular failure mechanism for large particles (b): intercellular failure mechanism for
small particles (redrawn from Mitchell et al. (2003)).
(a)
Impact Direction
(b)

18
Table 2.1: Illustration of the particle material and size for the relevant gene gun systems
Type of gene gun Material of
particles
Particle
density(g/cm3)
Average diameter of
micro-particles(μm)
Reference
Powder particle gun
(PPG)
Tungsten 19.25 4 Klein et al. (1987)
Helium-driven apparatus
(HDA)
Tungsten 19.25 3.9 Williams et al. (1991)
Gold 19.3 1-3, 3-5
Conical nozzle (CN) Polymeric 0.9 4.7, 15.5 and 26.1 Quinlan et al. (2001)
Converging-diverging
nozzle (CDN)
Polystyrene 1.05 4.7 Kendall et al. (2004a)
Pneumatic gun (PG)
Gold 19.3 0.47 ± 0.15, 1.1 ± 0.1 Rinberg et al. (2005)
Silicon 2.33 2 – 18 Zilony et al. (2013)
Gold 19.3 1.6
Light gas gun (LGG) Stainless steel 8.0 25 Mitchell et al. (2003)
Contoured shock tube
(CST)/LGG
Polystyrene 1.05 15.5, 25.2, 48
and 99
CST
Gold 19.3 3.03 Truong et al. (2006)
Polystyrene 1.05 15 and 48
Glass 2.5 46
Gold 19.3 2.7 and 3.5
Polystyrene 39 ± 1 Liu et al. (2006)
Helios gene gun
Gold
19.3 0.6, 1.0 and 1.6 Uchida et al. (2009)
1
O’Brien and Lummis
(2011); Kuriakose et
al. (2012);
Cao et al. (2013)
Biolistic PDS/1000
Helium system
Gold 19.3 0.6, 1.0 and 1.6 Zuraida et al. (2010)
BioWare low pressure
gene gun
Gold 19.3 1 Yen and Lai (2013)

19
2.3.3 Gas pressure and particle velocity
Up to now, gene gun systems have been widely used to deliver DNA loaded micro-particles
into cells for research of DNA transfection, e.g., CST (Rasel et al., 2013; Liu, 2008; Truong et
al., 2006; Liu et al., 2006; Kendall, 2002) and Helios gene gun (O’Brien and Lummis, 2011;
Belyantseva, 2009). Helium and compressed air gases are often used as driving forces to
accelerate micro-particles for gene gun system. Especially, helium gas is recommended for
most gene gun systems due to its non-toxic, low density, lack of chemical inactivity and high
compressibility factor (Marrion et al., 2005), which allow the particles to reach higher
velocities (Tekeuchi et al., 1992). Compressed air is often used as a substitute for helium due
to its lower cost.
The gas pressure is a major factor which should be considered for gas gene gun systems. It
directly affects the velocity of the micro-particles, e.g., Liu et al. (2008) demonstrated that 1.8
μm diameter gold micro-particles can reach a velocity of 580, 650, 685 and 710 at 3, 4, 5 and
6 MPa, respectively. In addition, the velocity is also related to the micro-particle size and
density: particle velocity is increased from an increase in operating pressure and a decrease
in particle size.
Along with the development of gene gun technology, the achievable particle velocity and
penetration depth in the target vary between gene gun systems. For example, Quinlan et al.
(2001) have applied a conical nozzle to accelerate polymeric micro-particles of 4.7, 15.5 and
26.1 μm diameters, to reach velocities of 350, 460 and 465 m/s at 60 bar pressure,
respectively. A contoured nozzle has been tested by Quinlan et al. (2001) who employed 60
bar to accelerate polymeric micro-particles of 4.7 μm diameter to a velocities of about 1000
m/s, but 26.1 μm diameter of particles only reached 740 to 810 m/s. The velocity of
polymeric micro-particles of 15.5 μm diameter only reaches 330 m/s at 60 bar for the LGG
system (Mitchell et al., 2003). Kis et al. (2012) have concluded that the particle velocity
reached about 700 m/s for CST (Liu et al., 2006) and range from 200 to 800 m/s for
converging-diverging nozzles (Liu et al., 2004b; Kendall, 2002; Quinlan et al., 2001).
Recently, Menezes et al. (2012) have operated an advanced laser plasma jet to drive gold
micro-particles of 1 μm diameter to achieve an average velocity of 1100 m/s within a distance
of only 10 mm. The particular achievements (e.g., particle velocity, operating pressure and
penetration depth) for various gene gun systems are listed in Table 2.2.

20
Table 2.2: Illustration of the materials and size of micro-particles used in gene gun systems
Type of
gene gun
Material and
average
diameter of
micro-particles
Operating
pressure
(bar)
Velocity
at impact
(m/s)
Target and
maximum
Penetration
depth in target
Reference
PPG Tungsten, 4 μm N/A 430 Onion, 40 μm Klein et al.
(1987)
HAD Gold, 1 - 3 μm 90 N/A Mouse liver
tissue,
approximately
130 μm
Williams et al.
(1991)
CN Polymers, 4.7,
15.5 and 26.1 μm
60 350, 460
and 465
N/A Quinlan et al.
(2001)
LGG Stainless steel, 25
μm
20 170 Canine buccal
mucosa, 124 μm
Mitchell et al.
(2003)
CST Gold, 3.03 μm 60 550 Canine buccal
mucosa, 60 μm
CST Gold, 1 ± 0.2 μm 40 580 Human skin, 66
μm
Kendall (2002)
CST Polystyrene, 39
μm
60 570 ±
14.7
N/A Liu et al. (2006)
Helios
Gene
Gun
Gold, 40 nm
and 1 μm
5 N/A Mouse ear
tissue, 50 ± 11
μm and 31 ± 6
μm
O’Brien and
Lummis (2011)
Laser
plasma
jet
Gold, 1 μm
Tungsten, 1 μm
N/A 1100 N/A Menezes et al.
(2012)
From the above studies, it can be concluded that the operating pressures for gene gun systems
generally vary from 20 to 60 bars. Xia et al. (2011) have suggested that the pressure should be
held below about 13 bar to minimise damage from the impaction of pressurized gas on soft
tissue. Uchida et al. (2009) achieved gene transfection is cells but noted damage if the

21
operating pressure is over 13 bar. These reports demonstrate that cell death is unavoidable for
many of the current generation of gene gun systems. Mitchell et al. (2003) show that golden
micro-particles of 3.03 μm diameter employed at 60 bar pressure in the CST only reach a
maximum penetration depth of 60 μm in the canine buccal mucosa. Normally, the viable
epidermis layer of skin is the target area for gene gun systems. Mitchell et al.’s (2003) results
show that micro-particles require a still higher velocity to penetrate through the stratum
corneum, which means higher operating pressures are necessary. However, Mitchell et al.
(2003) also show stainless steel micro-particles of 25 μm diameter can achieve 124 μm
penetration depths in the canine buccal mucosa at 20 bar pressure (see Table 2.2). But
O’Brien and Lummis (2011) show that cultured cells are damaged by gold micro-particle of 1
μm diameter, when operating at 3.4 bar pressure using a Helios gene gun. They indicate that
stainless steel micro-particles of 25 μm diameter impact on the tissue at a velocity of 170 m/s
will damage the target tissue and cells. Thus, a new concept of applying MN to micro-particle
delivery, which may reduce the cell damage, is discussed in section 2.5.1.
2.4 Microneedles
2.4.1 Types and configurations of microneedles
Henry and Prausnitz’s group (1998) are widely regarded as the first to have developed a
method of transdermal drug delivery using MNs, which has gradually developed for various
applications of drug delivery. MN arrays are minimally invasive device that bypass the outer
layer of skin, namely the stratum corneum, to achieve enhanced transdermal drug delivery
(Olatunji et al., 2013; Donnelly et al., 2012; Prausnitz and Langer, 2008). MN are normally
separated into two categories, namely, solid and hollow (Koelmans et al., 2013; Han et al.,
2008; Qi et al., 2007). Each of these can be made of different materials and used for various
functionalities, depending on their designs. The most common materials used for fabricating
MN are metal, silicon, and polymer (Kim et al., 2012; Memon et al., 2011; Zhao et al., 2006).
The primary metals used for MNs are stainless steel (Kim et al., 2012; Quan et al., 2010; Bal
et al., 2008; Martanto et al., 2004) and titanium (Kim et al., 2010; Fermandez et al., 2009;
Parker et al., 2007). Metal MNs have the advantages of low cost, tougher hardness, ease of
penetration into the tissue and they are not easily broken in the tissue. Silicon and silica
materials have better biocompatibility than metallic materials, but they are expensive (Chen et
al., 2013, 2008). Furthermore, they break up more easily and fragments may be left inside the
tissue after MN removal (Memon et al., 2011; Zhao et al., 2006). However, silicon is the first

22
material used to fabricate MNs for pre-treatment of skin prior to patch application, e.g.,
Henry’s group (1998) have used solid conical silicon MNs (Figure 2.14a) with a height of
0.15 mm, inner diameter of 80 μm and tip diameter of 1 μm to increase skin permeability and
to provide an effective delivery of drugs to diffuse through the skin. Mikszta et al. (2002)
used a silicon MN array (see Figure 2.14b) for gene delivery in skin.
Figure 2.14: (a). Solid conical microneedle arrays (Henry et al., 1998) (b) Silicon microneedle
array used for gene delivery in skin (Mikszta et al., 2002).
Polymeric materials are a cheap option which can exhibit biocompatibility and
biodegradability, but the hardness is generally lower (Nayak and Das, 2013; Oh et al., 2008;
Han et al., 2007; Park et al., 2005). Various types of polymer have been used for fabricating
MNs, such as poly-glycolic acid (PGA) (Park et al., 2006, 2005) and polycarbonate (PC)
(Han et al., 2007). Park et al. (2005) have fabricated a PGA solid MN array with needle
length of 1500 μm, base diameter of 200 μm tapering to tip diameter of 20 μm. An example
of solid polymer MN array is shown in Figure 2.15a. Recently, Donnelly et al. (2011) have
used poly (vinyl) alcohol (PVA) to fabricate solid MN arrays with a needle height of 600 μm,
base width of 300 μm, and MN interspacing of 300 μm. As can be seen from Figure 2.15b,
MNs have been fabricated into uniform conical-shaped needles.

23
(a)
(b)
Figure 2.15: (a): Solid MN array made with the help of PGA (Park et al., 2005) (b): Solid MN
array made with the help of PVA (Donnelly et al., 2011)
Hollow MN arrays are normally used for fluid infusion of liquid drug and nanoparticles into
the skin (Han et al., 2008). However, they are not widely used due to their costly and complex
fabrication methods (Zhu et al., 2012). An example of the hollow MN array designed by
Stoeber et al. (2000) is shown in Figure 2.16a. It is a hollow conical MN array with a height
of 200 μm and a channel diameter of 40 μm. McAllister et al. (2000) have improved Henry et
al.’s (1998) design, by inserting a hole in the centre of each MN to fabricate a hollow silicon
MN array.

24
Figure 2.16: (a) Hollow conical MN arrays on the right (Stoeber et al., 2000) (b) hollow
silicon MN array with sloping side walls (Gardenier et al., 2003)
Figure 2.17: Hollow metal MNs (Davis et al., 2004)
Subsequently, Gardenier et al. (2003) have designed a hollow silicon MN array with sloping
side wall, which is shown in Figure 2.16b. The length of the needles varies between 150 and
350 μm, with a base diameter of 250 μm (measured at the widest section) and a maximum
hole width of 70 μm. The centre of the hole is positioned 40 μm from the tip of the needle.
Davis et al. (2004) have used a hollow metal MN array (Figure 2.17) with a tip diameter of 75
μm, base diameter of 300 μm, wall thicknesses of 5 μm and heightof 500 μm to measure the

25
required force for the insertion of MNs into the tissue. They reported that a force ranging
between approximately 0.1 – 3 N is sufficient to penetrate a single MN into the tissue.
Until now, MN have been developed as a minimally invasive means to deliver genes via the
transdermal route (Tuan-Mahmood et al., 2013; Coulman et al., 2009; Henry et al., 1998),
e.g., Chabrai et al. (2004) have successfully used micro-fabricated silicon MNs for non-viral
gene delivery without causing pain. Recently, we have proposed the use MNs with a gene gun
system to assist the micro-particle delivery in the skin. In particular, solid MNs can create
holes in the tissue to provide an environment for the penetration of high-speed
micro-particles. Furthermore, hollow MNs may allow a number of micro-particles to go
through the hollow needles and penetrate to a greater depth into deeper tissue layers
(epidermis) to be gene transfected. However, the waste of micro-particles is likely to be
higher as the hollow MNs have blockage problems.
There have been a number of studies which report on the effects of MNs types and
configuration on drug delivery (Han and Das, 2013; Olatunji et al., 2012; Al-Qallaf and Das,
2009a,b, 2008; Al-Qallaf et al., 2009a,b, 2007; Davidson et al., 2008). The current
contribution will focus on the most relevant MNs types and configurations; reviews of other
aspects related to the application of MN may be found elsewhere (Olatunji and Das, 2011,
2010).
2.4.2 Microneedle insertion in skin
MNs can overcome a target surface to provide an advantageous condition for micro-particle
delivery (Zhang et al., 2013). Human skin consists of two distinct macroscopic layers called
the dermis and the epidermis (Marks et al., 2006; Parker, 1991; Phipps, 1988) which are
shown in Figure 2.18. The epidermis layer consists of the stratum corneum (SC), the stratum
basale (or stratum germinativum), stratum sinosum, and the stratum granulosum (Tortora et
al., 2011; Marks et al., 2006; Holbrook, 1994). The top layer of the skin is the SC which is the
major barrier for entry of foreign substances. The thickness of the epidermis varies with
gender, age, ethnicity and the regions of the body, but has an average thickness of between 20
and 100 μm (Matteucci et al., 2009; Schaefer and Redelmeier, 1997). The thickness of the
stratum corneum also varies with the above conditions, but the average thickness is between
10 and 20 μm (Mohammed et al., 2012; Holbrook et al., 1974).

26
Figure 2.18: The structure of the skin (MacNeil, 2007)
Normally, MN insertion is painless as it simply penetrates the skin surface without reaching
the dermis layer, which contains the nerves ending. (Gupta et al., 2011a; Silpi et al., 2011;
Donnelly et al., 2010a; Henry et al., 1998). Pain sensation also depends on the MN designs
which is generally small enough to avoid significant damage to the nerves in the tissue (Shah
et al., 2011; Palastanga et al., 2006; Kaushik et al., 2001). Also, as pain sensation is related to
the MN design, an increased size increases the likelihood of stimulating the nerves (Sachdeva
and Banga, 2011; Shah et al., 2011; Gupta et al., 2011a,b; Gill et al., 2008). There are a
number of clinical studies which show that MNs insertions into skin are painless or the pain is
undetectable. For example, Mikolajewska et al. (2010) have used polymeric MN cones with
needle height of 644 μm, base diameter of 217 μm tapering to tip diameter of 41 μm to
progress the skin pre-treatment and report that the MNs insertion is a painless process.
Previously, Haq et al. (2009) have used several MN arrays with lengths of 180 and 280 μm
and compared the pain responses of a number of subjects for these MNs with the the pain
responses from hypodermic needles. They indicated that hypodermic needle is painful after
insertion into skin, and the pain response of MN insertion is less and decreases with a
decrease in needle height.
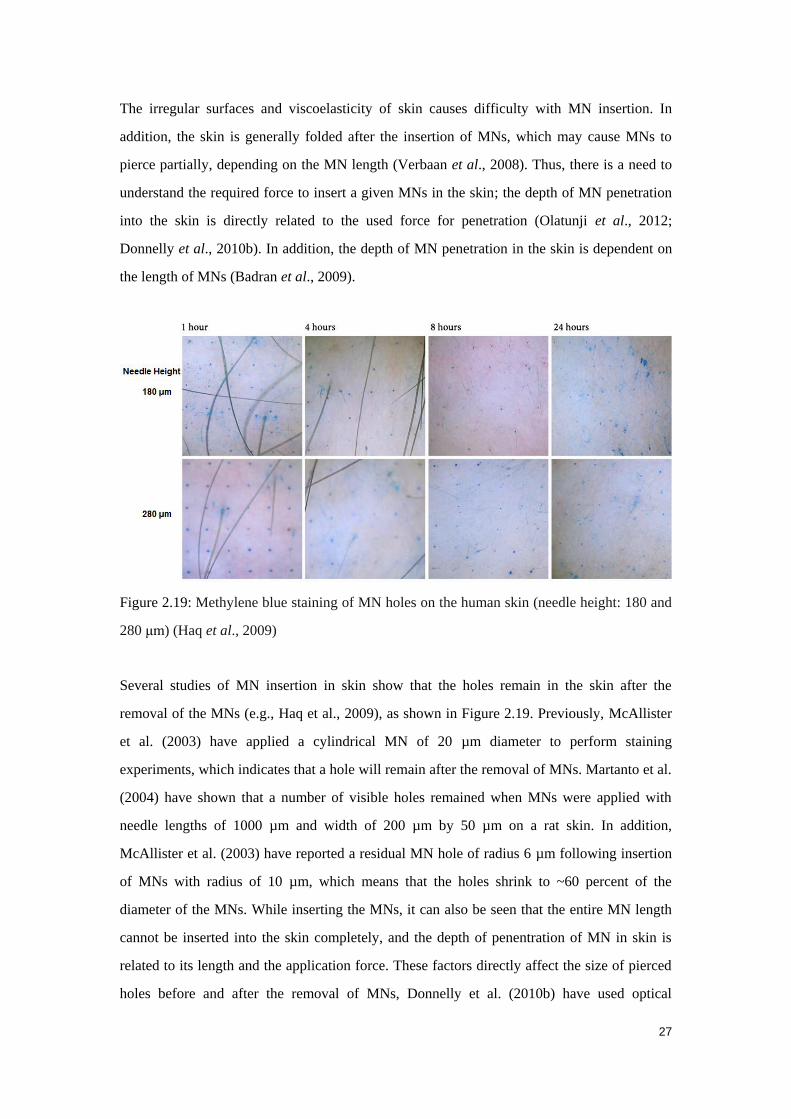
27
The irregular surfaces and viscoelasticity of skin causes difficulty with MN insertion. In
addition, the skin is generally folded after the insertion of MNs, which may cause MNs to
pierce partially, depending on the MN length (Verbaan et al., 2008). Thus, there is a need to
understand the required force to insert a given MNs in the skin; the depth of MN penetration
into the skin is directly related to the used force for penetration (Olatunji et al., 2012;
Donnelly et al., 2010b). In addition, the depth of MN penetration in the skin is dependent on
the length of MNs (Badran et al., 2009).
Figure 2.19: Methylene blue staining of MN holes on the human skin (needle height: 180 and
280 μm) (Haq et al., 2009)
Several studies of MN insertion in skin show that the holes remain in the skin after the
removal of the MNs (e.g., Haq et al., 2009), as shown in Figure 2.19. Previously, McAllister
et al. (2003) have applied a cylindrical MN of 20 µm diameter to perform staining
experiments, which indicates that a hole will remain after the removal of MNs. Martanto et al.
(2004) have shown that a number of visible holes remained when MNs were applied with
needle lengths of 1000 µm and width of 200 µm by 50 µm on a rat skin. In addition,
McAllister et al. (2003) have reported a residual MN hole of radius 6 µm following insertion
of MNs with radius of 10 µm, which means that the holes shrink to ~60 percent of the
diameter of the MNs. While inserting the MNs, it can also be seen that the entire MN length
cannot be inserted into the skin completely, and the depth of penentration of MN in skin is
related to its length and the application force. These factors directly affect the size of pierced
holes before and after the removal of MNs, Donnelly et al. (2010b) have used optical
28
coherence tomography (OCT) to detect the effect of MN height and application force on the
depth of penentration inside the porcine skin. As shown in Figure 2.20a, the penetration depth
is increased significantly by an increase in MN height and application force. In addition, the
application force presents a positive effect on the penetration depth of the MN inside skin, as
shown in Figure 2.20b: the pore width is increased by an increase in needle height and
application force, when the base width is kept constant. However, there is a clear gap left
between the MN base plate and the skin surface. Donnelly et al. (2011) have further used
OCT to obtain 3D views of MN embedded in the human skin. They reported that a MN with
needle height of 600 µm and base diameter of 300 µm penetrated approximately 460 µm into
the human skin with a clear gap of 136 µm between the MN base plate and skin. They also
indicated that the width of the pierced holes in the skin was about 265 µm in diameter. These
reports demonstrate that MN assisted micro-particle delivery is expected to realize a greater
penetration depth of micro-particles in the skin.
2.5 Potential of microneedle assisted micro-particle delivery
2.5.1 Microneedle assisted micro-particle delivery
As mentioned earlier, cell and tissue damages are particular problems for the biolistic gene
transfection (O’Brien and Lummis, 2011; Uchida et al., 2009; Thomas et al., 2001; Sato et
al., 2000; Yoshida et al., 1997). Reduction in the operation pressure and in the particle size
can minimize the cell damage, but these also decrease the momentum of the micro-particles.
This minimizes the penetration depth of the micro-particles in the tissue and may cause a
failure of the DNA transfection.
Based on a consideration of reducing the operating pressure, a new concept of combining
MNs with gene gun for micro-particle delivery has been presented by Zhang et al. (2013)
(See chapter 3). As presented in Figure 2.21, the concept may be developed from the light and
Helios gas gun systems. The operating process consists of particle acceleration, separation
and deceleration stages. For the acceleration stage, a pellet of micro-particles is loaded onto
the ground slide which is accelerated by pressurized gas. The pellet is then separated into
individual micro-particles by impaction onto a mesh stopping screen in the separation stage.
The separated micro-particles spray forward through a conical nozzle with a uniform velocity
and distribution to breach the skin tissue to target the cells of interest.

29
Figure 2.20: (a): A 2D OCT image for the investigation of the effect of the MN height on the
penetration depth inside the porcine skin (A: 280 µm; B: 350µm; C: 600µm; D: 900µm)
(Donnelly et al., 2010b) (b): A 2D OCT image to analyse the effect of the application force
on the penetration depth of MN inside the porcine skin (A: 4.4 N (newton); B: 7.0 N; C: 11 N;
D: 16.4 N) (Donnelly et al., 2010b) (c): A 3D OCT image showing MN insertion in the skin
(needle height: 600 µm; base width: 300 µm; spacing: 300 µm) (Donnelly et al., 2011)
As shown by Zhang et al (2013), by using an array of MNs it is possible to overcome the
effect of the skin on the particle penetration. One of the many advantages of this new concept
is that the pressurized gas will be released from the vent holes (see Figure 2.21), which is
likely to avoid the damage of the target from the impaction of pressurized gas on tissue. In
addition, the use of the ground slide slows down the velocities of micro-particles to reduce the
impact force on tissue to minimize the cell damage. As required, the velocity is controllable
by changing the driving pressure of compressed gas, if higher micro-particle velocities are
necessary. Even if the micro-particles cannot reach the desired penetration depth due to
insufficient momentum, the use of MNs allows a number of micro-particles to penetrate
further to achieve the purpose of gene transfection in the desired depth of the tissue. However,
the disadvantage of this concept is that a very high impact velocity of micro-particles is not
easy to achieve, because the ground slide has significant mass.
The solid MN used by Zhang et al. (2013) aimed to create holes on the skin to allow a
number of micro-particles penetrate through the pierced holes and increase the penetration
depth. Zhang et al. (2013) also indicate that some agglomerated micro-particle may be present
in the target; the size of the agglomerates is controllable and decreases with a decrease in
mesh pore size and binder concentration. Results have shown that a number of micro-particles

30
are able to penetrate through the pierced holes (created by the MNs) and reached a greater
penetration depth inside the target, demonstrating the feasibility of MN assisted
micro-particle delivery. In principle, the maximum penetration depth of micro-particles is
affected by the particle size, density and operating pressure which determine the momentum
of the micro-particles and hence the impact of the particles on the target. An increased length
of the pierced holes enhances the particle penetration depth due to a decreased resistance
when micro-particle travel in the hole. The length of the pierced holes depends on the height
of MN. However, the effect of the above parameters on the penetration depth of
micro-particles will be analysed in our following works.
Figure 2.21: A possible structure of a MNs assisted micro-particle delivery system
2.5.2 Effects of physical approaches to drug delivery
With the development of the transdermal drug delivery, several physical technologies have
been developed, particularly in needle free gene gun system. In order to understand the
advantages of MN assisted micro-particle delivery for the drug/gene delivery, a comparison
with other physical cell targeting approaches is presented in this section. Figure 2.22
illustrates a schematic of four physical cell targeting approaches which include diffusional
delivery (Figure 2.22a), solid MN assisted micro-particle delivery (Figure 2.22b), hollow MN
assisted micro-particle delivery (Figure 2.22c) and needle free biolistic micro-particle
injection (Figure 2.22d). The route of the diffusion delivery (Figure 2.22a) is that the
molecules permeates through the aperture of the SC and diffuses into the target (Glenn et al.,
2003). It is a method which operates without damage to the skin.
In recent years, needle-free biolistic micro-particle delivery (Figure 2.22d) provides a great
improvement for transdermal gene delivery. The principle of this technique is that DNA is
Valve
Gas cylinder
Pellet Ground slide
Vent hole Stopping screen
Stopping wall Microneedle Target

31
loaded on micro-particles which are accelerated to a sufficient velocity to pierce the skin and
travel to a certain depth to achieve the DNA transfection in the viable epidermis layer. It can
be seen from Figure 2.22d that micro-particles penetrate to greater than diffusion delivery. In
addition, biolistic micro-particle delivery is painless as the micro-particles settle within
epidermis without reaching the nerves (Quinlan et al., 2001). There are some disadvantages
for biolistic micro-particle delivery such as micro-particle penetration causes a significant cell
death in the skin due to the impaction (O’Brien and Lummis, 2011; Raju et al., 2006; Sato et
al., 2000). In addition, pressurized gas may damage the skin surface if the pressure is over
than 200 psi (Belyantseva, 2009; Uchida et al., 2009; Yoshida et al., 1997).
Figure 2.22: A schematic cross-section of the skin: (a) the normally diffusion route (b)route of
solid MN assisted micro-particle delivery (c) route of hollow MN assisted micro-particle
delivery (d) route of normal micro-particle penetration using a gene gun system (Kendall,
2006)
As mentioned earlier, the method of MN assisted micro-particle delivery requires use of a
MN to overcome the skin surface to deliver micro-particles to a greater depth. The projected
routes are presented in Figure 2.22b-c. In Figure 2.22b the penetration depths of
micro-particles are greater than for needle-free biolistic micro-particle delivery due to the
pierced holes providing a low resistance path skin for micro-particle penetration. Figure 2.22c
shows hollow MN assisted micro-particle delivery which should allow particles to penetrate
further in the skin via the hollow needles. However, the disadvantage of MN assisted
micro-particle delivery is that the process may be painful if the micro-particles are deliver
into dermis which have nerves ending in that layer.
(d)
(a)
(c)
Stratum
corneum
10-20μm
Dermis
1-2mm
(b)
Langerhans cell 10 μm
Micro-particles Microneedle
Viable
epidermis
50-100μm

32
Overall, it is obvious that needle-free biolistic micro-particle injection present more efficiency
than diffusion delivery. Ziegler (2008) has shown that acceptable DNA vaccination requires
the coated micro-particle to penetrate the skin surface with around 20-100 μm penetration
depth. It indicated that needle-free biolistic micro-particle injection achieves a more efficient
pharmaceutical effect than diffusion delivery. Further, MN assisted micro-particle delivery
may deliver micro-particles deeper than the needle-free gene gun system in the skin to allow
deeper tissue to be transfected. It has been demonstrated that MN assisted micro-particle
delivery may achieve a further enhanced DNA transfection in the target.
2.5.3 Modelling micro-particle delivery in skin
The process of micro-particle delivery is normally divided into two stages which are particle
acceleration stage and penetration stage. In the modeling, the acceleration stage is required to
consider the driving source (gas pressure) which accelerates the micro-particle to a sufficient
velocity to pierce the skin surface. The velocity is varies with the gene gun system design,
particle density and size. For the penetration stage, the effect of the skin is the major
resistence to prevent the micro-particle delivery. Micro-particle delivery requires breaching
the SC and piercing into the epidermis layer (Yager et al., 2013; Soliman et al., 2011; Liu,
2006; Quinlan et al., 2001; Bennett et al., 1999; Trainer et al., 1997). The impact velocity,
particle size and density, target density and yield stress are the major variables affecting the
penetration depth.
Normally, the micro-particle acceleration stage is gas and particle flow for gas gene gun
systems, e.g., CST, PowderJect and Helios Gene gun. The flow is defined as symmetric and
fully turbulent in the device for various studies (Liu, 2006; Soliman and Abdallah, 2011). A
model which has been widely adopted is force balance law which is based on the Newton’s
second law and Stokes’s law. For example, Liu (2006) has focused on simulating the velocity
distribution in the converging (conical) section of a venturi system which is developed from a
gene gun, namely, the PowderJect system (Powderject Research Ltd., Oxford, UK)
(Bellhouse et al., 1999, 2003, 2006). The particle velocity has been simulated based on a
balance between the inertia of micro-particles and other resistance forces acting on the
particles. Zhang et al. (2007) have used the MATrix LABoratory (MATLAB, The
MathWorks Inc., Natick , USA) (Shampine et al., 1997) to simulate three different stages of
the particle delivery in the gene gun, namely, acceleration, separation and deceleration stages.

33
In their work, the particle velocity is analysed on the basis of Newton’s second law in the
acceleration stage; an energy conservation law is applied to describe the separation of
micro-carriers into micro-particles in the separation stage, and Stocks’ law is applied to model
the penetration of micro-particles in the deceleration stage into a various target. Soliman et al.
(2011) have used a commercial turbo-machinery flow simulator, namely, FINETM/Turbo
(NUMECA International, Brussel, Belgium) to simulate the behavior of gas and particle flow
in a supersonic core jet in a gene gun. This work used Newton’s second law to mimic the
particle trajectories and determine the penetration depths of micro-particles in the skin. As
discussed below, a number of studies have shown that the penetration depth depends on the
momentum of micro-particles which again depend on the particle size, density and velocity.
For the penetration stage, various studies have separated the resistance force on the
micro-particle into a yield force (Fy), frictional resistive force (Ff) and resistive inertial force
of the target material (Fi) (Soliman et al., 2011b; Liu, 2007; Mitchell et al., 2003; Kendall et
al., 2001; Dehn, 1987). The force balance equation is shown below:
)FFF(dt
dvm yfi (2.1)
From this the stopping distance can be calculated as
)3l n ()3v
2
1l n (
3
r4d yy
2
it
t
pp (2.2)
Based on this force balance equation, the theoretical penetration depth (equation 2.2) is
obtained and adopted for the modelling. This model has been widely adopted in several
studies. For example, Soliman et al. (2011b) have modelled the delivery of golden particle of
diameters 1.8 and 5 μm using 3 MPa pressure and have shown that penetration depths of
95μm and 135μm can be achieved for particle of diameters 1.8 and 5 μm, respectively.
Kendall et al. (2001) have analysed the golden particle penetration by using equation (2.2) for
particle penetration in human and porcine skins. In addition, predictions from the theoretical
model have been shown to agree well with the experimental results by Kendall et al. (2001).
More recently, Soliman et al. (2011b) have also implemented equation (2.2) in a theoretical
model which is implemented using FINE/Turbo code to calculate the penetration depth of
gold micro-particle inside the skin.

34
2.6 Chapter Summary
The background of the gene gun system for micro-particle delivery is reviewed in this paper.
A number of gene gun systems have been listed and the operating principles along with their
advantages and disadvantages have been studied briefly. In addition, the recommended gas
type, particle material and size for these type engineering systems are discussed. The range of
particle velocities and applied operating pressures for several gene gun systems are described,
which indicated that cell/tissue damage is a major problem for biolistic micro-particle
delivery, due to the impaction of pressurized gas and high-speed micro-particles on the target
tissue. In addressing this point, a new concept is proposed of MN assisted micro-particle
delivery, which combines a gene gun system with MN to enhance the penetration depth of
micro-particles. This technique may reduce the cell damage from pressurized gas and reduce
the impact velocity of micro-particle. In order to further understand the MN assisted
micro-particle delivery, a number of MN designs have been discussed, paying attention to key
characteristics that affect biolistic delivery.
A number of researchers have studied the MN insertion in the skin which suggests that holes
remained on the skin after the removal of MNs. These indirectly show the feasibility of the
MN assisted micro-particle delivery to enhance the penetration depths of micro-particles
inside the target. Based on the above research works, the detailed penetration route of MN
assisted micro-particle delivery is also discussed and compared with other physical
approaches on drug delivery. Finally, various models of micro-particle delivery for different
gene gun systems are described to understand the theoretical principles of micro-particle
penetration and which may be used for modelling of MN assisted micro-particle delivery.

35
3. Microneedle assisted micro-particles delivery: Proof of concept
3.1 Chapter Overview
A set of well defined experiments has been carried out to explore if microneedles (MNs) can
enhance the penetration depths of micro-particles moving at high velocity such as those
expected in gene guns for delivery of gene loaded micro-particles into target tissues. These
experiments are based on applying solid MNs which are used to reduce the effect of
mechanical barrier function of the target so as to allow delivery of micro-particles at less
imposed pressure as compared to most typical gene guns. Further, a low cost material,
namely, biomedical grade stainless steel micro-particle with size ranging between 1 - 20 μm,
has been used in this study. The micro-particles are compressed and bound in the form of a
cylindrical pellet and mounted on a ground slide, which are then accelerated together by
compressed air through a barrel. When the ground slide reaches the end of the barrel, the
pellet is separated from the ground slide and is broken down into particle form by a mesh that
is placed at the end of the barrel. Subsequently, these particles penetrate into the target. This
chapter investigates the implications of velocity of the pellet along with various other
important factors that affect the particle delivery into the target. Our results suggest that the
particle passage increases with an increase in pressure, mesh pore size and decreases with
increase in PVP concentration. Most importantly, it is shown that MNs increase the
penetration depths of the particles.
3.2 Introduction
Micro-particle delivery systems (e.g., gene guns) have been used for transferring genes into
cells and tissues (e.g. plant tissues) for some time (Klein et al., 1987; Heiser, 1994;
Svarovsky, 2008; Huang et al., 2011; O’Brien and Lummis, 2011; Manjila et al., 2013).
Typically, the operation involves a micro-particle accelerator, which can deliver gene-loaded
micro-particles into a target (e.g. biological cells) to achieve the desired mass transfer effect
(e.g. gene transfection). The PowderJect delivery system is a case in point, which has been
applied to exploit the micro-particle gene transfer treatment (Dempster, 2000; Kendall, 2002).
In most cases, these delivery systems are based on the principle that biocompatible
micro-particles loaded with genes can be accelerated to a sufficient velocity so as to penetrate
the barrier function of the target tissue and thereby achieve gene delivery (Bellhouse, 1999;
Burkoth, 1999). However, cell and tissue damages are particular problems for these
micro-particle delivery systems which are discussed further later.

36
It is obvious from previous research on micro-particle based gene delivery that knowledge of
the velocity of the micro-particles and its effects on particle penetration is one of the major
research points in development of these systems. A number of researchers have studied the
particle velocity for various designs of gene guns. For example, Quinlan et al. (2001) have
used a conical nozzle employed at 60 bar to accelerate polymeric micro-particles of 4.7, 15.5
and 26.1 μm diameters to velocities of 350, 460 and 465 m/s, respectively. Kendall et al.
(2004a) have used a converging-diverging nozzle, which has been shown to accelerate
polystyrene particles of diameter 4.7 μm to a velocity of 800 m/s at the same pressure as used
by Quinlan et al. (2001). Such developments of the delivery systems can improve the velocity
of micro-particles to achieve a higher speed if compared with conical nozzles (Quinlan et al.,
2001). Mitchell et al. (2003) have also studied the velocities of polystyrene particles (average
size: 99 μm) for a light gas gun (LGG) proposed originally by Crozier (1957) and gold
particles (average size: 3.03 μm) for a contoured shock tube (CST). The particle velocity is
shown to achieve 170, 250 and 330 m/s at pressure of 20, 40 and 60 bar for the LGG,
respectively. The gold particles have been shown to achieve an average velocity of 550 m/s at
60 bar based on the CST. Liu et al. (2004c) have also used a CST to accelerate gold particles
of diameter 2.7 μm to a velocity of 626 m/s at 60 bar pressure. Subsequently, Liu et al. (2006)
used polystyrene particles of 39 ± 1 μm diameter to study the particle velocity for CST and
found improvements relative to the LGG, which is shown to achieve a velocity of 570 ± 14.7
m/s at 60 bar pressure (Liu et al., 2006). In recent years, Soliman et al. (2011) have shown
that a supersonic core jet can accelerate 1.8 and 5 μm diameters gold particles to velocities of
550 and 294 m/s at 30 bar pressure. O’Brien and Lummis (2011) have also used gold particles
of core diameters 40 nm and 1 μm to achieve maximum depths of 31 ± 6 and 50 ± 11 μm in
mouse ear tissue by using a Helios gene gun.
Although very high velocities of the micro-particles or/and gas may seem useful in delivering
the particles deep into the target tissue, they may actually damage the target from their
impacts. As such, it is logical that one controls both the velocity and, the mass of the
micro-particles and gas that impact the target. This is somewhat reflected in a study by
Belyantseva (2009) who has used a pressurized Helios gene gun to accelerate DNA-coated
gold particles (1 μm diameter) where the pressure is controlled at 14 bar. The author shows
that this pressure is adequate for the penetration of the particles without excessive tissue
damage. Xia et al. (2011) have suggested that the pressure should be limited to around 14 bar
to minimize damage for biolistic transfer to soft tissue. Uchida et al. (2009) have fired

37
plasmid DNA into cultured mammalian cells (e.g. human embryonic kidney cell (HEK293)
and human breast adenocarcinoma (MCF7) cell) using a Helios gene gun, which shows that
gene transfection is achieved in these cells but the cell damage occurs if the operating
pressure in the gene gun is more than 200 psi (13.78 bar). O’Brien and Lummis (2011) have
cultured HEK293 cells and used them as targets for biolistic transfection using a gene gun.
This work has shown that nanoparticles can be utilised as gene carriers similar to
micro-particles for biolistic transfection and lessen cell damage. These researches show that
cell damage can be reduced if particle size and operation pressure are reduced as they lower
the particle impact force on the cells/tissue such as those observed by Uchida et al. (2011). In
most studies, the viable epidermis layer of skin is considered as the target tissue for gene
loaded micro-particle delivery as the penetration depth is limited by a number of factors
(Quinlan et al., 2001; Trainer et al., 1997).
In the particles delivery process, the material of the particles is also of crucial importance. In
order to deliver gene loaded particles into cells effectively, high density materials are
generally preferred since they carry a larger momentum and are expected to penetrate more
into the target tissue as compared to particles of low density materials. The most common
material of the particles is gold due to its high density, low toxicity and lack of chemical
inactivity. However, gold is an expensive material. In principle, other materials such as
biomedical grade stainless steel and polystyrene may be a good replacement for gold while
reducing the cost due to the lower price of these materials in comparison to gold. However,
these materials have lower density compared to gold and, as such, the momentum for these
micro-particles would be less for the same particles size and velocity. This implies that other
factor is needed to break the resistance of the target tissue for the particles to enter easily
while also enhancing the penetration depths. Microneedles, which can break the resistance of
the target tissue almost painlessly (Nayak et al., 2013; Ashraf et al., 2011; Al-Qallaf and Das,
2009a; Prausnitz, 2004; Henry et al., 1998b), seem to be a promising option in this regards.
However, there is little or no study at the moment that demonstrates that microneedle can be
useful in the delivery of dry particulates particularly at lower pressures as compared to most
current gene guns which should be operated at very high pressure (Quinlan et al., 2001;
Mitchell et al., 2003; Liu et al., 2006). Previously, several studies have shown that the
effectiveness of the MN based drug delivery is limited by a wide varieties of variables, e.g.
MN height, spaces between the needles, patch size, insertion forces, tissue characteristics
such as viscoelastic properties, materials of MNs, etc, and as such, it is necessary to choose
38
the MNs for specific application as well as the target tissue (Olatunji et al., 2013; Olatunji et
al., 2012; Yan et al., 2010; Donnelly et al., 2010b; Al-Qallaf et al., 2009a; Teo et al., 2006).
In addressing these points, microneedles have been used to enhance the penetration depths of
low density micro-particles using an experimental set up that mimic particle accelerator (e.g.
gene guns) in its operation principle. As model particles, we use biomedical grade stainless
steel micro-particles. Further, a ground slide is used to prevent the impact of high pressure gas
on the micro-particle target as discussed in more detail in the next section. The use of the
ground slide gives lower particle velocities compared with the CST under the same operating
conditions. However, the purpose of the micro-particle gun is to accelerate the particles to a
sufficient velocity which can penetrate into a desired depth inside the target. For a
microneedle based injection system, this objective could be achieved by first applying solid
microneedles as they help in overcoming the tissue barrier (Stahl et al., 2012; Chu et al.,
2010; Coulman et al., 2006). In this study, solid microneedles are used to create well defined
holes in the target which remain open immediately after removing the microneedle. Hence, a
number of micro-particles should penetrate into the target via the holes. Therefore, the
application of the microneedle based particle delivery is a good improvement for particle
injectors.
In addition to the aims discussed above, this chapter aims to investigate the significance of
various important factors, e.g., the ground slide on the particle velocity for the microneedle
assisted micro-particle injection. The micro-particles are mixed with PVP, compressed and
bound as a cylindrical pellet for the purpose of this work. The pellet is mounted on a ground
slide, which is accelerated along a barrel. The high velocity pellet is separated by a mesh
which presents a partial blockage to the flow. The work in this chapter aims to determine the
passage percentage and separated particle size. The chapter also aims to study the effect of the
microneedle on the micro-particle penetration depth when they are fired into a homogeneous
agarose gel which is used a as a model target. Agarose gel has the advantages that it can be
produced with a controllable mechanical property and its transparency provides a good
quality to view the micro-particle penetration using optical digital microscope. In agarose gel,
the micro-particles follow two routes of delivery. The first route is that a number of
micro-particles directly penetrate into the agarose gel without going through the holes reated
by MNs. The second route is that the micro-particles are delivered through the pierced holes
created by the MNs to enhance the penetration depth inside the agarose gel. In reality, the

39
target skin for these micro-particles may be different structurally and heterogeneous, and
therefore the routes of the micro-particle delivery may be affected by its individual layers.
However, this is not a consideration in this study as we carry out the experiments in a
controlled manner using homogeneous agarose gels. The detailed information on the MN
assisted micro-particle delivery system is described in section 3.3.2.
3.3 Material and Methodology
3.3.1 Materials
Biocompatible stainless steel micro-particles of high sphericity equalling approximately to
0.92 were bought from LPW Technology Ltd (Daresbury, UK). Detailed characterizations of
these micro-particles are presented in section 3.3.3.2. Polyvinylpyrrolidone (PVP) purchased
from Sigma-Aldrich Company Ltd. (Gillingham, UK) was dissolved in ethanol (analytical
grade, 99%, obtained from Fisher Scientific Ltd., Loughborough, UK) and used to bind the
micro-particles to form a cohesive mixture which could be compressed into a pellet (see
section 3.3.3.3). Agarose powder (Sigma-Aldrich Company Ltd., Gillingham, UK) was used
to prepare an agarose gel which was used a target for the micro-particles penetration
experiments.
Photoelectric sensors were purchased from SICK Group (Waldkirch, Germany) to detect
velocity of the micro-particles pellets loaded onto a ground slide. Meshes of three different
pore sizes were obtained from Streme Limited (Marlow, UK). A solid microneedle array
(Adminpatch) (Yuzhakov, 2008) which has 31 needles of 1500 μm length was purchased
from nanoBioSciences Limited Liability Company (LLC)(Sunnyvale, CA, USA).
3.3.2 Experimental design
In order to study the micro-particle delivery process, an experimental rig was constructed as
shown in Figure 3.1. Detailed information of the relevant parts of the experimental rig is
listed in Table 3.1. The micro-particle transfer process in such systems can be divided into
three stages: acceleration, separation and deceleration stage. For the acceleration stage, the
pellet of micro-particles attached to ground slide is accelerated to a desired speed by a
pressurized gas which was air in this study. The ground slide blocks the direct flow of gas out
of the barrel and high pressure gas is released through a venthole, avoiding impact and gas
damage on the skin, agarose gel or any other target of the micro-particles. Thus, there is no
gas flow in the separation and deceleration stages. In the separation stage, the pellet is

40
released from the ground slide after hitting a stopping wall. The pellet is released from the
ground slide, hits a mesh placed at the end of the barrel which then breaks into a dispersion of
micro-particles by high speed impaction on an open mesh. For the deceleration stage, the
separated micro-particle spray forward, penetrate into the target via holes created by
microneedles and stop inside the target.
The detailed operating principle of the experimental rig is described as follows: a regulator is
used to control the maximum gas pressure released from the gas cylinder. A control valve is
located between the gas cylinder and receiver to manipulate the gas flow from the cylinder
and store it in the receiver for the experiment. Additionally, a pressure transducer (PT-1) is
placed after the control valve to measure the pressure inside the receiver. A solenoid valve is
used to operate the gas release from the receiver. It can open and close the gate according to a
predetermined time and control the amount of gas released as required.
Figure 3.1: Schematic diagram of the experimental rig
For the experiments, the barrel is mounted horizontally. A second pressure transducer (PT-2)
is located at the start of the barrel to detect the driving gas pressure for accelerating the
ground slide. This is because a large pressure drop occurs between the receiver and the barrel
due to the solenoid valve and the converging section of the receiver. It means that the pressure
inside the receiver is not the same as the driving pressure for ground slide acceleration. The
ground slide loaded with a pellet is placed at the start of the barrel. Two photoelectric sensors
(PS) are located at the end of the barrel, which are separated by a distance of 25 mm. They are
connected to an oscilloscope to record the relevant signals and measure the velocity of the

41
ground slide. The principle of the measurement of the ground slide speed is described in the
section 3.3.3.1. In addition, two ventholes are made at the end of the barrel for release of the
pressurized gas. Additionally, a mesh is placed into a muzzle at the end of the barrel and is
held in place by a mesh holder. A test tube is also mounted in a holder placed at the end of the
barrel to collect the separated particles and to determine the particle passage, stuck and
rebound percentages (some particles remained trapped on the mesh and some rebound into the
barrel). The detailed method is explained in section 3.3.3.1. In order to investigate the effect
of microneedle indentation on the micro-particle penetration, the test tube is filled with
agarose gel. The pellet is fired into this agarose gel to analyse the microneedle effects on
particle delivery.
3.3.3 Methods
3.3.3.1 Experimental data acquisition
(a) The detection of the ground slide velocity
The velocity of the ground slide was detected by a pair of photoelectric sensors. The
photoelectric sensors consist of a light source and receiver, and they are connected to an
oscilloscope to record the relevant electrical signals. Two photoelectric sensors were located
within the barrel, which are marked as PS-1 and PS-2 in Figure 3.1. The barrel was made of
stainless steel, and the inside surface was polished smooth to reduce friction. The space
between the two photoelectric sensors is set at 25 mm. The working principle in this case is
that the oscilloscope starts to record the signal after the ground slide reaches the position of
the first sensor and covers the laser light. After the ground slide passes the second sensor, the
oscilloscope records the time for the ground slide to travel from the first sensor to the second
one. As presented in Figure 3.2, the pink and green waves represent the signals receive from
the first and second sensor, respectively. The breakage of the signal waves are caused by the
ground slide/pressurized gas reaches the sensor to affect the operation of receiver to receive
signal. As required, the second straight line of the green signal between two breakages of
signals represents the travelling time in the space between two sensors. Thereby, an average
velocity for the speed of the ground slide was obtained based on the known distance and
recorded time.

42
Table 3.1: The used equipments and important parameter values for the experiment
Part name Important variable Material/Chemical/other component
Gas cylinder Initial pressure: 200 bar
Size: 146cm×23cm
Mass: 82kg
Compressed air
Supplier: BOC (UK)
Regulator Pressure range: 0-300bar
Supplier: WIKA Instruments Limited
(Redhill, UK)
Control valve Pressure range: 0 – 100
bar
Supplier: Swagelok Company (Solon,
USA)
Pressure transducer Range : 0 -100 bar
Type: XML-G100D71
Supplier: Druck Ltd. (Leicester, UK)
Receiver Volume:1 L Supplier: HOKE Inc.( Spartanburg, USA)
Solenoid valve Pressure range: 0 – 100
bar
Supplier:Connexion developments Ltd(Yate,
UK)
Timer Range: 0.1 – 12 sec
Type: H3DE-F
Supplier: OMRON Electronics Ltd (Milton
Keynes, UK)
Ground slide Diameter: 8 mm/15mm
Length: 12.5 mm
PTFE
Pellet Diameter: 2 mm
Length: 2 mm
Stainless steel micro-particle
Barrel Diameter: 8mm/15mm
Length: 500 mm/250mm
Stainless Steel
Venthole Diameter: 4 mm n/a
Muzzle Hole diameter: 3 mm Stainless Steel
Mesh holder n/a Stainless Steel
Test tube holder n/a PTFE
Oscilloscope Type: TDS 3034B Supplier: Tektronix (Sweden, UK)
PS Response time: 16μs
Scanning range up to 20m
Type: WLL180T
Supplier: SICK Group (Waldkirch,
Germany)

43
Figure 3.2: The detected signal waves of the round slide motion by a oscilloscope
(b) The analysis of the pellet separation
The micro-particles were compressed into the form of a cylindrical pellet for firing in the
experimental rig. The preparation process of the pellet of micro-particles is explained in
section 3.3.3.3 in detail. In the experiments, the pellet is separated by a mesh and fired into an
empty test tube in the separation stage. However, some of the separated particles are unable to
pass through the mesh due to the blockage of the mesh. The analysis of the pellet separation is
mainly focused on studying the passage, stuck and rebound percentages and the size of the
separated particle. Passage percentage represents the proportion of the pellet separate into
smaller size of separated particles to passage through the mesh; stuck percentage indicates the
rate of the pellet of micro-particles stick on the mesh; rebound percentage illustrates the
proportion of the pellet separate into large agglomerates which rebound by the mesh. In this
case, the mass of the pellet, mesh and test tube are measured before the experiment. The mass
of the collected particles is obtained after measuring the mass of the test tube after firing. The
mass of the stuck particles is obtained after measuring the mass of the mesh after firing. The
passage, stuck and rebound percentages are calculated as:
(3.1)
(3.2)
(3.3)

44
where t1 is the mass of the test tube after firing and t2 is the mass of the test tube before firing,
g is the initial mass of the pellet, m1 is the mass of the mesh after firing and m2 is the mass of
the mesh before firing.
In addition, the separated particle sizes should be considered carefully to determine if any
large agglomerates remained which could affect the performance of the system and
penetration depth and damage to the target area. For this measurement, an adhesive-coated
tape is placed at the end of the rig instead of the test tube (Figure 3.1). The pellet is directly
fired into the tape through the mesh, where the particles get stuck. The particle laden
adhesive-coated tape is then analysed in detail by scanning electron microscope (SEM).
3.3.3.2 Characterization of the micro-particle
(a) Particle size distribution
In order to confirm the size of the used stainless steel micro-particles, a particle size analyser
(Coulter, LS130, BECKMAN COULTER, Inc.,) is used to analyse the size distribution of this
micro-particles. As presented in Figure 3.3, the size distribution of stainless steel
micro-particles is analysed in a logarithmic scale from 0 to 900 μm. Result shows that the
diameter by volume only 10 % of micro-particles is over than 22.19 μm, 25 % of them are
larger than 19.93 μm, 50 % of them are greater than 17.54 μm, 75 % of them are bigger than
15.12 μm and 90% of them are over than 12.72 μm. The mean diameter by mass (D [4, 3]) is
around 18 μm.
Figure 3.3: The particle size distribution of uniform stainless steel powder by a logarithmic
scale from 0 to 900μm
0
5
10
15
20
0.1 1 10 100 1000
Per
cen
tag
e (%
)
Particle diameter (μm)

45
(b) Methodology of the sphericity analysis
Figure 3.4 shows a SEM image of the stainless steel micro-particles before they are made into
a pellet form in this study. As can be seen, the shape of micro-particles is very spherical and
most of the particles range between diameters of 1 to 20 µm, although a few larger diameter
particles were found to be present. Majority of the micro-particle was less than 15 µm in
diameter. It matches well with the particle size distribution obtained from the Coulter (LS130,
BECKMAN COULTER, Inc.,) previously. Based on the SEM image, the sphericity is
analysed in this case.
Figure 3.4: SEM image of the uniform stainless steel micro-particles
Previously, Riley (1941) has discovered a two sizeal analysis method for measuring the
sphericity, namely, inscribed circle sphericity. As presented in Figure 3.5, the method is to
define the circumscribed and inscribed circles to obtain the maximum circumscribed and
inscribed cross-sectional areas. The sphericity is calculated as:
√
(3.4)
Where i is the inscribed diameter of the particle, Dc is the circumscribed of the particle and
is the inscribed circle sphericity.

46
Figure 3.5: The circumscribed and inscribed circles for different shape particles
In this case, Image J is chosen to carry out the maximum circumscribed and inscribed
cross-sectional area of micro-particles. From the SEM images, 30 randomly selected particles
were analysed further to calculate the average sphericity of the micro-particle sample which is
found to be 0.92 ± 0.05. The actual density of the micro-particles and the bulk density of the
pellet without PVP are ~ 8 g/cm3 and 4.98 ± 0.02 g/cm3, respectively. The porosity of the
pellet without PVP is 37.6 ± 0.3 %.
3.3.3.3 Characterization of the pellet
(a) The design of pellet press
For the MNs assisted micro-particles delivery, micro-particles are required to press into a
pellet due to a small single micro-particle will loss more momentum during delivery process.
In our case, a stainless steel pellet press is designed based on the macro-micro KBr pellet die
(Sigma-Aldrich, Z506699, UK). As shown in Figure 3.6, it consists of a cover, shim, main
body, base, rod and two seals. The size of the pellet is able to control by changing the length
of the shim and the hole diameter of the pellet press. The operate procedure of this pellet
press is as follows. The main body is placed on top of the base and one of the seals is inserted
into the holes of the main body. Then the powdered stainless steel micro-particles containing
PVP solution are added followed by the second seal. The rod is placed into the cover and
inserted into the main body after placing the shim on the top of main body. Finally, the top
cover is pressed until there is no space between the shim and the cover. Uniformly sized of
pellet can be pushed out slowly using the rod directly into the ground slide to hold the pellet.
i i
Dc Dc
=0.69 =0.88

47
(b) The pellet making procedure
The pellet making procedure in our case was based on the method for making DNA-coated
micro-particles (Thomas et al., 2001). PVP powder dissolved in ethanol was used to bind the
stainless steel particles together (acting as a glue-like substance) as it has been used as a
binder in many other pharmaceutical pellets (e.g., Svarovsky et al., 2008). The reason for
choosing ethanol is that it helps to dry the pellet quickly due to its high volatility. The
strength of the pellet is related to the PVP concentration and, as such the ethanol does not
affect the binding strength of the pellet. In this study, five solutions of differing PVP
concentrations were made, namely 40, 60, 75, 90 and 100 mg/ml PVP in ethanol. Based on
the porosity of the micro-particle pellets (37.6%) and the size of the pellet, the desired amount
of the PVP solution was added to 0.035 g of stainless steel powder by micro-pipette to fill the
void space. We allow this mixture to dry for 1 – 2 minutes approximately at room
temperature. When it is almost dry we transform the powdered stainless steel with PVP
solution into a solid cylindrical pellet with 2 mm length and 2 mm diameter by a pellet press
(Figure 3.6). The pellet is finally loaded into a ground slide and place into the ground slide
holder (Figure 3.7), and record the position which convenient for differentiate the pellets due
to its mass differences. In addition, a single use of PTFE ground slide is used to load the
pellet due to it is low density and frictional properties, as show in Figure 3.7.
Figure 3.8(a) shows the fabricated pellets and the realistic pellet press. It demonstrates that
the pellet press can produce a homogeneous size of pellet. The characterization of the pellet
surface can refer to the SEM image in detail, as show in Figure 3.8(b). As expect,
micro-particles are great stick together and form a uniformly pellet surface. However, PVP is
distributed non-uniformly around the pellet, which may cause the pellet separate into a few
agglomerates after the separation stage due to increased bind strength between some of
micro-particles. This is because PVP solution may be settle in the stainless steel
micro-particles during the drying process.

48
Figure 3.6: Schematic diagram of the pellet press
Figure 3.7: The ground slide holder
5 mm
2 mm
Shim
Main body
Seal
Pellet
Base
Seal
10 mm
10 mm
30 mm
5 mm
3 mm
2 mm
Top Cover
3 mm
35 mm
Rod

49
(a)
(b)
Figure 3.8: (a) The realistic pellet press and the fabricated pellets (b). SEM image of the top
surface of the pellet
3.3.3.4 Characterization of the microneedle
A MN patch (Adminpatch 1500) which has 31 MNs on a 1 cm2 circular patch was used. As
show in Figure 3.9(a), the MNs are distributed as a diamond array on the patch. The space
between two MNs on the side direction is 1546 μm. The spaces between two MNs on the two
diagonal directions are 1970 and 3000 μm. In addition, a top view of a single microneedle and
a side view of the microneedle array have taken by the SEM to analyse the width, thickness
and length of the MN. As shown in Fig 3.9(b-c), the length, thickness and width of each MN
are 1500, 78 and 480 μm, respectively. The characterization of the Adminpatch MN 1500 is
listed in the Table 3.2.

50
(a)
(b) (c)
Figure 3.9: SEM images of the Adminpatch MN 1500: (a). The overall view (b). Top view of
a single microneedle (c). Side view of a microneedle array
Table 3.2: The size of the Adminpatch 1500
Size Length (μm)
Thickness 78
Length 1484
Width 480
Space on the Diagonal line direction 1 1970
Space on the Diagonal line direction 2 3000
Space on the side direction 1546
3.3.3.5 Characterization of the meshes
Stainless steel woven meshes were chosen in this case due to their strength, higher open area
and their acceptance in pharmaceutical research. Three different mesh sizes were used in this
study for pellet breakage, which are explained more in Table 3.3. As shown in the table, the
mesh pore size decreases with an increase in mesh size. The wire diameter also has an effect

51
on the pore size and to some extent on the fractional open area. However, for the meshes used
here the fractional open area remains approximately the same, which allows for easier
comparison of the results for the different pore sizes.
Table 3.3: Important properties of the meshes
Mesh size Pore size (μm) Wire diameter (μm) Open area (%)
50 310 0.20 37%
80 178 0.14 31%
120 122 0.09 33%
3.4 Results and Discussions
As stated earlier, the micro-particles delivery process can be divided into three stages,
namely, acceleration, separation and deceleration. In the following sections the results
corresponding to each of these stages are presented and discussed.
3.4.1 Particle acceleration stage
3.4.1.1 The velocity measurement of the ground slide
Some of the key variables of importance in this study are the operating pressure, the barrel
diameter and length, and their effects on the velocity of the ground slide. The pellet velocity
is also of importance which is equal to the ground slide velocity at the end of the barrel. The
operating pressure of the receiver (Figure 3.1) is another major factor that affects the velocity
of the ground slide. In the developed rig, a significant pressure drop occurs after the release of
gas from the receiver due to a converging area of the receiver and losses in a solenoid valve
attached to the receiver. Therefore, the pressure inside the receiver is not the actual pressure
that accelerates the ground slide. The pressure at the start of the barrel is directly measured by
a pressure transducer, as explained in the section 3.3.2. The pressure inside the gas receiver
ranges from 10 to 40 bar while the actual pressure to accelerate the ground slide varies
between 3 to 6 bar as measured by the pressure transducer, i.e. there is about 70 - 85 %
pressure drop for the system as the gas is released from the receiver. In order to detect the
effect of the barrel length on the velocity, two barrels of 250 and 500 mm lengths were used
in the experiemnts. As shown in Figure 3.10, the velocity of the PTFE ground slide shows a
positive correlation with the actual acceleration pressure. The particle velocity can achieve a
maximum of 102, 123, 139 and 148 m/s at 3, 4.5, 5.5 and 6 bar pressures for the barrel with

52
500 μm length. Figure 3.10 shows a significant difference in velocity between the two
different lengths of barrel; longer barrels allow a greater time for acceleration of the ground
slide. For both barrels, the velocity increases at a low rate at higher pressure. The effect of
pressure on the velocity of the ground slide decreases gradually, because of (i) increased
friction and (ii) the length of barrel is fixed, so the time for acceleration is reduced, even
though the acceleration rate itself increases.
Figure 3.10: The velocity of solid PTFE ground slide against the operating pressure of gas
receiver for different lengths of barrel
Table 3.4: The key variable effect on the mass of the ground slide
Material Diameter(mm) Length(mm) Density(g/cm3)
Mass(g)
PTFE 8 12.5 2.2 1.3
PTFE 15 12.5 2.2 4.85
Stainless steel 8 12.5 8.0 4.6
Stainless steel 15 12.5 8.0 17.7
In this study, PTFE and stainless steel ground slides have been prepared to investigate how
the material density affects the ground slide acceleration. The mass of the ground slide for
each material made is listed in Table 3.4 in detail. As shown in Figure 3.11, the velocity of
the ground slide is very different for the PTFE and stainless steel materials at the same
operating condition. The density of the material affects the mass of the ground slide, making
it more difficult to accelerate; hence increased ground slide density has a negative effect on
the acceleration. Similarly, Figure 3.11 shows that an increase of the barrel diameter causes a
0
20
40
60
80
100
120
140
160
180
0 1 2 3 4 5 6 7
Vel
oci
ty (
m/s
)
Pressure (bar)
Barrel length
500 mm
250 mm

53
decrease on ground slide velocity. The mass of the ground slide increases as the barrel
diameter is increased.
Overall, it is obvious that the mass of the ground slide is important in the acceleration stage.
As expected, the mass increases as the barrel diameter is increased. It also increases with an
increase in the material density and ground slide length. On the other hand, the velocity of the
ground slide decreases with the increase in its mass. These suggest that a narrow diameter
should be used for such studies as it reduces not only the ground slide diameter but also its
mass.
Figure 3.11: The comparison of the effect of material on ground slide acceleration in the wide
and narrow barrel for two different diameters of barrel/ground slide
Based on the above results (Figure 3.10 and 3.11), a barrel with 8 mm diameter and 500 mm
length and PTFE ground slide (12.5 mm long) were chosen for the following study on the
particle separation stage. The velocity of solid PTFE ground slide is 148 m/s at 6 bar pressure.
The micro-particles can achieve the speed over of 600 m/s at much higher pressure for a CST,
e.g., at 60 bar (Liu et al., 2006; Mitchell et al., 2003). This is because the effect of the ground
slide is to reduce the effect of the fired micro-particles. Mitchell et al. (2003) have used a
LGG (Crozier, 1957) which loaded the micro-particles in a ground slide that the effect of the
ground slide is investigated. It obtained that the; their particle velocity is slow downies were
reduced to 170, 250, 330 m/s at 2, 4 and 6 MPa pressure. However, the pressure drop that
occurs in our system means that all micro-particles are accelerated to the same extent for a
0
20
40
60
80
100
120
140
160
180
0 1 2 3 4 5 6 7
Vel
oci
ty (
m/s
)
Pressure (bar)
Solid steel - 8 mm diameter
Solid PTFE - 8 mm diameter
Solid steel - 15 mm diameter
Solid PTFE - 15 mm diameter

54
given barrel length. Therefore, an increased acceleration distance (barrel length) which makes
up for the pressure drop effect for the current system has been chosen. Finally, the particle
velocity for the current system is shown to be slightly different from that in the LGG (Crozier,
1957) operated at 20 bar pressure. As a result, the particle velocity is slower if compared with
the velocity obtained for other types of gene gun, largely due to the pressure drop effect. A
decreased velocity decreases the micro-particle penetration due to a reduction of particle
momentum. However, the application of a solid microneedle patch has promised to remove
this disadvantage since the pierced holes remain in the target tissue when the microneedle
patch is removed and a number of micro-particles can then reach further depths via the
pierced holes. This is explained more in the section 3.4.3.
3.4.2 Particle separation stage
The analysis of the pellet separation for microneedle assisted micro-particle delivery systemis
described below. The passage percentage was analysed in relation to the known pellet
separation variables of operating pressure, PVP concentration and mesh pore size. In addition,
the micro-particles size resulting from the separation stage was studied using scanning
electron microscope.
3.4.2.1 Effect of the operation pressure
Pellet was made using between 40 and 60 mg/ml PVP (pellet binder) concentration and
results were obtained for operation between 2.4 to 4.5 bar pressures and for mesh with pore
sizes of 310 and 178 μm. As shown in Figure 3.12a, with increasing pressure (and hence
increasing velocity) the passage percentage increases rapidly at low pressures and then
remains approximately constant. This is because the velocities of the pellets are larger under
higher operating pressures, which cause the separated particles to gain more momentum
before they are disrupted by passage through the mesh. The results show a significant increase
in passage percentage from 2.4 to 3.5 bar followed by much slower increase from 3.5 to 4.5
bar. This means that at lower operating pressures there is a greater effect of pressure on the
passage percentage. It is likely that the passage percentage reaches a maximum and then
decreases due to some particles sticking to the mesh and some rebounding, hence not passing
into the test tube (particle collector). At lower pressure conditions, the impact force on the
mesh is smaller and hence the pellet is not broken up as effectively, sometime forming larger
aggregates of particles, which block the mesh pores. Therefore, a larger amount of the
separated particles were unable to pass through the mesh. Figure 3.12a also shows the passage

55
percentage increases with an increase of mesh pore size and a decrease of PVP concentration.
The detailed effects of the PVP concentration and pore size on passage percentage are
explained in the following sections.
Figure 3.12(b) shows that the rebound percentage is decreased from an increase of pressure. It
presents a different performance with the passage percentage. All results present a significant
decrease in passage percentage from 2.4 to 3.5 bar which is about 48%, but much lower from
3.5 to 4.5 bar at 5%. It is likely that the rebound percentage reaches a minimum due to the
pellet is separated properly and the most of the particles are passed the mesh. In this
condition, the stuck percentage on the mesh should be a constant due to the open area of the
mesh is a constant which limit the amount of the particle stick on the mesh. As shown in
Figure 3.12(c), the stuck percentage is kept to approximately 1% at each condition.
3.4.2.2 Effect of PVP concentration
In general, the binding strength of the pellet increases with an increase in the PVP
concentration, which in turn causes the passage percentage to decrease. The effect is however
quite weak, as shown in Figure 3.13 which suggests that the passage percentage only
gradually decreases with an increase of PVP concentration. The fall in passage percentage
with increasing PVP concentration is due to the greater adhesive forces and increased strength
of pellet, which are present in the higher PVP concentrations. The larger particles or
agglomerates, i.e. those which are greater in size than the mesh opening, are unable to break
up as the PVP concentration increases which means that they cannot pass through the mesh.
Instinctively, the effect of PVP concentration on passage percentage should be lower at higher
operating pressure. This is because the impact force on the mesh is larger causing the pellet to
separate more easily. However Figure 3.13 shows that the range of binder concentrations used
here does not lead to a significant change in the percentage of the pellet which passes through
the mesh.
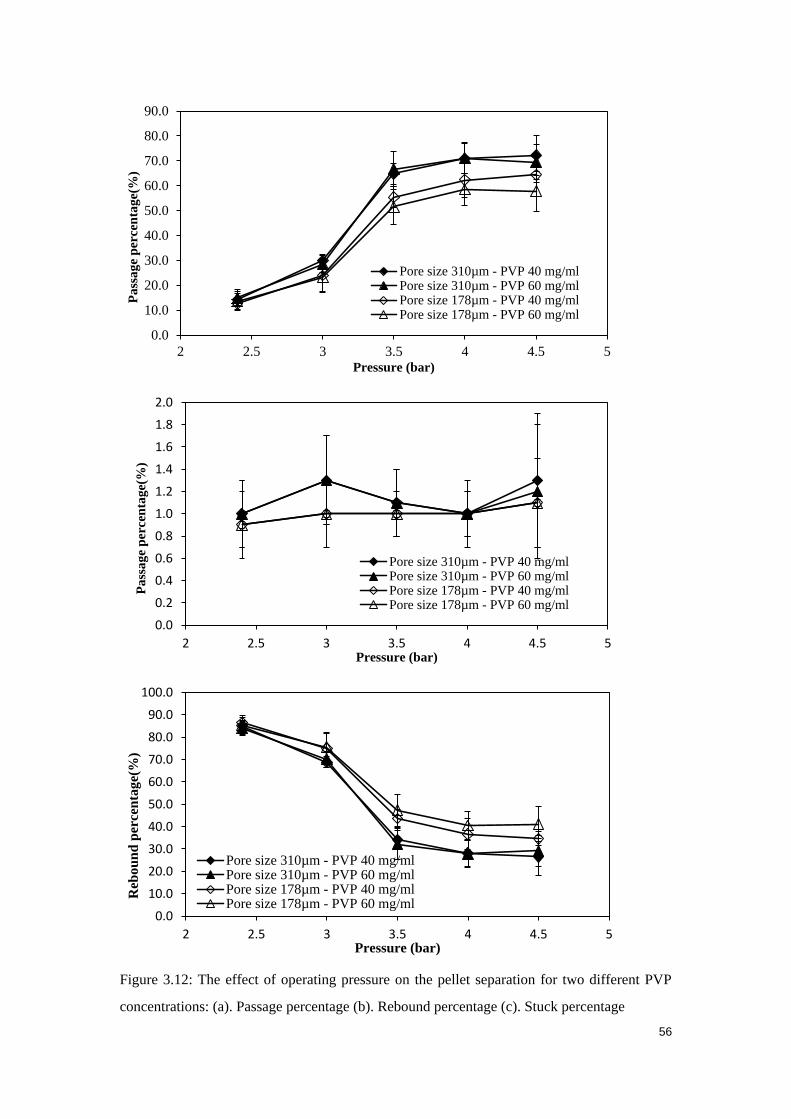
56
Figure 3.12: The effect of operating pressure on the pellet separation for two different PVP
concentrations: (a). Passage percentage (b). Rebound percentage (c). Stuck percentage
0.0
10.0
20.0
30.0
40.0
50.0
60.0
70.0
80.0
90.0
2 2.5 3 3.5 4 4.5 5
Pa
ssa
ge
per
cen
tag
e(%
)
Pressure (bar)
Pore size 310µm - PVP 40 mg/mlPore size 310µm - PVP 60 mg/mlPore size 178µm - PVP 40 mg/mlPore size 178µm - PVP 60 mg/ml
0.0
0.2
0.4
0.6
0.8
1.0
1.2
1.4
1.6
1.8
2.0
2 2.5 3 3.5 4 4.5 5
Pa
ssa
ge
per
cen
tag
e(%
)
Pressure (bar)
Pore size 310µm - PVP 40 mg/mlPore size 310µm - PVP 60 mg/mlPore size 178µm - PVP 40 mg/mlPore size 178µm - PVP 60 mg/ml
0.0
10.0
20.0
30.0
40.0
50.0
60.0
70.0
80.0
90.0
100.0
2 2.5 3 3.5 4 4.5 5
Reb
ou
nd
per
cen
tag
e(%
)
Pressure (bar)
Pore size 310µm - PVP 40 mg/mlPore size 310µm - PVP 60 mg/mlPore size 178µm - PVP 40 mg/mlPore size 178µm - PVP 60 mg/ml

57
Figure 3.13: The PVP concentration effect on the particle passage percentage at various
pressures
3.4.2.3 Effect of the mesh pore size
The effect of the mesh pore size on the pellet separation is one of the main variables that
affect the particle separation. This is because the pore size is able to affect the size of the
separated particles that pass through the mesh. This characteristic of the mesh could also
affect the passage percentage, e.g. by blocking if the smallest mesh pores. To investigate the
effect on the pellet separation, three different pore size meshes are studied at a constant
pressure of 4.5 bar. The detailed information is explained in the Table 3.3, which shows that
although the pore size changes, the fractional open area remains approximately constant for
these meshes.
Figure 3.14 shows that the passage percentage exhibits significant differences for the various
mesh pore sizes. As expected, the passage percentage has positive correlation with the pore
size; larger pore sizes allow larger separated particles to pass through. In addition, the PVP
concentration represented a negative effect on passage percentage especially for the smallest
pore size mesh. The mesh with the largest pore size (about 310 μm) allowed the highest
passage percentage of particles to pass through for each PVP concentration. In contrast, the
mesh with the lowest pore size of 122 μm yielded the lowest passage percent. The next
section discusses the effects of pore size and PVP concentration of the size distribution of the
separated particles.
0.0
10.0
20.0
30.0
40.0
50.0
60.0
70.0
80.0
90.0
30 50 70 90 110
Pa
ssag
e p
erce
nta
ge(%
)
PVP concentration (mg/ml)
2.4 bar3 bar3.5 bar4 bar4.5 bar

58
Figure 3.14: The particle passage percentage against PVP concentrations for various mesh
sizes
3.4.2.4 The analysis of the separated particle size
To achieve the desired particle delivery, one of the factors that are crucial to control is the
size distribution of the separated micro-particles. In general, the mesh pore size is able to
manage the size distribution of the separated particle as it prevents passage of large particles.
In this study, three different meshes were used at pressure of 4.5 bar in order to find out the
effects of mesh pore size on the separated particles. The detailed information on the meshes is
shown in Table 3.2. Figure 3.15a shows an SEM of the particles produced by the mesh with
pore size 122 μm; the pellet has been efficiently broken into individual particles with only a
few small agglomerated particles. The maximum size of the agglomerated particle is about 50
μm. As expected, this mesh resulted in a lower passage percentage compared to the results of
the other two meshes. The passage percentage improved for the mesh with pore size 178 μm
(as shown in Figure 3.14) and the resulting separated particles are shown in Figure 3.15b.
This mesh also broke the pellet into individual particles and prevented passage of large sized
agglomerates. The maximum size of the separated agglomerates is about 70 μm. The
application of the mesh with pore size 310 μm gave the maximum passage percentage.
However, as Figure 3.15c indicates some large agglomerated particles remain; the size of the
largest agglomerate goes up to about 175 μm.
0.0
10.0
20.0
30.0
40.0
50.0
60.0
70.0
80.0
30 40 50 60 70 80 90 100 110
Pa
ssag
e p
erce
nta
ge(%
)
PVP concentration (mg/ml)
Mesh
Pore size 310μm
Pore size 178μm
Pore size 122μm

59
Overall, it can be concluded from this section that the size of the separated particles is
controlled by the mesh pore size. The two smaller pore sizes resulted in effective pellet
separation into individual particles, with relatively few large agglomerates.
(a)
(b)

60
(c)
Figure 3.15: SEM image of the separated particle size which is made of 40 mg/ml PVP
concentration and operated at 4.5 bar pressure: (a): 122 μm pore size (mesh 120), (b) 178 μm
pore size (mesh 80), (c) 310 μm pore size (mesh 50)
The PVP concentration is also a major factor in determining the size distribution of the
separated particles as it provides a binder which affects the strength of the pellet and binds the
particles. Four different PVP concentrations were used to make the pellets which were fired at
a pressure of 4.5 bar and mesh with pore size 178 μm. Figure 3.16a shows the separated
particles for 40 mg/ml PVP concentration. As can be seen, the pellet was efficiently broken
up into individual particles with only a few small agglomerated particles. The passage
percentage decreased only slightly after increasing the PVP concentration to 60 mg/ml for the
pellet and the resulting particles are shown in Figure 3.16b. A number of agglomerates were
observed at this condition. As shown in Figure 3.14, the passage percentages are not
significantly different for different PVP concentrations between 60 to 90 mg/ml. Figure
3.16b-d shows that some agglomerated particles were able to pass through pores of the 178
mm mesh. However, a 40 mg/ml PVP concentration made pellet provides a good control on
the size distribution of the separated particle and a higher passage percentage, i.e. it has
sufficient binder strength to form the pellet that can be manipulated and mounted on the
ground slide, but not so much strength that it affects particle separation.

61
The results show that size distribution of the separated particle is tends to be narrow for the
smaller mesh pore size. Meshes with pore size 122 and 178 μm displayed a good quality of
the size distribution for 40 mg/ml PVP concentration made of pellet. In addition, a mesh with
a pore size of 178 μm yields a higher passage percentage. Large separated particles can
significantly damage the target tissue are detrimental and hence are not acceptable in this
study. In addition, the strength of the pellet also does not allow the particles delivery due to a
lack of particle separation. Most of the pellets should be separated into individual
micro-particles, and the maximum agglomerated particle size should be kept below a target of
70 μm.
(a)

62
(b)
(c)

63
(d)
Figure 3.16: SEM image of the separated particle size which is operated at 4.5 bar pressure
and mesh with pore size 178 μm: (a): 40 mg/ml PVP concentration made of pellet, (b): 60
mg/ml PVP concentration made of pellet, (c): 75 mg/ml PVP concentration made of pellet,
(d): 90 mg/ml PVP concentration made of pellet
3.4.3 Deceleration stage
3.4.3.1 The micro-particle penetration in agarose gel
An aqueous gel made using 0.02 g/ml agarose was chosen as a target medium to study the
effect of the solid microneedle application on the micro-particle penetration. In the
experiment, agarose powder is dissolved into water and heated in a microwave heater which
is then added into a sliced test tube. The test tube is covered solidly from one side with a
removable film. Thus, a flat surface of agarose gel is obtained after the removal of the film
when the gel is set in the test tube. The MN array is manually pressed by putting a flat plate
on the back of the MN array which provides a uniform force to pierce the MN into the gel
until the backing surface of the MN just contacts the gel surface. This flat surface is used as
an object of reference for the determining the insertion of the MNs. Also it is used for the
measurement of the particle penetration depth. Figure 3.17 shows a typical the distribution of
the stainless steel micro-particles after impact on surface of the agarose gel. As can be seen,
the micro-particles were non-uniformly distributed of the gel, with a maximum concentration
at the centre coinciding with the impact position of the pellet on the mesh. In this experiment,
the microneedle array (see Figure 3.9) had been pressed into the surface of the gel and then

64
removed. The holes created by the microneedle array are clearly visible and they remain on
surface of the agarose gel. The size and shape of these holes change only very slowly with
time after the microneedles are withdrawn. The agarose gel is a viscoelastic material like skin
and the MN holes therein shrink with time. We have used 10 holes to obtain an average
length of the pierced holes in the agarose gel which is found to be approximately 720 μm
when Admipatch MN 1500 is inserted.
Figure 3.17: An image of the micro-particle sprayed on an agarose gel
Table 3.5: The penetration depth of the micro-particles
PVP concentration
(mg/ml)
Pressure (bar) Maximum
Penetration depth
with hole (μm)
Penetration depth
without hole (μm)
40 4.5 515.7±124.3 221.4±44.8
3 508.6±137.2 118.7±20.3
In order to determine the micro-particle penetration, agarose gel was cut into thin slices
(approx. 1 mm thick) by razor sharp blades and analysed in more detail using a digital optical
microscope (Eclipse 3100 and Digital Sight, Nikon). As shown in Figure 3.18, the holes were
formed and remained in the gel after the application of the solid microneedle. Figure 3.18 also
shows that the stainless steel micro-particles were visible in the gel surface and within the
holes. As can be seen, the micro-particles seem to have a larger penetration depth compared
to those that have not entered through the pierced holes on the left size of the figure. As
expected, the micro-particles can penetrate into a deep area via the holes. The other
micro-particles only have a little penetration without the hole. The maximum penetration
depths are shown in Table 3.5 in detail.

65
As discussed before, Mitchell et al. (2003) used a LGG to accelerate 99 μm diameter
polystyrene micro-particle and achieved a maximum penetration depth of 150 μm at 60 bar
pressure. Kendal et al. (2004a) used a convergent-divergent device to accelerate gold particles
of diameter 1.8 μm which achieved a maximum penetration depth of 78.6 μm at 60 bar. As
can be seen from Table 3.5, the maximum penetration depth in this study seems to improve in
comparison of the results of Mitchell et al. (2003) and Kendall et al. (2004a). However, an
agarose gel of concentration 2% may not mimic the human skin properties exactly and as
such, the implication of the mechanical properties of the target should be analysed in more
detail. Nevertheless, the results in this section show that the application of a solid microneedle
has a beneficial effect on the micro-particle penetration depth. In addition, the agarose gel
provides a good condition for the measurement of the micro-particle penetration depth by a
digital optical microscope. A skin mimicking agarose gel will be considered in another study
to demonstrate further that microneedle based system has a positive effect for micro-particle
delivery and the implications of the mechanical properties of the target tissue.
Figure 3.18: Optical microscope image of stainless steel micro-particle penetration into
agarose gel (40 mg/ml PVP, 5 bar, Mesh with pore size 178 μm)
3.5 Chapter Summary
An experimental rig involving a micro-particle delivery and injection system has been built in
this study to determine if solid MNs can enhance the penetration depths of the low density
micro-particles which may be used to deliver genes and drugs. For the purpose of this design,
the micro-particle delivery process has been separated into three stages. For the first stage,
namely, the acceleration stage, the results show that an increase in the mass of the ground
slide which carries the particles in the form of a pellet causes a negative effect on the ground
slide acceleration and hence a reduced velocity of the micro-carrier pellet. The mass of the
ground slide is related to its material density and size where the size is typically determined
by the barrel diameter. Based on the present result, a narrow barrel was chosen for the study
of the separation and deceleration stages as it has positive effect on the mass of the ground

66
slide and pressure drop. For the separation stage, the passage percentage was measured using
an empty test tube to collect the separated stainless steel particles which had been broken by
passage through a mesh. The results show that the passage percentage increases with pressure
and mesh pore size but decreases with increasing pellet binder concentration. Increased binder
concentration causes an increase of pellet strength, which seems to have a negative effect on
the pellet separation. The mesh pore size affected the break up of the pellets into individual
particles; larger mesh sizes allowed large agglomerated particles to pass through, which is not
desirable. The mesh pore size has a significant effect on the size distribution of the separated
particle and it can separate the pellet properly into individual particles. In addition, higher
binder concentration pellets led to an increased number of large agglomerated particles. This
is not desirable because the large particles can significantly damage the target tissue. Pellets
bound with 40 mg/ml PVP yielded a higher passage percentage and a good control on the size
distribution of separated particle based on the application of 178 μm pore size mesh. For the
deceleration stage, 2% concentration of agarose gel was chosen as a transparent target
material to study the effect of solid MN application on micro-particle delivery. The results
show the pellet is well separated and sprayed onto the target; a number of stainless steel
micro-particles can penetrate a deep area inside the gel due to the holes created by the solid
MN application. The maximum penetration depth is comparable with previous study (e.g.
Kendall et al., 2004a; Mitchell et al., 2003) and in some cases shows a significant
improvement, but without the need for high pressure gas flows which can damage soft tissues.
However this should be investigated further in a future study.

67
4. Microneedle assisted micro-particle delivery: Experiments using
skin mimicking agarose gel
4.1 Chapter Overview
A set of laboratory experiments has been carried out to determine if microneedles (MNs) can
enhance penetration depths of high speed micro-particles delivered by a type of gene gun. The
micro-particles were fired into a model target material, agarose gel, which was prepared to
mimic the viscoelastic properties of porcine skin. The agarose gel was chosen as a model
target as it can be prepared as a homogeneous and transparent medium with controllable and
reproducible properties allowing accurate determination of penetration depths. Insertions of
various microneedles into gels have been analysed to show that the length of the holes
increases with an increase in the agarose concentration. The penetration depths of
micro-particle were analysed in relation to a number of variables, namely, the operating
pressure, the particle size, the size of a mesh used for particle separation and the MN
dimensions. The results suggest that the penetration depths increase with an increase of the
mesh pore size, due to the passage of large agglomerates. As these particles seem to damage
the target surface, then smaller mesh sizes are recommended; here a mesh with a pore size of
178 μm was used for the majority of the experiments. The operating pressure provides a
positive effect on the penetration depth, i.e., it increases as pressure is increased. Further, as
expected, an application of MNs maximizes the micro-particle penetration depth. The
maximum penetration depth is found to increase as the lengths of the MNs increase. e.g., it is
found to be 1272 ± 42 μm, 1009 ± 49 μm and 656 ± 85 μm at 4.5 bar pressure for spherical
micro-particles of 18 ± 7 μm diameter when we used MNs of 1500 μm, 1200 μm and 750 μm
length, respectively.
4.2 Introduction
Gene guns have been shown to be useful for delivery of DNA vaccines into tissues (Joseph et
al., 2012; O’Brien and Lummis, 2011; Fuller et al., 2006; Trimble et al., 2003; Bellhouse et
al., 1999). These delivery systems are primarily accelerators of micro-particles, which deliver
DNA loaded micro-particles into target tissues to achieve the desired gene transfection
(O’Brien and Lummis, 2011; O’Brien and Lummis, 2006; Zhang et al., 2001; Sanford et al.,
2000). The micro-particles are generally required to penetrate to epidermis layer within the
target to carry out the desired effect of gene delivery and, as such, the penetration depth of the
micro-particles is one of the major variables studied in gene delivery research. Ziegler (2008)

68
has indicated that an acceptable DNA delivery requires that the micro-particles penetrate into
the target skin tissue by approximately 20 - 100 μm. However, the top layer of the skin, i.e.,
the stratum corneum (SC), limits the penetration depths for the particles (Kendall, 2006;
Fuchs and Raghavan, 2002) due to its resistance to particle motion. Furthermore, whatever
the particles achieve in terms of penetration depths in the target tissue, depends on a number
of key variables such as the operating pressure, particle size, properties of the target tissue,
etc. (Soliman and Abdallah, 2011; Arora et al., 2008; Zhang et al., 2007; Brown et al., 2006;
Mitchell et al., 2003).
In general, the micro-particles follow two routes of penetration into the target tissue, which
are the extracellular and intercellular routes (Mitchell et al., 2003). The extracellular route is
followed during delivery of large particles, when the tissue is damaged between the cell
boundaries. Soliman (2011) has suggested that particles which have larger diameters, e.g. 15 -
100 μm, are expected to penetrate by extracellular failures of the tissues. In this case, an
increased size of lower density micro-particles can achieve sufficient momentum to breach
the target layer and penetrate further to the desired depths inside the target tissue (Hardy et al.,
2005; Chen et al., 2001). Due to their biocompatibility and low cost, biomedical grade
stainless steel and polymeric micro-particles are considered to be good choices to replace high
density gold particles. For example, polymeric micro-particles of 15.5 and 26.1 μm diameters
have been delivered at 6 MPa in a conical nozzle by Quinlan et al. (2001). Kendall (2002) has
also used converging-diverging nozzle to deliver polystyrene micro-particles of 26.1 and 39
μm average diameters at 4 MPa to velocities of 365 and 350 m/s, respectively. Truong et al.
(2006) have used polystyrene particles of 15 and 48 μm diameter at 6 MPa in a contoured
shock tube (CST). Liu et al. (2006) have operated with polystyrene particles of diameter 40
μm at 6 MPa to study the particle velocity for a CST. Mitchell et al. (2003) have used
stainless steel micro-particles of 25 μm diameter and concluded that the particles can
penetrate up to 150 μm into excised canine buccal mucosa at a velocity of 170 m/s.
Polystyrene particles of 15.5, 25, 48 and 99 μm diameters have also been operated at 2, 4 and
6 MPa pressures in the light gas gun (LGG) by Mitchell et al. (2003).
Based on these previous studies, it can be concluded that the diameters of low density
micro-particles (e,g., polystyrene and stainless steel) which have been used in gene delivery
typically ranged between 15 to 100 μm. Furthermore the operating pressures for particle
delivery fall in the range between 2 to 6 MPa, which may be considered to be high in many

69
devices. Xia et al. (2011) have indicated that 200 psi (1.4 MPa) should be the maximum
pressure for biolistic transfer of micro-particles to tissue without any damage to the target
material. Traditionally, heavy metal micro-particles including tungsten (Morgan et al., 2011;
Williams et al., 1991; Zelenin et al., 1989; Klein et al., 1987) and gold (O’Brien and Lummis,
2011; Rinberg, 2005; Swain et al., 2000) coated with DNA have been used for targeting
tissues. These elements have high densities and are well suited for particle bombardment.
However, tungsten particles have several disadvantages such as non-biocompatibility, DNA
degradation and toxicity to cells (Bastian et al., 2009; Yoshimisu et al., 2009; Russell et al.,
1992). Gold particles carry the disadvantage of being very expensive. Cell damage is another
problem for the biolistic micro-particle delivery. Sato et al. (2000) have used various types of
gene guns to transfer genes into live rodent brain tissue, which confirmed mechanical damage
on cells from micro-particles delivery. However, cell damage decreases from a decrease in
particle size and operating pressure (O’Brien and Lummis, 2011; Xia et al., 2011; Uchida et
al., 2009).
Addressing the points above, a method of delivering micro-particles is explored in this work
using a model experimental rig, which mimics a typical gene gun for delivery of
micro-particles. A model experimental rig is preferred over a gene gun as it allows control
and monitoring of important operating variables. A polytetrafluoroethylene (PTFE) made
ground slide is used in the current rig, which prevents impact of the pressurized gas onto the
target skin and slows down the velocity of micro-particles while achieving the purpose of
minimized cell damage. The rig also makes use of the application of the microneedle (MN) to
overcome the effect of the barrier of micro-particle target, allowing a number of
micro-particles to reach the deeper area of the target tissue via the holes created by MNs.
Micro-particles of biocompatible stainless steel, which have a lower density compared to gold
and tungsten and are cheaper than gold, are used in this work. The mechanisms of MN
insertion in the skin and, in particular, its application in creating well-defined holes in the skin
have been studied for some years. For example, McAllister et al. (2003) have observed that
holes are created in skin indicating that there is an amount of residual strain that remains after
the microneedles have been removed. They have used a cylindrical MN of 20 µm diameter to
perform staining experiments which indicated that the holes remain after removal of the MNs.
Davis et al. (2004) have used a conical hollow MN of 720 µm length and 30 - 80 µm tip
radius to insert into the skin to study the holes created after removal the MN. In addition,
Martanto et al. (2004) have used a MN array with a needle length of 1000 µm and width of

70
200 µm by 50 µm to create visible holes on a rat skin for drug delivery. Kalluri et al. (2011)
have applied conical MNs of 559 ± 14 µm length, 213 µm base width and 4 µm tip radius on
the skin and reported that they create micro-channels of 60 µm surface diameter and 160 ± 20
µm depth.
The above studies on gene gun show some situations where the gene guns could be coupled
with MNs for improved delivery of micro-particle delivery from gene guns in the practice.
This chapter is focused on developing a MN based system for micro-particle penetration. For
the purpose of this chapter, agarose gel is chosen as a target, as it is a homogeneous and
semi-clear material, providing the convenience to measure the micro-particle penetration
depth by a digital optical microscope. Furthermore changing the agarose concentration allows
alteration of the viscoelastic properties of the target from one experiment to another, which is
difficult to achieve in the case of real tissue, e.g. porcine skin. In our experiments, agarose gel
with viscoelastic properties which mimicked porcine skin is used to study micro-particle
penetration. In addition, this chapter is aimed at studying the penetration depth in relation to
important variables which affect the particle penetration, e.g., operating pressure, particle size
and MN length, using the skin mimicked concentration of agarose and others.
4.3 Material and Methodlogy
4.3.1 Material
Irregular shaped and spherical micro-particles made of biocompatible stainless steel were
purchased from Goodfellow Cambridge Ltd. (Huntingdon, UK) and LPW Technology Ltd.
(Daresbury, UK), respectively. Detailed characterization of the micro-particles is introduced
in section 4.3.3.2. Agarose powder was purchased from Sigma-Aldrich Company Ltd.
(Gillingham, UK). Porcine ear skin samples were obtained from a local butcher.
Stainless steel meshes, used for micro-particle separation were bought from MeshUK, Streme
Limited (Marlow, UK).Two different MN arrays (AdminPatch MN 1200 and 1500) which are
1200 and 1500 μm long were purchased from nanoBioSciences limited liability company
(LLC) (Sunnyvale, CA, USA). In addition, an in-house stainless steel MN array which is
made of 750 μm long was used in this study. The characterization of each MN array is
explained in section 4.3.3.3.

71
4.3.2 Experimental design
A detailed description of a MN based micro-particle delivery system has been introduced in
the previous chapter (see section 3.3.2). Generally, the system comprises an acceleration, a
separation and a deceleration stage. In such a system a pellet of micro-particles is accelerated
by a pressurized gas to a sufficient velocity in the acceleration stage. It is then separated into a
number of small particles by impaction onto a mesh in the separation stage. Finally, the
separated particles penetrate the target which is the final deceleration stage. In order to
achieve the aims of this chapter and carry out an in-depth study of the penetration depth of the
solid micro-particle, an improved version of the experimental rig (Figure 3.1) is used in this
work. Figure 4.1a shows the sections corresponding to the acceleration, separation and
deceleration stages. The improvement has been made in the deceleration stage which contains
the target material for the particles to penetrate. For the purpose of this case, a sliced test tube
(described below) has been placed in the deceleration stage to hold in place the agarose gel,
which acts as a target for the micro-particles. Both ends of the glass tube are open, which
make it convenient to remove the agarose gel without damage, following a penetration test.
In this work, an setup modified from Figure 3.1 is used. It is made by using a sliced test tube
(see Figure 4.1b) which allows observation of particle penetration without the need to slice
the gel. It is based on a polytetrafluoroethylene (PTFE) mold which is placed inside the sliced
test tube, as shown in detail in Figure 4.1b. A test tube is sliced into approximately 1 cm thick
sections where both sides are kept open. The mold is then inserted into a tube piece. The void
space in the mold contains the agarose gel. The mold can separate into two parts, providing a
convenient method for the removal of the gel. Based on the application of the mold, the
agarose gel is prepared into uniform pieces of of 1 cm thickness with smooth surfaces on both
sides to provide a good environment for a digital microscope to detect the micro-particle
penetration.
4.3.3 Experimental methods
4.3.3.1 Data acquisition
(a) Preparation of skin mimicking agarose gel
In this work, agarose gel is used as a skin mimicking target, which allows visualization of the
particles and measurement of the particle penetration depths as a function of number of
variables as discussed later. The method of skin mimicking in this work is based on preparing
an agarose gel, which has similar viscoelastic properties to porcine skin samples collected
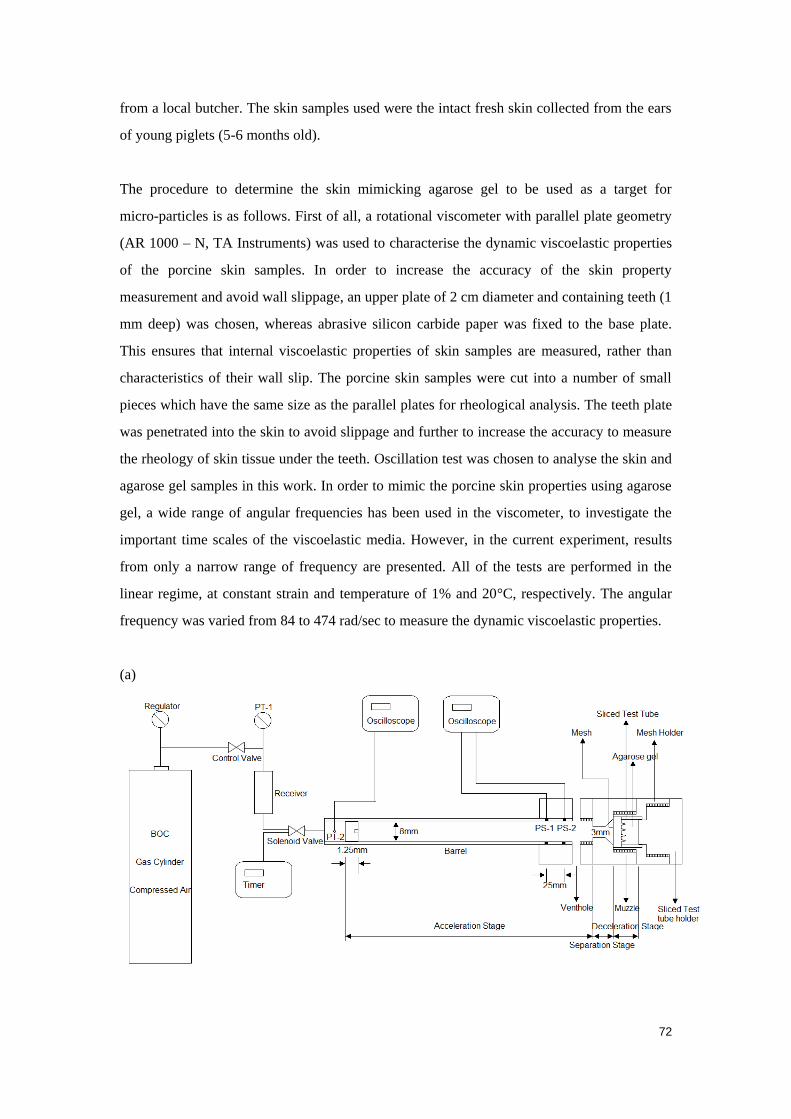
72
from a local butcher. The skin samples used were the intact fresh skin collected from the ears
of young piglets (5-6 months old).
The procedure to determine the skin mimicking agarose gel to be used as a target for
micro-particles is as follows. First of all, a rotational viscometer with parallel plate geometry
(AR 1000 – N, TA Instruments) was used to characterise the dynamic viscoelastic properties
of the porcine skin samples. In order to increase the accuracy of the skin property
measurement and avoid wall slippage, an upper plate of 2 cm diameter and containing teeth (1
mm deep) was chosen, whereas abrasive silicon carbide paper was fixed to the base plate.
This ensures that internal viscoelastic properties of skin samples are measured, rather than
characteristics of their wall slip. The porcine skin samples were cut into a number of small
pieces which have the same size as the parallel plates for rheological analysis. The teeth plate
was penetrated into the skin to avoid slippage and further to increase the accuracy to measure
the rheology of skin tissue under the teeth. Oscillation test was chosen to analyse the skin and
agarose gel samples in this work. In order to mimic the porcine skin properties using agarose
gel, a wide range of angular frequencies has been used in the viscometer, to investigate the
important time scales of the viscoelastic media. However, in the current experiment, results
from only a narrow range of frequency are presented. All of the tests are performed in the
linear regime, at constant strain and temperature of 1% and 20°C, respectively. The angular
frequency was varied from 84 to 474 rad/sec to measure the dynamic viscoelastic properties.
(a)

73
(b)
Figure 4.1: (a). A schematic diagram of the experimental rig which is an improved version of
the Figure 3.1; (b). A schematic diagram of the agarose gel mold
After determining the dynamic viscoelastic properties of the porcine skin, agarose gels with
different concentrations of agarose were analysed to identify the gel that best matches the
dynamic viscoelastic property of the porcine skin. The gels were moulded into 2 cm diameter
slices and a similar thickness as the porcine skin to provide comparability between results of
the two materials.
The experimental data for both skin and agarose gels are used to determine the storage
modulus (G’) (see equation 4.1) and loss modulus (G’’) (Meyers and Chawla, 1999) (equation
4.2). Those two moduli are related to the strain amplitude γ 0, stress amplitude σ 0 and a phase
lag between the strain and stress δ of the material. G’ of the samples shows the stored energy
in the material and indicates the elastic properties. On the other hand, the G’’ indicates the
energy dissipated as heat and characterises the viscous properties. The data are used to
calculate the friction coefficient between particle and skin tissue (μ’) of the samples as
functions of angular frequency ω (Meyers and Chawla, 1999).
cos'G
0
0 (4.1)
sin''G
0
0 (4.2)
Where )tcos(/0 (4.3)

74
)tcos(/0 (4.4)
/''G' (4.5)
In the equations t, σ and γ represent the time, stress and strain, respectively.
(b) Determination of the micro-particle penetration depths and hole lengths
In section 3.4.3, we have shown that the particle penetration depths can be measured by a
digital optical microscope (Eclipse 3100 and Digital Sight, Nikon). As described in §2.2, a
mold is used to prepare the agarose gels to uniform size of 2 mm width, 8 mm length and 1
cm thickness (see Figure 4.1b) and avoided the need for later slicing. The gel was
conveniently removable which avoids damage prior to further analysis. In the experiment, a
uniform force to pierce the MN array into the gel was achieved by manually pressing it on a
flat plate which is placed on the back of the MN array. The MN patch was pressed carefully
until it reached the flat surface of the gel. The gel was taken out and analysed by microscope
directly. Several digital images are taken, and the particle penetration depth was measured by
an image processing software (Image J) using the digital images. Calibration of these images
was conducted using a graticule. The time scale between MN removal and observation of
holes was approximately 30 seconds. The experiment of MN insertion was repeated three
times for the gel per concentration to increase the reliability of the results and verify the
length of the pierced holes. For the measurement of the micro-particle penetration depth, the
procedure was the same with the detection of the hole lengths. The only difference is that the
micro-particles were fired into the gel. The time scale between firing micro-particles and
observation of penetration depth was approximately 2 minutes.
4.3.3.2 Characterization of the irregular stainless steel micro-particles
Two supplies of biocompatible stainless steel made of both irregular and spherical
micro-particles were chosen for the purpose of this case. Figure 4.2 shows a scanning electron
microscopic (SEM) image of the applied irregular stainless steel micro-particles; most of the
particles have rough surfaces and the average sphericity was determined as 0.66 ± 0.13 from
image analysis. Based on the analysis of a particle size analyser (Coulter LS130, BECKMAN
COULTER, Inc., USA), the particle size distribution was determined which is found to be in
the range of 10 to 80 μm, while the the Sauter mean diameter of the particles is 30 ± 15μm.
The bulk density and porosity of these micro-particles are 3.35 ± 0.05 g/cm3 and 58.0 ± 0.6%,
respectively. A second supply of micro-particles was discussed earlier in the section 3.3.3.2.

75
It was much more spherical with an average sphericity of 0.92 ± 0.05. Their size distribution
range was between 1 and 20 μm and their Sauter mean diameter was 18 ± 7μm.
Figure 4.2: A SEM image of the irregular stainless steel (biocompatible) micro-particles
4.3.3.3 Characterization of the microneedles
In this work, three different MNs were used to determine the effects of geometry on the
particle penetration process. Three different lengths of the MNs were chosen so as to confirm
that the trend of results obtained from one particular MN length is observed for another length
of MN.
First of all, a commercially available MN patch namely AdminPatch MN 1500 has been
applied. This maintains continuity of our work as it is, the same MN that array was used in a
previous work (see section 3.3.3.4). The array has a total of 31 MNs which are distributed as a
diamond shape on a 1 cm2 circular area. The spaces on the side line and diagonal lines are
1546, 1643 and 3000 μm (see Figure 3.9); the length, thickness and width of each of the MNs
are 1500, 78 and 480 μm, respectively. In addition AdminPatch MN 1200 was used (see
Figure 4.3a) which has 43 flat MNs and the MNs are distributed more closely on the same
size patch as MN 1500. The spaces on the diagonal lines are 1252, 1970 and 2426 μm. The
thickness and width of each MN are the same as AdminPatch MN 1500 array except the
length is 1200 μm. Finally, an in-house fabricated MN array was also used in this work with a
view to increase the range of variables which should provide a better understanding of the
micro-particle delivery process. Figure 4.3b shows the in-house fabricated MN array which

76
consist of 3 cylindrical MNs on a circular patch. As can be seen, the tip of the needle, made of
biocompatible stainless steel, is polished flat smooth using sand paper. The pitch, i.e., the
centre-to-centre distance between two MNs is 500 μm, and the length and diameter of each
MN are 750 and 250 μm, respectively. The main characteristics of the above three MN arrays
are listed in Table 4.1.
Table 4.1: The characterizations of the MN array used in this study
Name Parameters Value (μm)
Adminpatch MN 1500 Length 1500
Width 480
Thickness 78
Space between MNs 1546
Adminpatch MN 1200 Length 1200
Width 480
Thickness 78
Space between MNs 1252
In-house fabricated MN Length 750
Diameter 250
Space between MNs 500

77
(a)
(b)
Figure 4.3: The image of MN arrays: (a) AdminPatch MN 1200 (b) In-house fabricated MN
array
4.4 Results and Discussions
4.4.1 Preparation of skin mimicking agarose gel
Two 2000 μm thick porcine skin samples cut from ears were used to study the dynamic
viscoelastic property properties, as described in section 4.3.3.1. The results are presented in
section 4.4.1.1, whereas the dynamic viscoelastic properties of skin mimicking agarose gel
are presented in section 4.4.1.2 in detail. Porcine skin has been used previously as a substitute

78
to human skin, as it has similar histological and physiological properties (Dominik et al., 2010;
Edwards et al., 1995; Shergold et al., 2006) and is often used in transdermal drug delivery
studies (Kong et al., 2011). Similarly, agarose gel has been used to mimick skin tissues in
previous studies. For example, Koelmans et al. (2013) have used agarose gel as a skin
simulant to mimic the dermis layer of the skin to study how MNs interact with soft tissue.
Arora et al. (2007) have chosen agarose gel as a model tissue material to study the penetration
of pulsed micro-jets. Some discussions on the rheology of these materials, which mostly
relate to dynamic stress-strain relationship, can be found in the literature (Huang et al., 2013;
Zeng et al., 2001; Sliver et al., 2001; Henry et al., 1997). We choose to determine the
rheological properties in-house as it provides us the option to control the conditions under
which they are measured.
4.4.1.1 Dynamic viscoelastic properties of porcine skin
In this set of experiments, the dynamic viscoelastic properties of porcine skin were tested at a
constant strain value of 1% and wide range of angular frequency from 84 to 474 rad/s by a
rotational viscometer with parallel plate geometry. Storage modulus (G’) of the samples
shows the stored energy and explains their elastic properties, whereas the loss modulus (G’’)
indicate the energy dissipated as heat and characterises the viscous properties. The
temperature on the parallel plate during the experiment was controlled at 20℃ to reduce the
thermal effects on the results. Figures 4.4a-c show the dynamic viscoelastic properties of two
porcine skin samples as a function of angular frequency. As can be seen, both samples show
that the G’ and G’’ increase due to an increase in angular frequency. Moreover, G’ and G’’
are found to match well for the two skin samples, showing consistency of the measurements.
Although G’’ shows a slight difference before 300 rad/s, the difference seems to be negligible
for most practical purposes. Figure 4.4c shows that the friction coefficient between particle
and skin tissue (ŋ’) decreases with an increase of the angular frequency. The dynamic
viscosities of the two skin samples match closely for angular frequencies above 240 rad/s.
The above results, which suggest that reproducible skin properties can be obtained, provide
some confidence to characterise the skin using this viscometer. Finally, it points out that the
friction coefficient between particle and skin tissue over a wide range of strain rates remains
approximately constant at about 20 Pa s.

79
4.4.1.2 Porcine skin mimicking agarose gel
In order to simulate the properties of skin by agarose gel, a gel that has the same size as the
porcine skin sample was prepared using a mold and analysed by the viscometer at the same
maximum strain and range of oscillation condition as was used for porcine skin. After testing
a wide range concentration of agarose gel we find that the viscoelastic properties of the
agarose gel where agarose concentration ranges from 0.026 to 0.027 g/ml is close to porcine
ear skin. As presented in Figures 4.4a-c, the concentration of agarose gel is varied from 0.025
to 0.03 g/m. The results of gel which have agarose concentration lower than 0.025 g/ml are
not presented as their viscoelastic behaviour are significantly different from those of the
porcine skin. Figure 4.4a shows the storage modulus of the agarose gel increases with
increasing angular frequency, in agreement with the results for the skin sample. In addition,
the storage modulus of the 0.0265 g/ml agarose gel shows an excellent match with the porcine
skin. For the loss modulus, the agarose gel shows a slight decreasing tendency with an
increase of angular frequency. The results of porcine skin samples present a different
performance with agarose gel. However, the gel concentrations which range from 0.0265 g/ml
to 0.0280 g/ml represent good matches in terms of the loss modulus variations of porcine
skin. Figure 4.4c shows the agarose gel has a friction coefficient between particle and gel that
decreases with increasing angular frequency (shear-thinning) which shows a same
performance with porcine skin. After the comparison, agarose gel of 0.0265 g/ml is
considered to match with the porcine skin. The other concentration of agarose gel shows a
significant difference with porcine skin at lower angular frequency. Overall, the results of
0.0265 g/ml concentration of agarose gel seem to fit better with the porcine skin samples, if
compared with the results of other concentration of agarose gel. As expected, these results
demonstrate that it is possible to mimic the porcine skin using an agarose gel, based on the
matching of the dynamic viscoelastic properties of the skin. It is not possible to obtain an
exact match over a whole range of deformation conditions, but nevertheless, the 0.0265 g/ml
concentration of agarose gel provides a reasonable match and hence will be used to study
micro-particle penetration for the remainder of the experiment.

80
(a)
(b)
0
5000
10000
15000
20000
25000
30000
35000
0 50 100 150 200 250 300 350 400 450 500
G'(
Pa)
Ang. frequency (rad/sec) Skin Sample 1 Skin Sample 2 0.025 g/ml
0.026 g/ml 0.0265 g/ml 0.027 g/ml
0.028 g/ml 0.029 g/ml 0.03 g/ml
0
1000
2000
3000
4000
5000
6000
7000
8000
9000
10000
0 100 200 300 400 500
G''
(Pa)
Ang. frequency (rad/sec)
Skin Sample 1 Skin Sample 2 0.025 g/ml
0.026 g/ml 0.0265 g/ml 0.027 g/ml
0.028 g/ml 0.029 g/ml 0.03 g/ml

81
(c)
Figure 4.4: Skin mimicking based on the dynamic viscoelastic properties by using agarose
gel: (a) storage modulus against angular frequency, (b) loss modulus against angular
frequency, (c) friction coefficient between particle and porcine skin tissue/gel against angular
frequency
4.4.2 Microneedle insertion
There has been a significant amount of MN insertion research which has focused on studying
skin behaviour after a MN array has been applied. The skin reforms after the removal of the
MN due to its inherent viscoelasticity (Olatunji et al., 2013; McAllister et al., 2003).
Therefore, the length of the MNs is often longer than the desired depth in the skin (Bal et al.,
2010; Donnelly et al., 2011; Kolli et al., 2008; Martanto et al., 2004). Furthermore, the holes
created by the MN close up slowly after the MNs have been removed from the skin. In this
case, the agarose gel is prepared into 1 cm thick section (see section 4.3.2). A skin mimicked
agarose gel (0.0265 g/ml) is chosen to study the effect of the MN insertion on the lengths of
hole created by them. In addition, different concentration of agarose were used to investigate
the MN array effect on the hole lengths depending on different properties of the target
material. The hole length is of significant importance in this study as it relates to the particle
penetration depth, as discussed later. In the experiment, agarose gel is molded to give a flat
surface which is used as an object of reference for the insertion of MN. Observations of MN
insertion and removal into agarose gel, results in holes which are smaller than the dimensions
of the MNs; these holes close rather quickly to an equilibrium size after the MN has been
removed, indicating that the target material has relatively short relaxation times for its elastic
response.
0
20
40
60
80
100
120
0 100 200 300 400 500
ŋ'
(Pa
.s)
Ang. frequency (rad/sec)
Skin Sample 1
Skin Sample 2
0.025 g/ml
0.026 g/ml
0.0265 g/ml
0.027 g/ml
0.028 g/ml
0.029 g/ml
0.03 g/ml

82
Figure 4.5 shows the length of the created holes by different MNs for various concentrations
of agarose in the gels. As expected, the length of the hole is less than the MN length. This is
because of the MNs do not penetrate into the gel fully. In addition, the results show that the
hole length has a positive correlation with the concentration of agarose in the gel. This is
because an increased concentration of gel causes an increase in both the loss and storage
moduli and the friction coefficient between particle and gel, which help to retain the hole size
for longer duration. Figure 4.5 also shows that the average hole lengths increased with
increasing needle length. The holes created by AdminPatch MN 1500 and 1200 close up fully
at 0.02 g/ml concentration of agarose. The thickness of the MNs (78 μm) on those
AdminPatch designs are so small that the holes are unable to remain open when viscoelastic
moduli and viscosities fall too low. However, the holes created by in-house fabricated needle
remained intact at 0.02 g/ml concentration of agarose as the diameter of these needles is
considerably larger at 250 μm.
Figure 4.5: The MN insertion in the various concentration of agarose gel
In the experiment, 10 holes were measured to obtain the average lengths of the pierced hole.
These experimental results suggest that the average hole lengths are 1149 ± 58, 1048 ± 69 and
656 ± 44 μm for skin mimicked agarose gel (0.0265 g/ml) for AdminPatch MN 1500 (length
= 1500 μm), AdminPatch MN 1200 (length = 1200 μm) and in-house fabricated needle
(length = 750 μm), respectively. The results indicate that the holes shrink to about 87% of the
original lengths of the MN after approximately 1 minutes. In addition, the diameter of the
holes created by the in-house fabricated needle shrink to about 156 ± 12 μm. For AdminPatch
MN 1500 and 1200, the widths of the hole are 302 ± 26 and 292.8 ± 18 μm, respectively. The
holes shrunk to about 62 % of the width of the MN. McAllister et al. (2003) reported a
0
200
400
600
800
1000
1200
1400
0.018 0.02 0.022 0.024 0.026 0.028
Ho
le le
ngt
h(μ
m)
Agarose gel concentration (g/ml)
Adminpatch MN 1500 μm
Adminpatch MN 1200 μm
In-house fabricated needle 750 μm

83
residual hole radius of 6 µm following insertion of MNs with radius of 10 µm such that the
holes shrunk to about 60 % of the radius of the MNs. It shows that the results of hole
shrinkage between skin mimicked concentration of agarose and real skin are well correlated.
The above results provide some confidence that the skin mimicked concentration of agarose is
acceptable to replace the skin for further studies of the micro-particle penetration.
4.4.3 Measurements of the micro-particle penetration depth
In the previous chapter, wehas indicated that pellets which are bound together with 40 mg/ml
PVP concentration provides a good pellet separation, if a mesh of 178 μm pore size is used. In
continuation of the previous chapter, pellets of 40 mg/ml PVP concentration are applied in
this work to find out the effect of the key variables on the micro-particle penetration depth. In
this case, an agarose gel is prepared into 1 cm thick slice (see section 4.3.2) and used for the
analyse of the penetration depth is analysed in relation to the mesh pore size, operating
pressure, particle size, MN length and agarose gel concentration (this represents different
viscoelastic properties). Each condition is studied three times to accurately determine the
penetration depth of micro-particles and verify the accuracy of the results. It is worth
mentioning that the maximum operating pressure is limited to 5 bar as the PTFE made ground
slide might crash after the impaction at the end of the wall. The crashed ground slide may
destroy the mesh and affect the experiment results.
4.4.3.1 Effect of the mesh pore size
In theory, the particle penetration depths should increase with an increase of the mesh pore
size, which allows larger particles to pass through; consequently, they have more momentum
to breach the target. In order to determine the significance of this effect for the particle
delivery, two different meshes with pore size of 178 and 310 μm were applied and their
effects on the micro-particle penetration were studied in this section. Figure 4.6a shows the
side view of the micro-particles penetration in the skin mimicked agarose gel, without any
MN application for a mesh of 178 μm pore size. As can be seen, the pellet has broken up into
the micro-particles as it has passed through the mesh and the micro-particles are mainly
distributed around the centre of the gel, i.e., the central impact point of the pellet on the mesh.
A large number of particles are visible close to the top surface, but the vast majority have
penetrated only about 100 µm into the gel. There are such a large number of particles in this
region close to the surface that individual penetrations are difficult to distinguish.

84
However, the top surface of the gel can be defined as shown in Figure 4.6a. Some
micro-particles penetrate deep into the gel, which are clearly visible. There are about 30
micro-particles which have penetrated deeper into the gel and their positions are analysed by
image processing software (ImageJ) to measure the average maximum penetration depth
which is found to be 210 ± 23 μm at 5 bar operating pressure. It is worth mentioning that the
penetration depths of micro-particles are obtained after zooming figure to measure the
distance between micro-particle and top surface based on the scale. These are shown in the
figure. In the magnified view of Figure 4.6a, it is clear that some particles penetrate deep into
the gel, by creating a channel or hole, which remains open even after the particles have come
to rest. The magnified view also shows that some of the particles with the largest penetration
depths are agglomerates; increased agglomerate sizes would lead to higher particle
momentum and hence greater penetration depths.
(a)

85
(b)
Figure 4.6: The effect of the mesh pore size on micro-particle penetration (a) particles passed
through a mesh of 178 μm pore size (b) particles passed through a mesh of 310 μm pore size
(operating pressure: 5 bar; agarose gel concentration: 0.0265 g/ml)
Figure 4.6b shows the micro-particle penetration without MN application following
separation of the pellet by a mesh of 310 μm pore size at 5 bar driving pressure. As can be
seen, a lot of micro-particles are distributed around the surface of the gel. Furthermore, larger
penetration depths were often found due to the application of this mesh, because the large
agglomerated particles have more momentum and hence are better at piercing the target. The
maximum penetration depth in this case is more than for the results (Figure 4.6a) obtained
from the mesh of 178 μm pore size. However, large agglomerated particles which pass the
mesh may damage the target area, as is indicated by the uneven/broken surface of the gel.
Therefore, these results suggest that the 310 μm mesh pore size may not be acceptable for the
MN based system for the conditions chosen in these experiments. In addition, the application
of mesh with 178 μm pore size is shown to have a higher passage percentage and a more
effective pellet separation in a previous chapter (Chapter 3). Considering the passage
percentage and pellet separation state, led to the conclusion that the 178 μm pore size of mesh
should be used for the rest of the study for determining the effect of operating pressure,
particle size, MN size and agarose gel concentration on the penetration depth.
4.4.3.2 Effect of the operating pressure and particle size
The operating pressure and the particle size are two major variables which affect the
micro-particle penetration depths. The momentum of the particles is directly related to those
two variables. Here the AdminPatch MN 1500 has been applied to investigate the MN effect

86
on the particle penetration depth and the combined effect of the operating pressure, particle
size and MN array on the penetration depth is presented in Figure 4.7. In this case, spherical
stainless steel micro-particle of 18 μm and irregular stainless steel micro-particle of 30 μm are
used to study the particle size effect on the penetration depth. As expected, the application of
a MN array has a very significant effect on the penetration depth. This is because the holes
created by the MN array provide a selective path for the micro-particle penetration into the
agarose gel. The holes created by the MN may close up after the particles enter the gel and, as
such, they get fully embedded in the gel.
For the results without needle application, the penetration depths present a positive correlation
with the operating pressure. The penetration depth increases gradually with an increase of the
operating pressure due to the increased velocity and momentum of the particles entering the
target material. In addition, the particle momentum increases due to increased particle size
which also provides a positive effect on the penetration depth. The latter result agrees
qualitatively with the effect of changing the mesh pore size on the penetration depth. In that
case the larger particles sizes arose from agglomerates remain un-separated after passage
through the mesh; these particles penetrated further.
For the result with MN applications, the operating pressure has a positive effect on the
penetration depth for 30 μm diameter particle. However, it seems that the operating pressure
and particle size are not necessarily the major variables that influence the particle penetration
depths when MNs are applied. The length of the pierced holes is the primary factor which
maximizes the particle penetration depth. As can be seen, the 18 μm diameter particles
provide the maximum penetration depth for 3 to 5 bar operating pressures. The length of the
pierced hole is 1149 ± 58 μm when AdminPacth MN 1500 is inserted (section 4.4.2). It helps
the particles to enter into a deeper area at lower pressure. However, there is little difference
between the penetration depths for those two particle sizes. This is because in practice it is not
just the particle size, but an interplay of variables which determines the penetration depth. In
this case, it seems that uniformity of the pore size forms fairly similar sized particle
agglomerates. Therefore, the penetration depth is not directly influenced by the size of the
individual particles.

87
Figure 4.7: The effect of the particle size and operating pressure on the penetration depth
(note: the 18 μm and 30 μm particles are the regular (spherical) and irregular stainless steel
micro-particle, respectively (agarose gel concentration: 0.0265 g/ml)
Figure 4.8 shows the micro-particle penetration in the skin mimicked agarose gel after the
application of AdminPatch MN 1500. As can be seen, there are a number of micro-particles in
the gel which have entered through the pierced holes. Figure 4.8a shows the spherical
micro-particles penetration in the agarose gel. As is evident, a large number of micro-particles
have entered from the left size of the pierced hole. This is because the MN hole at the left side
of the image is located around the central impact point of the pellet on the mesh. The number
of micro-particles in the hole decreases as its position moves away from the central impact
point. Figure 4.8b presents the irregular micro-particles penetration at the same operating
condition as for Figure 4.8a. It shows that the amount of the irregular micro-particles
penetrated in the pierced holes is less than that of the spherical micro-particle. This is can be
explained as follows. The thickness of the MN is only 78 μm and the thickness of the pierced
hole is further reduced due to the shrinkage of the gel. Furthermore, the average diameter of
the irregular particles is about 30 μm and hence it may form larger agglomerates, which are
comparable in size with the thickness of the holes. These factors may result in significant
non-penetration of the irregular particles into the holes. On the other hand, the average
diameter of the spherical particles is 18 μm which is significantly smaller than the thickness
of the hole. Therefore, more spherical particles penetrate into the holes.
0
200
400
600
800
1000
1200
1400
1600
2.5 3 3.5 4 4.5 5 5.5
Pen
etra
tio
n d
epth
(μm
)
Pressure (bar)
Average particle size 30μm - Adminpatch MN 1500μm
Average particle size 18μm - Adminpatch MN 1500μm
Average particle size 30μm - without needle
Average particle size 18μm - without needle

88
(a) (b)
Figure 4.8: The micro-particle penetration in the skin mimicked concentration of agarose gel
based on the application of AdminPatch MN 1500 (a) Spherical micro-particle of 18 μm
average diameter, and (b) irregular micro-particles of 30 μm average diameter (operating
pressure: 4.5 bar, mesh pore size: 178 μm; agarose gel concentration: 0.0265 g/ml)
4.4.3.3 Effect of the microneedle length on particle penetration depth
In general, the maximum penetration depth is related to the size of the applied MN due to the
effect of the holes created. However, as presented in Figure 4.9, the maximum micro-particle
penetration depths differ significantly between each MN array at various operating pressure
of 3 to 5 bar. In this case, spherical stainless steel micro-particle of 18 μm average diameter is
used due to its uniform particle size distribution. Further, it seems that they can be easily
identified inside the gel. As can be seen, the penetration depths increase with increasing MN
length. An increased length of the MN makes longer holes which provide a positive effect on
micro-particle delivery. Figure 4.9 also shows that the penetration depth gradual increases
from an increase of operation pressure, which agrees with the result presented in the previous
section. As expected, the three MN arrays used in this work provide a positive effect on the
micro-particle penetration depth allowing operation a significantly lower driving pressure.
From these results, the maximum penetration depth can reach 1273.2 ± 42.3, 1009 ± 49 and
659 ± 85 μm at 4.5 bar pressure for AdminPatch MN 1500 and 1200 and in-house fabricated
needle, respectively. The results indicate that the maximum penetration depth could be
controlled by the size of the MN and it is related to the desired depth of the target. MN
assisted micro-particle delivery provides a controllable penetration depths of micro-particles
inside the target using various MN sizes. In practice, it should allow micro-particles to
penetrate into epidermis or further to dermis when the pierced holes cross the epidermis layer
of skin. In addition, the maximum penetration depth increases gradually with the increase in

89
operating pressure. It can be safely stated that the effects of the holes on the micro-particle
delivery (e.g., the penetration depth) can be fine-tuned by the operating pressure.
Figure 4.9: The effect of the MN length on the penetration depth (particle type: spherical
stainless steel micro-particle; agarose gel concentration: 0.0265 g/ml)
4.4.3.4 Effect of the agarose gel concentration on the particle penetration depth
Generally, the resistance to the particle penetration into a target should be different if the
rheological properties of the target change. However, it is not clear at this moment how
significant the changes in the property of the target would be on determining the penetration
depths. To address this issue, agarose gels of different concentrations were chosen to imitate
the condition of different targets. In this case, spherical (regular) stainless steel
micro-particles are used and the penetration of the micro-particles in gels of different agarose
concentrations is studied in order to find out the effect of the target property on the
micro-particle penetration depths.
Figure 4.10 shows the effect of the agarose gel concentrations on the particle penetration
depth. As can be seen, the penetration depth decreases from an increase of the agarose gel
concentration without MN. This is because the higher gel concentration has a greater friction
coefficient which provides more resistance to the micro-particle delivery. However, this does
not happen when a MN is used. As discussed in section 4.4.2, the lengths of the MN holes
increase from an increase of the gel concentration, because the increased friction coefficient
and elasticity are better able to hold the holes open. Therefore, the application of the MNs
causes the penetration depths to increases as the agarose gel concentration increases. Figure
4.10 also shows that the experimental error is lower for higher concentration gel. This is
0
200
400
600
800
1000
1200
1400
1600
2.5 3 3.5 4 4.5 5 5.5 6 6.5
Pen
etra
tio
n d
epth
(µm
)
Pressure (bar)
Adminpatch MN 1500μm
Adminpatch MN 1200μm
Inhouse MN 750μm
without needle

90
related to the lengths of the holes which remain intact for higher agarose concentrations. In
addition, the figure shows that the length of the MN correlates well to the penetration depth,
similar to the results in section 4.4.3.3.
Figure 4.10: The effect of the agarose gel concentration on the penetration depth (operating
pressure: 4.5 bar; mesh pore size: 178 μm; particle type: spherical stainless steel
micro-particle)
4.4.3.5 Further discussion
The penetration route of micro-particles for the microneedle assisted micro-particle delivery
is shown in Figure 4.11. The principle of this technique is that DNA is loaded on
micro-particles which are accelerated to a sufficient velocity to pierce into the epidermis layer
of the skin to achieve the DNA transfection. It presents a similar effect with the needle-free
biolistic micro-particle delivery (see Figure 2.22d). However, a number of micro-particles
penetrate through the pierced hole to reach the desired layer of skin. A controllable maximum
penetration depth of micro-particles can be achieved by varying the hole length. It is more
convenient and flexible, compared with needle-free micro-particle delivery. In addition, the
micro-particles are able to deliver into the dermis layer of skin to allow deeper tissue to be
transfected, depending on the length of hole created by the MN.
0
200
400
600
800
1000
1200
1400
0.018 0.02 0.022 0.024 0.026 0.028
Pen
etra
tio
n d
epth
(μm
)
Agarose gel concentration (g/ml)
Adminpatch MN 1500μm
Adminpatch MN 1200μm
Without needle
Inhouse fabricated MN 750 μm

91
.
Figure 4.11: The penetration route of micro-particles for the microneedle assisted
micro-particle delivery
The conditions considered in this case for micro-particle penetration study have been shown
to be useful to gain an insight to the dependence of the penetration of the micro-particles on
many key variables in relation to the MN assisted micro-particle delivery from gene guns.
The penetration depths of the micro-particles were analysed with respect to variations in mesh
pore size, operating pressure, particle size, MN length and agarose gel concentration.
For the effect of the mesh on penetration, larger pore sizes allow large agglomerated particles
to pass through, providing a higher particle passage percentage of the micro-particles (Zhang
et al., 2013). High-speed of large agglomerated particles carry higher momentum and
penetrate further into the target, but they are also more likely to cause damage to external
tissues. In the present case, a mesh with 310 μm of pore size allows the passage of larger
agglomerates. Although itachieves a greater penetration depth in the skin mimicking agarose
gel (see Figure 4.6a). It cannot be used for the micro-particle delivery due to the potential
damage to skin. However, O’Brien and Lummis (2011) have shown that cell damage occurs
after the impaction of high-speed micro-particles but it decreases with a decreased particle
size. The use of a mesh with pore size of 178 μm yields well-separated particles which then
can be discriminated as individual particles at a deeper level of the gel (see Figure 4.6b). It
provides better operation due to the blockage of the largest agglomerated particle, despite the
negative effect on the passage percentage.
Based on a consideration of particle momentum, the operating pressure and particle size are
the key variables that affect the penetration depths. The impaction velocity of the particles is
directly related to the operating pressures. An increased velocity implies that the
micro-particles have more momentum to pierce into a deep level of the target. Therefore, the
Stratum
corneum
10-20μm
Dermis
1-2mm
(b)
Langerhans cell
10 μm
Micro-particles
Viable
epidermis
20-100μm

92
penetration depth increases with an increase in the operating pressure. In addition, an
increased particle size provides a positive effect on the penetration depth due to the increased
momentum. In this case, the average penetration depth for the 30 μm diameter stainless steel
micro-particles is 168 ± 24 μm at 5 bar pressure. For the stainless steel micro-particles of 18
μm diameter, it only has a penetration depth of 101 ± 16 μm. In section 3.4.1, the experiments
have shown that the micro-particles reach a velocity of 122 m/s at 5 bar pressure using the
MN based system. Earlier, Mitchell et al. (2003) have concluded that stainless steel
micro-particles of 25 μm diameter can penetrate 150 μm into excised canine buccal mucosa at
a velocity of 170 m/s. It matches well with the penetration of the stainless steel
micro-particles in the skin mimicked concentration of agarose gel in this case. The
penetration route for needle free biolistic micro-particle delivery is presented in section 2.5.2
(Figure 2.22d) in detail.
As expected, an application of a MN array provides a positive effect on the micro-particle
penetration depth. The detailed penetration route of MN assisted micro-particle delivery is
explained in Figure 4.11. The maximum penetration depth of the micro-particles is presented
with a significant increment from the results without MN application. However, the length of
the pierced holes became the primary factor which enhances the particle penetration depths.
An increased needle length provides a positive effect on the length of the pierced holes, which
maximize the penetration depth. However, the maximum penetration depth of the spherical
micro-particles reaches 1272 ± 42, 1009 ± 49 and 656 ± 85 μm at 4.5 bar pressure for
AdminPatch MN 1500 and 1200 and the in-house fabricated needle, respectively. Those
penetration depths were never achieved previously. In our case, the applied operating pressure
is lower than other relevant gene gun system. For example, Quinlan et al. (2001) have used a
conical nozzle employed at 60 bar to accelerate polymeric micro-particles. Mitchell et al.
(2003) have fired stainless steel micro-particle into canine buccal mucosa at 20 bar pressure
using light gas gun. A lower operating pressure causes a decreased velocity of micro-particle
which may avoid severe tissue damage. In addition, an increased penetration depth of
micro-particle allows deeper tissue to be transfected to achieve an efficient DNA transfection
in the tissue if DNA is coated on the micro-particle. Further, one of the main advantages of
the current approach is that the use of the ground slide (see Figure 4.1a) slows down the
velocities of micro-particles and prevents the pressurized gas to reduce the impact force on
tissue to minimize the cell damage. Also it is worth mentioning that the viscoelastic properties
of the target have two important effects on the penetration of the micro-particles; an increased

93
friction coefficient and elastic modulus provide (i) greater resistance to particle motion and
(ii) affect the relaxation of the target material and hence determine the lengths of the pierced
holes for a fixed geometry of MN. However, the desired depths can be achieved by changing
the size of the MN and the operating pressure.
As mentioned earlier the aim of this chapter was to relate the penetration depth to various
parameters. Indeed the extent of delivery, i.e., the mass of particles delivered with and
without MNs, is a very important question that should be analysed in detail. This is related to
a number of other issues (e.g., number of needles/holes per unit area (needle/hole density)).
Furthermore, the effect of the operating pressure and/or particle size on the pore width at the
target surface may be an important factor that controls the extent of delivery rate. These
aspects were not studied in this paper but we plan to analyse these in the future.
4.5 Chapter Summary
In this chapter, a solid MN based system has been presented for an application on the study of
micro-particle penetration. For the investigation of the particle penetration depth, agarose gel
was chosen to mimic porcine skin due to its homogeneous and semi-clear properties which
provides an ideal target material for measuring the micro-particle penetration depth as a
function of other variables, e.g., pressure and particle size. For the purpose of this chapter, it
was found that the dynamic viscoelastic properties of a gel with 0.0265 g/ml concentration of
agarose were close to values for porcine skin; therefore this concentration of agarose gel was
adopted for the bulk of the experiments in this work. Insertions of various lengths of MN in
different concentrations of agarose gel have been examined to investigate the effect of the
microneedle length of the pierced hole in the target. An increase in length of the MN or the
gel concentration leads to an increased hole length. The penetration depth of the
micro-particles in the skin mimicked concentration of agarose was analysed in relation to the
pore size of mesh, operating pressure, particle size and MN size. It was shown that the
penetration depth increases with an increase of the above four variables. In particular, the MN
length is shown to be a primary variable which maximizes the penetration depth of the
micro-particles. Finally, different concentrations of agarose gel were chosen to imitate the
conditions of various targets. Based on a MN application, the maximum penetration depth
was shown to provide a positive correlation with gel concentration. It indicates that the
property of the target should be considered carefully before using the MN based system.
Based on the target property, a specific length of MN array should be decided for the

94
micro-particle penetration to a desired depth. In conclusion, the MN based system is useful
for micro-particle delivery where the damage of the target from the gas/particles is eliminated
and the micro-particle system can be designed to reach the desired depth within the tissue.

95
5. Microneedle assisted micro-particle delivery: Mathematical model
formulation and experimental verification
5.1 Chapter Overview
Gene gun is a micro-particle delivery system which accelerates DNA loaded micro-particles
to a high speed so as to enable penetration into deeper tissues to achieve gene transfection.
Previously, microneedle (MN) assisted micro-particle delivery has been shown to achieve the
purpose of enhanced penetration depth of micro-particles based on a set of laboratory
experiments. In order to further understand the penetration process of micro-particle, a
mathematical model for MNs assisted micro-particles delivery is developed. The model
mimics the acceleration, separation and deceleration stages of the operation of an
experimental rig aimed at delivering micro-particles into tissues. The developed model is used
to simulate the particle velocity and the trajectories of micro-particles while they penetrate
into the target. The model mimics the deceleration stage to predict the linear trajectories of
micro-particles which randomly select the initial positions in the deceleration stage and fired
into the target. The penetration depths of micro-particles are analysed in relation to a number
of parameters, e.g., operating pressure, particle size, and MNs length. Results are validated
with experimental results obtained from the previous work. The results also show that the
particle penetration depth is increased from an increase of operating pressure, particle size
and MN length. The presence of the pierced holes causes a surge in penetration distance.
5.2 Introduction
Gene guns are aimed at delivering DNA loaded micro-particles into target tissues at high
speed (O’Brien and Lummis, 2006; Yang et al., 2004; Lin, 2000). The penetration depth of
the micro-particles are typically greater than the stratum corneum, i.e., the top layer of skin
(Yager et al., 2013; Kendall et al., 2004a,b; Mitchell et al., 2003; Chen et al., 2002; Quinlan
et al., 2001). To understand various features of the micro-particle delivery and evaluation of
achievable performance from the gene guns, mathematical models are often developed which
aim to simulate the micro-particle transfer process for specific gene delivery system. For
example, Liu (2006) has focused on simulating the velocity distribution in the converging
(conical) section of a venturi system developed for a gene gun, namely, the PowderJect
system (maleo
et al., 1999, 2003, 2006). The particle velocity has been simulated based on a balance
between the inertia of micro-particles and other forces acting on the particles. Zhang et al.

96
(2007) have used the programming platform MATrix LABoratory (MATLAB, the
MathWorks Inc., Natick, USA; Shampine et al., 1997) to simulate three different stages of the
particle delivery in a gene gun, namely, acceleration, separation and deceleration stages. In
this work, the particle velocity is analysed on the basis of Newton’s second law in the
acceleration stage, energy conservation is applied to describe the separation of micro-carriers
into micro-particles in the separation stage, and Stock’s law is used to model the
micro-particle penetration in the deceleration stage. Soliman and Abdallah (2011) have used a
commercial turbo-machinery flow simulator, namely, FINETM/Turbo (NUMECA
International, Brussels, Belgium) to simulate the behaviour of gas and particle flow in a
supersonic core jet in a gene gun. This work used Newton’s second law to mimic the particle
trajectories and determine the penetration depths of micro-particles in the skin. As discussed
below, a number of other studies have shown that the penetration depths of micro-particles
depend on the momentums of the particles which again depend on the particle size, density
and velocity.
As well known, human skin is a major component of the body that must be considered in the
study of micro-particle penetration. The skin helps to prevent the entry of foreign substances
into the body (Holbrook et al., 1974; Scheuplein et al., 1971). It also provides a great
resistance to the moving micro-particles during a particle delivery process. The skin consists
of three main layers, which are the stratum corneum (SC), viable epidermis (VE) and the
dermis (Parker, 1991; Phipps et al., 1988). On average the stratum corneum is between 10 and
20 μm thick (Holbrook et al., 1974) which may vary in different regions of the body and
amongst different groups of people. The thickness of the epidermis also varies in different
regions of the body but it has been reported to have an average thickness of 20 to 100 μm
(Matteucci et al., 2009; Schaefer et al., 1997). In addition, the thickness of the dermis varies
between 1.5 and 3mm (Lambert et al., 2008) and especially on the back it can be up to 4 mm
thick (Rushmer, 1966). The VE of the skin is the target layer for of DNA vaccination for
previous needle free gene gun systems.
In the previous work, it has been shown that the penetration depth of micro-particles could be
improved further to the dermis layer based on the use of MNs by creating holes on the target
which allow a percentage of micro-particles penetrate through to achieve the purpose of
improved penetration depth. In addition, pellets bound with 40 mg/ml concentration of
Polyvinylpyrrolidone (PVP) concentration is found to yield approximately 70% of passage

97
percentage of pellet mass with good control on the size distribution of separated
micro-particle using a mesh of 178 μm pore size. In the section 4.3.2, we have discussed an
experimental rig for MN assisted micro-particle delivery, which consists of acceleration,
separation and deceleration stages (see Figure 4.1). An improvement of the MN based system
has been proposed by using an array of solid MNs to overcome the effect of the skin on the
particle penetration. The solid microneedle is aimed to create pores/holes in the target tissue
which remain for sufficiently long time after removing the MN. Within that time,
micro-particles can be fired in the same tissue. It has been shown that a number of
micro-particles can penetrate into the tissue via the holes while other micro-particles may be
stopped from penetrating into the target by the non-porous (i.e., without MNs created holes)
area of the tissue. The micro-particle transfer process of this system is divided into three
stages, which are the acceleration, separation and deceleration stages. For the acceleration
stage, a ground slide carries a pellet of micro-particles which are accelerated together to a
desired speed by high pressure compressed air. In the separation stage, the pellet will be
released from the ground slide after it reaches a stopping wall in a barrel; thereby it separates
into micro-particles by a stopping screen with high speed. For the deceleration stage, the
separated micro-particle spray forward, penetrate into the target via the holes made by solid
microneedle and stop inside the target.
In a previous chapter (section 4.4.3), we have shown that the penetration depth of stainless
steel micro-particles is enhanced in a skin mimicking agarose gel by using MNs. The work
uses an agarose powder to prepare an agrose gel of a specific concentration (2.65 g/ml) to
mimic the porcine skin based on its viscoelastic properties. This skin mimicking agarose gel
is considered as a target instead of human skin to analyse the penetration depth of stainless
steel micro-particles in relation to the operating pressure, particle size and MN length due to
their homogeneity and transparency provide a good environment to observe the penetration
by a digital optical microscope. The penetration depth of micro-particles in the gel is analysed
by an image processing software, namely, ImageJ (National Institutes of Health, Maryland,
USA) (ImageJ, 2013). The experimental results have shownthat the penetration depth
increases with an increase of operating pressure, particle size and MN length in a previous
chapter (Chapter 4). Especially, the high-speed micro-particles penetrate further into the
target via the pierced holes which are created by MNs. However, the maximum penetration
depth depends on the MN length which makes different lengths of holes on the target.

98
In order to further understand the characteristics of MNs assisted micro-particles delivery, the
present study aims to build a mathematical model to mimic the operation process of the
experimental rig (Figure 4.1) for delivering micro-particles into a target. The micro-particles
are compressed into a cylinder pellet, loaded into a ground slide, and accelerated by a
pressurized air. Thus, the velocity of the pellet is equal to the velocity of the ground slide at
the end of the barrel for this set up. The pellet is broken up into separated micro-particles
which pass through a mesh. As expected, the velocity of the separated micro-particle
decreases due to energy loss from the impaction and passage though the mesh.
In this chapter, a mathematical formulation is presented where the initial velocity of the
separated micro-particle is one of the variables that determine the penetration depth of the
micro-particle in the deceleration stage. The detailed mathematical principle of the model is
presented in section 5.3.1. The presented model is formulated to mimic the acceleration,
separation and deceleration stages of MNs assisted micro-particles delivery using MATLAB
(Version R2012b). It quantifies the effect of operating pressure on the velocity of the ground
slide and compares the results with previous experimental data obtained from section 3.4.1.1
to verify the acceleration stage of the model. In addition, the trajectories of the micro-particles
in the deceleration stage are simulated to determine the routes of the micro-particles and
distribution of the micro-particles in the three layers of skin. The developed model is used to
study the penetration depth of micro-particles in relation to operating pressure, particle size
and MN length and these are compared with a selection of experimental results obtained in
previous chapter (Chapter 4).
5.3 Material and Methodology
5.3.1 Governing equations for micro-particle delivery in various stage
As discussed earlier, the MNs assisted micro-particles delivery process consists of
acceleration, separation and deceleration stages. Brief operation principles of each stage and
the corresponding governing equations that have been used to quantify the process are
presented in the following sections.
5.3.1.1 Acceletration stage
Acceleration stage uses a compressed gas as a driving force to accelerate the ground slide to a
certain velocity which is controlled by the operating pressure in the receiver (see Figure 4.1).
A compressed gas (air in this case) is released from a gas cylinder and stored in the receiver.

99
The pressure inside the receiver is detected by a sensitive pressure transducer. Before the
solenoid valve of the system is opened, the initial volume and pressure inside the receiver are
V1 and P1. After the valve is opened, the gas expands and accelerates the ground slide. The
volume of air increases to V2 and the pressure decreases to P2. Assuming that the gas expands
adiabatically, we can apply the Boyle’s law (Webster, 1995) to obtain:
21211 VVPVP
(5.1)
Where ν is the heat capacity ratio. This process defines gas as a fluid where ν = 1.4 for
diatomic gas and ν = 1.6 for a monatomic gas.
In the acceleration stage, only air does work on the ground slide. The work done by the gas is:
EdlRPL
0
2
2 (5.2)
Where L is the length of the acceleration stage and R is the radius of the ground slide.
We define the final velocity of ground slide before reaching the stopping wall as u, and the
mass of ground slide with the pellet as M. The kinetic energy of the ground slide is therefore
given as:
EMu2
1 2 (5.3)
The sliding friction of the ground slide travelling in the channel is neglected in this
formulation. Based on the law of conservation of energy, the velocity of the ground slide is
given as:
u1M
])V()LRV[(VP2 1
1
12
111
(5.4)
5.3.1.2 Separation stage
In the separation stage, the compressed air is released from the vent hole (see Figure 4.1) and
the ground slide blocks the gas from flowing into the deceleration stage. Further, the pellet is
broken up and separated into individual micro-particles by a mesh which then move across
the mesh into the deceleration stage. In this process, the initial velocity of the pellet is equal to
u which is the velocity of the ground slide. The pellet may lose some energy due to its impact
on the mesh which separates it into individual micro-particles. Assuming that the energy loss
is x in this process, the process is described based on the law of conservation of energy and
given as:

100
2
p
2
1 um2
1x1nmu
2
1 (5.5)
Where n is the number of micro-particles in the pellet; m is the mass of a single
micro-particle; u1 is the velocity of micro-particle after passing through the stopping screen
and mp is the mass of the pellet which can described as nmmp
The rearranged equation (5.5) gives:
1uux1 (5.6)
5.3.1.3 Deceletration stage
The deceleration stage can be separated into two parts. In the first part, the particle travels
between the mesh and the target. There is a gap between the mesh and target which allows
spraying of the micro-particles on a large-area of the target tissue. Thus, the air drag force
acting on the separated micro-particles should be considered in this process. The second step
involves modelling the process of the particle penetration in the skin, which requires
consideration of the resistance force from the skin on the micro-particle delivery. The
micro-particles need to breach the SC and pierce the subsequent layers, e.g., the epidermis
layer. The detailed mathematical principles of these two steps are explained in sections (a)
and (b).
The trajectories of the micro-particles in the deceleration stage are simulated in two
dimensions (2D). The initial positions and moving directions of high-speed micro-particles
are randomly chosen from the beginning in the first step of the deceleration stage. The motion
is considered to be linear but varying in velocity of the particles due to the effects of drag
force on the particles. The particles are allowed to impact on the boundary of the gap between
the mesh and skin. We define that these impacts are elastic collisions and the particles
rebound on the boundary in the model. The detailed physical-mathematical principle of the
micro-particle trajectories are discussed in section (c).
(a) Micro-particles travel in the gap between mesh and skin
The separated particles decelerate in air before hitting the target. This process is described by
the following energy balance equation:

101
dsfe2
2
1 EEEmu2
1 (5.7)
Where E2 is the final kinetic energy of the separated micro-particle. Esfe is the surface free
energy of the pellet and Ed is the energy lost due to the frictional drag force from the
micro-particle in the air.
The frictional drag force on a micro-particle in the air is given as:
dpd
2
2 FACu2
1 (5.8)
Where Fd is the force of drag, is the density of air, Ap is the projected cross-sectional area
of the separated micro-particle, Cd is the air drag coefficient and u2 is the velocity of the
separated particle in the space between mesh and target.
The energy loss due to the drag force is given as:
d
L
0d EdlF
1
(5.9)
After differentiating the energy loss Ed with the distance l we obtain:
dd F
dl
dE (5.10)
Where l is the gap between the mesh and target.
The final kinetic energy of the separated particles before they hit the target is given as:
2
2
2 Emu2
1 (5.11)
Based on equations (5.8) and (5.10), the relationship between the particle velocity and travel
distance is given as
dpd
2
22
2 FACu2
1
dl
dumu (5.12)
The drag coefficient Cd in equation (5.12) is an important parameter in the modelling of gas
and particle interactions. This coefficient is a function of the particle Reynolds number (Re)
(see Appendix A), which depends on the gas viscosity (μ) and density (ρ), particle diameter
(d), and relative velocity (u3). For the purpose of this case, the Reynolds number is defined as:
Redu 2
(5.13)

102
(b) Micro-particles penetration in the target tissue
The particle deceleration in the target skin has the same principle with the particle travel in
the air. In the deceleration stage, the separated micro-particles are resisted by the tissue and
their velocities are slowed down. Based on the law of conservation of energy, the drag force
can be expressed as:
dt
dumf d
d (5.14)
Where fd is the drag force for the micro-particles, ud is the velocity of separated micro-particle
in the tissue.
For the penetration in the target, various studies have adopted that the resistant force on the
micro-particle is separated into three components, namely, yield force (Fy), frictional resistive
force (Ff) and resistive inertial force of target material (Fi) (Soliman et al., 2011; Liu, 2007;
Mitchell et al., 2003; Kendall et al., 2001; Dehn, 1987). In consistent with these previous
studies, we adopt the following the force balance equation:
)FFF(dt
dum yfi
d (5.15)
The equation for each component of the resistant force is as shown below:
dpti ur6F (5.16)
2
dptf uA2
1F (5.17)
ypy A3F (5.18)
Where μt is the friction coefficient between particle and target, rp is the radius of the
micro-particle, ρt is the density of the target and σy is the yield stress of the target.
(c) The mathematical-physical principle and determination of micro-particle trajectory in
deceleration stage
To determine the trajectory of the micro-particles, the mathematical statement is formulated
in two dimensions. Depending on the velocity, size of particle, etc., other important features
of this is the possibility of different angles and positions of particle entrance which have
direct implication on the velocity of the micro-particles. The air in the deceleration stage

103
might move forward when the high pressure gas pushes the ground slide forward. Although
the ground slide can stop the gas from entering the deceleration stage, the air flow still
happens in the front of the ground slide and causes pressure drop in the deceleration stage.
Hence, the axial gas pressure drop is greater than that in the radial direction, i.e.
dr
dP
dz
dP rz
Asdr
dP
dz
dP rz , the axial (z) velocity component is greater than the radial (r) component.
Further, the initial velocity of micro-particle in the deceleration stage is u3.
Therefore
2
r
2
z
2
2 uuu (5.19)
We define that the radial velocity component as k percentage of the axial component.
Therefore
zr kuu
(5.20)
In our case, k is defined to be 0.2.
(d) The micro-particle travel between mesh and target
In the first part of the deceleration stage, the air drag force is presented in equation (5.8).
According to Newton’s second law:
dt
dummaF 2
d
(5.21)
Substitution of equation (5.8) into equation (5.21) provides:
pd
2
d2 ACu
2
1
dt
dum
(5.22)
For axial component, we have
pxdd
r AuuC2
1
dt
dum
(5.23)
For radial component
pydd
z AuuC2
1
dt
dum
(5.24)
At the same time, the radial displacement component is:

104
r
r udt
dl
(5.25)
The axial displacement component is:
z
z udt
dl
(5.26)
The program uses an if statement to define the axial displacement component of the
micro-particle is smaller than the space between the mesh and target or the radial
displacement component is smaller than ly, the particle will impact on the walls before
entering the skin.
(e) Micro-particle penetration in skin
Once the micro-particles reach the surface of the target tissue, an increased resistance from
the target prevents those micro-particles to move forward. The initial velocities of the
micro-particles in axial and radial components equal the velocity at the end of the first step of
deceleration stage. The following velocity change of the micro-particles is calculated based
on the Newton second law and it is shown in equation (5.27) which is obtained from equation
(5.15):
dptypp
2
dt
d ur6A3Au2
1
dt
dum (5.27)
For the axial component of equation (5.27), we have
rpt
d
r
ypprdt
r ur6u
uA3Auu
2
1
dt
dum
(5.28)
On the other hand, the radial component of equation (5.27) is
zpt
d
z
yppydtd
z ur6u
uA3AuuC
2
1
dt
dum
(5.29)
In the program, we use an if statement to define the location of micro-particle. If the axial
displacement component of a micro-particle is larger than the space between the mesh and
target, and the radial displacement component is located at a space between two holes, the
particle will pierce into the target skin. If the axial displacement component of the
micro-particle is larger than the space between the mesh and target and the radial
displacement component is located at a hole area created by the MN, the particle is defined to
be delivered in a hole. Thus, a micro-particle is defined to travel forward in the hole, penetrate

105
into the skin, and achieve a further penetration depth inside skin. The model behaviour is
explained in the section 5.3.3 in detail.
(f) Quantitative description of the events involving micro-particle rebound between mesh
and target
In the first step of deceleration stage, the micro-particles may impact on the boundary of the
gap between the mesh and target skin. We define that the particles impact on the boundary of
the gap between the mesh and skin is an elastic collision, see Figure 5.1.
Figure 5.1: The trajectory of particle impact on a planar wall
Table 5.1: The meaning of each variable in Figure 5.1
Variables Description
Vi The velocity on impact
Vri The radial velocity component on impact
Vzi The axial velocity component on impact
Vr The velocity on rebound
Vrr The radial velocity component on rebound
Vzr The axial velocity component on rebound
Θ The angle of boundary of the gap between mesh
and skin
I The impact point
iv
r
z
rv
x
y
riv
ziv
rrvzrv
Impact
Rebound
iv
rv
y
xivImpact
Rebound
x
yiv
yrv
xrv
i

106
Vxi The tangential velocity component on impact
Vyi The normal velocity component on impact
Vxr The tangential velocity on rebound
Vyr The normal velocity on rebound
The coordinates of radial and axial velocity components at a point on (x,y) axes are defined as
(Vx, Vy). From Figure 5.1, it can be seen that in order to change from (x,y) axes to (r,z) axes, a
rotation through
2 is required. The new coordinates of the tangential and normal
velocity components of that point are (Vr, Vz) on (r, z) axes. Using the standard matrix rules
(Eberly, 2002) to perform the axes- rotation of the velocity vectors gives
y
x
y
x
z
r
V
V
sincos
cossin
V
V
2cos
2sin
2sin
2cos
V
V
(5.30)
When inverted, equation (5.30) gives
z
r
y
x
V
V
sincos
cossin
V
V
(5.31)
Equation (5.31) therefore suggests that for the velocity on impact, the tangential and normal
velocity components on the impact plane are
sinVcosVV
cosVsinVV
ziriyi
zirixi
(5.32)
For the velocity on rebound, the tangential and normal velocity components may be written in
terms of the following coefficients of restitution
yinyr
xitxr
VeV
VeV
(5.33)
Hence rotating back through
2, using equation (5.30), to get the radial and axial
velocity components on rebound provide:
)sinVcosV(sine)cosVsinV(coseV
)sinVcosV(cose)cosVsinV(sineV
zirinziritzr
zirinziritrr
(5.34)

107
We define the collision between micro-particle and the boundary of the gap between mesh
and skin is elastic collision, and then the coefficient of restitution is equal to 1. It means that
there is no energy lost due to the rebound; only the direction of motion has been changed.
5.3.2 Selection of modelling parameters
The impact velocity, particle size and density, target properties are defined as the major
variables affecting the penetration depth. The layers of the skin are considered to mimic the
human skin in the model (see Figure 5.2a). The skin is divided into two distinct macroscopic
layers known as the dermis and the epidermis (Parker, 1991; Phipps, 1988). Stratum corneum
is considered as a part of the epidermis layer. Therefore, the skin is considered to have three
layers in the model, which are shown in Figure 5.2b which is a magnified profile of a section
of the model geometery shown in Figure 5.2a. The thicknesses of the different skin layers
differ which are listed in Table 5.2. The friction coefficient between particle and each skin
layer is treated as the same in the model. Previously (section 4.4.1), we have analysed the
friction coefficient between particle and porcine skin tissue using a rotational viscometer,
which will be used as a replacement for human skin in the model and shown in Table 5.2. For
example, the density of the stratum corneum and viable epidermis are defined as 1.5 and 1.15
g/cm3, respectively, in consistent with the results of Duck (1990). Wildnauer et al. (1971)
have shown that the yield stress of stratum corneum range from 3.2 to 22,5 MPa, which have
been obtained from the measurements of stress-strain characteristics of the human stratum
corneum samples.
Table 5.2: Skin properties used in the model
Parameter Value Reference
Thickness of VE, Tve (m)
Thickness of SC, Tsc(m)
0.0001
0.00002
Holbrook et al. (1974);
Matteucci et al. (2008);
Schaefer et al. (1997)
Yield stress of SC , Ysc (MPa) 3.2 - 22.5 Wildnauer et al. (1971)
Density of SC, ρsc (g/cm3) 1.5 Duck (1990)
Density of VE, ρve (g/cm3) 1.15 Duck (1990)
Yield stress of VE, Yve (MPa) 2.2 Kishino et al. (1988)
Friction coefficient between particle and
porcine skin tissue, μ’ (Pas)
19.6 This work (Chapter 4)

108
In order to investigate the microneedle effect on the penetration depth, an in-house fabricated
MN, Adminpatch MN 1500 and 1200 are (nanoBioSciences limited liability company,
Sunnyvale, CA, USA) chosen for both model and experiments. The detailed characterizations
of each MN are explained in the previous work (see Table 4.1). Previously, Adminpatch
MN 1500 has been chosen to analyse the MNs assisted micro-particles delivery and show that
the lengths of pierced holes vary after the removal of the MNs. But, the length of the pierced
holes are considered uniform in the model and presented in Table 5.3. It is worth mentioning
that the lengths of the pierced holes are from a study of the insertion of MN in a skin
mimicking agarose gel (0.0265 g/ml of agarose), which was obtained in the section 4.4.1.2..
McAllister et al. (2003) have assumed that after the removal of the MNs the surface area of
the hole shrink to 60 percent of that the MNs which originally create the holes. In consistent
with McAllister et al. (2003), the hole width is considered to be 60% of the width/radius of
the MN (Table 5.3) at the time the micro-particles are delivered. The details can be shown in
Figure 5.2a, which presents the pierced holes as uniform cones.
Table 5.3: Relevant constants used in the developed model
Parameter Value
Mass of ground slide with the pellet, M (g)
Length of barrel, L(m)
1.25
0.5
Radius of barrel/ground slide, R(m) 0.00375
Volume of receiver, V1 (L) 1
Space between mesh and skin, L1 (m) 0.05
Density of stainless steel (g/cm3 ) 8
Average Diameter of spherical stainless steel particle
(μm)
18
Average Diameter of Irregular stainless steel particle
(μm)
30
Viscosity of air, μ (Pas) 1.78
Length of pierced holes Lp(μm) Adminpatch 1500 1149
Adminpatch 1200 1048
In-house fabricated MN 656
Width of pierced holes Lw (μm) Adminpatch 1500 302
Adminpatch 1200 302
In-house fabricated MN 156

109
The relevant simulation parameters of the the proposed gene gun system are obtained from an
experimental rig, which include the mass of the ground slide with pellet, volume of receiver,
barrel length and radius and space between mesh and target (skin). Spherical and irregular
stainless steel particles of 18 and 30 μm average diameters are chosen to study the effects of
particle size on the penetration depth for both the model and experiment. The details of the
relevant parameters used in the model are listed in Table 5.3.
5.3.3 Model behaviour of microneedle assisted micro-particle delivery
The governing equations for modelling the MNs assisted micro-particles delivery is solved
using MATLAB (Version R2012b). MATLAB is a powerful programming software for
computing and data processing and visualisation. For our case, we use MATLAB’s in-built
programming language to simulate the particle delivery process in each stage. The detailed
code for the model of the MN assisted micro-particle delivery is shown in the Appendix B.
The presented model consists of a main program to explain the overall process of the
micro-particle delivery, several function programs to input the integration of the required
mathematical equations, event programs to define the event locators of the rebound and
impact points. All constant variables (e.g. skin properties, particle properties) are included as
declared global variables at the start of the program with comments in the main program for
the following simulation (see Tables 5.2 - 3). The acceleration stage is analysed in
one-dimensional using equation (5.4) in the main program to predict the velocity from the
beginning to the end of the barrel at various pressures. The separation stage is implemented
using equation (5.6) in the main programme to define the energy loss of micro-particles
during separation stage and then to calculate the velocity of micro-particle after the passage
through the mesh.
The presented model is focused on determining the trajectories of micro-particles in the
deceleration stage. Firstly, the initial velocity of separated micro-particles in the deceleration
stage (u3) is defined to be equal to u2 which is the final velocity of the separated
micro-particle after passing though the mesh. The velocity of the separated micro-particles is
then analysed in relation to time. After that a two dimensional figure corresponded to the
structure of the deceleration stage is prepared based on the size of experimental set up as
shown in Figure 5.2. The initial position and moving direction of high-speed micro-particles
are randomly chosen from the beginning in the first step of the deceleration stage to mimic

110
the condition of micro-particles passage through the mesh. The motion is considered to be
linear but varying in velocity of the particles due to the effect of drag force. However, the
mathematical equations used to determine the particle velocity are implemented in a separate
function. An if statement is used to determine the selection of equations to calculate the
particle velocity at different positions. This program is implemented to the main program by
considering the condition of the function program (stiff/non-stiff) to choose a suitable ode
solver to determine the velocity changing of micro-particles and plot the trajectories in the
pre-plotted figure (Figure 5.2). The penetration depth of micro-particles in the skin is obtained
from the figure. In addition, equations (5.12, 5.15) are solved using a separately function
program and implemented into the main program to predict the penetration depth of
micro-particle with/without using MNs in one-dimensional simulation. A for statement is
used to repeat the same procedure to simulate a number of micro-particle trajectories in the
program. However, the number of micro-particles is defined as a constant and inputted at the
start of the main program.
(a)

111
(b)
Figure 5.2: Structure of the deceleration stage (Adminpatch 1500) (a). The overall view of the
deceleration stage (b). The zooming view to show the skin layers
Event program is used to define the impact points on the skin and the boundary of the gap
between mesh and skin, and further to point out the end position of micro-particles inside the
skin. Setting the events cause the solver to stop the integration when the micro-particle impact
on the skin and the boundary of the gap between mesh and skin, and then restarts the
integration corresponding to the continuous moving of a micro-particle. In addition, an event
causes the solver to stop the integration when the velocity of micro-particles is less than 10-10
m/s. This event program is implemented in the main program to predict the events of
micro-particles (e.g. impact on the boundary, penetrate into the skin) and show on the particle
trajectories.
5.4 Results and Discussions
5.4.1 Acceletration stage
The micro-particle velocity is a key variable in the microneedle assisted micro-particle
delivery process which is discussed in this section. As mentioned earlier, the developed
mathematical model is built to simulate the acceleration stage of this process where a number
of variables are considered such as the mass of the ground slide (including the pellet), volume
of the gas receiver and, barrel length and diameter. The above relevant constants are listed in
Table 5.3.

112
The operating pressure is another key variable of importance in the model which affects the
velocity of the ground slide. The principle of modelling the acceleration stage is explained in
section 5.3.1.1. The model results show that the operating pressure has a significant effect on
the ground slide velocity (Figure 5.3). As can be seen, an increase in the operating pressure
causes an increased ground slide velocity. The velocities of ground slide reach 85.5, 102.2,
125.1, 138.3 and 144.5 m/s at 2.1, 3, 4.5, 5.5 and 6 bar pressures, respectively.
Figure 5.3: Effect of the operating pressure on the ground slide velocity (modelling results)
A pair of photoelectric sensors has been used to test the velocity of the ground slide in a set of
experiments. A comparison is made between the results from the developed model and
experiments (obtained from section 3.4.1.1)which are shown in Figure 5.4. As can be seen,
both sets of results compare well at each pressure. The velocity increases from an increase of
operating pressure due to an increased kinetic energy of the ground slide. This set of results
provides the confidence that the developed model is suitable for modelling the acceleration
stage of the microneedle assisted micro-particle delivery.
It is seen that the predicted velocity is comparable with the velocity of the ground slide based
gene gun system, e.g. light gas gun (Crozier, 1957; Mitchell at al., 2003) which can accelerate
the micro-particles to a velocities of 170, 250, 330 m/s at 20, 40 and 60 bar pressure. In this
0 0.05 0.1 0.15 0.2 0.25 0.3 0.35 0.4 0.45 0.50
20
40
60
80
100
120
140
160
Barrel length [m]
The v
elo
city o
f gro
und s
lide [
m/s
]
2.1 bar
3 bar
4.5 bar
5.5 bar
6 bar

113
work the ground slide is operated at 6 bar which shows that the velocity is slightly different
with the LGG operated at 20 bar pressure. However, the velocity is much slower if it is
compared with that of other gene gun systems, e,g. contoured shock tube (Truong et al., 2006;
Mitchell et al., 2003), converging-diverging nozzle (Kendall et al., 2004a) and conical nozzle
(Quinlan et al., 2001). The micro-particles normally can achieve a supersonic speed based on
a needle free powder injection system, such as golden particle injector which may reach a
velocity over than 600m/s at 60 bar pressure using contoured shock tube (Liu et al., 2006;
Mitchell et al., 2003). This is because the effects of the ground slide which slows down the
particle velocity.
Figure 5.4: Comparison of modelling (this work) and experimental results (obtained from
section 3.4.1.1) of the ground slide velocity against the operating pressure. The experimental
results in the figure are generated from three repeats of experiments.
An insufficient velocity may mean that the micro-particle cannot reach the desired depth
inside the target due to the insufficient momentum. It can make up for an increase of
operating pressure as 6 bar is a low pressure to operate most gene gun system. However, the
operating pressure is limited in the experimental set up in our case. As such, the velocity of
the ground slide is simulated to reach a velocity of 457 m/s at 6 MPa using the model, which
is much higher than the result obtained from LGG. In section 3.4.1.1, the experimental results
have shown that the velocity increases with a decrease in barrel diameter and ground slide
mass. Therefore, the velocity can improve by changing those two objects in the experimental
set up if higher velocity is necessary. Furthermore, we suggest that the penetration depth is
0
20
40
60
80
100
120
140
160
180
0 1 2 3 4 5 6 7
Ve
loci
ty (
m/s
)
Pressure (bar)
Model result
Experimental result
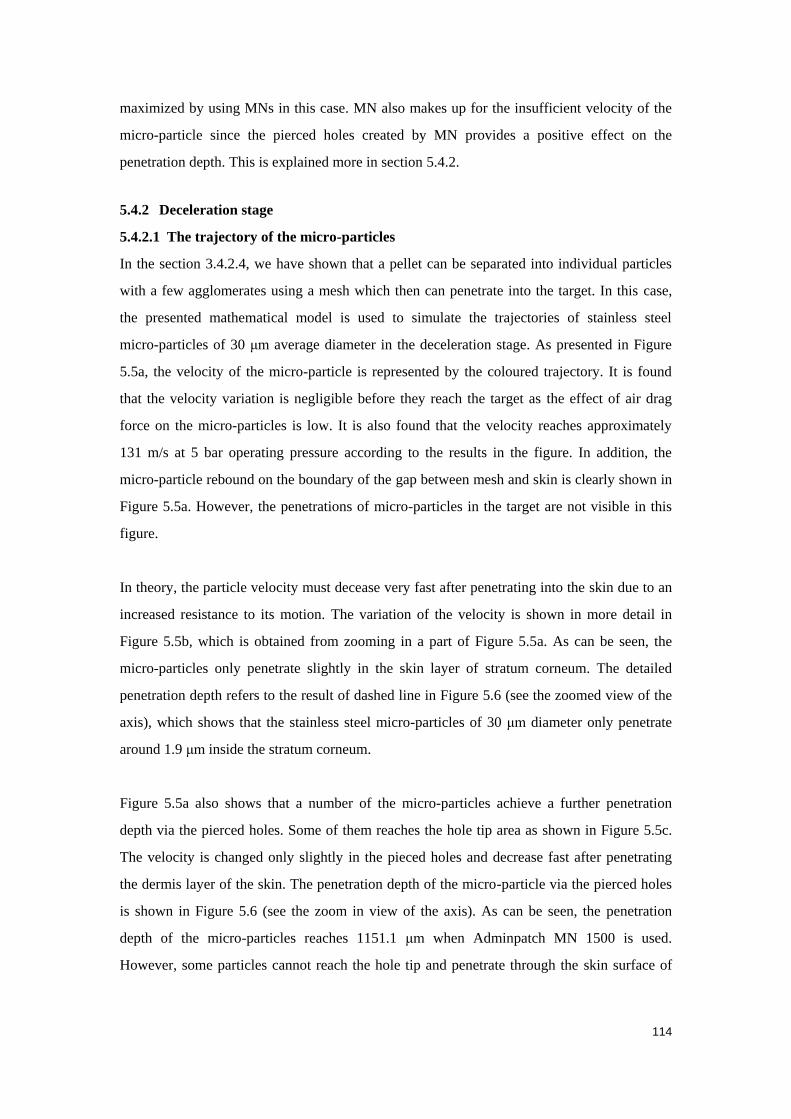
114
maximized by using MNs in this case. MN also makes up for the insufficient velocity of the
micro-particle since the pierced holes created by MN provides a positive effect on the
penetration depth. This is explained more in section 5.4.2.
5.4.2 Deceleration stage
5.4.2.1 The trajectory of the micro-particles
In the section 3.4.2.4, we have shown that a pellet can be separated into individual particles
with a few agglomerates using a mesh which then can penetrate into the target. In this case,
the presented mathematical model is used to simulate the trajectories of stainless steel
micro-particles of 30 μm average diameter in the deceleration stage. As presented in Figure
5.5a, the velocity of the micro-particle is represented by the coloured trajectory. It is found
that the velocity variation is negligible before they reach the target as the effect of air drag
force on the micro-particles is low. It is also found that the velocity reaches approximately
131 m/s at 5 bar operating pressure according to the results in the figure. In addition, the
micro-particle rebound on the boundary of the gap between mesh and skin is clearly shown in
Figure 5.5a. However, the penetrations of micro-particles in the target are not visible in this
figure.
In theory, the particle velocity must decease very fast after penetrating into the skin due to an
increased resistance to its motion. The variation of the velocity is shown in more detail in
Figure 5.5b, which is obtained from zooming in a part of Figure 5.5a. As can be seen, the
micro-particles only penetrate slightly in the skin layer of stratum corneum. The detailed
penetration depth refers to the result of dashed line in Figure 5.6 (see the zoomed view of the
axis), which shows that the stainless steel micro-particles of 30 μm diameter only penetrate
around 1.9 μm inside the stratum corneum.
Figure 5.5a also shows that a number of the micro-particles achieve a further penetration
depth via the pierced holes. Some of them reaches the hole tip area as shown in Figure 5.5c.
The velocity is changed only slightly in the pieced holes and decrease fast after penetrating
the dermis layer of the skin. The penetration depth of the micro-particle via the pierced holes
is shown in Figure 5.6 (see the zoom in view of the axis). As can be seen, the penetration
depth of the micro-particles reaches 1151.1 μm when Adminpatch MN 1500 is used.
However, some particles cannot reach the hole tip and penetrate through the skin surface of

115
the pierced holes to achieve a further depth inside the epidermis/dermis layer of the skin as
shown in Figure 5.5d.
Finally, an arbitrarily selected number of micro-particles, namely one hundred micro-particles,
have been simulated to determine the particle’s final location in each layer of skin. As
presented in Figure 5.7, it shows that about 75% of micro-particles is stopped inside the
stratum corneum, 2% is located within the epidermis layer, and 23% penetrates further into
the dermis layer. In addition, the micro-particles stopped inside the epidermis or dermis layer
are considered to penetrate through the pierced holes which illustrate the use of the
Adminpatch MN 1500 allowing approximately 25% of the micro-particles penetration in the
skin via the pierced holes. The detailed effects of the MN length, particle size and operating
pressure on the penetration depth are explained in the following sections.
(a)
-0.01 -0.005 0 0.005 0.010
1
2
3
4
5
6
7
8
x 10-3
Radial position (m)
Axia
l p
ositio
n (
m)
Micro-particle trajectories
0
20
40
60
80
100
120
140
160
180
Reboundevent
Dermis layer of skin
Fig 5d
Fig 5b
Fig 5c

116
(b)
(c)
4.32 4.33 4.34 4.35 4.36 4.37 4.38
x 10-3
4.995
5
5.005
5.01
5.015
5.02
5.025
x 10-3
Radial position (m)
Axia
l p
ositio
n (
m)
Micro-particle trajectories
0
20
40
60
80
100
120
140
160
180
Pierced hole
VE layer of skin
SC layer of skin
Gap between mesh and skin
-2.07 -2.06 -2.05 -2.04 -2.03 -2.02 -2.01 -2
x 10-3
6.135
6.14
6.145
6.15
6.155
6.16
6.165
x 10-3
Radial position (m)
Axia
l p
ositio
n (
m)
Micro-particle trajectories
0
20
40
60
80
100
120
140
160
180
Pierced hole
Dermis layer of skin

117
(d)
Figure 5.5: The trajectories of the micro-particles in the deceleration stage for the MN
assisted micro-particle delivery: (a).The overall view of the micro-particle trajectories (b).The
particle penetration at the area without needle hole (c). The particle penetration at the hole tip
area inside skin (d). particle penetrates into the side surface of the needle hole inside skin
(stainless steel micro-particle of 30 diameter; pressure: 5 bar)
Figure 5.6: The travel distance of micro-particle in the skin against the velocity.
-3.995 -3.99 -3.985 -3.98 -3.975 -3.97 -3.965
x 10-3
5.354
5.356
5.358
5.36
5.362
5.364
5.366
5.368
5.37
x 10-3
Radial position (m)
Axia
l p
ositio
n (
m)
Micro-particle trajectories
0
20
40
60
80
100
120
140
160
180
Dermis layer of skin
Pierced hole

118
Figure 5.7: The distribution of the micro-particles in different layers of skin
5.4.2.2 Comparsion with experimental resutls
In section 4.4.1, agarose gel has been used to mimic the skin on the basis of rheological
properties using a rotational viscometer. The work shows that the rheology of 0.0265 g/ml
concentration of agarose gel matches well with that the porcine skin, and this skin mimicking
agarose gel is used as a target instead of human skin to analyse the penetration depth in
relation to the operating pressure, particle size and needle length. The operating pressure is
varied from 3 to 5 bar to accelerate biomedical grade stainless steel micro-particles of 18 and
30 μm average diameters to analyse the effect of the particle size and operating pressures on
the penetration depths of the particle. Three different lengths of microneedle arrays, which are
in-house fabricated MN (750 μm) and Adminpatch MN 1500 (1500 μm) and 1200 (750 μm)
are chosen to investigate the effect of MN length on the penetration depth. Results show that
the penetration depth of micro-particles increases from an increase of particle size, operating
pressure and MN length.
In the following sections of this chapter, the experimental results obtained from the previous
work are compared with model results to verify the applicability of the model and further
understand the MNs assisted micro-particles delivery.

119
(a) The effect of the operating pressure and particle size on the penetration depth
In general, operating pressure is one of the major variables which affect the momentum of the
micro-particles and is expected to affect the penetration depths of the micro-particles inside a
target. To confirm the significance of this effect, delivery of stainless steel micro-particles of
18 and 30 μm average diameters are simulated at operating pressure varies from 3 to 60 bar.
The results of these simulations are presented in Figure 5.8. In the figure, the solid lines
represent the micro-particle delivery without the MN pierced holes and they correspond to the
primary y axis (y1). The penetration depth of the micro-particle via the pierced hole is
considered through the secondary y axis (y2). As can be seen, the results show that an
increase of the operating pressure causes a slight increase in the penetration depth. It shows
that stainless steel micro-particle of 18 μm diameter can penetrate only from 0.58 to 2.59 μm
in the skin (inside the stratum corneum) in the pressure ranging from 3 to 60 bar. However, a
number of micro-particles delivered through the pierced holes penetrate into the dermis layer.
The penetration depth inside the dermis layer is slightly more than the stratum corneum due to
a decreased yield stress. As expected, the pierced hole has a greater effect on the penetration
depth. The penetration depth rises from 1149.58 to 1151.66 μm when Adminpatch MN 1500
is used for the pressure ranging from 3 to 60 bar. In addition, Figure 5.8 shows the penetration
depth of 18 μm diameter of stainless steel micro-particle is less than 30 μm diameter. The
effect of the micro-particle size on the penetration depth is discussed in the following section.
The penetration depth of the micro-particles is also related to the size of the micro-particle
which is one of the major variables that affects the particle momentum. As presented in
Figure 5.9, the diameter of the micro-particle shows a positive correlation with the penetration
depth. In this figure, the results plotted in solid line are for the penetration of the
micro-particles without pierced holes and are referred by the primary y axis. The secondary y
axis explains the result plotted in the dashed line and show the maximum penetration depth of
the micro-particle which goes through the pierced hole. The penetration depth is found to be
from 0.71 to 37.12 μm in the top two layers of the skin (stratum corneum and viable
epidermis layers) at operating pressure of 5 bar while the particle diameter ranges from 18 to
140 μm. It indicates that the small micro-particle cannot penetrate further in the skin so much
as they are rebounded by the skin due to the insufficient momentum. However, this condition
may be fixed by the use of a MN array. As shown in Figure 5.9, the penetration depth
increases from 1149.75 to 1189.73 μm, which is enhanced by delivering a number of
micro-particles through the pierced holes created by the Adminpatch MN 1500. The

120
penetration depth in dermis layer varies from 0.75 to 40.73 μm which is more than the
penetration in top layer.
Figure 5.8: The effect of the operating pressure on the penetration depth of the micro-particle
in the skin (stainless steel micro-particles: 18 and 30μm average diameters; MN: Adminpatch
MN 1500; solid line: primary y axis; dashed line: secondary y axis)
Figure 5.9: The penetration depth of stainless steel micro-particle in side skin against the
particle diameter (operating pressure: 5 bar; MN: Adminpacth MN 1500; solid line: primary y
axis; dashed line: secondary y axis)
1120
1125
1130
1135
1140
1145
1150
1155
1160
0
1
2
3
4
5
6
7
8
9
10
0 10 20 30 40 50 60 70
Pen
etra
tio
n d
epth
wit
h h
ole
(µ
m)
Pen
etra
tio
n d
epth
(µ
m)
Pressure (bar)
Penetration without hole - 30 µm Penetration without hole - 18 µm
Penetration in dermis - 30 µm Penetration in dermis - 18 µm
Penetration with hole - 30 µm (secondary axis) Penetration with hole - 18 µm (secondary axis)
1000
1020
1040
1060
1080
1100
1120
1140
1160
1180
1200
0
5
10
15
20
25
30
35
40
45
0 20 40 60 80 100 120 140 160
Pen
etra
tio
n d
epth
wit
h h
ole
(µ
m)
Pen
etra
tio
n d
epth
(µm
)
Particle diameter (µm)
Penetration without hole Penetration in dermis layer
Penetration with hole - secondary axis

121
Figure 5.10: A comparison between model and experimental results at various operating
pressures (stainless steel micro-particles: 18 and 30 diameters; MN: Adminpatch MN 1500;
solid line: primary y axis; dashed line: secondary y axis). The experimental results in the
figure are generated from three repeats of experiments.
A comparison between model and experimental results is shown in Figure 5.10.
Micro-particle penetration without (solid lines) and with (dashed lines) pierced holes refer to
the primary and secondary axes, respectively. As can be seen, the operating pressure and
particle size have a greater effect on the penetration depth for the experimental results. The
penetration depth rises fast while the operating pressure is increased. It also shows a
significant different between stainless steel micro-particles of 18 and 30 μm diameter, which
demonstrates that an increased particle size has a positive correlation on the penetration depth.
However, those two variables only have slight effect on the penetration depth according to the
model result. This is because the pellet is considered to be separated into individual particles
perfectly in the mathematical model which does not happen in practice. In the previous work
(Chapter 3), different pore sizes of meshes are used to break up the pellet separation and
control the size distribution of the separated particles, which show that the pellet has been
1100
1150
1200
1250
1300
1350
1400
0
50
100
150
200
250
2.5 3 3.5 4 4.5 5 5.5
Pen
etra
tio
n w
ith
hole
(μ
m)
Pen
etra
tio
n d
epth
(μm
)
Pressure (bar)
Penetration without needle hole - 30 µm (experimental)
Penetration without needle hole - 30 µm (model)
Penetration without needle hole - 18 µm (experimental)
Penetration without needle hole - 18 µm (model)
Penetration through needle hole - 30 µm (experimental)
Penetration through needle hole - 30 µm (model)
Penetration through needle hole - 18 µm (experimental)
Penetration through needle hole - 18 µm (model)

122
broken into individual particles effectively with only a few small agglomerated particles.
These agglomerated particles may cause an increased penetration depth and further improve
the effect of the operating pressure on the penetration.
Figure 5.10 also shows that the micro-particles penetration through the pierced holes varies
between model and experimental results. For the model result, the length of the pierced holes
is considered to be a constant. Thus, the penetration difference between stainless steel
micro-particles of 18 and 30 μm diameters is only slight since the momentum of those two
particles are insufficient to penetrate further in the skin. These differ with experimental results
which show that the penetration depth varies at the operating pressure ranges from 3 to 5 bar.
This is because the length of the pierced holes is varied after the removal of the MNs in the
experiment. It directly affects the micro-particle penetration depth, such as small particles
may penetrate further than larger particles. As present in Figure 5.10, the penetration depth of
stainless steel micro-particles of 18 μm diameter is more than 30 μm diameter at 3 and 3.5 bar
pressure. However, the experimental results show that the stainless steel micro-particles of 30
and 18 μm diameters reach the penetration depth from 1119.7 to 1314.4 μm and from 1188.3
to 1255.1 μm while the pressure varies from 3 to 5 bar, respectively. The operating pressure
only presents a slight effect at this condition. As expected, the length of the pierced holes
becomes the primary factor which maximizes the penetration depth. It directly relates to the
length of MN. The effect of the microneedle length on the penetration depth is discussed in
the following section.
(b) The effect of microneedle length
In principle, the length of the pierced hole depends on the length of the microneedle. An
increased length of MNs causes an increase in the pierced holes and thereby increases the
penetration depth of micro-particles. As presented in Figure 5.11, the penetration depths of
the micro-particle differ significantly between each application of MNs. Both model and
experimental results present that the penetration depth increases from an increase of MN
length. For the model result, the operating pressure does not show a great effect on the
penetration depth. For the experimental result, the penetration depth is varied at the operating
pressure ranges from 3 to 5 bar. This is because of the effect of the agglomerates and the
unmaintainable length of pierced holes, which are presented in previous section. The
operating pressure presents a positive effect on the penetration depth, which agrees with the
model result.

123
Figure 5.11: The effect of the microneedle length on the penetration depth of the stainless
steel micro-particle (30 μm). The experimental results in the figure are generated from three
repeats of experiments.
In conclusion, the experimental results match well with the model results in Figure 5.11. It
confirms that this mathematical model is suitable for modelling MNs assisted micro-particles
delivery. It also indicates that the micro-particles can be deposited at a desired depth in a
target based on a use of specific lengths of MNs. In addition, the penetration depth gradually
increases with the increase in operating pressure. It can be considered that based on the
assistance of the holes on the micro-particle delivery, the penetration depth can be fine tuned
by the operating pressure.
(c) Further discussion
In the above sections, the penetration depths of micro-particles are analysed with respect to
variations in operating pressure, particle size, MN size using modelling and experimental
results. It is evident that the particle penetration depth increases from an increase of the
operating pressure and particle size as the particle momentum is related to those two key
variables. In the experiment, the agglomerates present a greater effect on the particle
penetration depth. It shows that the model result cannot match well with the experimental
result. However, the agglomerates can be prevented by using a smaller pore size of mesh to
0
200
400
600
800
1000
1200
1400
1600
2.5 3 3.5 4 4.5 5 5.5
Pe
ne
trat
ion
de
pth
(µ
m)
Pressure (bar) Model result Experimental result
Adminpatch MN 1500 µm Adminpatch MN 1500 µmAdminpatch MN 1200 µm Adminpatch MN 1200 µmIn-house fabricated MN 750 µm In-house fabricated MN 750 µm

124
allow individual micro-particles to pass through and obtain a uniform penetration depth which
is comparable with the model results.
As expected, an application of MN array provides a positive effect on the micro-particle
penetration. The maximum penetration depth of the micro-particles is presented a significant
increment from the result without MN application. For the MN assisted micro-particle
delivery, the penetration depth reaches the dermis layer inside skin, which was never achieved
in the previous gene gun systems (e.g., injection jet, light gas gun, contoured shock tube, etc).
Mitchell et al. (2003) have used a light gas to accelerate the stainless steel micro-particles of
25 μm diameter to a velocity of 170 m/s (20 bar) and penetrate 150 μm into excised canine
buccal mucosa. Kendal (2001) has suggested that the 1 ± 0.2 μm diameter gold particles can
reach a velocity of 580 ± 50 m/s at 40 bar pressure using a contoured shock tube and
penetrate 66 μm in the skin. The epidermis has been generally normally considered as the
target tissue for gene loaded particle delivery as the devices may be limited by the penetration
depth they achieve (Trainer et al., 1997). But now the target tissue may be the dermis layer as
the use of MNs promise to increase the penetration depth further. In other words, the MN may
be useful for the injection of micro-particle especially the targets which require a deep
injection of the particles.
5.5 Chapter Summary
A mathematical model is built for solid MNs assisted micro-particles delivery. MNs assisted
micro-particles delivery is studied in this chapter. For the acceleration stage, the particle
velocity is analysed in relation to the operating pressure and these result compare well with
the experimental result obtained from the previous work (section 3.4.1.1). For the
deceleration stage, an individual micro-particle trajectory has been simulated in the model.
Additionally, the distribution of the micro-particles in three different layers has been
determined using modelling results. These results show that about 75% of particles penetrate
into the stratum corneum without going through the holes, and 23 and 2% of particles
penetrate into epidermis and dermis layers via the pierced holes, respectively. The presented
model for MN assisted micro-particle delivery takes into consideration possible change in
operating pressure, particle size, MN length due to the micro-particle delivery is directly
related to those key variables. Model results obtained indicate that increasing the operating
pressure and particle size would increase the penetration depth of the micro-particles inside
skin due to the increased momentum. In addition, the hole length is shown to be a major

125
variable which maximizes the particle penetration depth. The model results match well with
the experimental results for the penetration depth of micro-particles. In conclusion, the
presented model is shown to be useful for simulating micro-particle trajectories and
penetration depth for MN assisted micro-particle delivery.

126
6. Microneedle assisted micro-particle delivery: Experiment and
modelling on the effects of particle characteristics
6.1 Chapter Overview
The assistance of microneedles (MN) has been proven to overcome the resistance of target
materials and further enhance the penetration depths of micro-particles, which are moving at
high speeds such as those in gene gun. This chapter aims to investigate the penetration of
model materials, namely, tungsten (< 1 μm diameter) and stainless steel (18 and 30 μm
diameters) micro-particles into a skin mimicking agarose gel to determine the effect of
particle characteristics. A number of experiments have been processed to analyse the passage
percentage and the penetration depth of these micro-particles in relation to the operating
pressures and MN lengths. A comparison between stainless steel (18 and 30 μm diameters)
and tungsten micro-particles has been discussed, e.g. passage percentage, penetration depth.
The passage percentage of tungsten micro-particles is found to be less than the stainless steel.
It is worth mentioning that the tungsten micro-particles present unfavourable results which
show that they cannot penetrate into the skin mimicking agarose gel without the help of MN
due to insufficient momentum due to the smaller particle size. This condition does not occur
for stainless steel micro-particles. In order to further understand the penetration of tungsten
micro-particles, a mathematical model has been built based on the experimental set up. The
penetration depth of the micro-particles is analysed in relation to the size, operating pressure
and MN length for conditions which cannot be obtained in the experiment.In addition, the
penetration depth difference between stainless steel and tungsten micro-particles is studied
using the developed model to further understand the effect of an increased particle density
and size on the penetration depth.
6.2 Introduction
Gene gun systems have been designed primarily as needle free techniques which can
accelerate DNA loaded micro-particles to provide them with sufficient momentums so as to
breach the outer layer of the skin and achieve the purposes of gene transfection (Kis et al.,
2012; Soliman, 2011; Walters and Roberts, 2007; Kendall et al., 2004). Generally, the
epidermis layer of the skin is considered as the main target of the micro-particles (Soliman et
al., 2011; Liu, 2006; Quinlan et al., 2001; Bennett et al., 1999; Trainer et al., 1997).
However, cell and tissue damages are particular problems for the use of gene guns (O’Brien
and Lummis, 2011; Uchida et al., 2009; Thomas et al., 2001; Sato et al., 2000; Yoshida et al.,

127
1997). In principle, reduction of the operation pressure (Xia et al., 2011; Uchida et al., 2009;
Yoshida et al., 1997) and particle size (O’Brien and Lummis, 2011) can minimize the cell
damage but these tend to decrease the particle momentum and, hence, the penetration depth of
the micro-particles in the tissue. In addressing these issues, a series of experiments which
combines solid microneedles (MNs) with an in-house micro-particle delivery system has been
discussed earlier in the chapter 4 and 5.
MNs are minimally invasive microstructures that pierce the outer layer of skin, namely the
stratum corneum, almost painlessly which has been shown to enhance drug delivery rate (e.g.,
Olatunji and Das, 2011; Nayak et al., 2013; Olatunji et al., 2013; Donnelly et al., 2012). They
are generally classified into ‘solid’ and ‘hollow’ microneedles (e.g., Al-Qallaf et al., 2009;
Olatunji and Das, 2010; Olatunji et al., 2012; Nayak and Das, 2013; Han and Das, 2013;
Zhang et al., 2013a,b,c). The solid MNs are able to penetrate the human skin to make holes
(Kalluri et al., 2011; Davis et al., 2004; McAllister et al., 2003) as well as deliver drugs/genes
which are coated (Cormier et al., 2004) or encapsulated (Miyano et al., 2005).The MN holes
can also be used by the biolistic system for the delivery of the micro-particles. As envisaged,
micro-particles can penetrate with less resistance into the skin through the holes and further
achieve an enhanced penetration depth to allow gene transfection in deeper tissue. In our
previous work (see Chapter 4), the experimental setup of MN assisted micro-particle delivery
system has been used to fire stainless steel micro-particles having average diameters of 18 μm
into a skin mimicking agarose gel. The results have shown that a number of micro-particles
are penetrated through the holes and achieve a considerable increase in the maximum
penetration depth of 1272 ± 42 μm inside the gel using 1500 μm length of MNs (AdminPatch
MN 1500) as compared to the cases where no microneedles are applied.
As discussed earlier, the overall process of MN assisted transdermal micro-particle delivery
from gene guns consists of three stages, which are the acceleration, separation and
deceleration stages. These stages are identified in Figure 4.1a. The system stores the
pressurized gas in a gas receiver to a desired pressure which is detected by a digital pressure
transducer. The release of the pressurized gas is operated by a solenoid valve. In addition, it is
worth mentioning that the system uses a ground slide which can prevent the impact of
pressurized gas on the target tissue and release the gas from the ventholes. The acceleration
stage is a major part of the particle delivery process as it is within this stage the
micro-particles are accelerated to sufficient velocities using a pressurized gas as a driving

128
source. To achieve these, the micro-particles are compressed and bound loosely into a pellet
form and loaded into a ground slide in the system. As the ground slide is accelerated by the
pressurised gas, the pellet containing the micro-particles is also accelerated. The separation
stage is then followed which is aimed at separating the pellet into individual particles by a
mesh although it is possible that this stage produces a few agglomerates.
The deceleration stage involves two steps as follows: (i) the transport of the micro-particles in
a space between mesh and target and (ii) the penetration of micro-particles into the chosen
target. Previously, an experimental rig (Figure 4.1a) has used to deliver stainless steel
micro-particles into a skin mimicking agarose gel so as to demonstrate the feasibility of MN
assisted micro-particle delivery. The results have shown that an enhanced penetration depth of
micro-particles inside the agarose gel can be achieved using MN assisted micro-particle
delivery at a much lower injection pressure compared to typical gene guns.
Generally, the route of the micro-particle penetration in the target tissue is divided into two
types which are the extracellular and intercellular routes (Soliman and Abdallah, 2011;
Mitchell et al., 2003). The extracellular route may occur with large particles due to failures
between the cell boundaries (Soliman, 2011). For example, Mitchell et al. (2003) have fired
stainless steel micro-particles of 25 μm average diameter into canine buccal mucosa using
light gas gun (Crozier et al., 1957), which is governed by the micro-particle transport through
extracellular route. However, the disadvantage of this is that large particle sizes may cause a
lot of damage or destroy the skin surface.
The intercellular route is considered to be important in the case of delivering small particles,
which pass through individual cell membranes and can be used for particle mediated DNA
immunization (Soliman and Abdallah, 2011; Hardy et al., 2005). Dense materials (e.g. gold
and tungsten) are often made into small particles of a diameter ranging from 0.6 to 6 μm
(Soliman, 2011; Hardy et al., 2005) which are smaller than the cell diameter. The particles
can be accelerated to higher speeds to obtain enough momentum to breach the skin and
penetrate through the individual cell membranes. Although gold is recommended for the
particle delivery due to its high density, low toxicity and lack of chemical reactivity (Macklin,
2000), it is an expensive method. Several studies for the golden micro-particle delivery have
been made, which show that the gold micro-particles can breach the human skin and penetrate
to a depth ranging from 35 - 135 μm at 30 bar operating pressure (Arora et al., 2008; Giudice

129
et al., 2006). Kendal et al. (2004) have used a convergent-divergent device to accelerate gold
particles of 1.8 μm diameter which achieves a maximum penetration depth of 78.6 μm at 60
bar pressure. Mitchell et al. (2003) have found that gold particle of 1 - 3 μm diameter can
reach a depth of around 60 μm in canine tissue at an injection particle velocity of 550 ± 50
m/s. Recently, O’Brien and Lummis (2011) have reported that the penetration depth of golden
micro-particles of 1 μm diameter in mouse ear tissue is 50±11 μm when the Helios gene gun
is used at an operating pressure of 5.1 bar (75 psi).
In general, the intercellular route is the preferred penetration route due to less cell and tissue
damages for the small micro-particles. In order to validate the effect of the MN assisted
micro-particle delivery on the small micro-particles, tungsten micro-particles may be chosen
to analyse the penetration in the skin mimicking agarose gel. Tungsten micro-particles are
considered to be a good substitute for golden micro-particles for research of biolistic
micro-particle delivery because of their cost effectiveness compared to gold particles, despite
the fact they can be toxic to cells (Bastian et al., 2009; Yoshimisu et al., 2009; Russell et al.,
1992). For example, Klein et al. (1987) first used a particle gun to accelerate spherical
tungsten particles of 4 μm diameter into epidermal cells of onions. Williams et al. (1991)
have used a helium-driven apparatus to study 3.9 μm average diameter tungsten and of golden
particles, with a diameter ranged from 2 to 5 μm, on mouse liver.
Motivated by the above work, this chapter aims to investigate the effects of particle
characteristics on MN assisted micro-particle delivery by using micro-particles (e.g. tungsten
micro-particles, biomedical grade stainless steel) of different densities and particle sizes. The
study gives an indirect comparison between the extracellular and intercellular routes using
MN assisted micro-particle delivery. In Chapter 3, we have determined the passage
percentage of stainless steel micro-particles at various conditions, e.g., mesh pore size,
Polyvinylpyrrolidone (PVP - binder) concentration and operating pressure. The required mesh
pore size and PVP concentration of pellets for MN assisted micro-particle delivery for given
particle size is pointed out. This chapter aims to revisit the same questions to determine the
dependence of particle characteristics using tungsten and stainless steel micro-particles with
the help of the experimental rig (Figure 4.1). A skin mimicking agarose gel is used as a target
to determine the difference in penetration depth between tungsten and stainless steel
micro-particles. In order to further understand the particle size and density effect on the
penetration depth, a mathematical model of MN assisted micro-particle delivery is built based

130
on the experimental rig using MATLAB (Version R2012b). The model is used to analyse the
theoretical penetration depth of those two materials of micro-particles and further to verify the
experimental result. In addition, the model also aims to investigate the effect of the target
properties (e.g. density, friction coefficient) on the maximum penetration depth of
micro-particles. In particular, the developed model is used to determine the characteristics of
the micro-particle delivery where experimental data are not readily available.
6.3 Material and experimental methods
6.3.1 Characterization of tungsten micro-particles
Figure 6.1: A SEM image of irregular tungsten powder (Sauter mean diameter: 0.49 μm)
Irregular shaped tungsten micro-particles were purchased form Sigma-Aldrich Company Ltd
(Gillingham, UK). It is considered as a good replacement for gold particles because its
density is similar to gold and has a low cost (Menezes et al., 2012). The particle size
distribution of tungsten powder is analysed by a particle size analyser (Mastersizer 2000,
Malvern Instruments, Ltd, Malvern, Worcestershire, UK). It is found to range from 0.198 to
1.439 μm with a mean diameter of 0.58 μm and Sauter mean diameter of 0.49 μm. The
particles can be viewed in the SEM image in Figure 6.1. The tungsten particles are highly
agglomerated and have rough surfaces. From the SEM image, 50 random micro-particles are
chosen to measure the average sphericity of the tungsten micro-particles which is found to be
0.66 ± 0.13 µm. The average bulk density and porosity of tungsten powder are 7.43 ± 0.08
g/cm3 and 59.6 ± 0.4%. Ultimately, by combining the SEM image results with the size

131
distribution, gained from particle size analyser it is possible to confirm that the tungsten
particles are a nano-size powder.
6.3.2 A further invertigation of the characterization of the pellet
For the MN assisted micro-particle delivery, the micro-particles are required to be in the form
a compressed cylindrical pellet which is prepared by a pellet press as described in section
3.3.3.3. Furthermore, the packing density should be homogeneous within the pellet as far as
possible so as to increase the possibility that when the pellet is broken into particles, one
obtains uniformly separated particles. Heterogeneity in the packing of the pellet is likely to
create more uncertainty in the distribution of the separated particles. To prepare the
cylindrical pellet, we have mixed 40 mg of PVP in 1 ml of ethanol in which an amount of
0.035 g stainless steel micro-particles has been added and bind the particles together. The
mixture is transferred to a pellet press and compressed into a solid cylindrical pellet.
Ethanol is evaporated due to their high volatility and therefore, it is not present in the dry
pellet which is used in experiments. A similar method was followed to produce the pellets in
this work. Further, the homogeneity of the micro-particle packing was checked using a micro
computed tomography (micro-CT) (Ritman, 2004). Micro-CT is an advanced non-destructive
3D imaging technique which can be used to clearly understand the internal microstructure of
the samples (Ritman, 2004). Micro-CT is used to detect the internal damages or heterogeneity
in the structure of pellet in this case. As an example, a three dimensional view of the stainless
steel pellet is shown in Figure 6.2a. As can be seen, the stainless steel micro-particles are
compressed into a homogenous cylindrical pellet with approximately 2 mm in diameter and
length. Although the top and button surfaces of the pellet are slightly rough because the pellet
gets stuck on the pellet press, it is not a big concern. The internal top view of the pellet at the
position of 1.08 mm on the z axis is shown in Figure 6.2b and the size view of the internal
structure of the pellet at the position of 1.08 mm on the y-axis is shown in Figure 6.2c. It
shows that PVP (white spots) is non-uniformly distributed in the pellet. PVP is fills the void
space between micro-particles causing them to bind strongly together as indicated by the
white circles (PVP) in the Figures 6.2b-c. The above figures cannot clearly show the PVP
combination of the pellet. A view can be obtained by referring to the SEM image of the top
surface of the pellet (see Figure 6.3).
Figure 6.3 clearly shows the characterization of the pellet top surface. As can be seen, the
micro-particles are bound to form a uniform pellet surface. As expected, the PVP is

132
distributed non-uniformly around the pellet, which agrees with results detected by the
micro-CT (Figure 6.2). Thus, it may cause the pellet to separate into a few agglomerates after
the separation stage due to increased bind strength between some of micro-particles.
Previously (see Chapter 3), we have analysed the passage percentage of the pellet and size
distribution of the separated particles using various operating pressure and different binder
(PVP) concentration. 40 mg/ml PVP in a pellet is shown to ideal as it almost separates the
pellet into individual micro-particles with some small agglomerates using 178 μm pore size of
mesh. As discussed earlier in the Figures 3.15b and 3.16a (see section 3.4.2.4), the application
of mesh pore size presents a good control of the size distribution of the separated
micro-particles and uses to the following experiments for the investigation of the penetration
depth of tungsten micro-particles in the skin mimicking agarose gel.
(a)
(b) (c)
Figure 6.2: Micro-CT images of a stainless steel micro-particle pellet made of 40 mg/ml PVP
concentration (a) reconstructed three dimension view of the pellet (b) top internal view across
the pellet at the position of 1.08 mm on the z axis (c) side internal view across the pellet at the
position of 1.08 mm on the y axis. The images show homogeneity of the packing of the
micro-particles

133
Figure 6.3: SEM image of the top surface of the pellet
6.3.3 Modelling strategy and parameters
In previous chapter, the detailed mathematical principle of the microneedle assisted
micro-particle delivery is discussed. MATrix LABoratory (Matlab) is used to build and solve
the theoretical model for MN assisted micro-particle delivery. The detailed model behaviour
is described previously in the section 5.3.3. Generally, it consists of three main parts
including a main program, an event program and two function programs (acceleration and
deceleration stage). The main program simulates the whole process of the MN assisted
micro-particle delivery. The event program defines the impact points of the micro-particles on
the skin, rebound points on the boundary of the gap between mesh and skin and the end points
inside the skin. The function programs input the equations, which are used to determine the
theoretical results. The function programs are implemented to the main program by choosing
a suitable ode solver which requires considering the condition of the function program
(stiff/non-stiff). In addition, an if statement has been used to define the position of the
micro-particles and further to confirm the selection of the equations to calculate the
theoretical velocity of micro-particles at different position. A for statement has been used to
repeat the simulation of a number of micro-particles in the deceleration stage.
In the model, human skin is considered as a target for micro-particles in the model. The three
main layers of human skin, stratum cornum (SC), viable epidermis (VE) and dermis layers are
considered in the model. The detailed skin properties are listed in the Table 5.2. It is worth to
mention that the yield stress and density of the dermis layer is considered the same with the

134
viable epidermis layer. In the Chapter 4, we have used porcine skin instead of human skin to
analyse the friction coefficient between particle and skin tissue by using a rotational
viscometer with parallel plate geometry. The result will be used in this study, which is shown
in Table 5.2. The friction coefficient between particle and each skin layer is treated as the
same in the model.
In this case, this model is chosen to analyse the delivery of tungsten micro-particles. In a
previous work (section 3.4.2.4), the pellet is shown to be separated into individual particles
with a few agglomerates using a mesh and then penetrates into the target. It illustrates that a
number of the tungsten particles agglomerated after the separation stage in the experiment. In
order to correlate the model with the realistic experiments, a number of tungsten
micro-particles are considered to the diameter of tungsten particle are considered to
agglomerate together to be 3 μm diameter after the separation stage in the model. The other
relevant constants used in the developed model are listed in the Table 5.3, e.g. the size of the
experimental rig, particle size and hole size.
6.4 Results and Discussions
The purpose of this section is compare tungsten micro-particle with stainless steel
micro-particles for the microneedle assisted micro-particle delivery based on the analysis of
the passage percentage and the penetration depth inside target. The maximum penetration
depth of micro-particles is analysed in relation to the operating pressure (see section 6.4.2.1)
and microneedle length (see section 6.4.2.2). In addition, a theoretical model is used to
analyse the penetration depth in relation to above two parameters to compare tungsten particle
with stainless steel micro-particle and then to further understand the particle density effect on
micro-particle penetration.
6.4.1 Analysis of passage percentage
In a previous study, stainless steel micro-particles is shown to yield a higher passage
percentage and a good quality size distribution of separated micro-particles if 40 mg/ml PVP
(binder) concentration and a mesh with pore size of 178 μm are used. Here, the pellets of
tungsten micro-particles are operated at the same conditions as the previous study of the
stainless steel micro-particles and to make a comparison of the passage percentage between
those two micro-particles. The passage percentage is analysed in relation to the operating
pressure which is varied from 2.4 to 4.5 bar. As shown in Figure 6.4, the passage percentage
is increased due to an increase in the operating pressures for each micro-particle. This is

135
because the pellets gain more momentum at higher operating pressures, which in turn also
causes the separated particles to gain more momentum while passing through the mesh. In the
Chapter 3, we have indicated that the passage percentage of stainless steel micro-particles
reaches a maximum due to some particles sticking to the mesh and some rebounding, hence
not passing into the test tube (particle collector). As expected, the tungsten micro-particles
show a similar performance to stainless steel. Figure 6.4 shows the passage percentage of
tungsten micro-particles is less significant than stainless steel micro-particles. It might be the
size of the tungsten particles is too small, which causes the velocity of the separated particles
to decrease faster after passage through the mesh and travel in air and stick on the mesh or the
gap between mesh and target except the agglomerates.
Figure 6.4: The effect of operating pressure on the passage percentage of the pellet separation.
Each curve in the figure is generated from three repeats of experiments. (Mesh pore size:
178μm, PVP concentration: 40 mg/ml)
6.4.2 Experimental analysis of the penetration depth of micro-particles
6.4.2.1 Effect of the operating pressure
The operating pressure is shown to be a key variable on the penetration depth of stainless
steel micro-particles of 18 and 30 μm average diameters by us in Chapter 4. In this case, we
aim to investigate the difference of the penetration depth between the larger stainless steel
micro-particle and smaller tungsten micro-particles at various pressures. The tungsten
micro-particles cannot penetrate into the skin mimicking concentration of agarose gel. This is
because the momentum of the particles is insufficient to breach the surface of the gel. In the
experiment, the operating pressures are only kept between 3 to 5 bar which are low for the
0
10
20
30
40
50
60
70
80
2.0 2.5 3.0 3.5 4.0 4.5 5.0
Pa
ssaa
ge p
erce
nta
ge
(%)
Pressure (bar)
Spherical stainless steel micro-particles(18 μm diameter)
Irregular stainless steel micro-particles(30 μm diameter)
Tungsten micro-particles (1 μm diameter)

136
small particles to achieve velocity to breach the target. It requires a higher pressure for the
small particles to achieve sufficient momentum to penetrate further into the target. In
addition, a comparison between tungsten and stainless steel micro-particles is shown in Figure
6.5. As can be seen, irregular and spherical stainless steel particles of 30 and 18 μm average
diameters achieve good penetration depths inside the skin mimicking agarose gel. Although
the density of the stainless steel is lower than tungsten, larger diameters of stainless steel
micro-particles increase their masses which lead to increased momentum of the
micro-particles so as to penetrate further in the target (skin mimicking agarose gel). The two
micro-particles show that the penetration depths increase due to an increase in the particle
size.
To further understand the effect of the particle density and size on the penetration depth in the
target, the theoretical model is used to analyse the penetration of above two materials of
micro-particles in a same target, which is discussed in the section 6.4.3.2.
Figure 6.5: The effect of the operating pressure on the penetration depth of different type of
particles (Mesh: 178 μm of pore size: Dash line: Particle penetration without using MN; Solid
line: Particle Penetration with MN) Each curve in the figure is generated from three repeats of
experiments.
0
200
400
600
800
1000
1200
1400
1600
2.5 3 3.5 4 4.5 5 5.5
Pen
etra
tio
n d
epth
(μm
)
Pressure (bar)
Inrregular stainless steel particle - 30 µm
Spherical stainless steel particle - 10 µm
Irregular stainless steel particle - 30 µm(without needle)
Spherical stainless steel particle - 18 µm(without needle)
Tungsten particle - 1 µm

137
When the MNs are inserted into the skin, it is creates holes which remain there after their
removal. The micro-particles can be delivered through these holes, thus compensating for the
insufficient momentum. As presented in Figure 6.5 the penetration depth of the tungsten
particles is greater inside the agarose gel when Adminpatch MN 1500 is used. This is because
a number of particles can penetrate through the pierced holes. However, the maximum
penetration depth of the micro-particles is varied while the pressure increases from 3 to 5 bar.
In a previous work (section 4.4.2), the result of the MN insertion in an agarose gel has shown
that the length of the pierced holes is unable to maintain constantly, which varies the
maximum penetration depth of the micro-particles inside the target. Thus, the variation in the
length of the pierced holes directly affects the penetration depth of the micro-particles. It
means that the holes length is a major factor to maximize the penetration depth in the MN
assisted micro-particle delivery. The MN length effect on the micro-particle penetration depth
is discussed in the section 6.4.2.2 in detail. Figure 6.5 also shows that the penetration depths
of those two stainless steel micro-particles are more than the tungsten micro-particles. It
indicates that an increased momentum due to increase in particle size/operating pressure of
micro-particles affect the penetration depth in the MN assisted micro-particle delivery.
6.4.2.2 Effect of the microneedle length
In previous work (Chapter 4), three different lengths of MNs have used to study the
maximum penetration depth differences of stainless steel micro-particles of 18 and 30 μm
diameters in a skin mimicking agarose gel. The characterizations of those three MNs are
presented in Table 4.1. To further determine the effect of MN length on the penetration depth
of small and dense micro-particles, those three MNs are used in this case. Figures 6.6a-b
show the penetration of the tungsten micro-particles in the skin mimicking agarose gel based
on the assistance of Adminptach MN 1500 and the in-house fabricated MN 750, respectively.
As can be seen, the maximum penetration depth of micro-particles after using Adminptach
MN 1500 is more than in-house fabricated MN 750, but the number of micro-particles
entering the pierced holes is less obvious. This is because a long needle increases the length
of pierced holes in the agarose gel, which maximizes the penetration depth of micro-particles.
In addition, the diameter of the in-house fabricated MN is greater than the thickness of the
Adminptach MN 1500 microneedle (see Table 4.1), which creates wider holes to provide the
convenience for particle penetration. It indicates that a desired penetration depth and amount
of micro-particles can be controlled by changing the MN length and width for further
research.

138
(a) (b)
Figure 6.6: The penetration of tungsten micro-particles in the skin mimicking agarose gel
based on the assistance of MNs (a) Adminpatch MN 1500 (b) In-house fabricated MN 750
Previouly, we have fired spherical and irregular stainless steel micro-particles in the skin
mimicking agarose gel. The results show that a number of micro-particles penetrated further
through the pierced holes (see Figure 4.9). It presents the same effect with the tungsten
micro-particles. From Figure 4.9, we have also indicated that the amount of micro-particle in
the pierced holes decreases from an increase in particle size. This is because of the hole is
reformed after the removal of the MN, reduced the opening area of the hole on the top gel
surface and further to affect the micro-particle penetration. In addition, the thickness of the
hole is only 78 μm after the removal of Adminpatch MN 1500. It limits the amount of the
micro-particles to penetrate into the holes, especially to the large size of irregular stainless
steel micro-particles. Thus, the amount of the stainless steel micro-particles that penetrates
into the pierced holes is less than tungsten micro-particles if compared with the result in
Figure 6.6. However, the maximum penetration depth of each micro-particle is close but
related to length of the pierced holes.
The maximum penetration depths of tungsten micro-particles show significant differences
between each MN array as shown in Figure 6.7. It increases from an increase in MN length.
As expected, a longer MN increases the length of the pieced holes and thereby increases the
maximum penetration depth of micro-particles. However, the maximum penetration depth is
varied at different operating pressure. This is because the length of the pierced holes is varied
after the removal of the MN array. The above results show the advantage of MN assisted

139
micro-particle delivery which provides a positive effect on the particle penetration even if the
momentum of the particle is insufficient to breach the target.
Figure 6.7: The maximum penetration depth of tungsten micro-particles in the skin mimicking
based on the assistance of MNs. (mesh pore size: 178 μm) Each curve in the figure is
generated from three repeats of experiments.
6.4.3 Modelling the penetration of micro-particles in skin
Firstly, this section aims to understand the microneedle assisted micro-particle delivery based
on the modelling of the trajectory of tungsten micro-particles in the deceleration stage. It is
worth to mention that the tungsten micro-particle and stainless steel micro-particle may vary
in shape and size which may affect results in reality. However, the both the stainless steel and
tungsten micro-particles are assumed to be spherical with uniform size (average diameter) in
the model. The maximum penetration depth is analysed in relation to the operating pressure,
microneedle length, particle size and density to further understand the difference between
tungsten and stainless steel micro-particles for the microneedle assisted micro-particle
delivery. Finally, a further analysis of the effect of each resistive force on the maximum
penetration depth of micro-particles is discussed to verify the main factor which minimizes
the penetration depth.
6.4.3.1 Modelling for the delivery of tungsten micro-particles
Figure 6.8a shows the trajectories of increased diameter of tungsten micro-particles in the
deceleration stage. The initial positions of the micro-particles are randomly selected at the
beginning to mimic the separation of the pellet of tungsten micro-particles. In this case, we
0
200
400
600
800
1000
1200
1400
2.5 3 3.5 4 4.5 5 5.5 6 6.5
Pen
etra
tio
n d
epth
(µm
)
Pressure (bar)
Adminpatch MN 1500μm Adminpatch MN 1200μm In-house fabricated needle 750μm

140
assumed that a number of tungsten micro-particles are stuck together where the
micro-particles are spherical in shape and each micro-particle has diameter of 3 μm after the
separation stage (mesh). The trajectory is considered to be linear. The velocity decrease is
represented by the colour change of the trajectory which corresponds to the colour bar in the
figure. The velocity decreases slowly from approximately 135 to 110 m/s from the mesh to
the target. Figure 6.8a shows that a number of the micro-particles achieve further penetration
depths via the pierced holes. The figure presents the similar performance of the developed
model with experimental results. The detailed penetration process of tungsten micro-particles
in the skin are shown in Figures 6.8b-c. Figure 6.9b shows the penetration of tungsten
micro-particles in the top skin layer of stratum corneum at 5 bar operating pressure. As can be
seen, the particle velocity deceases very fast in the stratum corneum due to an increased
resistance; the penetration depth is approximately 0.7 μm which could be ignored. Some
particles are delivered through the pierced holes and then penetrate into the epidermis/dermis
layer of the skin (side surface of the pierced holes), as shown in Figure 6.8c. It shows that the
variation of the velocity is changed slightly in the pieced holes and decreased fast after
penetrating the skin. It shows a similar performance as the penetration in the stratum corneum
due to an increased resistance. Based on the above figures the penetration depth of tungsten
micro-particles is negligible in the skin, which matches well with the experimental results.
(a)
-0.01 -0.005 0 0.005 0.010
2
4
6
8
x 10-3
Radial position (m)
Axia
l p
ositio
n (
m)
Micro-particle trajectories
0
20
40
60
80
100
120
140
160
180
Fig. 6.9c
Fig. 6.9b
Fig. 6.9d
Dermis layer of skinPierced holes
Rebound event

141
(b)
(c)
Figure 6.8: The trajectories of the tungsten micro-particles in the deceleration stage: (a). The
overall view of the micro-particle trajectories (b).The particle penetration at the area without
needle hole (c).The view of the micro-particle penetrate through the needle hole (pressure: 5
bar)
6.4.3.2 The effect of the operating pressure and particle size on the penetration depth
In the experimental results, the operating pressure only presents a slight effect on the
penetration depth of the tungsten micro-particle without using MN. The pressures are varied
from 3 to 5 bar, which are too low for small micro-particles when compared with previous
gene gun research (Arora et al., 2008; Giudice et al., 2006; Kendal et al., 2004; Mitchell et
al., 2003). In order to further understand the effect of the operating pressures on the
penetration depth of this tungsten micro-particle, the penetration depth is analysed at various
operating pressures which range from 3 to 60 bar in the model. As presented in Figure 6.9 the
penetration depth of the tungsten particle is increased from 0.04 to 0.28 μm without using
-3.8926 -3.8925 -3.8924 -3.8923 -3.8922 -3.8921 -3.892
x 10-3
4.9997
4.9998
4.9999
5
5.0001
5.0002
5.0003
5.0004
x 10-3
Radial position (m)
Axia
l positio
n (
m)
Micro-particle trajectories
0
20
40
60
80
100
120
140
160
180
SC layer of skin
Gap between mesh and skin
3.939 3.9392 3.9394 3.9396 3.9398 3.94
x 10-3
5.046
5.0461
5.0462
5.0463
5.0464
5.0465x 10
-3
Radial position (m)
Axia
l positio
n (
m)
Micro-particle trajectories
0
20
40
60
80
100
120
140
160
180
Pierced hole
VE layer of skin
142
MNs while the pressure varies from 3 to 60 bar. The penetration depth is negligible. It
illustrates that the tungsten particle of 3 μm diameter are too small for penetration even if the
operating pressure increases to a great value. Figure 6.9 also shows the tungsten particle
achieves a great penetration depth after using MNs. However, the penetration depth is
increased slightly from an increase in operating pressure.
Figure 6.9: The effect of the operating pressure on the penetration of tungsten particle
To further understand the effect of particle size and density on the penetration depth, the
particle is assumed to be spherical in shape with uniform size and the particle diameter is
varied from 3 to 100 μm for both stainless steel and tungsten micro-particles using the
presented model. As presented in Figure 6.10 the penetration depth of tungsten
micro-particles increases from 0.07 to 65.61 μm in the skin without using MNs and from
1149.07 to 1214.61μm using Adminpatch MN 1500 at 5 bar pressure. It shows more
penetration depth than stainless steel which only penetrates 0.02 to 17.36 μm in the skin and
1149.02 to 1170.5 μm using a same MN as tungsten while the particle diameter ranges from 3
to 100 μm. This comparison directly shows the advantage of dense particles on the
penetration in the target for gene gun systems.
1145
1145.5
1146
1146.5
1147
1147.5
1148
1148.5
1149
1149.5
1150
0
0.05
0.1
0.15
0.2
0.25
0.3
0.35
0.4
0.45
0.5
0 10 20 30 40 50 60 70
Pen
etra
tio
n d
epth
wit
h h
ole
(µ
m)
Pen
etra
tio
n d
epth
(µ
m)
Pressure (bar)
Penetration without hole - 3 µm
Penetration with hole - 3 μm (secondary axis)

143
Figure 6.10: The effect of the tungsten particle size on the penetration depth (operating
pressure: 5 bar)
Figure 6.11: A comparison of penetration depth between model and experimental results
(particle type: tungsten micro-particle of 3 μm diameter). The experimental results in the
figure are generated from three repeats of experiments.
A comparison of the penetration depth of the tungsten micro-particles (3 μm) between model
and experimental results is shown in Figure 6.11. It is worth to mention that the difference
between experiment and modelling may be due to the assumption that the particle shape of
1100
1120
1140
1160
1180
1200
1220
1240
0
10
20
30
40
50
60
70
80
90
0 20 40 60 80 100 120
Pen
etra
tio
n d
epth
wit
h h
ole
(µ
m)
Pen
etra
tio
n d
epth
(µm
)
Particle diameter (µm)
Penetration without hole - tungsten Penetration without hole - stainless steel
Penetration with hole - tungsten Penetration with hole - stainless steel
0
200
400
600
800
1000
1200
1400
0
0.01
0.02
0.03
0.04
0.05
0.06
0.07
0.08
0.09
0.1
2.5 3 3.5 4 4.5 5 5.5
Pe
ne
trat
ion
de
pth
wit
h h
ole
(µ
m)
Pe
ne
trat
ion
de
pth
(μm
)
Pressure (bar)
Penetration without needle hole - model result
Penetration through needle hole - model result
Penetration through needle hole - experimental result

144
the tungsten particle is regular after the separation stage in the model. As can be seen, the
tungsten particle penetrates less than 0.1 μm without using MN for the model result. It
matches well with the experimental results which show the tungsten micro-particles cannot
penetrate into the skin mimicking agarose gel. However, this condition can be made up by
using MNs. As presented in Figure 6.11 the tungsten micro-particles reaches a further depth
using Adminpatch MN 1500, but the maximum penetration depths are varied at pressure
ranges from 3 to 5 bar. This is because it is not possible to ensure that the length of the
pierced holes is constant each time using the same MN. As expected, the model results match
well with the experimental results. In conclusion, the maximum penetration depth of tungsten
micro-particles is directly related to the length of the pierced holes, and the operating pressure
only presents a slight effect on the penetration depth in this case. To further understand the
effect of pierced holes on the penetration depth of tungsten micro-particles, three different
lengths of MNs (see Table 4.1) have used and discussed in the following section.
6.4.3.3 The effect of the microneedle length
Figure 6.12: The effect of the microneedle length on the maximum penetration depth of the
tungsten particle (operating pressure: 5 bar; particle type: tungsten micro-particle of 3 μm
diameter). The experimental results in the figure are generated from three repeats of
experiments.
0
200
400
600
800
1000
1200
1400
2.5 3 3.5 4 4.5 5 5.5
Pe
ne
trat
ion
de
pth
(µ
m)
Pressure (bar) Model result Experimental result
Adminpatch MN 1500 µm Adminpatch MN 1500 µmAdminpatch MN 1200 µm Adminpatch MN 1200 µmIn-house fabricated MN 750 µm In-house fabricated MN 750 µm

145
In the real experiments, some tungsten micro-particles may be agglomerate after the
separation stage. However, any effects of the particle agglomeration on the model results are
not accounted for directly at this moment. This may be the reason why there are some
differences between the experimental and modelling results; however, all comparison have
produced reasonable match between the experimental and modelling results. In section 4.4.3.3,
the experimental results have shown that the length of pierced holes has a greater effect on the
maximum penetration of stainless steel particles, which is related to the MN length. As
expected, it agrees with the results of tungsten micro-particles show in the Figure 6.12. As
can be seen, the maximum penetration depth of tungsten micro-particles seems to be
increased with an increase in the MN length. In principle, the length of pierced holes is
directly related to the MN length which maximizes its length. An increased length of the
pieced holes allows a number of micro-particles which deliver into the holes to penetrate
further inside the target and maximizes the penetration depth. As expected, the experiment
results are varied for each application of MNs due to difficulties maintaining a constant hole
length. However, the model results match well with the experimental results, which illustrate
the applicability of the model for MN assisted micro-particle delivery.
6.4.3.4 Dependence of particle penetration depth to particle size and density in relation
to the resistive forces in the dermis layer of the human skin
The skin properties vary with one person to another, e.g., the gender, age, race and the various
anatomical areas of the body of the same person (Xu et al., 2007; Vexler et al., 1999). As
discussed earlier, the penetration depth of micro-particles is related to the yield force (Fy), a
frictional resistive force (Ff) and a resistive inertial force of target material (Fi) which
decelerate the high-speed micro-particles inside the target (see equation 5.15). However, the
yield force depends on the yield stress of the target (see equation 5.18). Further, the resistive
inertial force is related to the friction coefficient between particle and target (equation 5.16)
and the frictional resistive force depends on the density of the target material (equation 5.17).
In view of these inter-dependencies which in turn affect the micro-particle delivery, this
section aims to analyse the effects of each force on the penetration depth of micro-particle to
further investigate the major factor which presents a greater effect on the penetration depth.
For the MN assisted micro-particle delivery, the main point is the maximum penetration depth
of the micro-particle in the skin. As discussed already, a number of the micro-particles
penetrate through the holes made by the MNs to the dermis layer of the skin. In order to

146
investigate the effect of each force on the maximum penetration depth of micro-particle, we
assume that the micro-particles penetrate into the dermis layer at the tip area of the hole to
obtain the maximum penetration depth of micro-particles. In addition, we kept one of those
three resistive forces as constant and ignored the other two forces to analyse the variation of
the penetration depth in the model. As shown in Figure 6.13, stainless steel micro-particle
penetrated further than the tungsten particle due to the difference in particle size. Figure 6.13
also shows that the frictional resistive force provided a minimum effect on the micro-particle
penetration. The effect of the yield force on the penetration depth is greater than the frictional
resistive force. However, the major factor is the resistive inertial force which causes the
penetration depth of micro-particles is almost negligible if the hole length (1149 μm) is
subtracted.
Figure 6.13: The effect of each resistive force on the maximum penetration depth of
micro-particles (stainless steel particle: 18 μm diameter; tungsten particle: 3 μm diameter;
Hole length: 1149 μm)
As discussed earlier, the resistive inertial force is a major component that determines the
penetration depth of micro-particles for the gene gun based micro-particle delivery. Friction
coefficient between particle and target directly affects the resistive inertial force. In order to
further understand the effect of the resistive inertial force on the particle maximum
penetration depth, the theoretical model is used to simulate the effect of varying the friction
coefficient between particle and dermis layer from 5 to 19.6 MPa where we kept the yield
1000
1100
1200
1300
1400
1500
1600
1700
1800
2.5 3 3.5 4 4.5 5 5.5
Max
imu
m p
enet
rati
on
dep
th (
μm
)
Operating pressure (bar)
Tungsten particle - kept yield force
Stainless steel particle - kept yield force
Tungsten particle - kept resistive inertial force
Stainless steel particle - kept resistive inertial force
Tungsten particle - kept frictional resistive force

147
stress and density (see Table 5.2) and the hole length constant and operated the system at 5
bar operating pressure. As presented in Figure 6.14, the maximum penetration depth
decreased from an increase in friction coefficient between particle and dermis layer. This is
because an increased resistive inertial force slows down the particle velocity rapidly. Figure
6.14 also shows that the effect of a decreased friction coefficient between particle and dermis
layer on the maximum penetration depth is increased from an increase in particle size and
density due to an increased momentum. The maximum penetration depth of small
micro-particle (tungsten particle of 3 μm diameter) is kept to approximately a constant when
the friction coefficient between particle and dermis layers is changed.
Figure 6.14: The effect of the friction coefficient between particle and dermis layer on the
maximum penetration depth of micro-particles (operating pressure: 5 bar; hole length: 1149
μm)
6.4.3.5 Further Discussions
A comparison between stainless steel and tungsten micro-particles on the penetration depth in
the skin mimicking agarose gel has been made in this study. Tungsten micro-particles are
unable to penetrate the skin mimicking agarose gel / skin without using MN in the
experimental result, which is different from the results of stainless steel micro-particles. The
reason is that the diameter of tungsten micro-particles is less than 1 μm which is too small
when compared with the stainless steel micro-particles of 18 and 30 μm diameters. As a result
the momentum of the tungsten micro-particles is too low to allow the particles to breach the
1145
1150
1155
1160
1165
1170
0 5 10 15 20 25
Max
imu
m p
enet
rati
on
dep
th (
μm
)
Friction coefficient between particle and dermis layer (Pa·s)
Tungsten particle - 3μm diameter Stainless steel particle - 18μm diameter
Tungsten particle - 18μm diameter Stainless steel particle - 30μm diameter
Tungsten particle - 30μm diameter

148
gel surface. In section 3.4.1.1, the velocity of ground slide is measured which only reaches
around 122 m/s at 5 bar pressure, using a photoelectric sensor, which means that the particle
velocity is less due to the energy loss. This velocity is less than some previous studies for
gold particles, e.g. Kendal (2001) has investigated that 1 ± 0.2 μm diameter of gold particles
can reach a velocity of 580 ± 50 m/s at 40 bar pressure using a contoured shock tube (CST).
The ground slide presents a significant negative effect on the particle velocity, but it has
safety advantage which prevents the pressurized gas from impacting the human body. Thus,
the operating pressure is mimicked from 3 to 60 bar to study the penetration differences of
tungsten micro-particles after increases the momentum in the theoretical model. However,
these tungsten micro-particles still cannot achieve the expected penetration depth. It indicates
that a ground slide based gene gun system is not useful for the intercellular route because
micro-particles cannot reach velocities high enough to breach the skin. Increasing the particle
size will increase the moment but cause damage to the surface of the skin. As a result the
extracellular route is the expected solution for normally ground slide based gene gun system.
However, the use of MN meets the purpose of an intercellular route to deliver micro-particle
to a greater penetration depth in the skin using a ground slide based gene gun system.
Previously, The experimental results have shown that the penetration depth of stainless steel
micro-particles is increased while using a MN (see section 4.4.3). In this case, the tungsten
micro-particles are investigate using modelling and experiments with MN assisted
micro-particle delivery. As expected, both model and experimental results show that the use
of MN maximizes the penetration depth of tungsten micro-particles. However, the maximum
penetration depth of micro-particles depends on the length of pierced holes which is created
by MNs. The maximum penetration of tungsten micro-particles reaches around 1149 μm
using Adminpatch 1500 MM, which never reach for other relevant gene gun system. For
example, Kendal (2001) has indicated that gold particles of 1 ± 0.2 μm diameters can
penetrate 66 μm in the skin at velocity of 580 ± 50 m/s using a contoured shock tube (CST).
Kendal et al. (2004) have also used a convergent-divergent device to accelerate 1.8 μm
diameter gold particles which achieves a maximum penetration depth of 78.6 μm at 60 bar.
Mitchell et al. (2003) has shown that gold particles of 1-3 μm diameters can reach a
maximum depth of around 60 μm in canine tissue at a velocity of 550±50 m/s. It is concluded
that the diameters of gold particles ranges from 1 to 3 only can penetrates to a depth from 60
to 78.6 μm (epidermis layer) which is less than the maximum penetration depth of the
tungsten particles after using MNs. It shows that the improvement of the penetration depth

149
using MN assisted micro-particle delivery, which achieves depths never reached before. In
conclusion, the results show that the intercellular route is feasible for the MN assisted
micro-particle delivery. In theory, it is the preferred route for MN assisted micro-particle
delivery due to the cell damage is minimized from a decrease in particle size (O’Brien, 2011),
although extracellular route presents more penetration depth. It could be proved by firing the
above stainless steel/tungsten micro-particles into cell cultured skin mimicking agarose gel to
analyse the cell damage in the further work.
6.5 Chapter Summary
This study shows an effective method for relating the use of MNs to create holes on the target
for micro-particle delivery to improve the penetration depth of micro-particles. The
experimental rig considers possible changes in the operating pressure to analyse the
penetration depth and passage percentage of tungsten and stainless steel micro-particles.
Results show that the passage percentage increases due to an increase in operating pressure
until a maximum value. Tungsten micro-particles used in this study present a lower passage
percentage than stainless steel due to an insufficient momentum to reach the target (particle
collector). In addition, tungsten micro-particles are stopped by the skin mimicking agarose gel
even if the operating pressure is increased. But an increased operating pressure improves the
penetration of stainless steel particle without using MNs. This is because the diameter of
tungsten micro-particles is small (< 1 μm). To further understand the particle size and density
effect on the penetration depth, a theoretical model is used to mimic the operating pressure
ranges from 3 to 60 bar to accelerate tungsten and stainless steel micro-particles while the
diameter ranges from 3 to 100 μm. The results show a great improvement in the penetration
depth of tungsten micro-particles which is more than stainless steel micro-particles. However,
both model and experimental results show that a use of MNs provides an improvement on the
penetration although the momentum is insufficient to breach the skin. The maximum
penetration depth of micro-particles up to dermis layer has not been reached before. It is
related to length of MNs which determine the length of pierced holes. As expected, model
results matches well with the experimental results, which illustrates the applicability of the
model for the MN assisted micro-particle delivery. MN assisted micro-particle delivery
improves safety because an intercellular route can be chosen to reduce the damage from
particle impact and the pressurized gas is prevented by the ground slide. In addition, it also
enhances the penetration depth of micro-particles properly if compared with any other gene
gun systems. An increased penetration depth allows deeper tissue to be transfected, which

150
provides more effective gene transfection in the target. Future work could be to attach the
genes on the micro-particles, fired into the cells using MN assisted micro-particle delivery
and then analyse the DNA profile of the cells to verify the advantage of MN assisted
micro-particle delivery.

151
7. Conclusions and Further works
7.1 Conclusions
Gene gun systems are advanced and flexible devices for the researches of genetic
engineering, molecular biology and gene therapy, which can be operated in various operating
pressures and particle properties (e.g. size, density). They could be used to vary the particle
velocity and penetration depth to achieve the purpose of DNA transfection in the desired area
of target (e.g. skin, plants). This offers the advantage of delivering genes to the target cells
through varying the operating pressure or particle properties. However, cell death is inevitable
because of the impaction of the pressurized gas and micro-particles on the tissue. In this
study, a new concept which combines microneedle (MN) with gene gun system for
micro-particle delivery, namely, MN assisted micro-particle delivery, is pointed out. It is
expected to reduce the cell damage and enhance the penetration depth in the target. The
developed conceptual system uses a ground slide to prevent the pressurized gas and slow
down the velocity of micro-particles to reduce the impact force on the target to achieve the
purpose of cell damage reduction. An improvement is proposed by using an array of MNs to
overcome the target barrier to allow a number of micro-particles penetrating further through
needle holes to let deeper tissue to be transfected.
To confirm the proposition of MN assisted micro-particle delivery, an experimental rig is
designed, which consists of three stages, namely, particle acceleration, separation and
deceleration stages. Well-defined experiments are conducted to determine the practicability of
the concept for each stage. For the first stage, the velocity of the ground slide is analysed in
relation to the material, barrel diameter and operating pressure. The results show that
micro-particle velocity is increased from a decrease in material density and barrel diameter
and an increase in operating pressure. It indicates that the velocities of the particles are
definitely slower than other gene gun systems (e.g. contoured shock tube (CST), PowderJect).
In addition, the pressurized gas is almost prevented by the ground slide in the experiments.
These results suggest that cell damage is possibly reduced using this system. Certainly, it
would require one to use the method of MN assisted micro-particle delivery to deliver genes
coated micro-particles into cells to confirm the conditions of the gene expression and cell
damage in the further work.
For the separation stage, the work shows that it is possible to compress the micro-particles
into a cylindrical pellet using an in house pellet press for the purpose of facilitated loading it

152
in the ground slide. Various concentrations of binder (PVP) can be used to form different
strengths of pellets and fire them at various pressures to obtain different passage percentage.
The work also confirms that it is possible tp optimize binder concentration for MN assisted
micro-particle delivery.
In the work various pore sizes of meshes are used to separate the pellets in the experiment.
Results show that the passage percentage is increased from an increase in operating pressure
and mesh pore size and a decrease in binder concentration. However, large agglomerates are
not desirable because of it may cause significant damage to the target tissue.
The results in this work show that the size of separated particles is controllable using various
pore sizes of meshes. Larger pore size of mesh allows large agglomerates to pass through
with higher pellet passage percentage. A decrease in mesh pore size blocks the agglomerates
but decrease the passage percentage. In addition, higher binder concentration enhances a
number of agglomerates. Based on the consideration of the passage percentage and the size
distribution of separated particles, pellets bound with 40 mg/ml PVP yielded a higher passage
percentage and a good control on the size distribution of separated particle based on the
application of 178 μm pore size mesh. Therefore, 40 mg/ml binder concentration and mesh of
178 μm pore size are considered to our following works.
For the deceleration stage, a skin mimicking agarose gel (0.0265 g/ml) is used as a target
instead of the human skin in the experiment. Three different lengths of solid MNs are used to
study the MN assisted micro-particle delivery. In the early stage, stainless steel of 18 and 30
μm average diameters are analysed to confirm the feasibility of MN assisted micro-particle
delivery. The penetration depths of micro-particles in the skin mimicking agarose gel are
analysed in relation to the operating pressure, mesh pore size, particle size and MN length.
Results show that the penetration depths of micro-particles increase from an increase of the
above four variables. In particular, the MN length is shown to be a dominant variable which
maximizes the penetration depth of the micro-particles. However, large pore size of mesh is
not accepted because of a significant damage presents on the target because of the
agglomerates, but the pellet is almost separated into individual particles and penetrated into
the gel without showing damages when a small pore size of mesh is used. The pierced holes
created by MNs have been found to allow a number of micro-particles penetrating further in
the target. It indicates that the MN assisted micro-particle delivery is useful where the damage

153
of the target from the gas/particles is reduced and a number of micro-particles reach the
desired depth more easily.
To further understand the MN assisted micro-particle delivery, a mathematical model is built
on the basis of the experimental rig. The equations are implemented into MATLAB using ode
function, which mimic the operation processes of acceleration, separation and deceleration
stages of the rig. As expected, model results of the ground slide veolcity match perfectly with
the experimental results. In addition, the trajectories of micro-particles in the deceleration
stage are simulated from a random selection of the initial position and moving direction after
the separation stage, and the velocity variation of micro-particles is defined by using
colormap function in the model. An event program is implemented into the model to define
the impact points and final positions of micro-particles in the deceleration stage. The model
mimics the deceleration stage to predict the linear trajectories of micro-particles to determine
the distribution of the micro-particles in the three layers of skin. As expected, model results
show increasing the operating pressure, particle size and hole length would increase the
penetration depth of the micro-particle inside skin, which matched well with the experimental
results for the penetration depth of micro-particles.
Finally, tungsten micro-particle of 0.5 μm average diameter is analysed to compare with
stainless steel micro-particles. Results show that the passage percentage increases from an
increase in operating pressure until reaches a maximum value, but tungsten micro-particles
present a lower passage percentage than stainless steel due to its momentum is insufficient to
reach the target (particle collector). In addition, tungsten micro-particles are fired into skin
mimicking agarose gel at various pressures. Results show that tungsten micro-particles are
unable to penetrate into the skin mimicking agarose gel without using MNs, but great
amounts of micro-particles are penetrated through the pierced holes to reach an enhanced
penetration depth inside the gel. Additionally, the mathematical model simulates the
penetration of the tungsten micro-particles in the skin, which also results those micro-particles
cannot penetrate into the skin but reach a further depth inside skin via the holes. As expected,
model results matches well with the experimental results, which illustrates the applicability of
the model for the MN assisted micro-particle delivery.
In conclusion, MN assisted micro-particle delivery is a safe method which promises much to
deliver gene loaded micro-particles into cells with less tissue damage because of the
154
pressurized gas is prevented and the velocity of micro-particles is deceased. Especially,
tungsten particles of 0.5 μm diameter can deliver to a further penetration depth in the skin
mimicking agarose gel based on this method, which can predict the practicability of this new
concept for micro-particle delivery. In addition, the maximum penetration depth of
micro-particles is enhanced properly if compare with any other gene gun systems (e.g. CST,
Helios gene gun), which allows deeper tissue to be transfected to provide more effectively
gene expression in the target. In the furfure work, genes will be attached on the
micro-particles which are fired into the cultured cells to analyse the DNA profile to verify the
reduction of cell damage. The detailed work proposal is discussed in the following section of
further works.
7.2 Further works
This research points out a new concept of microneedle (MN) assisted micro-particle delivery
for gene gun systems. A set of well-defined experiments has been processed to show that the
use of ground slide prevents the pressureized gas to impact on target and slows down the
velocity of micro-particles, which aims to reduce the cell damage. The use of MNs can
enhance the penetration depth of micro-particles, which allows deeper tissue to be transfected
if DNA is attached to the micro-particles. Thus, further studies could fire DNA (e.g. plasmid)
coated micro-particles into the cultured cells to explore the DNA transfection and cell
damages to verify the advantage of MN assisted micro-particle delivery. Therefore, an
effective method for cell culture and DNA coating on the micro-particles are necessary to
consider.
Several studies have shown the preparation of DNA coated golden micro-particles for Helios
gene guns (O’Brien and Lummis, 2011; Svarovsky et al., 2008; O’Brien and Lummis, 2006;
Thomas et al., 2001). Two chemical, namely, spermidine and calcium chloride, are required
to coat DNA on micro-particles. Spermidine can wrap the DNA to form a protective layer
(Mertens et al., 2011). Calcium chloride (CaCl2) would play the function like a binder to stick
DNA onto the micro-particles (Hall, 1990). Thomas et al. (2001) have introduced the detailed
procedure to prepare DNA coated micro-particles as: micro-particles require washing by 100%
ethanol about three times to remove the impurities, and then DNA, spermindine and calcium
chloride are added and vortexed vigorously to make sure that DNA are even distributed in the
suspension. After that, the ethanol is requires to remove to get totally dried DNA coated
micro-particles. A future work can use a similar method to coat DNA onto the micro-particles.

155
In our research, micro-particles should be compressed into a cylinder pellet. Thus, we can add
PVP solution on the dried DNA coated micro-particles and then compress into a pellet. The
detailed pellet making pressure is described in the section 3.3.3.3.
Figure 7.1: HEK-293 cells culture in agarose-medium gel (Yang et al., 2009)
Cell culture is a technology to grow cells outside the natural environment at controlled
conditions. Culture medium is firstly required to consider for the growth of cells, which can
be separated into two types are liquid and solid culture media. For liquid culture media, cells
are required to maintain at specific conditions in a cell culture media, e.g. Dulbecoo’s
Modified Eagle’s Medium (DMEM) which often used for cell maintenance (O’Brien and
Lummis, 2011; Yang et al., 2009; Napolitano et al., 2007). For example, Yang et al. (2009)
have maintained cells in the DMEM media at 37 ℃ in a humidified incubator supplied with
5% CO2. O’Brien and Lummis (2011) have maintained HEK293 cells in DMEM/F12 at 7%
CO2. Solid culture media forms by adds a certain volume of coagulant in the liquid culture
media. Agarose gel is the most common coagulant used for the solid culture media (Yang et
al., 2009; Napolitano et al., 2007). Figure 7.1 shows HEK-293 cells culture in 1 % of
agarose-medium gel. Previously, a skin mimicking agarose gel is found in our research, thus,
we can mix liquid culture media with skin mimicking concentration of agarose solution and
pour into petri dish to solidify to provide an agarose-medium gel to culture cells. A further
task of delivering DNA coated micro-particle into the skin mimicking agarose-medium gel to
analyse the DNA transfection and cell damage for MN assisted micro-particle delivery is
necessary, the results will be compared with other relevant biolistic transfection in
skin/cultured cells (e.g. CST, Helios gene gun) to prove the advantage of MN assisted
micro-particle.
However, the cell viability requires the supplements of the nutrition and moisture to cells. In
addition, Yang et al. (2009) have indicated that the cell viability is different at various

156
concentration of agarose gel. The work found 1 % agarose gel is the optimal concentration to
cover cells at room temperature for 1 to 3 days. Thus, a project of using MN assisted
micro-particle delivery method to deliver DNA coated micro-particles into different
concentrations of agarose-medium gel to obtain the optimal concentration for DNA
transfection will be considered in the further works.
As discussed in the thesis, MNs present a great effect on the maximum penetration depth of
micro-particles. The quantity of micro-particles in the pierced holes is related to the particle
size and the opening area of the pierced hole. Previously (section 4.4.3.2), The experimental
results have shown that the amount of micro-particles goes into the holes is decreased from an
increase in particle size when Adminpatch MNs (1500/1200) is used. However, the amount is
increased from an increase of the opening area of the holes which is related to the geometry of
the MNs. Generally, an increased amount improves the effect of DNA transfection on the
target area. In addition, an increase in MN number may increases the particle number goes
into the holes in theory. Thus, a task of changing the geometry (e.g. cross-section area, MN
number) of MNs is necessary to analyse the effect on the amount of micro-particles
penetration through the pierced holes if the length of MNs is fixed.
In addition, the effect of DNA transfection and cell damage requires to consider when the
amount of micro-particles goes into the target is increased. In theory, an increased particle
amount is increased the number of cells to be transfected in the target area if micro-particles
are coated with DNA (e.g. plasmid). However, a great amount of micro-particles impacts on
the target and goes into the pierced holes may cause damages on the target area due to the
some particles are penetrated closely as a large particle on the target during the penetration
process. Thus, a task of analysing the cell damage and DNA transfection varies with the
amount of DNA coated micro-particles in different locations of target area is required in the
further work.
It is worth to mention that the current system size of MN assisted micro-particle delivery is
too large and difficult to handle, which is differed with other hand-hold gene gun systems (e.g.
InjectionJet). Thus, minimize the MN assisted micro-particle delivery system is necessary for
the mass production and further to the practical application to daily life in the future. The
work can be achieved based on the theoretical model which varies the dimension of the
system to analyse the particle velocity and penetration depth whether achieve the desired

157
effect to verify the suitable size for the MN assisted micro-particle delivery system. However,
good-looking appearance and simple operation of the system design is an indispensable part
for the production in the future.

158
8. References
Ahlen G., Sallberg M., Frelin L., (2013). Methods for monitoring gene gun-induced HBV-
and HCV-specific immune responses in mouse models, Methods Mol. Biol., 940:239-267
Alexander H., Cook T., (2006). Variations with age in the mechanical properties of human
skin in vivo, J. Tissue Viability, 16(3): 6-11
Al-Qallaf B., Das D.B., Mori D., Cui Z.F., (2007). Modelling transdermal delivery of high
molecular weight drugs from microneedle systems, Philosophical Transactions of The Royal
Society A,, 365: 2951-2967, DOI: 10.1098/rsta.2007.0003.
Al-Qallaf B. and Das D.B., (2008). Optimization of square microneedle arrays for increasing
drug permeability in skin, Chemical Engineering Science, 63: 2523-2535, DOI:
10.1016/j.ces.2008.02.007.
Al-Qallaf B. and Das D.B., (2009a). Optimizing microneedle arrays for transdermal drug
delivery: Extension to non-square distribution of microneedles, Journal of Drug Targetting,
17(2), pp.108-122, DOI: 10.1080/10611860802472370.
Al-Qallaf B. and Das D.B., (2009b). Optimizing Microneedle Arrays to increase Skin
Permeability for Transdermal Drug Delivery, Annals of the New York Academy of Sciences,
1161: 83-94, DOI: 10.1111/j.1749-6632.2009.04083.x.
Al-Qallaf B., Das D.B., Davidson A., (2009a). Transdermal Drug Delivery by Coated
Microneedles: Geometry Effects on Drug Concentration in Blood, Asia-Pacific Journal of
Chemical Engineering, 4(6): 845-857, DOI: 10.1002/apj.353.
Al-Qallaf B., Mori D., Olatunji O., Das D.B., Cui Z.F., (2009b). Transdermal Drug Delivery
by Microneedles: Does Skin Metabolism Matter?, International Journal of Chemical Reactor
Engineering, 7: A69.1-A69.23.
Aravindaram K., Yang N.S., (2009). Gene gun delivery systems for cancer vaccine
approaches, Methods Mol. Biol., 542: 167-178

159
Armaleo D., Ye G.N., Klein T.M., Shark K.B., Sanford J.C., Johnston S.A., (1990). Biolistic
nuclear transformation of Saccharomyces cerevisiae and other fungi, Curr. Genet., 17: 97-103
Arora A., Hakim I., Baxter J., Rathnasingham R., Srinivasan R., Fletcher D.A., Mitragotri S.,
(2007). Needle-free delivery of macromolecules across the skin by nanoliter-volume pulsed
microjets, Proceedings of the National Academy of Sciences of the U.S.A. (PNAS), 104(11):
4255-4260
Arora A., Prausnitz M.R., Mitragotri S., (2008). Micro-scale devices for transdermal drug
delivery, Int. J. Pharm. 364:227-236
Ashraf, M.W., Tayyaba, S., Afzulpurkar, N., (2011). Micro electromechanical systems
(MEMS) based microfluidic devices for biomedical applications. Int. J. Mol Sci., 12:
3648-3704.
Badran, M. M., Kuntsche, J., Fahr, A., (2009). Skin Penetration Enhancement by a
Microneedle Device (Dermaroller®) in vitro: Dependency on Needle Size and Applied
Formulation, Pharm Sci., 36: 511- 523.
Bal S.M., Caussin J., Pavel S., Bouwstra J.A. (2008). In vivo assessment of safety of
microneedle arrays in human skin, European Journal of Pharmaceutical Sciences, 35(3):
193-202.
Bal, S.M., Kruithof, A.C., Lieb, H., Tomerius, M., Bouwstra, J., Lademann, J., Meinke, M.
(2010). In vivo visualization of MN conduits in human skin using laser scanning microscopy,
Laser Physics Letters, 7(3): 242-246.
Bastian S., Busch W., Kuhnel D., Springer A., Holke R., Scholz S., Pompe W., Gelinsky M.,
Potthoff A., Richter V., Ikonomidou C., Schirmer K., (2009). Toxicity of tungsten carbide
and cobalt-doped tungsten carbide nanoparticles in mammalian cells in vitro, Environ. Health
Perspect., 117(4): 530-536
Bellhouse B.J., Sarphie D.F., Greenford J.C., (1999). Needleless syringe using supersonic gas
flow for particle delivery, Patents No: (US5899880 A), United States Patent

160
Bellhouse B.J., Bell J., Millward H.R., Phillips M.J., Nabulsi S.M., (2003). Particle delivery,
US Patent: US 6592545 B1, United States Patent
Bellhouse B.J., Greenford J.C., Sarphie D.F., (2006). Particle delivery, Patent: EP 1637173
A2
Belyantseva I.A., (2009). Helios Gene Gun–Mediated Transfection of the Inner Ear Sensory
Epithelium, Auditory and Vestibular Research: Methods and Protocols, Chapter 7, Editor
Sokolowski B., 493:103-123
Bennett A.M., Phillpotts R.J., Perkins S.D., Jacobs S.C., Williamson E.D., (1999). “Gene gun
mediated vaccination is superior to manual delivery for immunisation with DNA vaccines
expressing protective antigens from Yersinia pestis or Venezuelan Equine Encephalitis virus”,
Vaccine, 18(7–8): 588–596.
Bio-Rad Laboratories, (2013). USA. (also see, http://www.bio-rad.com/)
Binyamin G., Shafi B.M., Mery C.M. (2006). Biomaterials: A primer for surgeons, Seminars
in Pediatric Surgery, 15(4): 276-283.
Biopex, (2013). SJ-500 Portable gene gun (also see,
http://www.biopex.com/SJ-500-Portable-gene-gun-28-10.html)
Brown M.B., Martin G.P., Jones S.A., Akomeah F.K., (2006). Dermal and transdermal drug
delivery systems: current and future prospects, Drug Delivery, 13(3): 175-187
Bryan M., Guyach S., Norris K.A., (2013). Biolistic DNA vaccination against trypanosome
infection, Methods Mol. Biol., 940: 305-315
Buchowicz J. and Krysiak C., (2003). Genotoxic effects of tungsten microparticles under
conditions of biolistic transformation in Genetic transformation of plants, Jacson J.F.,
Linskens H.F. (Ed.), Springer, New York: 175–188

161
Burkoth T.J., Bellhouse B.J., Hewson .G, Longridg eD.J., Muddle A.G., Sarphie D.F., (1999).
Transdermal and transmucosal powdered drug delivery, Crit. Rev. Drug Carrier System,
16(4): 331-84
Cao Y., Zhao B., Han Y.H., Zhang J., Li X.Z., Qiu C.H., Wu X.J., Hong Y., Ai D.Z., Lin J.J.,
Fu Z.Q., (2013). Gene gun bombardment with DNA-coated golden particles enhanced the
protective effect of a DNA vaccine based on thioredoxin glutathione reductase of Schitosoma
japonicum, Biomed. Res. Int., 2013: Article No. 952416, doi: 10.1155/2013/952416
Chabrai F., Bouris K., Jones T., Barrow D., Allender C., Hann A., Brain K., Birchall J.,
(2004). “Microfabricated silicon microneedles for nonviral cutaneous gene delivery”. British
Journal of Dermatology, 150(5): 869-877
Chen B., Wei J., Tay F.E.H., Wong Y.T., Iliescu C., (2008). Silicon microneedle array with
biodegradable tips for transdermal drug delivery, Microsystem Technologies, 14: 1015-1019
.
Chen D., Erickson C.A., Endres R.L., Periwal S.B., Chu Q., Shu C., Maa Y.F., Payne L.G.,
(2001). Adjuvantation of epidermal powder immunization, Vaccine, 19(20-22): 2908-2917
Chen D., Maa Y., Haynes J.R., (2002). Needle-free epidermal powder immunization. Expert
Rev. Vaccines, 1(3): 89-100
Chen P.C., Hsieh S.J., Chen C.C., Zou J., (2013). A three-diemsional enormous surface area
aluminium microneedle array with nanoporous structure, Journal of Nanomaterials, 2013, 6
page, doi: 10.1155/2013/164953
Christou P., Mccabe D.E., Swain W.F., (1990). Soybean genetic-engineering commercial
production of transgenic plants, Trends in biotechnology, 8: 145 -151
Chu L.Y., Choi S.O., Prausnitz M.R., (2010). Fabrication of dissolving polymer MNs for
controlled drug encapsulation and delivery: Bubble and pedestal MN designs, J Pharm. Sci.
99(10): 4228-4238

162
Cormier M., Johnson B., Ameri M., Nyam K., Libiran L., Zhang D. D., and Daddona P..
(2004). Transdermal delivery of desmopressin using a coated microneedle array patch system.
J. Control. Release, 97: 503-511
Coulman S., Allender C., Birchall J., (2006). Microneedles and other physical methods for
overcoming the stratum corneum barrier for cutaneous gene therapy, Ther. Drug Carrier
Syst., 23(3): 205-258
Crozier W.D., Hume W., (1957). High velocity light gas gun, Journal of Applied Physics,
28(8): 892-895
Da’dara A.A., Skelly P.J., Fatakdawala M., Visovatti S., Eriksson E., Harn D.A., (2002).
Comparative efficacy of the schistosoma mansoni nucleic acid vaccine, sm23, following
microseeding or gene gun delivery, Parasite Immunology, 24: 179-187
Davidson A,, Al Qallaf B,, Das D.B., (2008). Transdermal Drug Delivery by Coated
Microneedles: Geometry Effects on Effective Skin Thickness and Drug Permeability,
Chemical Engineering Research and Design, 86: 1196-1206, DOI:
10.1016/j.cherd.2008.06.002.
Davis S.P., Landis B.J., Adams Z.H., Allen, M.G., Prausnitz, M.R., (2004). Insertion of
microneedles into tissue: measurement and prediction of insertion force and needle fracture
force, Journal of Biomechanics, 37: 1155-1163
Dehn J., (1987). A Unified theory if penetration, International journal of impact engineering,
5: 239-248
Dempster A.C. Topham S.J., Johnson M.J., Hickey P.L., Longridge D.J., (2000). Comparison
of epidermal thickness to skin response in various species following systemic drug delivery
using a dermal PowderJet particle delivery system, J Pharm Pharmcol, 52: 49
Diridollou S., Black D., Lagarde J.M., Gall Y., Berson M., Vabre V., Patat F., Vaillant L.,
(2000). Sex- and site-dependent variations in the thickness and mechanical properties of
human skin in vivo, Int. J. Cosmet. Sci., 22(6): 421-435
163
Disegi J.A., Eschbach L., (2000). Stainless steel in bone surgery, Injury, 31(4): 2-6
Dominik L., Erwin G., Paul W.D., Hagen V.B., Paul M., (2010). Neuro-Muscular
Differentiation of Adult Porcine Skin Derived Stem Cell-Like Cells, PLoSONE, 5(1):
8968-8976
Donnelly R.F., Raj S.T.R., Woolfson A.D., (2010a). Micronneedle-based drug delivery
systems: microfabrication, drug delivery, and safety, Drug Deliv., 17(4): 187-207
Donnelly R.F., Garland M.J., Morrow D.I.J., Migalska K., Singh T.R.R., Majithiya R.,
Woolfson D.A., (2010b). Optical coherence tomography is a valuable tool in the study of the
effects of microneedle geometry on skin penetration characteristics and in-skin dissolution, J.
Cont. Rel., 147: 333-341.
Donnelly R.F., Majithiya R., Singh T.R.R., Morrow D.I.J., Garland M.J., Demir Y.K.,
Migalsks K., Ryan E., Gillen D., Scott C.J., Woolfsoon D.A. (2011). Design, optimization
and characterisation of polymeric MN arrays prepared by a novel laser-based micro moulding
technique. Pharm. Res., 28: 41-57.
Donnelly R.F., Garland M.J., Singh T.R.R., Migalska K., Majithiya R., McCrudden C.M.,
Kole P.L., Mahmood T.M.T., McCarthy H.O., Willfson A.D., (2012). Hydrogel-Forming
microneedle array for enhanced transdermal drug delivery, Adv. Funct. Mater., 22: 4879-4890
Duck F.A., (1990). Physical Properties of Tissue: A Comprehensive Reference Book, London:
Academic Press, Harcourt Brace Jovanovich
Eberly D., (2002). Rotation representations and performance issue, Geometric Tools, LLC
(http://www.geometrictools.com/Documentation/RotationIssues.pdf) [Accessed on 3/6/2013]
Edwards C., Marks R., (1995). Evaluation of biomechanical properties of human skin,
ClinDermatol, 13: 375-380

164
Ettinger M., Peckl S.D., Gruber C., Laimer M., Thalhamer J., Hintner H., Gratz I.K., Bauer
J.W., (2012). Transcutaneous gene gun delivery of hNC16A induces BPAG2-Specific
tolerance, Journal of Investigative Dermatology, 132(6): 1665-1671
Fuchs E.E., Raghavan S., (2002). Getting under the skin of epidermal morphogenesis, Nature
reviews. Genetics, 3: 199-209
Fuller D.H., Loudon P., Schmaljohn C., (2006). Preclinical and clinical progress of
particle-mediated DNA vaccines for infectious diseases, Methods, 40(1): 86-97
Gardeniers H.J.G.E., Luttge R., Berenschot E.J.W. de Boer M.J., Yeshurun S.Y., Hefetz M.,
van’t Oever R., van den Berg A., (2003). “Silicon Micromachined Hollow Microneedles for
Transdermal Liquid Transport”. Journal of Microelectromechanical Systems, 12(6): 855-862
Giudice E.L., Campbell J.D., (2006). Needle-free vaccine delivery, Adv.Drug Deliv. Rev. 58:
68-89
Glenn G.M., Kenney R.T., Ellingsworth L.R., Frech S.A., Hammond S.A., Zoeteweweij J.P.,
(2003). Transcutaneous immunization and immunosticmulant strategies: capitalizing on the
immunocompetence of the skin, Expert Rev., Vaccines, 2(2): 253-267
Gill, H.S., Denson, D.D., Burris, B.A., Prausnitz, M.R., (2008). Effect of Microneedle design
on pain in Human subjects, Clin. J. Pain., 24:585-594.
Gu B., Kale S.D., Wang Q.H., Wang D.H., Pan Q.N., Cao H., Meng Y.L., Kang Z.S., Tyler
B.M., Shan W.X., (2011). Rust secreted protein Ps87 is conserved in diverse fungal
pathogens and contains a RXLR-like motif sufficient for translocation into plant cells, PLoS
One., 6(11): e27217
Gupta J., Park S.S., Bondy B., Felner E.I,, Prausnitz M.R., (2011a). Infusion pressure and
pain during microneedle injection into skin of human subjects, Biomaterials, 32: 6823-6831
Gupta J., Gill H.S., Andrews S.N., Prausnitz M.R., (2011b). Kinetics of skin resealing after
insertion of microneedles in human subjects, Journal of Controlled Release, 154: 148-155

165
Hall, R.D., (1990). Plant cell culture protocols, Methods in molecular biology, Methods in
Molecular Biology, Humana Press Inc., Totowa, USA, 111: 79
Han R., Peng X., Reed C.A., Cladel N.M., Budgeon L.R., Pickel M.D., Christensen N.D.,
(2002). Gene gun-mediated intracutaneous vaccination with papillomavirus E7 gene delays
cancer development of papillomavirus-induced skin papillomas on rabbits, Cancer Detect
Prev., 26(6): 458-467
Han M., Hyun D.H., Park H.H., Lee S.S.L., Kim C.H., Kim C.G., (2007). A novel fabrication
process for out-of-plane microneedle sheets of biocompatible polymer, J. Micromech.
Microeng., 17: 1184-1191.
Han T., Das D.B., (2013). Permeability enhancement for transdermal delivery of large
molecule using low-frequency sonophoresis combined with microneedles, Journal of
Pharmaceutical Science, 102(10): 3614-3622
Han X., Wang D.K., Wang Y., (2008). “Development of Transdermal Delivery System of
Microneedles”, Chinese Journal of Pharmaceutics, 6(5): 296-300
Haq M.I., Smith E., John D.N., Kalavala M., Edwards C., Anstey A., Morrissey A., Birchall
J.C., (2009). Clinical administration of microneedles: skin puncture, pain and sensation,
Biomed. Microdevices, 11: 35-47
Hardy H.P., Quinlan N.J., Kendall M.A.F., Bellhouse B.J. (2001). Numerical study of a
prototype needle-free powdered vaccine and drug delivery system. In: ISSW 23, Austin, TX,
USA, 23-37
Hardy M.P., Kendall M.A.F., (2005). Mucosal deformation from an impinging transonic gas
jet and the ballistic impact of microparticles, Phys. Med. Biol., 50(19): 4567-4580
Heiser W.C., (1994). Gene transfer into mammalian cells by particle bombardment,
Analytical Biochemistry, 217(2): 185-196
166
Henry F., Pierard F.C., Cauwenbergh G., Pierard G.E., (1997). Age-related changes in facial
skin contours and rheology. Journal of the American Geriatrics Society, 45(2): 220-222
Henry, S., McAllister, D.V., Allen, M.G., Prausnitz, M.R. (1998a). Microfabricated
microneedles: a novel approach to transdermal drug delivery, J. Pharm. Sci., 87: 922-925.
Henry S., McAllister D.V., Allen M.G., Prausnitz M.R., (1998b). “Micromachined needles
for the transdermal delivery of drugs”, Proc. IEEE Micro Electro Mechanical Systems,
MEMS’98, Heidelberg Germany, 25(29): 494–498
Holbrook, K.A. (1994). Ultrastructure of the Epidermis: Chapter 1 of the Keratinocyte
Handbook, edited by Leigh, I.M. and Lane, E.B., Watt, F.M., Cambridge, Great Britain,
Cambridge University Press. Page: 3–39.
Holbrook, K. A., Odland, G.F. (1974). Regional Differences in the thickness (cell layers) of
the human stratum corneum: an ultrasound analysis, J Invest Dermatol., 62: 415-422.
Hou L.Y., Wang P.Y., Kong F.T., Park H., Kobiro K. and Ohama T., (2013). Mesoporous
TiO2 nanoparticles: A new material for biolistic bombardment, Phycological Research, 61:
58-60
Huang H.Y.S., Huang S., Gettys T., Prim P.M., Harrysson O.L., (2013). A biomechanical
study of directional mechanical properties of porcine skin tissue, Proceedings of the ASME
2013 International Mechanical Engineering Congress & Exposition (IMECE2013), San
Diego, California, USA, November 13-21
Huang P.H., Chen P.Y., (2011). Design of a two-stage electromagnetic impulse force circuit
for gene gun, Journal of Marine Science and Technology, 19(6): 686-692
Ikemoto K., Sakata I., Sakai T., (2012). Collision of millimetre droplets induces DNA and
protein transfection into cells, Scientific Reports, 2: Article No. 289, doi: 10.1038/srep00289
ImageJ, (2013). ImageJ (http://rsbweb.nih.gov/ij/disclaimer.html) [Accessed on 3/6/2013]

167
Joseph S.K., Sambanthamoorthy S., Dakshinamoorthy G., Munirathinam G., Ramaswamy K.,
(2012). Protective immune responses to biolistic DNA vaccination of Brugiamalayi abundant
larval transcript-2, Vaccine, 30(45): 6477-6482.
Kalluri H., Banga A.K. (2011). Formation and closure of microchannels in skin following
microporation, Pharm. Res., 28: 82-94
Kaushik S., Hord A.H., Denson D.D., McAllister D.V., Smitra S., Allen M.G., Prausnitz M.R.,
(2001). Lack of pain associated with microfabricated microneedles, Anesth. Analg., 92(2):
502-504
Kendall M.A.F., Carter F.V., Mitchell T.J., and Bellhouse B.J., (2001). Comparison of the
transdermal ballistic delivery of micro-particle into human and porcine skin, Proceedings of
the 23rd Annual International Conference of the IEEE: October 25-28, Istanbul, Turkey, Vol 3,
2991–4, doi: 10.1109/IEMBS.2001.1017423, ISBM: 0-7803-7211-5
Kendall M.A.F., (2002). The delivery of particulate vaccines and drugs to human skin with a
practical, hand –held shock tube-based system, Shock Waves, 12: 23-30
Kendall M.A.F., Quinlan N.J., Thorpe S.J., Bellhous B.J., Ainsworth R.W. (2004a).
Measurements of the gas and particle flow within a converging-diverging nozzle for high
speed powdered vaccine and drug delivery, Exp. Fluids, 37: 128-36
Kendall M.A.F., Rishworth S., Carter F., Mitchell T., (2004b). Effects of relative humidity
and ambient temperature on the ballistic delivery of micro-particles to excised porcine skin, J.
Invest. Dermatol., 122: 739-746
Kendal M.A.F., (2006). Engineering of needle-free physical methods to target epidermal cells
for DNA vaccination, Vaccine, 24: 4651-4656
Kim Y.C., Quan F.S., Compans R.W., Kang S.M., Prausnitz M.R., (2010). Formulation of
microneedles coated with influenza virus-like particle vaccine, AAPS PharmSciTech,, 11(3):
1193-1201

168
Kim Y.C., Park J.H., Prausnitz M.R, (2012). Microneedles for drug and vaccine delivery,
Advanced Drug Delivery Reviews, 64: 1547-1568
Kis E.E., Gerhard W., Myschik J., (2012). Devices for intradermal vaccination, Vaccine, 30:
523-538
Kishino A., Yanagida T., (1988). Force measurements by micromanipulation of a single actin
filament by glass needles, Nature, 334: 74-76
Klein T.M., Wolf E.D., Wu R., Sanford J.C., (1987). High-velocity microprojectiles for
delivery of nucleic acids into living cells, Nature(London), 327: 70-73
Klein T.M., Arentzen R., Lewis P.A., McElligott F.S., (1992). Transformation of microbes,
plants by particle bombardment, Biotechnology, 10: 286-291
Koelmans W.W., Krishnamoorthy G., Heskamp A., Wissink J., Misra S., Tas N., (2013).
Microneedle Characterization using a double-layer skin simulant, Mechanical Engineering
Research, 3(2): 51-63
Kolli, C.S., Banga, A.K. (2008).Characterization of solid maltose MNs and their use for
transdermal delivery, Pharmaceutical Research, 25:104-113.
Kong R., Bhargava R., (2011). Characterization of porcine skin as model for human skin
studies using infrared spectroscopic image. PubMed, 136(11): 2359-2366
Kuriyama S., Mitoro A., Tsujinoue H., Nakatani T., Yoshiji H., Tsujimoto T., Yamazaki M.,
Fukui H., (2000). “Particle-mediated gene transfer into murine livers using a newly developed
gene gun”, Gene Ther., 7: 1132-1136.
Kuriakose B., Du T.E.S., Jordaan A., (2012). Transient gene expression assays in rose tissues
using a Bio-Rad Helios ® hand-held gene gun, South African Journal of Botany, 78: 307-311
Lambert P.H., Laurent P.E., (2008). Intradermal vaccine delivery: Will new delivery systems
transform vaccine administration?. Vaccine, 26: 3197–3208.

169
Lin M., (2000). The gene gun: current applications in cutaneous gene therapy, Int. J.
Dermatol., 39: 161-170
Liu Y., Kendall M.A.F., (2004a). “Numerical study of a transient gas and particle flow in a
high-speed needle-free ballistic particulate vaccine delivery system”, Journal of Mechanics in
Medicine and Biology, 4(4): 559-578
Liu Y., Kendall M.A.F., (2004b). Numerical simulation of heat transfer from a transonic jet
impinging on skin for needle-free powdered drug and vaccine delivery, Proceedings of the
institution of mechanical engineers, part C: J. Mech, Eng, Sci,, 218(11): 1373-1383
Liu Y., Truong N.K., Kendall M.A.F., (2004c). Numerical studies of contoured shock tube for
murine powdered vaccine delivery system, 15th Australasian Fluid Mechanics conference.
Liu Y., Kendall M.A.F., (2006). Numerical analysis of gas and micro-particle interactions in a
hand-held shock tube device, Biomed Microdevices, 8: 341-351
Liu Y., (2006). Physical-mathematical modelling of fluid and particle transportation for DNA
vaccination, International Journal of Engineering Science, 44(15-16): 1037-1049
Liu Y., Truong N.K., Kendall M.A.F., Bellhouse B.J., (2007). Characteristics of a
micro-biolistic system for murine immunological studies, Biomed. Microdevices 9:465-474
Liu Y., Costigan G., Bellhouse B.J., (2008). Swirling effects on the performance of the
micro-particle acceleration and penetration: parametric studies, Powder Technol. 183:
189-195
Liu Y., (2008). Simulation of transient shock motion within a biological contoured shock tube
system, Physica D: Nonlinear Phenomena, 237(2): 233-242
Macklin, M.D., Drape, R.J., Swain, W.F., (2000). Preparation for particle-mediated gene
transfer using the Accell gene gun, Methods in molecular medicine, 29: 297-303

170
MacNeil S., (2007). Progress and opportunities for tissue-engineered skin, Nature, 445:
874-880
Manjila S.B., Baby J.N., Bijin E.N., Constantine I., Pramod K., Valsalakumari J., (2013).
Novel gene delivery system, International Journal of Pharmaceutical Investigation, 3(1):1-7
Marks J.G., Miller J.J., Lookingbill D.P., (2006). Principles of Dermatology, 4 eidition,
Saunders Elsevier: 1-7, ISBN: 1416031855
Marrion M.C., Gostigan G., Bellhouse B.J., Flow separation control in over-expanded
supersonic nozzle, 35th AIAA fluid dynamics conference and exhibit. Toronto, ON, Canada, 6-9
June, 2005, Chapter DOI: 10.2514/6.2005-5266
Martanto W., Davis S.P., Holiday N.R., Wang J., Gill H.S., Prausnitz M.R. (2004).
Transdermal delivery of Insulin using microneedles in vivo, Pharmaceutical Research, 21:
947-952.
Matteucci M., Fanetti M., Casella M., Gramatica F., Gavioli L., Tormen M., Grenci G., De
Angelis F., Di Fabrizio E. (2009). Poly vinyl alcohol re-usable masters for microneedle
replication. Microelectronic Engineering, 86(4-6): 752-756, doi:10.1016/j.mee.2009.01.068
Mcallister D.V., Allen M.G., (2000). Prausnitz MR. Microfabricated microneedles for gene
and drug delivery, Annual Review Biomedical Engineering, 2: 289 –313.
McAllister D.V., Wang P.M., Davis S.P., Park J.H., Canatella P.J., Allen M.G., Prausnitz,
M.R. (2003). Microfabricated needles for transdermal delivery of macromolecules and
nanoparticles: fabrication methods and transport studies. PNAS, 100: 13755–13760.
Meacham J.M., Durvasula K., Degertekin F.L., Fedorov A.G., (2013). Physical methods for
intracellular delivery: Particle aspects from laboratory use to industrial-scale processing,
Journal of Laboratory Automation, DOI: 10.1177/2211068213494388

171
Memon S., Pathan D.N., Ziyaurrrahman A.R., Bagwan A., Sayed B., (2011). Microneedle as
a novel drug delivery system: A review, Internation Research Journal of Pharmacy, 2(2):
72-77
Menezes V., Mathew Y., Takayama K., Kanno A., Hosseini H., (2012). Laser plasma jet
driven microparticles for DNA/drug delivery, PLoS ONE, 7(11): e50823
Mertens J., Tamayo J., Kosaka P., and Calleja M., (2011). Observation of spermidine-induced
attractive forces in self-assembled monolayers of single stranded DNA using a
microcantilever sensor, Applied Physics Letters, 98(15): 3704 - 3707
Meyers M.A., Chawla K.K., (1999). Mechanical behaviour of materials, 1st Edition, Prentice
Hall, 98-103, ISBN: 9780132628174
Mikolajewska P., Donnelly R.F., Garland M.J., Morrow D.I.J., Singh T.R.R., Lani V., Moan
J., Juzeniene A., (2010). Microneedle pre-treatment of human skin improves
5-aminolevulininc acid (ALA) and 5-aminolevulinic acid methyl ester (MAL) induced PpIX
production for topical photodynamic therapy without increase in pain or erythema, Pharm.
Res., 27: 2213-2220
Mikszta J.A., Alarcon J.B., Brittingham J.M., Sutter D.E., Pettis R.J., Harvey N.G., (2002).
Improved genetic immunization via micromechanical disruption of skin-barrier function and
targeted epidermal delivery, Nat. Med., 8: 415–419.
Mitchell T.J., Kendall M.A.F., Bellhouse B.J., (2003). A ballistic study of micro-particle
penetration to the oral mucosa, International Journal of Impact Engineering, 28: 581-599
Miyano T., Tobinaga Y., Kanno T., Matsuzaki Y., Takeda H., Wakui M., and Hanada K.,
(2005). Sugar micro needles as transdermic drug delivery system. Biomed. Microdevices, 7:
185-188
Mohammed D., Matts P.J., Hadgraft J., Lane M.E., (2012). Variation of stratum corneum
biophysical and molecular properties with anatomic site, The American Association of
Pharmaceutical Scientists, 14(4): 806-812

172
Morgan J.L., Kerschensteiner D., (2011). Shooting DNA, Dyes, or Indicators into Tissue
Slices using the gene gun, Cold Spring Harb. Protoc., 12: 1512-1514
Morsi S.A., Alexander A.J., (1972). An investigation of particle trajectories in two-phase flow
systems, Journal of Fluid Mechanics, 55(2): 193-208
Nagata T., Koide Y., (2010). Induction of specific CD8+ T cells against intracellular bacteria
by CD 8+ T-cell-oriented immunization approaches, Journal of Biomedicine and
Biotechnology, 2010: Article No. 764542, DOI: 10.1155/2010/764542.
Napolitano A.P., Dean D.M., Man A.J., Youssef J., Ho D.N., Rago A.P., Lech M.P., Morgan
J.R., (2007). Scaffold-free three-dimensional cell culture utilizing micromolded nonadhesive
hydrogels, BioTechniques, 43: 494-500
Nayak A. and Das D.B., (2013). Potential of biodegradable microneedles as a transdermal
delivery vehicle for lidocaine, Biotechnology Letters, 35(9): 1351-1363, DOI;
10.1007/s10529-013-1217-3
Nayak A., Das D.B., Vladisavljević, GT (2013). Microneedle-Assisted Permeation of
Lidocaine Carboxymethylcellulose with Gelatine Co-polymer Hydrogel. Pharmaceutical
Research, DOI: 10.1007/s11095-013-1240-z (in press)
Nguyen-Hoai T., Hohn O., Vu M.D., Baldenhofer G., Sayed A.M.S., Dorken B., Norley S.,
Lipp M., Pezzutto A., Westermann J., (2012). CCL19 as an adjuvant for intradermal gene gun
immunization in a Her2/neu mouse tumor model: improved vaccine efficacy and a role for B
cells as APC, Cancer Gene Ther., 19(12): 880-887
Nordquist L., Roxhed N., Griss P., Stemme G., (2007). Novel microneedle patches for active
insulin delivery are efficient in maintaining glycaemic control: an initial comparison with
subcutaneous administration, Pharmaceutical Research, 24(7): 1381–1388

173
O’Brien J.A., Lummis S.C.R., (2011). Nano-biolistics: a method of biolistic transfection of
cells and tissues using a gene gun with novel nanometer-sized projectiles, BMC
Biotechnology, 11: 66
O’Brien J.A., Lummis S.C.R., (2007). Diolistics: incorporating fluorescent dyes into
biological samples using a gen gun, Trends in Biotechnology, 25(11): 530-534
O’Brien J.A., Lummis S.C.R., (2006). Biolistic transfection of neuronal cultures using a
hand-held gene gun, Nat. Protoc. 1(2): 977-981
Oh j., Park H., Do K., Han M., Hyun D., Kim C., Kim C., Lee S., Hwang S., Shin S., Cho C.,
(2008). Influence of the delivery systems using a microneedle array on the permeation of a
hydrophilic molecule, calcein. European Journal of Pharmaceutics and Biopharmaceutica.
69: 1040-1045.
Olatunji O., Das D.B., (2010). Painless Drug delivery using microneedles. Current
technologies to increase the transdermal delivery of drugs (Editor: Joan Escober Chavez).
Sharjah: Bentham Science Publishers, 96-110, ISBN:978-1-60805-191-5 (available online at
http://www.benthamdirect.org/pages/b_getarticlebybook.php).
Olatunji O., Das D.B., (2011). Drug delivery using Microneedles. Comprehensive
Biotechnology (Editor: Zhanfeng Cui). 2nd Edition, MS number 501. MRW, Elsevier, The
Boulevard, Langford Lane, Oxford, United Kingdom. 625-642, ISBN: 13:
978-0-444-53352-4
Olatunji O., Das D.B., Nassehi V. (2012). Modelling transdermal drug delivery using
microneedles: Effect of geometry on drug transport behaviour. Journal of Pharmaceutical
Sciences, 101(1): 164–175, January, DOI: 10.1002/jps.22736.
Olatunji O., Das D.B., Garland M.J., Belaid L., Donnelly R.F., (2013). Influence of array
interspacing on the force required for successful microneedle skin penetration: theoretical and
practical approaches, Journal of Pharmaceutical Sciences, 102(4): 1209–1221, April, DOI:
10.1002/jps.23439

174
Palastanga N., Field D., Soames R.W., (2006). Anatomy and human Movement: Structure
and function, 5th edition, London: Elsevier Health Science, ISBN-13: 9780750688147
Park J.H., Allen M.G., Prausnitz M.R., (2005). Biodegradable polymer microneedles:
fabrication, mechanics and transdermal drug delivery, Journal of Controlled Release, 104(1):
51-66.
Park J.H., Allen M.G., Prausnitz M.R., (2006). Polymer microneedles for controlled-release
drug delivery, Pharm. Res., 23: 1008-1019.
Parker E.R., Rao M.P., Turner K.L., Meinhart C.D., MacDonald N.C. (2007). Bulk
micromachined titanium microneedles, Journal of Microelectromechanical System, 16:
289-295.
Parker, F. (1991). Structure and Function of the Skin: Chapter 1 in Dermatology edited by
Orkin, M. and Maibach, H. I. and Dahl, M. V., 1st edition (Norwalk, Connecticut: Appleton
and Lange).
Phipps, J. B. Padmanabhan, R. V. Lattin, G. A. (1988). Transport of Ionic Species Through
Skin. Solid State Ionics, 28: 1778–1783.
Pierard G.E., Lapiere C.M., (1977). Physiopathological variations in the mechanical
properties of skin, Archives of Dermatological Research, 260(3):231-239
Prausnitz M.R., (2004). microneedles for transdermal drug delivery. Advanced drug delivery
reviews. 56: 581–587.
Prausnitz M.R., Langer R., (2008). Transdermal drug delivery, Nat. Biotech., 26(11):
1261-1268
Qi P., Chen G.G., Wei P., (2007). “Research and Development of Microneedles for
Transdermal Drug Delivery”, Journal of Nanjing University of Technology (Natural Science
Edition), 29(4): 57-63

175
Quan F.S., Kim Y.C., Compans R.W., Prausnitz M.R., Kang S.M., (2010). Does sparing
enabled by skin immunization with influenza virus-like particle vaccine using microneedles, J.
Control Release, 147(3): 326-332
Quinlan N.J., Kendall M.A.F., Bellhouse B.J., Ainsworth R.W., (2001). Investigations of gas
and particle dynamics in first generation needle-free drug delivery device, Shock Waves, 10:
395-404
Raju P.A., Truong N.K., Kendall M.A.F., (2006). Assessment of epidermal cell viability by
near infra-red two-photon microscopy following ballistic delivery of gold micro-particles,
Vaccine, 24: 4644-4647
Rao W., (2010). A proteomic analysis of lipid raft and GPI anchored protein in
Caenorhabditis elegans, University of Leeds (UK), Thesis for the degree of Doctor of
Philosophy
Rasel M.A.I., Taher M.A., Kim H.D., (2013). A study on the gas-solid particle flows in a
needle-free drug delivery device, Journal of Thermal Science, 22(4): 340-344
Rinberg D., (2005). Pneumatic capillary gun for ballistic delivery of micro-particles, Applied
Physics Letters, 87: 014103
Ritman E.L., (2004). Micro-computed tomography – Current status and developments,
Annual review of Biomedical Engineering, 6: 185-208
Rosi N.L., Giljohann D.A., Thaxton C.S., Lytton-Jean A.K., Han M.S., Mirkin C.A., (2006).
Oligonucleotide-modified gold nanoparticles for intracellular gene regulation, Science, 312:
1027-1030
Rushmer R. F., Buettner K. J. K., Short J. M., and Odland G. F., (1966). The Skin,
Science, 154: 343–348.
Russell J.A., Roy M.K., Sanford J.C., (1992). Physical trauma and tungsten toxicity reduce
the efficiency of biolistic transformation, Plant Physiol., 98: 1050-1056

176
Sachdeva V., Banga A.K., (2011). Microneedles and their applications, Recent Pat. Drug
Delivery Formulation, 5: 95-132
Sakai T., Hisaeda H., Nakano Y,, Ishikawa H., Maekawa Y., Ishii K., Nitta Y., Miyazaki J.,
Himeno K., (2000). Gene gun-mediated delivery of an interleukin-12 expression plasmid
protects against infections with the intracellular protozoan parasites leishmania major and
Trypanosoma cruzi in mice, Immunology, 99: 615-624
Sanford J.C., Klein T.M., Wolf E.D., Allen N., (1987). Delivery of substances into cells and
tissues using a particle bombardment process, Particulate Science and Technology, 5(1):
27-37
Sanford J.C., Smith F.D., Russell J.A., (1993). Optimizing the biolistic process for different
biological applications, Methods Enzymol., 217: 483-509
Sanford J.C., (2000). Turning point article –The development of the biolistic process, In Vitro
Cell. Dev. Biol., 36: 303-308
Satish D., (2009). In vitro manipulation of pollen for transformation in cotton and tomato,
University of Agricultural Sciences (India), Thesis for the degree of Doctor of Philosophy
Sato H., Hattori S., Kawamoto S., Kudoh I., Hayashi A., Yamamoto I., Yoshinari M., Minami
M., Kanno H., (2000). In vivo gene gun-mediated DNA delivery into rodent brain tissue,
Biochem. Biophys. Res. Commun. 270(1): 163-170.
Schaefer, H., Redelmeier, T.E. (1997). Skin barrier: Principles of percutaneous absorption,
Arch Dermatol., 133(7): Article No. 924, doi:10.1001/archderm.1997.03890430146031.
Scheuplein R.J., Blank I.H. (1971). Permeability of the skin, Physiol. Rev., 51: 702-747.
Shah U.U., Roberts M., Gul M.O., Teleu C., Beresford M.W., (2011). Needle-free and
microneedle drug delivery in children: a case for disease-modifying antirheumatic drugs
(DMARDs), International Journal of Pharmaceutics, 416: 1-11

177
Shampine L.F., Reichelt M.W., (1997). The matlab ode suite, SIAM Journal on Scientific
Computing, 18(1): 1-22, DOI: 10.1137/S1064827594276424
Shergold O.A., Fleck N.A., Radford D., (2006). The uniaxial stress versus strain response of
pig skin and silicone rubber at low and high strain rates, Int. J. Impact Eng., 32: 1384-1402
Silpi C., Manish B., Kumar T.R., (2011). Microneedles in transdermal drug delivery: An
unique painless option, International Research Journal of Pharmacy, 2(4): 72-78
Silver F.H., Freeman J.F., Devore D., (2001). Viscoelastic properties of human skin and
processed dermis. Skin Research and Technology, 7(1): 18-23
Smith F.D., Harpending P.R., Sanford J.C., (1992). Biolistic transformation of prokaryotes:
factors that affect biolistic transformation of very small cells. J. Gen. Microbiol., 138:
239-248
Singh R., Dahotre N.B., (2007). Corrosion degradation and prevention by surface
modification of biometallic materials, J. Mater. Sci. Mater. Med., 18(5): 725-751
Soliman S.M. (2011). Micro-particle and Gas Dynamics in an Axi-symmetric Supersonic
Nozzle, University of Cincinnati (Cincinnati, USA), Thesis for the degree of Doctor of
Philosophy in Aerospace Engineering.
Soliman S.M., Abdallah S., (2011). CFD investigation of powdered vaccine and gas dynamics
in biolistic gun, Powder Technology, 214: 135-142
Soliman S.M., Abdallah S., Gutmark E., Turner M.G., (2011). Numerical simulation of
microparticles penetration and gas dynamics in an axi-symmetric supersonic nozzle for
genetic vaccination, Powder Technology, 208: 676-683
Stahl J., Wohlert M., Kietzmann M., (2012). MN pretreatment enhances the percutaneous
permeation of hydrophilic compounds with high melting points, BMC Pharmacology and
Toxicology, 13: 1-7

178
Stoeber B., Liepmann D., (2000). Fluid injection through out-of-plane microneedles,
Proceedings of the 1st Annual International IEEE-EMBS Special Topic Conference on
Microtechnologies in Medicine and Biology, Lyon, France, 14: 224-228.
Sung H.W., Chen M.C., Lee P.W., Tu H.S., (2011). Nanoparticles for protein/peptide delivery
and delivery means thereof, Patent No. US7901711 B1 (Granted), United States Patent, USA
Svarovsky S., Borovkov A., Sykes K., (2008). Cationic gold microparticles for biolistic
delivery of nucleic acids, Biotechniques, 45(5): 535-540
Swain W.E., Heydenburg F.D., Wu M.S., Barr L.J., Fuller J.T., Culp J., Burkholder J., Dixon
R.M., Widera G., Vessey R., Roy M.J. (2000). Tolerability and immune responses in humans
to a PowderJect DNA vaccine for hepatitis B., Dev. Biol (Basel). 104: 115-119.
Tekeuchi Y., Doston M., Keen N.T., (1992). Plant transformation: a simple particle
bombardment device based on flowing helium, Plant Mol. Biol., 18: 835-839
Teo A.L., Shearwood C., Ng K.C., Lu J., Moochhala S., (2006). Transdermal microneedles
for drug delivery applications, Materials Science and Engineering, 132: 151-154.
Thomas J.L., Bardou J., Mauchamp B. et al., Chavancy Gerard (2001). A helium burst
biolistic device adapted to penetrate fragile insect tissues, Journal of Insect Science, 1(9):
1-10
Tortora G.J., Derrickson B.H., (2011). Principles of Anatomy and Physiology, 13 edition,
Wiley, ISBN-13: 978-0470565100
Trainer A.T., Alexander M.Y., (1997). Gene delivery to the epidermis, Human Molecular
Genetics, 6(10): 1761 - 1767
Trimble C., Lin C., Hung C., Pai S., Juang J., He L., Gillison M., Pardoll D., Wu L., Wu T.,
(2003). Comparison of the CD8+ T cell responses and antitumor effects generated by DNA
vaccine administered through gene gun, biojector, and syringe, Vaccine, 21: 4036–4042.

179
Truong N.K., Liu Y., Kendall M.A.F., (2006). Gas and particle dynamics of a contoured
shock tube for pre-clinical micro-particle drug delivery, Shock Waves, 15: 149-164
Tuan-Mahmood T.M., McCrudden M.T.C., Torrisi B.M., McAlister E., Garland M.J., Singh
T.R.R., Donnelly R.F., (2013). Microneedles for intradermal and transdermal drug delivery,
European Journal of Pharmaceutical Sciences, doi: 10.1016/j.ejps.2013.05.005. (in press)
Uchida M., Li X.W., Mertens P., Alpar H.O., (2009). Transfection by particle bombardment:
Delivery of plasmid DNA into mammalian cells using gene gun, Biochim. Biophys. Acta.,
1790(8): 754-764
Valenstein J.C., (2012). Developing nanotechnology for biofuel and plant science
applications, Iowa State Univeristy (USA), Thesis for the degree of Doctor of Philosophy
Verbaan, F.J., Bal, S.M., van den Berg, D.J., Dijksman, J.A., van Hecke, M., Verpoorten, H.,
van den Berg, A., Luttge, R., Bouwstra, J.A. (2008). Improved piercing of microneedle arrays
in dermatomed human skin by an impact insertion method, Journ. Contrl. Rel., 128: 80–88.
Vexler A., Polyansky I., Gorodetsky R., (1999). Evaluation of skin viscoelasticity and
anisotropy by measurement of speed of shear wave propagation with viscoelasticity skin
analyser, Journal of Investigative Dermatology, 113: 732-739
Walters K.A., Roberts M.S., (2007). Dermatologic, Cosmeceutic, and Cosmetic
Development, Therapeutic and Novel Approaches, CRC press, Chapter 36: 591-611
Webster C., (1995). The Discovery of Boyle’s law, and the concept of the Elasticity of Air in
the Seventeenth Century, Arch. Hist. Exact Sci., 2: 441-502
Wildnauer R.H., Bothwell J.W., Douglas A.B., (1971). Stratum corneum properties I.
Influence of relative humidity on normal and extracted stratum corneum, J. Invest. Dermatol.,
56: 72-78

180
Williams R.S., Johnston S.A., Riedy M., DeVit M.J., McElligott S.G., Sanford J.C., (1991).
Introduction of foreign genes into tissues of living mice by DNA-coated microprojectiles,
Proc. Natl. Acad. Sci. U.S.A., 88: 2726-2730
Xia J.X., Martinez A., Daniell H., Ebert S.N., (2011). Evaluation of biolistic gene transfer
methods in vivo using non-invasive bioluminescent imaging techniques, BMC Biotechnology,
11: 62-72
Xu F., Wen T., Seffen K.A., LuT.J., (2007). Characterization of Thermomechanical
behaviour of skin tissue – Viscoelastic behaviour, Proceedings of the World Congress on
Engineering, 2, WCE 2007
Yager E.J., Stagnar C., Gopalakrishnan R., Fuller J.T., Fuller D.H., (2013). Optimizing
particle-mediated epidermal delivery of an influenza DNA vaccine in ferrets, Methods Mol.
Biol., 940: 223-237
Yan G., Warner K. S., Zhang J., Sharma S., Gale B. K., (2010), Evaluation needle length and
density of microneedle arrays in the pretreatment of skin for transdermal drug delivery,
International journal of Pharmaceutics. 391: 7-12.
Yang C.H., Shen S.C., Lee J.C., Wu P.C., Hsueh S.F., Lu C.Y., Meng C.T., Hong H.S., Yang
L.C., (2004). Seeing the gene therapy: application of gene gun technique to transfect and
decolour pigmented rat skin with human agouti signalling protein cDNA, Gene Ther.,
11(13):1033-1039
Yang L.Z., Li C.F., Chen L., Li Z.Y., (2009). An agarose gel based method for transporting
cell lines, Current Chemical Genomics, 3: 50-53
Yang N.S., Burkholder J., Roberts B., Martinell B., McCabe D., (1990). In vivo and in vitro
gene transfer to mammalian somatic cells by particle bombardment, Proc. Natl. Acad. Sci.
U.S.A., 87: 9568-9572
Yen M.C., Lai M.D., (2013). Biolistic DNA delivery to mice with the low pressure gene gun,
Methods Mol. Biol., 940:169-174

181
Yoshida Y., Kobayashi E., Endo H., Hamamoto T., Yamanaka T., Fujimura A., Kagawa Y.,
(1997). Introduction of DNA into rat liver with a hand-held gene gun: Distribution of the
expressed enzyme, [32P] DNA, and Ca2+ flux, Biochem. Biophys. Res. Commun. 234(3): 695
-700.
Yoshimitsu Y., Tanaka K., Tagawa T., Nakamura Y., Matsuo T., Okamoto S., (2009),
Improvement of DNA/Metal Particle Adsorption in Tungsten-Based Biolistic Bombardment;
Alkaline pH is Necessary for DNA Adsorption and Suppression of DNA Degradation,
Journal of Plant Biology, 52: 524-532.
Yuzhakov V.V., (2008). Tissue conforming microneedle array and patch for transdermal drug
delivery or biological fluid collection, World Intellectual Property Organization, Patent: WO
2008/067290 A2;
Zelenin A.V.,Titomirov A.V., Kolesnikov V.A., (1989). Genetic transformation of mouse
cultured cells with the help of high velocity mechanical DNA injection, FEBS Lett., 244(1):
65-67
Zeng Y.J., Huang K., Xu C.Q., Zhang J. and Sun G.C., (2001). Biorheological characteristics
of skin after expansion. Biorheology, 38(5-6): 367-378
Zhang, D, Das, DB, Rielly, CD (2013). An experimental study of microneedle assisted
micro-particle delivery. Journal of Pharmaceutical Sciences, 102(10): 3632-3644
Zhang G., Selzer M.E., (2001). In vivo transfection of lamprey brain neurons by gene gun
delivery of DNA, Exp. Neurol, 167(2): 304-311.
Zhang M.J., Tao W.M., Pianetta P.A., (2007). Dynamics modelling of biolistic gene guns,
Phys. Med. Biol., 52:1485-1493
Zhao H.Y., Avenarius M.R, Gillespie P.G., (2012). Improved biolistic transfection of hair
cells, PLoS ONE, 7(10): e46765
182
Zhao Y., J., Zhang J.,Y., Yang X.,L., (2006). Design and Manufacture of Microneedles Array
for Transdermal Drug Delivery, Chinese Journal of Medical Instrumentation, 30(1): 33-38
Zhou F., (2000). High-pressure Gas Gene Gun, Chinese Patent No. CN 1262323A (Granted),
State Intellectual Property Office of the P.R. China, China
Zhou F., (2007). Liquid Gene Gun, Chinese Patent No.CN 189217A (Granted), State
Intellectual Property Office of the P.R. China, China
Zhou W.Z., (1995). Gene Gun, Chinese Patent No. CN 2196119Y (Granted), State
Intellectual Property Office of the P.R. China, China
Zhu, M., Chen, Y., Wang, Z. Lu, Y., Ge, H., Tang, Y. (2012). Fabrication Method for Hollow
Microneedles for Drug Delivery. Nanjing University, Patent US 8137736 B2 (Granted),
United States Patent, USA
Ziegler A.S., (2008). Needle-free delivery of powdered protein vaccine: a new and rapidly
developing technique, J. Pharm. Innov., 3: 204-213
Zilony N., Tzur-Balter A., Segal E., Shefi O., (2013). Bombarding Cancer: Biolistic delivery
of therapeutics using porous Si carriers, Scientific Reports, 3: article number 2499
Zuraida A.R., Rahiniza K., Hafiza M.R.N., Roowi S., Zamri Z., Subramaniam S., (2010).
Factors affecting delivery and transient expression of gusa gene in Malaysian indica rice MR
219 callus via biolistic gun system, African Journal of Biotechnology, 9(51):8819-8818

I
Appendix A: The drag coefficient equations (Morsi et al, 1972)
Re/0.24dC for Re<0.1,
69.3Re/0903.0Re/73.22 2dC for 0.1<Re<1.0,
222.1Re/8889.3Re/1667.29 2dC for 1.0<Re<10.0
6167.0Re/67.116Re/5.46 2dC for 10.0<Re<100.0
3644.0Re/2778Re/33.98 2dC for 100.0<Re<1000.0
357.0Re/1075.4Re/62.148 24 dC for 1000.0<Re<5000.0

II
Appendix B: The mathematical model of the microneedle assisted micro-particle
delivery
(1). Main code for the microneedle assisted micro-particle delivery
clear all
global theta1 R1 theta2 Rb sigma1
global rhof muf mp rp Rc mc
global Ln Rt d Lm R2 n tol
global mum rhosc rhove sigma2 Tsc
rhos = 19920; % the density of micro-particle (kg/m3)
%rhos = 8000; % the denisty of steel
rhof = 1.29; % the density of fluid (kg/m3)
rhosc = 1500; % the density of sc(kg/m3)
rhove = 1150; % the density of ve(kg/m3)
rp = 1.5e-6; % the radius of the micro-particle (m)
sigma1 = 10000000; % the yield stress of SC(Pa)
sigma2 = 2200000; % the yield stress of epidermis(Pa)
Rc = 0.001; % the radius of cluster (m)
mc = 0.001; % the mass of cluster (kg)
mp = 4*pi*rp^3*rhos/3; % mass of the micro-particle (kg)
muf = 1.85e-5; % the viscosity of fluid (Pa s)
Rb = 0.006; % Nozzle entry radius (m)
Rt = 0.006; % Nozzle exit radius (m)
Ln = 0.005; % the length of nozzle(m)
Lm = 0.001149; % the length of microneedle hole(m)
Tsc = 2e-5; % the thickness of sc(m)
Tve = 1e-4; % the thickness of epidermis(m)
muw = 8.9e-4; % the viscosity of water (Pa s)
mum = 19.6; % the friction coefficient between
particle and skin
theta2 = atan((Rt-Rb)/Ln); % wall angle (rad)
en = 1.0; % normal coeff of restitution (-)
et = 1.0; % tangential coeff of restitution (-)
Np = 1; % number of particle trajectories
n = 5; % number of microneedle
m = n+1; % number of space
R1 = 0.00020; % needle entry radius (m)
R2 = 0.00005; % needle exit radius (m)
d = (2*Rt-n*2*R1)/m; % the space between each microneedle
ncol = 200; % number of color
theta1 = atan((R1-R2)/Lm); % microneedle angle (rad)

III
tol = 1e-7;
La = 0.003; % the length of agarose
Ra = 0.009; % the radius of agarose
fr = 0.5; % the fraction of microneedle length
inserted in the skin
Ar = 2; % the ratio between muscle thickness and
microneedle length
sum = 0; % the number of micro-particle pass through
the needle at the begining
sum1 = 0; % the number of micro-particle stopped at
sum2 = 0; % the number of micro-particle stopped at
%The acceleration stage
%Constant
Rw=0.00375; % the radius of the barrel(m)
V1 = 0.001;
y=1.4; % the heat capacity ratio
M1 = 0.00125;
La=[0:0.001:0.5]; % the lenght of acceleration stage(m)
P1 =300000;
u1=sqrt(2*(P1*V1^y*(((V1+pi*Rw^2*La)).^(1-y)-(V1^(1-y))))/(M1*(1-y)))
;
figure(1)
plot(La,u1,'b-')
xlabel('The acceleration stage distance [m]')
ylabel('The velocity of ground slide [m/s]')
grid
%The deceleration stage
options = optimset('TolFun',1E-6,'Display','off');
%intial states and simulation length for the cluster decelerated in the
air
l2=linspace(0,0.01,10);
%simulation
[D1,u2]=ode45('rhs_fun_ac',l2,u1(end), options);

IV
figure(2)
plot(D1,u2,'b-')
xlabel('The travel distance of cluster in the air [m]')
ylabel('The velocity of cluster in the air [m/s]')
grid
%The energy lost during the separation stage
u3 = u2(end)*0.8;
%intial states and simulation length for the micro-particle decelerated
in the nozzle
figure(3)
clf
set(gca,'xlim',[-0.01 0.01],'ylim',[0 Ln+(Ar+1)*Lm]);
box on
hold on;
xlabel('Radial position (m)','fontsize',20);
ylabel('Axial position (m)','fontsize',20);
set(gca,'FontName','arial','FontSize',20);
% Plot the location and structure of nozzle and agarose gel in the figure
3
plot([-Rt -Rt], [0 Ln], '-k','LineWidth',2);
plot([Rt Rt], [0 Ln], '-k','LineWidth',2);
plot([Ra Ra],[Ln Ln+(Ar)*Lm],'-k','LineWidth',2);
plot([-Ra -Ra],[Ln Ln+(Ar)*Lm],'-k','LineWidth',2);
plot([Rt Ra],[Ln Ln],'-k','LineWidth',2);
plot([-Rt -Ra],[Ln Ln],'-k','LineWidth',2);
plot([-Ra Ra],[Ln+(Ar)*Lm Ln+(Ar)*Lm],'-k','LineWidth',2);
plot([Rt-d-(Tsc*tan(theta1)) Ra],[Ln+Tsc Ln+Tsc],'-k','LineWidth',2);
plot([-Rt+d+(Tsc*tan(theta1)) -Ra],[Ln+Tsc
Ln+Tsc],'-k','LineWidth',2);
plot([Rt-d-((Tsc+Tve)*tan(theta1)) Ra],[Ln+Tsc+Tve
Ln+Tsc+Tve],'-k','LineWidth',2);
plot([-Rt+d+((Tsc+Tve)*tan(theta1)) -Ra],[Ln+Tsc+Tve
Ln+Tsc+Tve],'-k','LineWidth',2);
for i= -Rt+d:2*R1+d:Rt-d-2*R1
plot([i i+R1-R2], [Ln Lm+Ln], '-k','LineWidth',2);

V
end
for i= -Rt+2*R1+d : 2*R1+d : Rt-d
plot([i i-R1+R2], [Ln Lm+Ln], '-k','LineWidth',2);
end
for i= -Rt : 2*R1+d : Rt
plot([i i+d], [Ln Ln], '-k','LineWidth',2);
end
for i= -Rt+d+R1-R2 : 2*R1+d : Rt-d-R1+R2
plot([i i+2*R2], [Ln+Lm Ln+Lm], '-k','LineWidth',2);
end
for i= -Rt+2*R1+d-((Tsc+Tve)*tan(theta1)) : 2*R1+d:
Rt-d-2*R1+((Tsc+Tve)*tan(theta1))
plot([i i+d+2*((Tsc+Tve)*tan(theta1))], [Ln+Tsc+Tve Ln+Tsc+Tve],
'-k','LineWidth',2);
end
for i= -Rt+2*R1+d-((Tsc)*tan(theta1)) : 2*R1+d:
Rt-d-2*R1+((Tsc)*tan(theta1))
plot([i i+d+2*(Tsc*tan(theta1))], [Ln+Tsc Ln+Tsc], '-k','LineWidth',2);
end
%vrexit = [];
%vzexit = [];
% Simulation of micro-particles travelling along a nozzle and agarose gel
for i=1:Np
tstart = 0;
vz0 = u3; % particle initial axial velocity (m/s)
a = 20; % radial velocity (% of axial
velocity)

VI
r0 = Rb*rand*sign(rand-0.5);
z0 = 0;
% choose radial component to be normally distributed with a mean of
0
% and a standard deviation of a% of vz0
vr0 = a/100*vz0*randn;
y0 = [r0; 0; vr0; vz0]; % [ r (signed), z, vr (signed), vz]
tfinal = 2*Ln/y0(4); % estimate the max residence time
refine = 6;
options = odeset('RelTol',1e-7,...
'Events',@event_locator2,'Refine',refine); %
tout = tstart;
yout = y0.';
teout = [];
yeout = [];
ieout = [];
while tstart < tfinal
[t,y,te,ye,ie] = ode15s(@rhs_fun2,[tstart
tfinal],y0,options);
cmap = jet(ncol);
npts = length(y(:,1));
maxspeed = 180;
minspeed = 0;
for j = 2 : npts
speed = sqrt((y(j,3)^2+y(j,4)^2));
col = max(ceil(((speed - minspeed)/(maxspeed -
minspeed))*ncol),1);
plot([y(j-1,1) y(j,1)],[y(j-1,2)
y(j,2)],'color',cmap(col,:),'LineWidth',3);
end
% Accumulate output
nt = length(t);
tout = [tout; t(2:nt)];

VII
yout = [yout; y(2:nt,:)];
teout = [teout; te]; % Events at tstart are never reported.
yeout = [yeout; ye];
ieout = [ieout; ie];
% Set the rebound conditions
y0(1) = y(nt,1);
y0(2) = y(nt,2);
vri = y(nt,3);
vzi = y(nt,4);
% Check if particle has collided with wall of nozzle
if abs(Ln - y0(2))/Ln > tol
if y0(2) <Ln
if y0(1) < 0
theta_1 = theta2;
else
theta_1 = -theta2;
end
y0(3) =
-sin(theta_1)*et*(cos(theta_1)*vzi-vri*sin(theta_1))+ ...
cos(theta_1)*(-vri*cos(theta_1)-sin(theta_1)*vzi)*en;
y0(4) =
cos(theta_1)*et*(cos(theta_1)*vzi-vri*sin(theta_1))+ ...
sin(theta_1)*(-vri*cos(theta_1)-sin(theta_1)*vzi)*en;
end
end
if speed < 1e-5
break
end
% Check if particle has stoped in the agarose gel
tstart = t(nt);

VIII
end
% Interpolate to obtain exit velocities and store in vectors
if y0(2) >= Ln & y0(2) < Ln+Tsc
sum = sum +1;
else
sum = sum;
end
if y0(2) >= Ln+Tsc & y0(2) < Ln+Tsc+Tve
sum1 = sum1 +1;
else
sum1 = sum1;
end
if y0(2) >= Ln+Tsc+Tve
sum2 = sum2 +1;
else
sum2 = sum2;
end
title('Micro-particle trajectories','fontsize',20);
figure(3)
if ~isempty(yeout)
plot(yeout(:,1),yeout(:,2),'or');
end
end
% plot a colorbar in the figure 3 to show a scale of velocity range
colorbar1 = colorbar('ylim',[3 50], ...
'YTickLabel',...
{'0','20','40','60','80','100','120','140','160','180'},'fontsize',18
);
figure(4)
clf
set(gca,'xlim',[0 4],'ylim',[0 100]);
box on

IX
hold on
N1 = (sum/Np)*100;% Measure the percentage of micro-particle can pass
through the needle
N2 = (sum1/Np)*100;
N3 = (sum2/Np)*100;
N = [N1 N2 N3];
bar(N);
set(gca,'XTickLabel',{'','','Inside the stratum corneum','','Inside the
viable epidermis','','Inside the dermis'});
ylabel('Percentage(%)','fontsize',20);
set(gca,'FontName','arial','FontSize',19);
%The deceleration stage in the agarose gel
l=linspace(0,0.0025,1);
options = optimset('TolFun',1E-4,'Display','off')
[D3,u4] = ode15s('rhs_fun1',l,u3, options);
[D4,u5] = ode23('rhs_fun3',l,u3, options);
figure(5)
clf
set(gca,'xlim',[0 0.0025],'ylim',[2 150])
box on
hold on;
plot(D3,u4,'k--',D4,u5, 'k-' )
xlabel('The travel distance of micro-particle in the skin
[m]','fontsize',12)
ylabel('The velocity of micro-particle in the skin [m/s]','fontsize',12)
legend('The micro-particle penetrates the skin','The micro-particle
penetrates via the pierced hole on the skin')
(2). Function code to calculate the velocity of micro-particles before impact on the mesh
%this code is for calculation of velocity
function du=fun_ac(l,u)
global rhof muf Rc mc

X
%differential equation
Re=rhof*u*2*Rc/muf; %Cluster Reynolds number in the channel
if Re<=0.1
Cd=24.0/Re;
elseif Re<=1
Cd=22.73/Re+0.0903/Re^2+3.69;
elseif Re<=10
Cd=29.1667/Re-3.8889/Re^2+1.222;
elseif Re<=100
Cd=46.5/Re-116.67/Re^2+0.6167;
elseif Re<=1000
Cd=98.33/Re-2778/Re^2+0.3644;
else
Cd=148.62/Re-47500/Re^2+0.357;
end
du=-Cd*rhof*u*pi*Rc^2/(2*mc);
end
(3). Function code for two dimension analysis of micro-particles decelerating in the
deceleration stage
function dydt = rhs_fun(t,x)
global rhof muf mp rp Ln Lm d R1 n Re R2 sigma1 rhosc mum rhove sigma2
Tsc
vr = x(3);
vz = x(4);
v = sqrt(vr^2+vz^2); % absolute velocity of micro-particle
Re = rhof*v*2*rp/muf; % micro-particle Reynolds number
if Re <= 0.1
Cd = 24.0/Re;
elseif Re<=1
Cd = 22.73/Re+0.0903/Re^2+3.69;
elseif Re <= 10
Cd = 29.1667/Re-3.8889/Re^2+1.222;
elseif Re <= 100
Cd = 46.5/Re-116.67/Re^2+0.6167;
elseif Re <= 1000

XI
Cd = 98.33/Re-2778/Re^2+0.3644;
else
Cd = 148.62/Re-47500/Re^2+0.357;
end
rho=0;
sigma_y=0;
if x(2) > Ln & x(2) < Ln+Tsc
rho = rhosc;
sigma_y = sigma1;
elseif x(2) > Ln+Tsc
rho = rhove;
sigma_y = sigma2;
end
if x(2) < Ln | x(2) < Ln+Lm & rem(n,2) == 0 & abs(rem(x(1),d+2*R1)) >
0.5*d & abs(rem(x(1),d+2*R1)) < 0.5*d+2*R1 & x(2) <
(Lm/(R1-R2))*abs(rem(x(1),d+2*R1))+Ln-0.5*d*(Lm/(R1-R2)) & x(2) <
(Lm/(R2-R1))*abs(rem(x(1),d+2*R1))+Ln-(0.5*d+2*R1)*(Lm/(R2-R1))...
| x(2) < Ln+Lm & rem(n,2) == 1 & abs(rem(x(1), d+2*R1)) > R1+d
& abs(rem(x(1), d+2*R1)) < d+2*R1 & x(2) <
(Lm/(R1-R2))*abs(rem(x(1),d+2*R1))+Ln-(R1+d)*(Lm/(R1-R2))| x(2) <
Ln+Lm & rem(n,2) == 1 & abs(rem(x(1), d+2*R1)) < R1 & x(2) <
(Lm/(R1-R2))*abs(rem(x(1),d+2*R1))+Ln+R1*(Lm/(R1-R2)) & x(2) <
(Lm/(R2-R1))*abs(rem(x(1),d+2*R1))+Ln-R1*(Lm/(R2-R1))
dydt(1) = vr; % radial velocity
dydt(2) = vz; % axial velocity
dydt(3)=-Cd*rhof*vr*v*pi*rp^2/(2*mp); % radial drag
dydt(4)=-Cd*rhof*vz*v*pi*rp^2/(2*mp); % axial drag
dydt = dydt';
else
dydt(1) = vr; % radial velocity
dydt(2) = vz; % axial velocity
dydt(3)=
-(3*sigma_y*pi*vr*rp^2/(mp*v))-(0.5*rho*vr*v*pi*rp^2/(2*mp))-(6*pi*rp
*mum*vr/mp); % radial drag
dydt(4)=
-(3*sigma_y*pi*vz*rp^2/(mp*v))-(0.5*rho*vz*v*pi*rp^2/(2*mp))-(6*pi*rp
*mum*vz/mp); % axial drag
dydt = dydt';

XII
end
(4). Function code to measure the penetration depth of micro-particles without using
microneedle
function du = rhs_fun1(l,v)
global mp rp sigma1 rhosc mum rhove sigma2 Tsc
rho=0;
sigma_y=0;
if l < Tsc
rho = rhosc;
sigma_y = sigma1;
else
rho = rhove;
sigma_y = sigma2;
end
du = -(3*sigma_y*pi*rp^2/(mp*v))-(0.5*rho*v*pi*rp^2/(2*mp))
-6*pi*rp*mum/mp; % axial drag
(5). Function code to measure the penetration depth of micro-particles through the
pierced holes
function du = rhs_fun3(l,v)
global mp rp mum sigma2 muf rhof Lm rhove
Re = rhof*v*2*rp/muf; % micro-particle Reynolds number
if Re <= 0.1
Cd = 24.0/Re;
elseif Re<=1
Cd = 22.73/Re+0.0903/Re^2+3.69;
elseif Re <= 10
Cd = 29.1667/Re-3.8889/Re^2+1.222;
elseif Re <= 100
Cd = 46.5/Re-116.67/Re^2+0.6167;
elseif Re <= 1000
Cd = 98.33/Re-2778/Re^2+0.3644;
else
Cd = 148.62/Re-47500/Re^2+0.357;
end

XIII
if l < Lm
du = -Cd*rhof*v*pi*rp^2/(2*mp); %micro-particle travel in the needle
hole
else
du = -(3*sigma2*pi*rp^2/(mp*v))-(0.5*rhove*v*pi*rp^2/(2*mp))
-6*pi*rp*mum/mp; % micro-particle penetrate into the skin
end
(6). Event code to define the event locators of the rebound and impact points
unction [value,isterminal,direction] = event_locator2(t,y)
% Locate the time when height passes through zero in a
% decreasing direction and stop integration.
global theta1 R1 theta2 Rb Ln d n
if y(2) < Ln
value1 = Rb+y(2)*tan(theta2)-abs(y(1)); % Detect impact
elseif rem(n,2) == 1 & abs(rem(y(1),d+2*R1)) <= d+R1 &
abs(rem(y(1),d+2*R1)) >= R1 % the location of the space between each
microneedle
% when the number of microneedle is a odd number
value1 = Ln-abs(y(2)); % Detect impact
elseif rem(n,2) == 0 & abs(rem(y(1),d+2*R1)) <= 0.5*d &
abs(rem(y(1),d+2*R1)) >= 0 ...
| rem(n,2) == 0 & abs(rem(y(1),d+2*R1)) >= 0.5*d+2*R1 &
abs(rem(y(1),d+2*R1)) <= d+2*R1
value1 = Ln-abs(y(2));
else
if rem(n,2) ==1
if abs(rem(y(1), d+2*R1))> d+R1 & abs(rem(y(1), d+2*R1))<
d+2*R1...

XIV
value1 = R1-(y(2)-Ln)*tan(theta1)-abs(abs(rem(y(1),
d+2*R1))-d-2*R1);
elseif abs(rem(y(1), d+2*R1)) < R1
value1 = R1-(y(2)-Ln)*tan(theta1)-abs(rem(y(1), d+2*R1));
end
else
if abs(rem(y(1), d+2*R1)) > 0.5*d & abs(rem(y(1), d+2*R1)) <
0.5*d+2*R1
value1 = R1-(y(2)-Ln)*tan(theta1)-abs(abs(rem(y(1),
d+2*R1))-0.5*d-R1);
end
end
end
value2 = sqrt(y(3)^2+y(4)^2)-1e-10; % velocities < 1e-10 m/s have
effectively stopped
value=[value1; value2];
isterminal = [1; 1]; % Stop the integration
direction = [-1; -1]; % decreasing function only