Welding machine catalogue from expert technology co.,ltd manufacture
APPLICATION OF MACHINE LEARNING AND EXPERT SYSTEMS TO STATISTICAL PROCESS CONTROL (SPC) CHART INTEFQBWTATIION
Mark Shewhart B *a Air Force Logistics Command (AFLC)
Acquisition Logistics Division I Joint Technology Application Office (ALDIJTI) Artificial Intelligence Support Center (AISC) Wright Patterson AFB, Ohio 45433
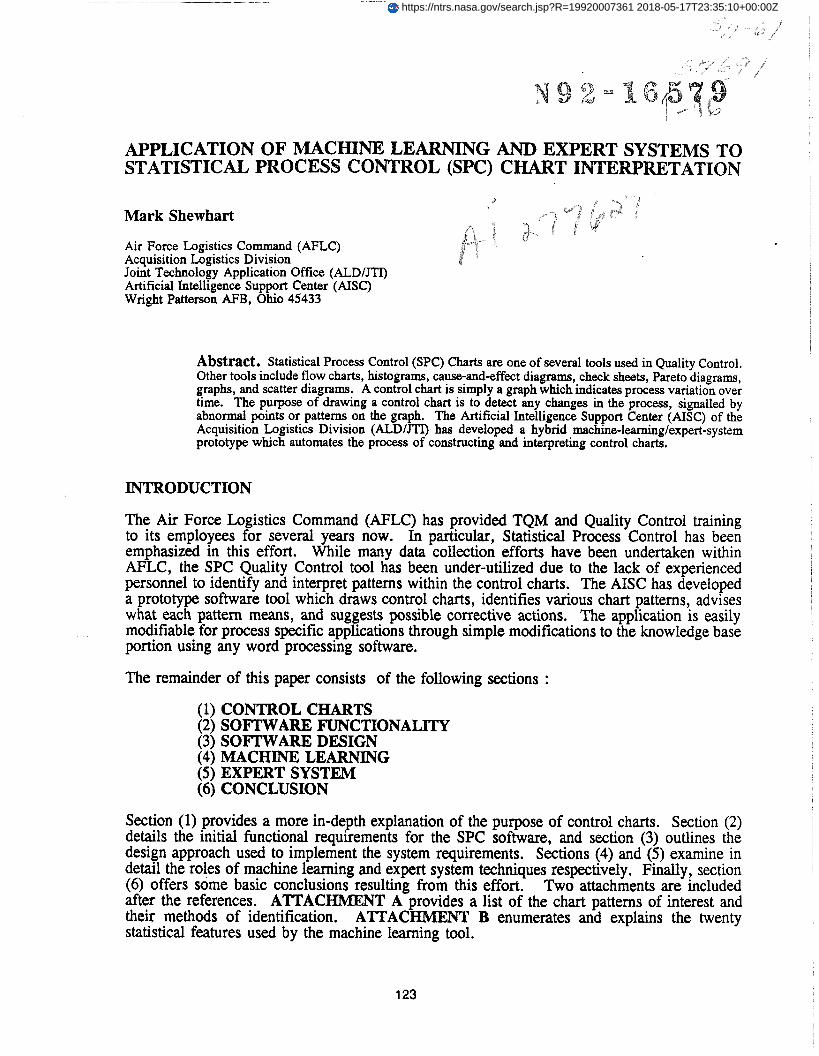
Abstract. Statistical Process Control (SPC) Charts are one of several tools used in Quality Control. Other tools include flow charts, histograms, cause-and-effect diagrams, check sheets, Pareto diagrams, graphs, and scatter diagrams. A control chart is simply a graph which indicates process variation over time. The purpose of drawing a control chart is to detect any changes in the process, signalled by abnormal points or patterns on the graph. The Artificial Intelligence Support Center (AISC) of the Acquisition Logistics Division (ALDIJTI) has developed a hybrid machine-learninglexpert-system prototype which automates the process of constructing and interpreting control charts.
INTRODUCTION
The Air Force Logistics Command (AFLC) has provided TQM and Quality Control training to its employees for several years now. In particular, Statistical Process Control has been emphasized in this effort. While many data collection efforts have been undertaken within AFLC, the SPC Quality Control tool has been under-utilized due to the lack of experienced personnel to identify and interpret patterns within the control charts. The AISC has developed a prototype software tool which draws control charts, identifies various chart patterns, advises what each pattern means, and suggests possible corrective actions. The application is easily modifiable for process specific applications through simple modifications to the knowledge base portion using any word processing software.
The remainder of this paper consists of the following sections :
(1) CONTROL CHARTS (2) SOFTWARE FUNCTIONALITY (3) SOFTWARE DESIGN (4) MACHINE LEARNING (5) EXPERT SYSTEM (6) CONCLUSION
Section (1) provides a more in-depth explanation of the purpose of control charts. Section (2) details the initial functional requirements for the SPC software, and section (3) outlines the design approach used to implement the system requirements. Sections (4) and (5) examine in detail the roles of machine learning and expert system techniques respectively. Finally, section (6) offers some basic conclusions resulting from this effort. Two attachments are included after the references. ATTACHMENT A provides a list of the chart patterns of interest and their methods of identification. ATTAC B enumerates and explains the twenty statistical features used by the machine learning tool.
https://ntrs.nasa.gov/search.jsp?R=19920007361 2018-05-17T23:35:10+00:00Z
CONTROL CHARTS
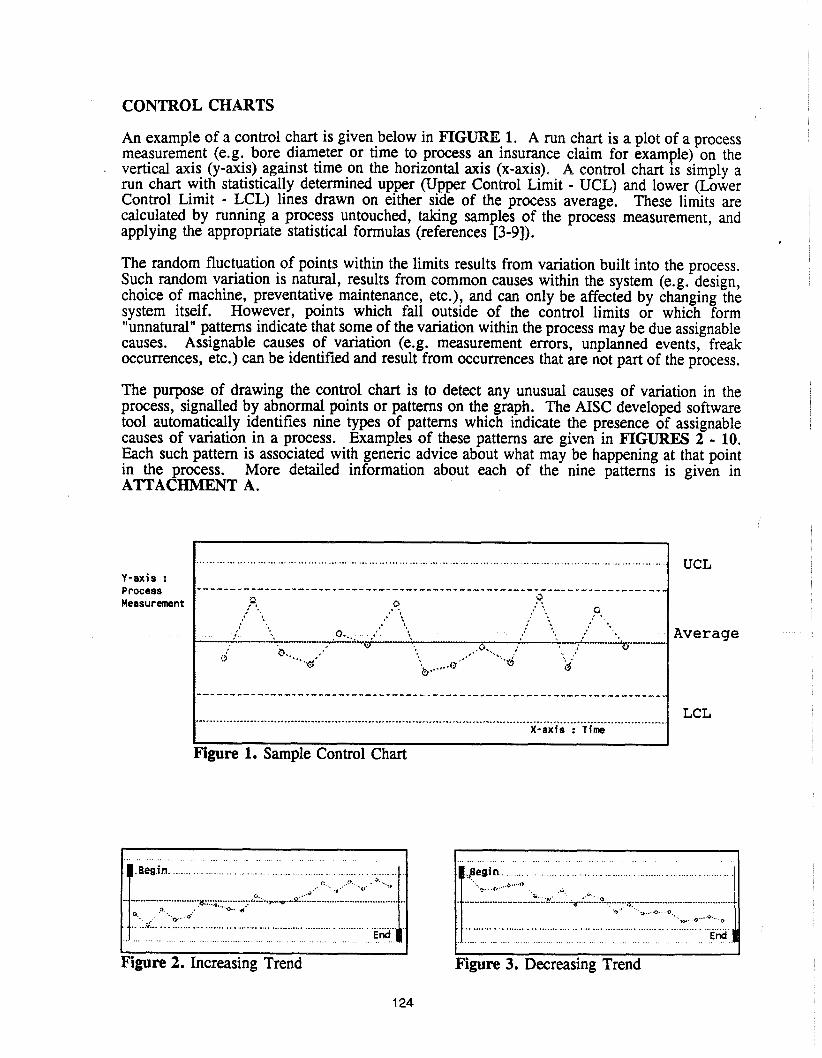
An example of a control chart is given below in FIGURE 1. A pun chart is a plot of a process measurement (e.g. bore diameter or time to process an insurance claim for example) on the vertical axis (y-axis) against time on the horizontal axis (x-axis). A control chart is simply a run chart with statistically determined upper (Upper Control Limit - UCL) and lower (Lower Control Limit - LCL) lines drawn on either side of the process average. These limits are calculated by running a process untouched, taking samples of the process measurement, and applying the appropriate statistical formulas (references [3-91).
The random fluctuation of points within the limits results from variation built into the process. Such random variation is natural, results from common causes within the system (e.g. design, choice of machine, preventative maintenance, etc.), and can only be affected by changing the system itself. However, points which fall outside of the control limits or which form "unnatural" patterns indicate that some of the variation within the process may be due assignable causes. Assignable causes of variation (e.g. measurement errors, unplanned events, freak occurrences, etc.) can be identified and result from occurrences that are not part of the process.
The purpose of drawing the control chart is to detect any unusual causes of variation in the process, signalled by abnormal points or patterns on the graph. The AISC developed software tool automatically identifies nine types of patterns which indicate the presence of assignable causes of variation in a process. Examples of these patterns are given in FIGURES 2 - 10. Each such pattern is associated with generic advice about what may be happening at that point in the process. More detailed information about each of the nine patterns is given in ATTACHMENT A.
........................................................................................................................................... Y-axis : Process --"-----"-----"---------------------------*---------------------------
-v ;.- s.k
:> Measurement , , . . .? I? . ,
, . . , . . . . 5 , . . . . 2 .
P. s . , . . .
: ': , * . . . . . . . .
.Q..... .: - I
.G.,.. j .+ .I G., .-%.a,*' ... . . . . . . . . I - a , , .. : '.,-d : - .b .... "0 S
UCL
Average
........................................................................................................................................... I X-axis : Time C I
Figure 1. Sample Control Chart
I I
Figure 2. Increasing Trend
LCL
. . . . . . . . . . . . . . . . . . . . . . . . . . . . . . . . . . . . . . . . . . .
.............................................................. ,,"..>%
. . . . . . ..... , ...... 1 * .*..* - .*. '. "., e... -*-. . O
End
Figure 3. Decreasing Trend
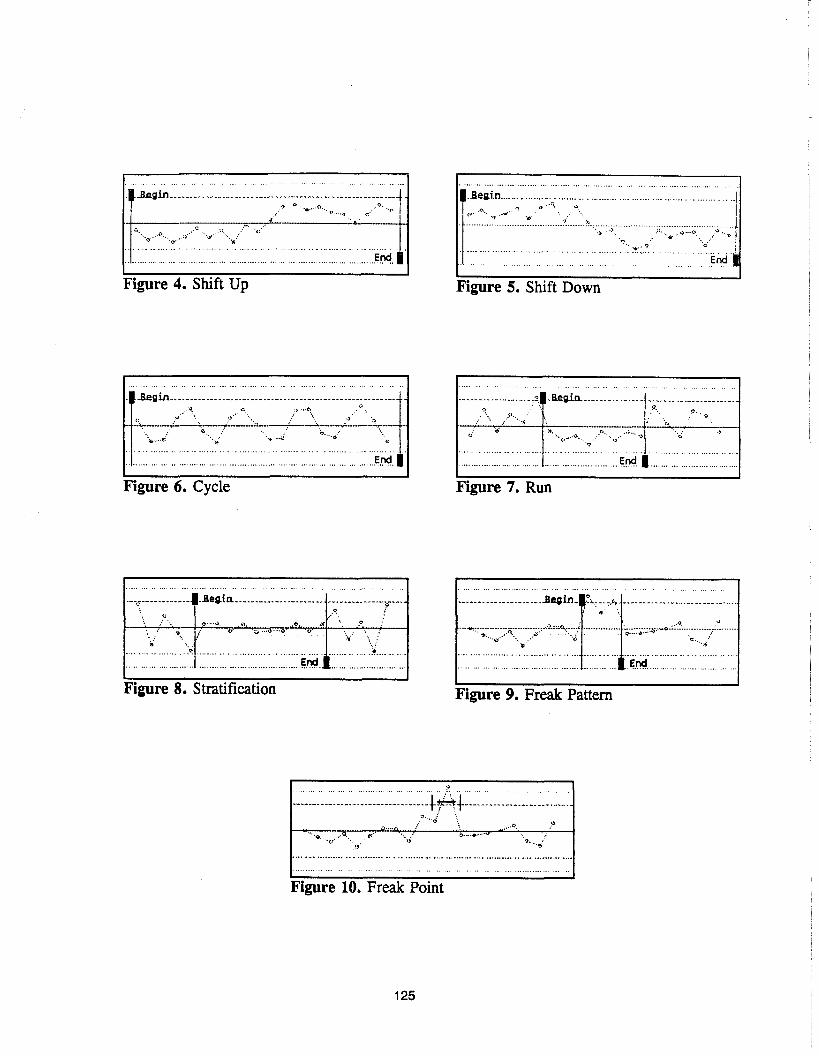
Figure 4. Shift Up
lkgh;;: ------ ;;,;;;,:;;- --- -;;;--:;;:- --- A:;-;:::;;;- --11 <: ..
'- - .. . . . 2 i. : a,. : :. .. b..., .... b. ..': ,! ':, ..e <>
............................................................................ End. .....................................................................................
1 I
Figure 6. Cycle
I I
Figure 8. Stratification
.............................................................................. ........................................................................ ..I
.......
Figure 5. Shift Down
I I
Figure 7. Run
. . . . . . . . . . . . . . . . . . . . . . . . . . . . . . . . . . . . . . . . . . . . . . . . . . . . . . . . . . . . . . . . . . .... ............................. ..................... Begin- b J, i' ...... ............... ....... .... :... ?;::.u, t - .........S-r - e-::?: ~1'.
. * ....v... -... ..*' *...*.." . . . . 't: .., : b 'd
................................................................................... 1 .............................................................................
I I Figure 9. Freak Pattern
. . . . . . . . . . . . . . . . . . . . . . . . . . . . . . . . . . . . . . . . . . . . . . . . . . . . . . .
Figure 10. Freak Point
SOFTWARE: F'UNCTIONALITY
An overview of the functionality of the application (referred to as SPQ is given below :
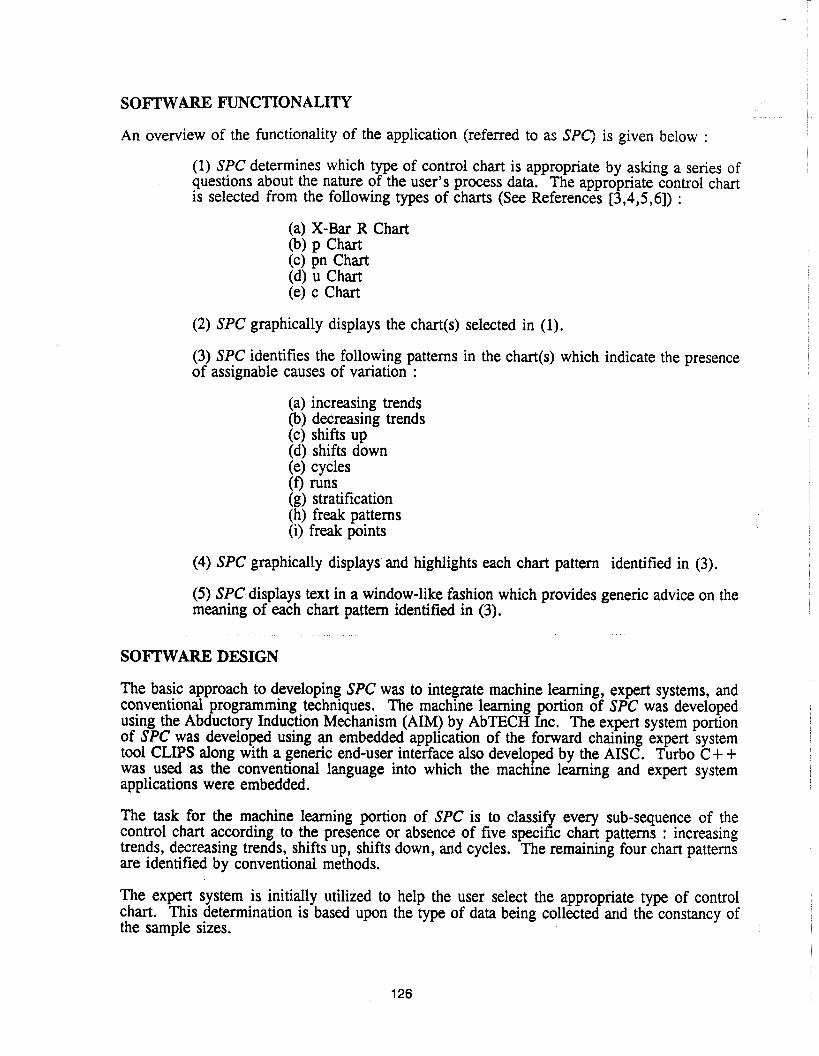
(1) SPC determines which type of control chart is appropriate by asking a series of questions about the nature of the user's process data. The appropriate control chart is selected from the following types of charts (See References [3,4,5,6]) :
(a) X-Bar R Chart ibj p Chart (c) pn Chart (d) u Chart (e) c Chart
(2) SPC graphically displays the chart(s) selected in (1).
(3) SPC identifies the following patterns in the chart(s) which indicate the presence of assignable causes of variation :
(a) increasing trends (b) decreasing trends (c) shifts up (d) shifts down (e) cycles (f) rllns (g) stratification (h) freak patterns (i) freak points
(4) SPC graphically displays and highlights each chart pattern identified in (3).
(5) SPC displays text in a window-like fashion which provides generic advice on the meaning of each chart pattern identified in (3).
SOFTWARE DESIGN
The basic approach to developing SPC was to integrate machine learning, expert systems, and conventional programming techniques. The machine learning portion of SPC was developed using the Abductory Induction Mechanism (AIM) by AbTECH Inc. The expert system portion of SPC was developed using an embedded application of the forward chaining expert system tool CLIPS along with a generic end-user interface also developed by the AISC. Turbo C+ + was used as the conventional language into which the machine learning and expert system applications were embedded.
The task for the machine learning portion of SPC is to classify every sub-sequence of the control chart according to the presence or absence of five specific chart patterns : increasing trends, decreasing trends, shifts up, shifts down, and cycles. The remaining four chart patterns are identified by conventional methods.
The expert system is initially utilized to help the user select the appropriate type of control chart. This determination is based upon the type of data being collected and the constancy of the sample sizes.
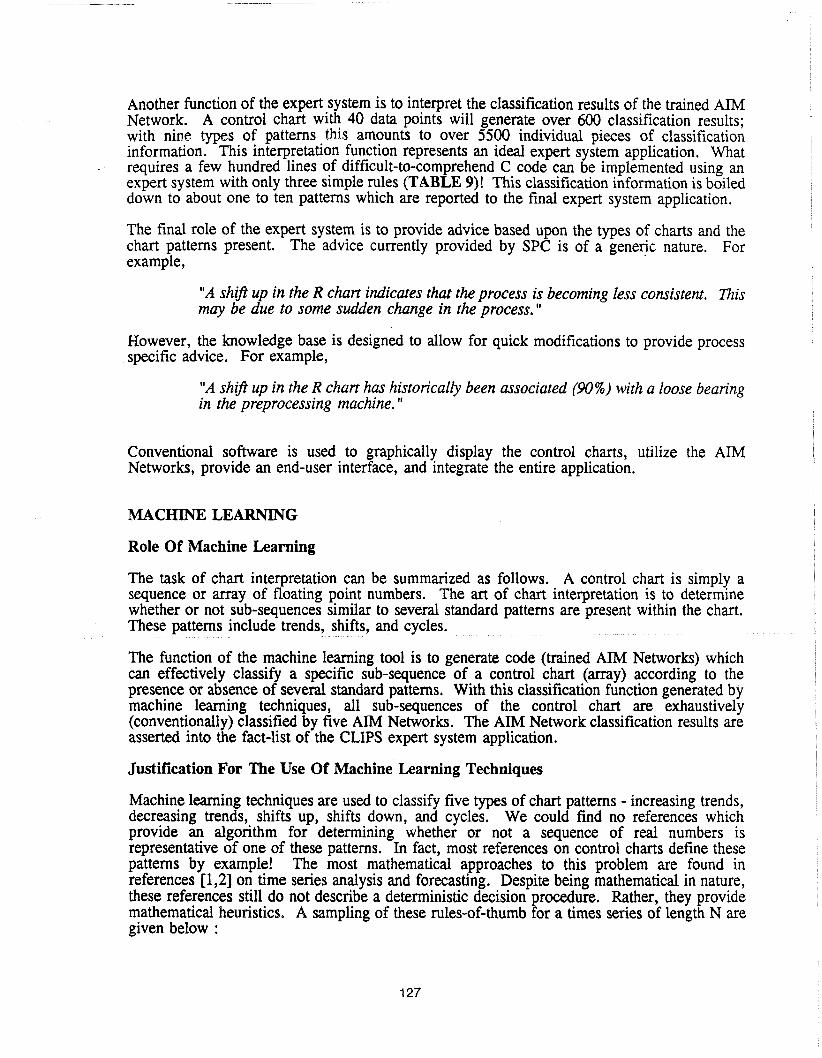
Another function of the expert System is to interpret the classification results of the trained AIM Network. A control chart with 40 data points will generate over 600 classification results; with nine types of patterns this amounts to over 5500 individual pieces of classification information. This interpretation function represents an ideal expert system application. What requires a few hundred lines of difficult-to-comprehend C code can be implemented using an expert system with only three simple rules (TABLE 9)! This classification information is boiled down to about one to ten patterns which are reported to the final expert system application.
The final role of the expert system is to provide advice based upon the types of charts and the chart patterns present. The advice currently provided by SPC is of a generic nature. For example,
"A shzj2 up in the R chart indicates that the process is becoming less consistent. This may be due to some sudden change in the process."
However, the knowledge base is designed to allow for quick modifications to provide process specific advice. For example,
"A shiji up in the R chart has historically been associated (90%) with a loose bearing in the preprocessing machine."
Conventional software is used to graphically display the control charts, utilize the AIM Networks, provide an end-user interface, and integrate the entire application.
MACHINE LEARNING
Role Of Machine Learning
The task of chart interpretation can be summarized as follows. A control chart is simply a sequence or array of floating point numbers. The art of chart interpretation is to determine whether or not sub-sequences similar to several standard patterns are present within the chart.
The function of the machine learning tool is to generate code (trained AIM Networks) which can effectively classif a specific sub-sequence of a control chart (array) according to the presence or absence o ?' several standard patterns. With this classification function generated by machine learning techniques, all sub-sequences of the control chart are exhaustively (conventionally) classified by five AIM Networks. The AIM Network classification results are asserted into the fact-list of the CLIPS expert system application.
Justification For The Use Of Machine Learning Techniques
Machine learning techniques are used to classify five types of chart patterns - increasing trends, decreasing trends, shifts up, shifts down, and cycles. We could find no references which provide an algorithm for determining whether or not a sequence of real numbers is representative of one of these patterns. In fact, most references on control charts define these patterns by example! The most mathematical approaches to this problem are found in references [1,2] on time series analysis and forecasting. Despite being mathematical in nature, these references still do not describe a deterministic decision procedure. Rather, they provide mathematical heuristics. A sampling of these rules-of-thumb for a times series of length N are given below :
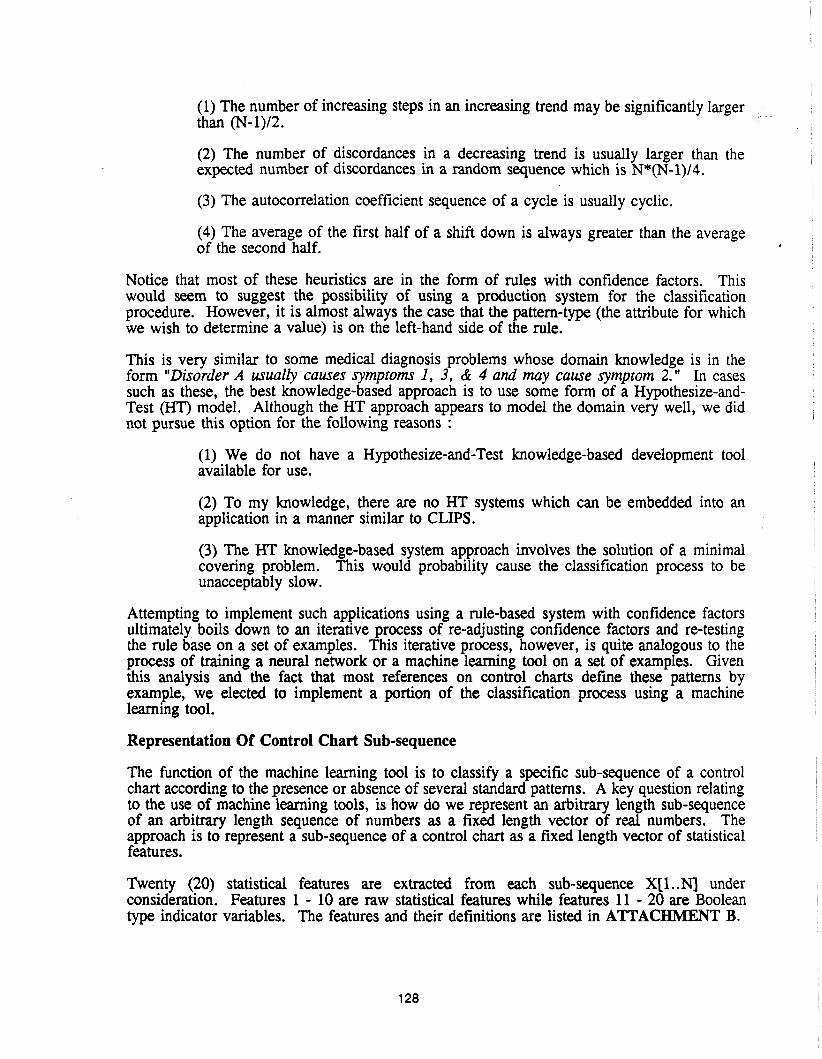
(1) The number of increasing steps in an increasing trend may be significantly larger than (N- 1)/2.
(2) The number of discordances in a decreasing trend is usually larger than the expected number of discordances in a random sequence which is N*(N-1)/4.
(3) The autocorrelation coefficient sequence of a cycle is usually cyclic.
(4) The average of the first half of a shift down is always greater than the average of the second half.
Notice that most of these heuristics are in the form of rules with confidence factors. This would seem to suggest the possibility of using a production system for the classification procedure. However, it is almost always the case that the pattern-type (the attribute for which we wish to determine a value) is on the left-hand side of the rule.
This is very similar to some medical diagnosis problems whose domain knowledge is in the form "Disorder A usually causes symptoms 1, 3, & 4 and may cause symptom 2." In cases such as these, the best knowledge-based approach is to use some form of a Hypothesize-and- Test (HT) model. Although the HI' approach appears to model the domain very well, we did not pursue this option for the following reasons :
(1) We do not have a Hypothesize-and-Test knowledge-based development tool available for use.
(2) To my knowledge, there are no HT systems which can be embedded into an application in a manner similar to CLIPS.
(3) The HT knowledge-based system approach involves the solution of a minimal covering problem. This would probability cause the classification process to be unacceptably slow.
Attempting to implement such applications using a rule-based system with confidence factors ultimately boils down to an iterative process of re-adjusting confidence factors and re-testing the rule base on a set of examples. This iterative process, however, is quite analogous to the process of training a neural network or a machine learning tool on a set of examples. Given this analysis and the fact that most references on control charts define these patterns by example, we elected to implement a portion of the classification process using a machine learning tool.
Representation Of Control Chart Sub-sequence
The function of the machine learning tool is to classify a specific sub-sequence of a control chart according to the presence or absence of several standard patterns. A key question relating to the use of machine learning tools, is how do we represent an arbitrary length sub-sequence of an arbitrary length sequence of numbers as a fixed length vector of real numbers. The approach is to represent a sub-sequence of a control chart as a fixed length vector of statistical features.
Twenty (20) statistical features are extracted from each sub-sequence X[l..NJ under consideration. Features 1 - 10 are raw statistical features while features 11 - 20 are Boolean type indicator variables. The features and their definitions are listed in ATTAC T B.
Training And Test Sets For Machine Learning Tool
Over 70,000 sample chart sub-sequences were generated to train and test the AIM Networks. Most of these sub-sequences were generated by adding random noise to existing control charts with existing patterns. Each hart sub-sequence generated a trainingltest vector of dimension 25 - 20 real-valued Network inputs (statistical features) and 5 bi-polar (-1 or 1) outputs. One AIM Network was trained for each of the 5 outputs. Each AIM Network required from two to six hours to train on a 386 machine with math co-processor.
Machine Learning Test Results
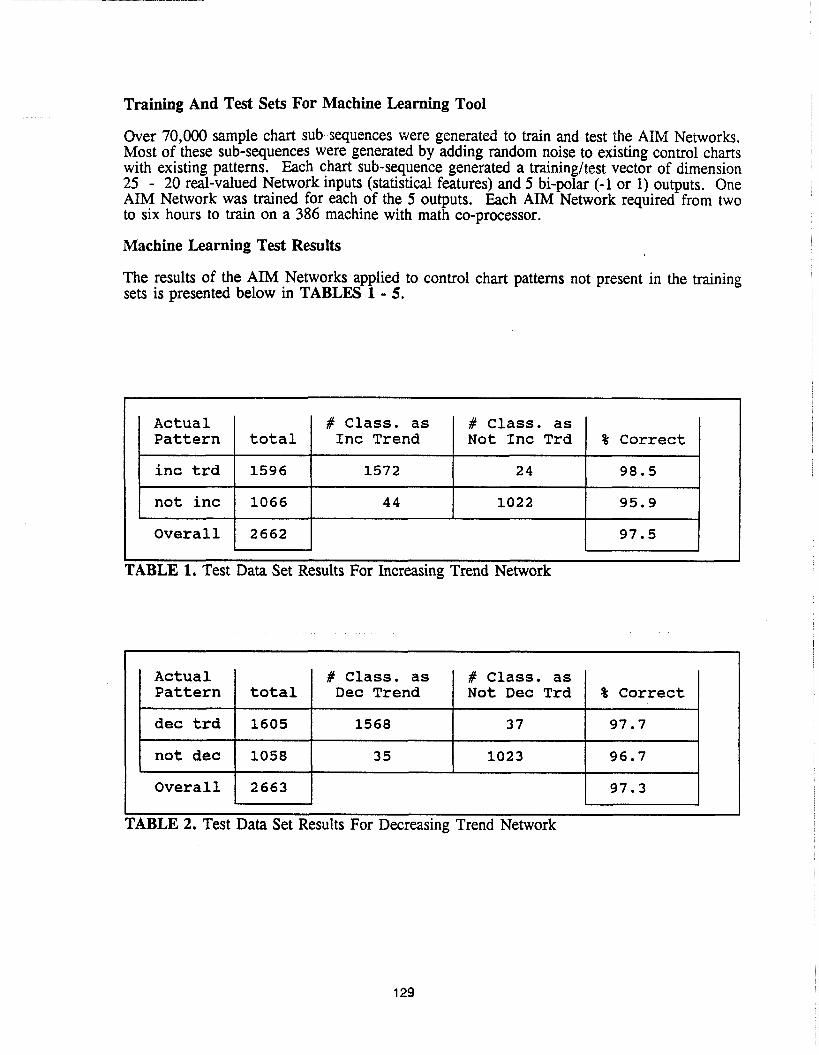
The results of the AIM Networks applied to control chart patterns not present in the training sets is presented below in TABLES 1 - 5.
Actual # Class. as # Class. as Pattern total Inc Trend Not Inc Trd % Correct
inc trd 1596 1572 24 98.5
notinc 1066 44 1022 95.9
Overall 2662 97.5 - 'ABLE 1. Test Data Set Results For Increasing Trend Network
Actual Pattern
dec trd
not dec
Overall
FABLE 2. Test Data Set Results For Decreasing Trend Network
total
1605
1058
2663
# Class. as Dec Trend
1568
35
97.3
# Class. as Not Dec Trd
37
1023
% Correct
97.7
96.7
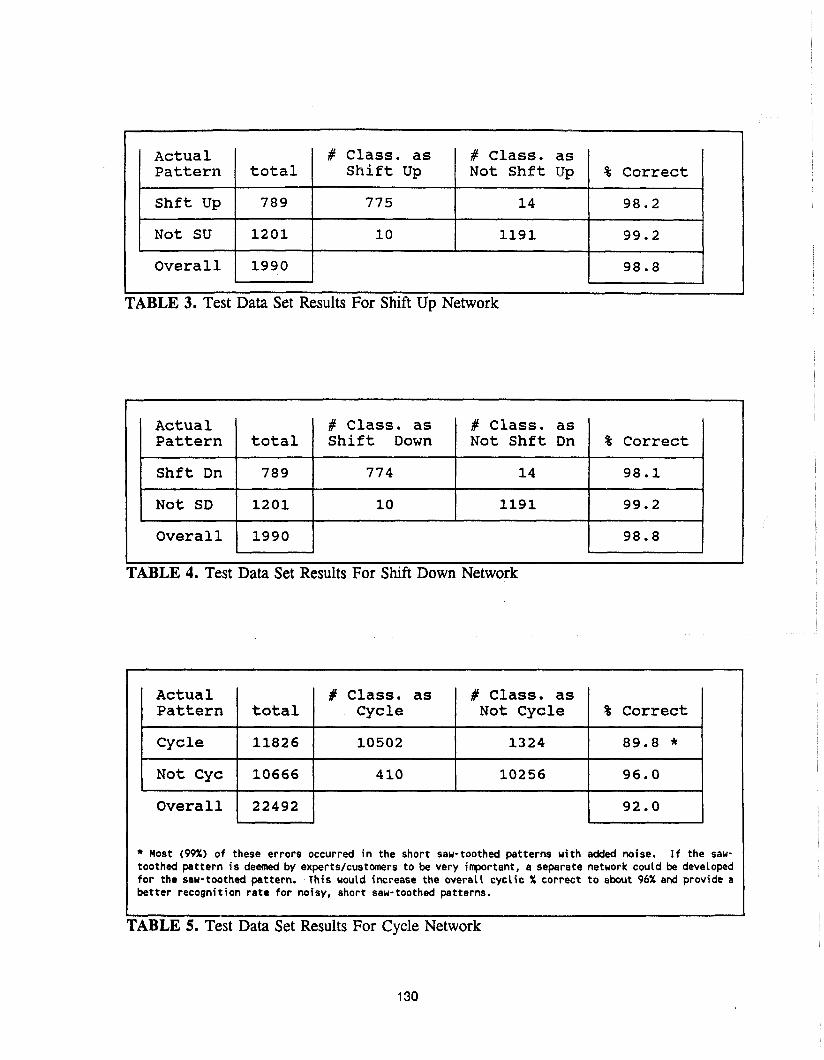
Overall 1 1990 1 1 98.8 ] TABLE 3. Test Data Set Results For Shift Up Network
Actual Pattern
Shft Up
Not SU
TABLE 4. Test Data Set Results For Shift Down Network
# Class. as Shift Up
775
10
total
789
1201
Actual Pattern
Shft Dn
Not SD
* Most (95%) of these errors occurred i n the short saw-toothed patterns u i t h added noise. I f the saw- toothed pattern i s deemed by experts/customers t o be very inportant, a separate netxork could be developed fo r the sau-toothed pattern. This uould increase the overal l cyc l ic % correct t o about 96% and provide a better recognition ra te fo r noisy, short sau-toothed patterns.
# Class. as Not Shft Up
14
1191
# Class. as Not Shft Dn
14
1191
Actual Pattern
Cycle
NotCyc - Overall
I I
TABLE 5. Test Data Set Results For Cycle Network
% Correct
98.2
99.2
Overall
total
789
1201
% Correct
98.1
99.2
# Class. as Shift Down
774
10
1990
% Correct
89.8 * 96.0
92.0
total
11826
10666
22492
98.8
# Class. as Cycle
10502
410
# Class. as Not Cycle
1324
10256
EXPERT SYSTEM
Role Of Expert System
The role of the expert system in SPC is three-fold. One knowledge base helps the user select the type of control chart to be used, another interprets the AIM Networks' classification results, and the third knowledge base provides expert advice on the meaning of any identified patterns.
Selecting Appropriate Control Chart Type
The knowledge base for this portion of the expert system application in SPC is given below in TABLE 7. In short, the type of control chart is selected based upon (1) whether the data is attribute data or measurement data, (2) whether the logical group size is constant or variable, and (3) whether the (attribute) data is measuring defectives or defects.
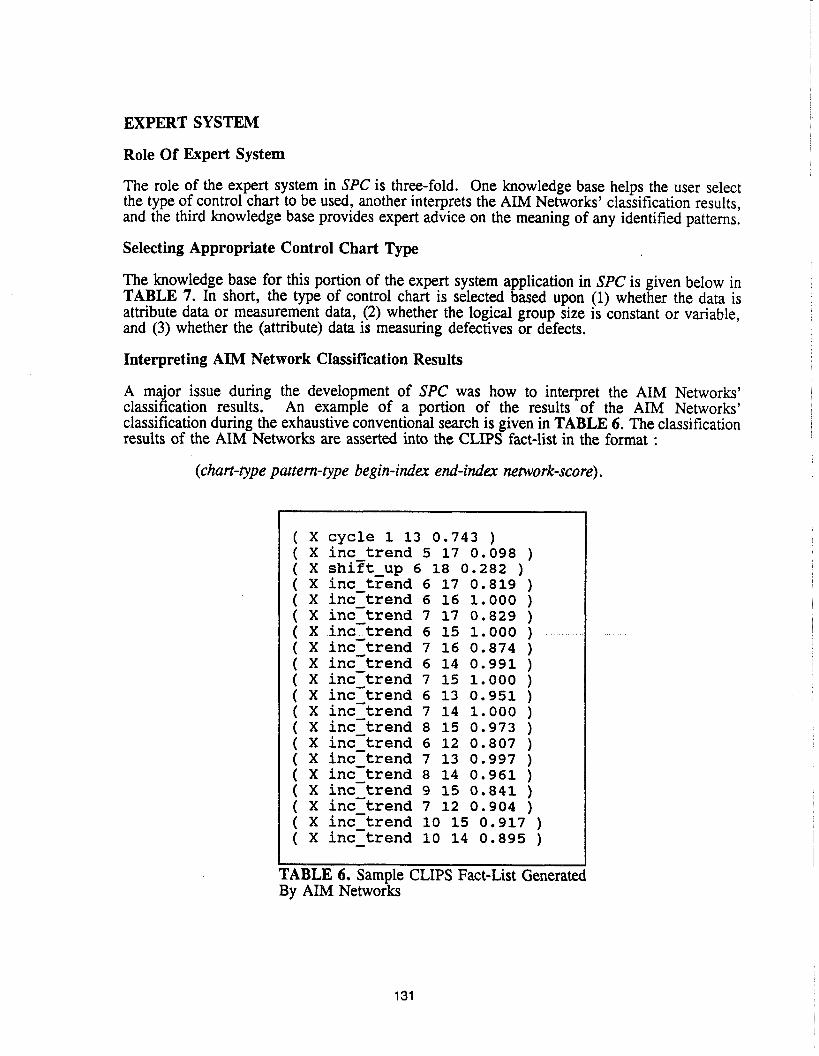
Interpreting AIM Network Classification Results
A major issue during the development of SPC was how to interpret the AIM Networks' classification results. An example of a portion of the results of the AIM Networks' classification during the exhaustive conventional search is given in TABLE 6. The classification results of the AIM Networks are asserted into the CLIPS fact-list in the format :
(chart-type pattern-type begin-index end-index network-score) .
cycle 1 13 0.743 ) inc trend 5 17 0.098 ) shi?t up 6 18 0.282 ) inc trend 6 17 0.819 ) inc-trend 6 16 1.000 ) inc-trend 7 17 0.829 ) inc-trend 6 15 1.000 ) inc-trend 7 16 0.874 ) inc-trend 6 14 0.991 ) inc-trend 7 15 1.000 ) inc-trend 6 13 0.951 ) inc-trend 7 14 1.000 ) inc-trend 8 15 0.973 ) inc-trend 6 12 0.807 ) inc-trend 7 13 0.997 ) inc-trend 8 14 0.961 ) inctrend 9 15 0.841 ) inc-trend 7 12 0.904 ) inc-trend 10 15 0.917 ) inc-trend - 10 14 0.895 )
I I
TABLE 6. Sample CLIPS Fact-List Generated By AIM Networks

(defrule data type (initial-fact)
=> (ask - question "question.idxtt Itget typen "data typeM) ) * - -
(defrule XBAR-R-Chart (data - type value)
=> (assert (chart - type XBAR R)) ) -
(defrule group size (data - type attribute)
=> (ask question "question.idx81 "get sizet8 "group sizeu)* (ask-question - t8question. idxu "get-att typet1 ttaftributew) ) * - -
(defrule PN Chart (group size constant) (attrizute defectives)
=> (assert (chart - type PN-Chart)) )
(defrule C Chart (group size constant) (attrihte defects)
=> (assert (chart - type C-Chart)) )
(defrule P Chart (group size variable) (attrihte defectives)
=> (assert (chart type P Chart)) ) - -
(defrule Chart (group-size variable) (attrihte defects)
=> (assert (chart type U-Chart)) ) -
The function ask west ion i s provided by the CLIPS Application User Interface (AUI) also developed by the AISC a t Uright-Patterson AFB, Ohio.
ABLE 7. Knowledge Base To Select Chart Type
Notice in TABLE 6 that from points 6 to 17 there are 17 sub-sequences which the AIM increasing trend Network gave high scores to! Clearly we cannot report to the user all 17 patterns. The expert system application which interprets the AIM Networks' classification results is composed of three rules :
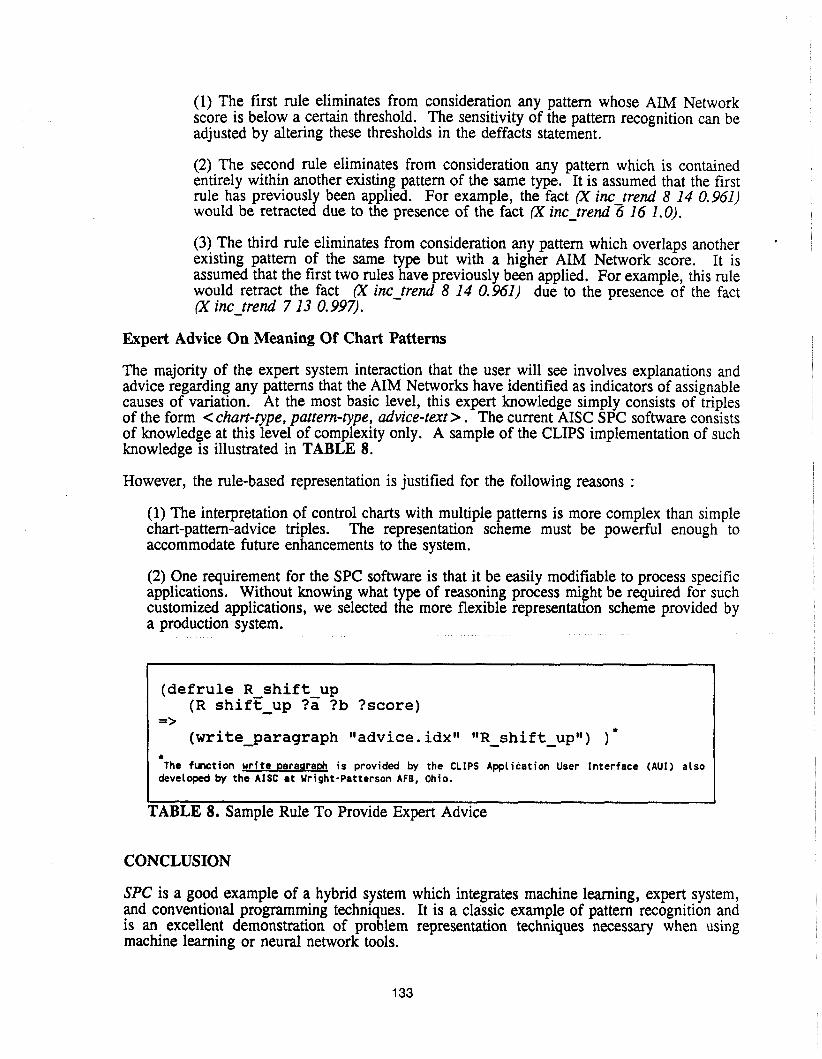
(1) The first rule eliminates from consideration any pattern whose AIM Network score is below a certain threshold. The sensitivity of the pattern recognition can be adjusted by altering these thresholds in the deffacts statement.
(2) The second rule eliminates from consideration any pattern which is contained entirely within another existing pattern of the same type. It is assumed that the first rule has previously been applied. For example, the fact (X inc-trend 8 14 0.961) would be retracted due to the presence of the fact (X inc-trend 6 16 1.0).
(3) The third rule eliminates from consideration any pattern which overlaps another *
existing pattern of the same type but with a higher AIM Network score. It is assumed that the first two rules have previously been applied. For example, this rule would retract the fact (X inc-trend 8 14 0.961) due to the presence of the fact (X inc-trend 7 13 0.997).
Expert Advice On Meaning Of Chart Patterns
The majority of the expert system interaction that the user will see involves explanations and advice regarding any patterns that the AIM Networks have identified as indicators of assignable causes of variation. At the most basic level, this expert knowledge simply consists of triples of the form < chart-type, pattern-type, advice-text > . The current AISC SPC software consists of knowledge at this level of complexity only. A sample of the CLIPS implementation of such knowledge is illustrated in TABLE 8.
However, the rule-based representation is justified for the following reasons :
(1) The interpretation of control charts with multiple patterns is more complex than simple chart-pattern-advice triples. The representation scheme must be powerful enough to accommodate future enhancements to the system.
(2) One requirement for the SPC software is that it be easily modifiable to process specific applications. Without knowing what type of reasoning process might be required for such customized applications, we selected the more flexible representation scheme provided by a production system.
(defrule R shift up (R shifE - up ?a ?b ?score)
=> (write - paragraph "advice. idxIt "R - shift - upw) ) *
The f m c t i o n wr i te mraaraph i s provided by the CLIPS Application User Interface (AUI) also developd by the A I S C a t Uright-Patterson AFB, Ohio. I
I 1 TABLE 8. Sample Rule To Provide Expert Advice
CONCLUSION
SPC is a good example of a hybrid system which integrates machine learning, expert system, and conventional programming techniques. It is a classic example of pattern recognition and is an excellent demonstration of problem representation techniques necessary when using machine learning or neural network tools.
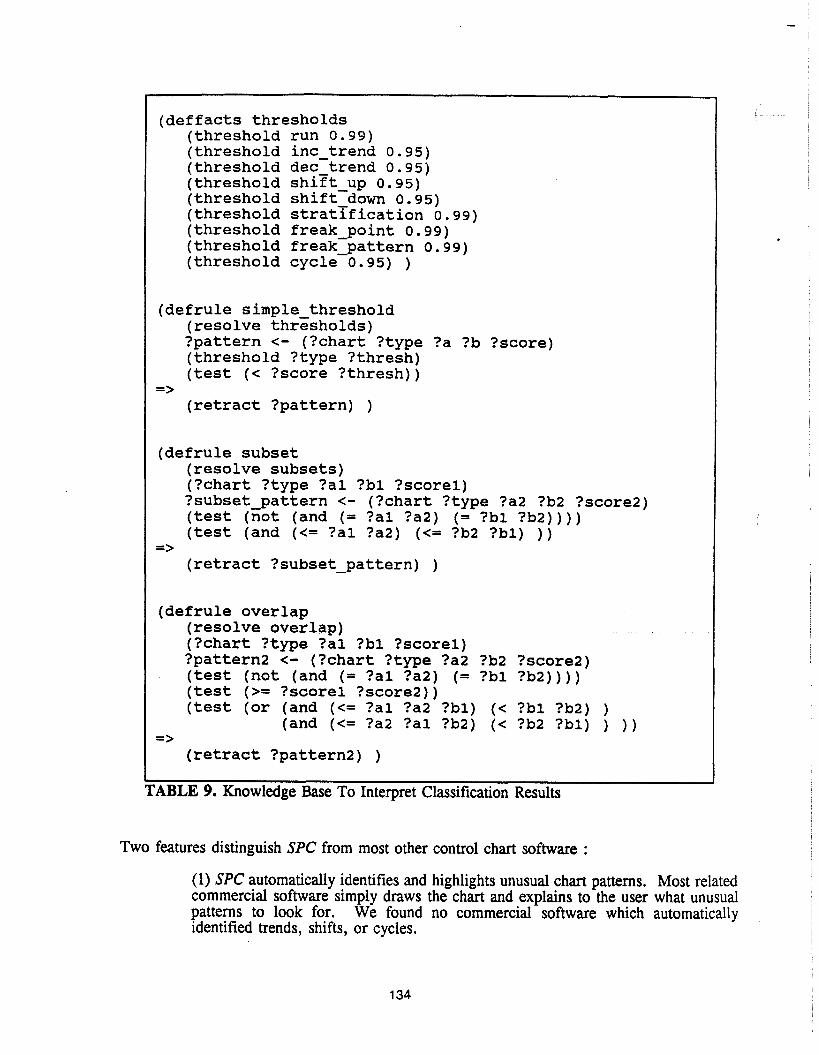
(deffacts thresholds (threshold run 0.99) (threshold inc-trend 0.95) (threshold dec-trend 0.95) (threshold shift-up 0.95) (threshold shift down 0.95) (threshold stratTfication 0.99) (threshold freak-point 0.99) (threshold freak-pattern 0.99) (threshold cycle 0.95) )
(defrule simple threshold (resolve thresholds) ?pattern <- (?chart ?type ?a ?b ?score) (threshold ?type ?thresh) (test (< ?score ?thresh))
=> (retract ?pattern) )
(defrule subset (resolve subsets) (?chart ?type ?a1 ?bl ?scorel) ?subset pattern <- (?chart ?type ?a2 ?b2 ?score2) (test (not (and (= ?a1 ?a2) (= ?bl ?b2)))) (test (and (<= ?a1 ?a2) (<= ?b2 ?bl) ) )
=> (retract ?subset - pattern) )
(defrule overlap (resolve overlap) (?chart ?type ?a1 ?bl ?morel) ?pattern2 <- (?chart ?type ?a2 ?b2 ?score2) (test (not (and (= ?a1 ?a2) (= ?bl ?b2)))) (test (>= ?score1 ?score2)) (test (or (and (<= ?a1 ?a2 ?bl) (< ?bl ?b2) )
(and (<= ?a2 ?a1 ?b2) (< ?b2 ?bl) ) ) ) =>
(retract ?pattern2) )
I 1 TABLE 9. Knowledge Base To Interpret Classification Results
Two features distinguish SPC from most other control chart software :
(1) SPC automatically identifies and highlights unusual chart patterns. Most related commercial software simply draws the chart and explains to the user what unusual patterns to look for. We found no commercial software which automatically identified trends, shifts, or cycles.
(2 ) SPC provides expert advice on the meaning of all identified unusual chart patterns. Over 50% of available commercial software only construct the control chart for the user and go no further.
The first version of SPC is scheduled to be available by September 1991 and will be distributed with an AFLC sponsored course on Statistical Process Control. . The AISC plans to provide software enhancements to SPC based upon future customer feedback and demand. Also, the AISC hopes to provide some customers with customized versions of SPC for process specific applications. Copies of SPC and reprints of this paper are available to government agencies upon request.
REFERENCES
[1] Spyros Makridakis and Stephen C. Wheelwright, "Forecasting: Methods and Applications", WileyIHamilton, 1978.
[2] Sir Maurice Kendall and J Keith Ord, "Time Series", Oxford University Press, 1990.
[3] SPC Course Materials, Decision Dynamics Inc., 1990
[4] Kaoru Ishikawa, "Guide to Quality Control", Asian Productivity Organization, 1982.
[5] Perry Johnson Inc., "SPC Chart Interpretation", Perry Johnson, Inc., 1987.
[6] J.M. Juran, Dr. Frank M. Gryna, Jr., and R.S. Bingham, Jr., "Quality Control Handbook" ,Third Edition, McGraw-Hill, 1974.
[7] Western Electric Company, "Statistical Quality Control Handbook", Western Ellectric Co., Inc., 1958.
[8] H. Besterfield, "Quality Control", Second Edition, Prentice-Hall.
[9] Douglas C. Montogomery, "Introduction to Statistical Quality Control".
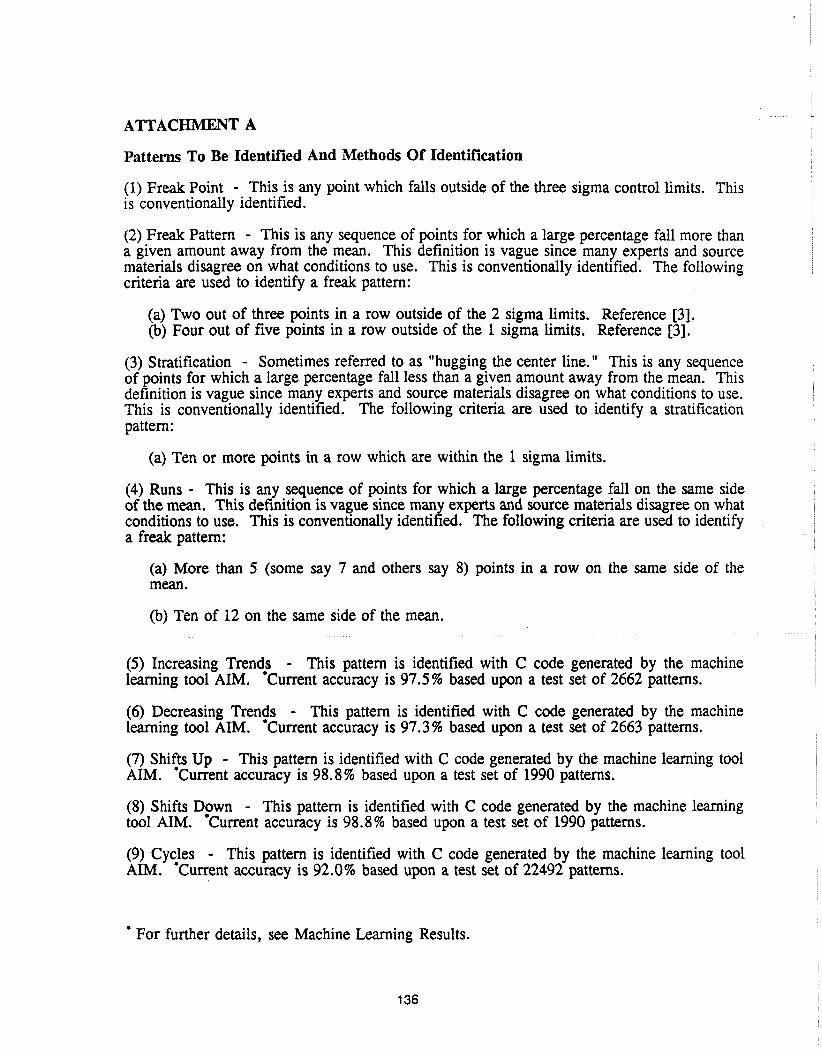
Patterns To Be Identified And Methods Of Identification
(1) Freak Point - This is any point which falls outside of the three sigma control limits. This is conventionally identified.
(2) Freak Pattern - This is any sequence of points for which a large percentage fall more than a given amount away from the mean. This definition is vague since many experts and source materials disagree on what conditions to use. This is conventionally identified. The following criteria are used to identify a freak pattern:
(a) Two out of three points in a row outside of the 2 sigma limits. Reference [3]. (b) Four out of five points in a row outside of the 1 sigma limits. Reference [3].
(3) Stratification - Sometimes referred to as "hugging the center line." This is any sequence of points for which a large percentage fall less than a given amount away from the mean. This definition is vague since many experts and source materials disagree on what conditions to use. This is conventionally identified. The following criteria are used to identify a stratification pattern:
(a) Ten or more points in a row which are within the 1 sigma limits.
(4) Runs - This is any sequence of points for which a large percentage fall on the same side of the mean. This definition is vague since man experts and source materials disagree on what
a freak pattern: J conditions to use. This is conventionally identi led. The following criteria are used to identify
(a) More than 5 (some say 7 and others say 8) points in a row on the same side of the mean.
(b) Ten of 12 on the same side of the mean.
(5) Increasing Trends - This pattern is identified with C code generated by the machine learning tool AIM. *Current accuracy is 97.5% based upon a test set of 2662 patterns.
(6) Decreasing Trends - This pattern is identified with C code generated by the machine learning tool AIM. 'Current accuracy is 97.3% based upon a test set of 2663 patterns.
(7) Shifts Up - This pattern is identified with C code generated by the machine learning tool AIM. 'Current accuracy is 98.8% based upon a test set of 1990 patterns.
(8) Shifts Down - This pattern is identified with C code generated by the machine learning tool AIM. 'Current accuracy is 98.8% based upon a test set of 1990 patterns.
(9) Cycles - This pattern is identified with C code generated by the machine learning tool AIM. 'Current accuracy is 92.0% based upon a test set of 22492 patterns.
* For further details, see Machine Learning Results.
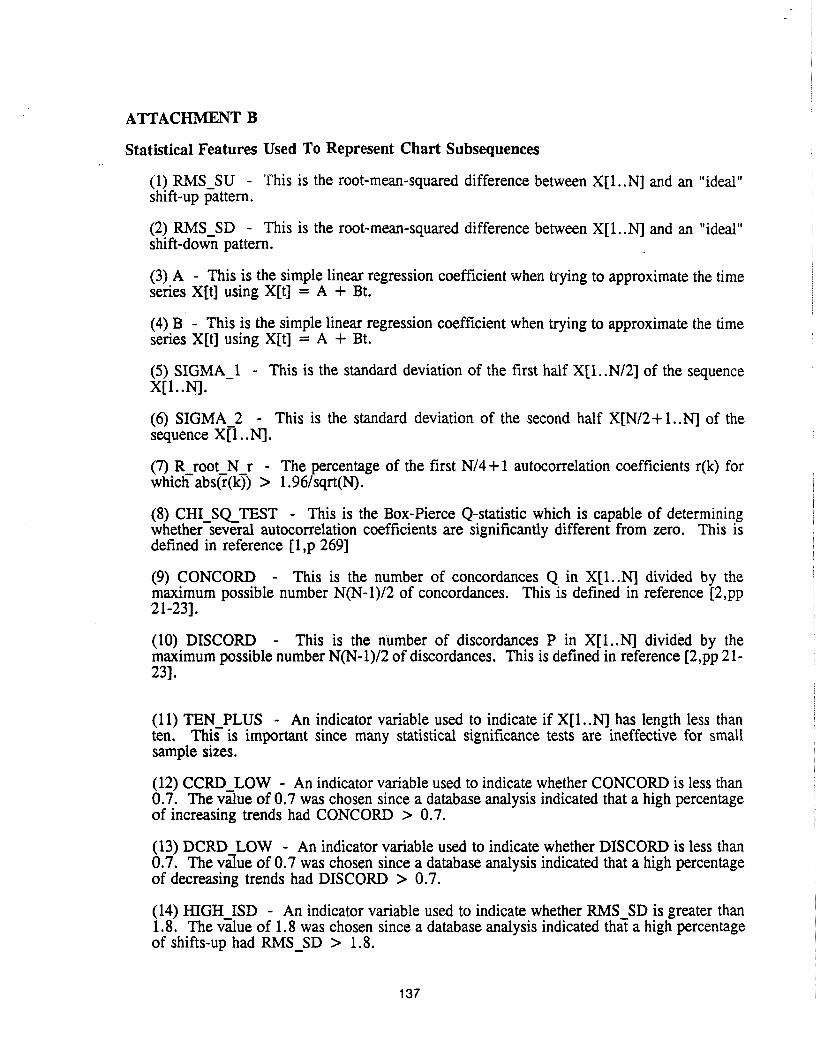
ATTACHMENT B
Statistical Features Used To Represent Chart Subsequences
(1) RMS-SU - This is the root-mean-squared difference between X[1. .N] and an "ideal" shift-up pattern.
(2) RMS-SD - This is the root-mean-squared difference between X[l..N] and an "ideal" shift-down pattern.
(3) A - This is the simple linear regression coefficient when trying to approximate the time series X[t] using X[t] = A + Bt.
(4) B - This is the simple linear regression coefficient when trying to approximate the time series X[t] using X[t] = A + Bt.
(5) SIGMA-1 - This is the standard deviation of the first half X[1. .N/2] of the sequence X[l..N].
(6) SIGMAZ - This is the standard deviation of the second half Xm/2+1..N] of the sequence X[l..N].
(7) R-root-N r - The percentage of the first N/4+ 1 autoconelation coefficients r(k) for which abs(r(kJ) > 11.96/sqrt(N).
(8) CHI-SQTEST - This is the Box-Pierce Q-statistic which is capable of determining whether several autocorrelation coefficients are significantly different from zero. This is defined in reference [1 ,p 2691
(9) CONCORD - This is the number of concordances Q in X[l..Nl divided by the maximum possible number N(N-1)/2 of concordances. hisi is defined in reference i2,pp 21-23].
(10) DISCORD - This is the number of discordances P in X[l..N] divided by the maximum possible number N(N-1)/2 of discordances. This is defined in reference [2,pp 2 1- 231.
(1 1) TEN-PLUS - An indicator variable used to indicate if X[1. .N] has length less than ten. This is important since many statistical significance tests are ineffective for small sample sizes.
(12) CCRD-LOW - An indicator variable used to indicate whether CONCORD is less than 0.7. The value of 0.7 was chosen since a database analysis indicated that a high percentage of increasing trends had CONCORD > 0.7.
(13) DCRD-LOW - An indicator variable used to indicate whether DISCORD is less than 0.7. The value of 0.7 was chosen since a database analysis indicated that a high percentage of decreasing trends had DISCORD > 0.7.
(14) HIGH-ISD - An indicator variable used to indicate whether RMS-SD is greater than 1.8. The value of 1.8 was chosen since a database analysis indicated that a high percentage of shifts-up had RMS - SD > 1.8.
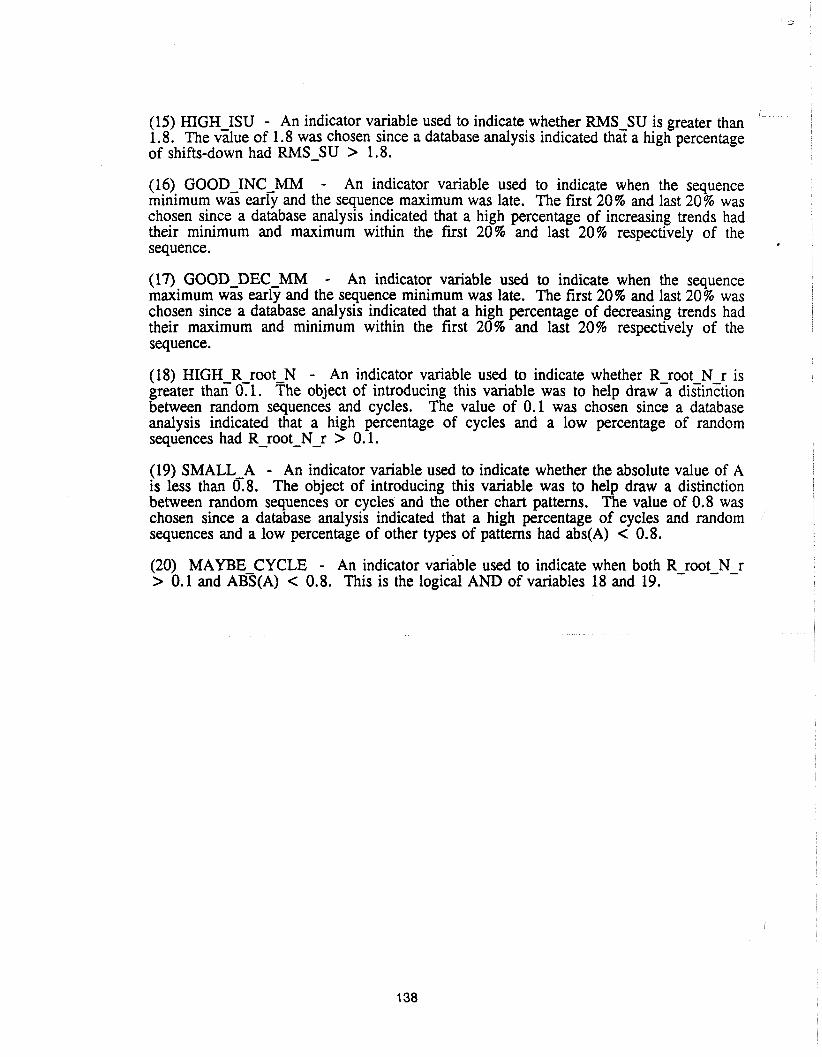
(15) HIGH-ISU - An indicator variable used to indicate whether RMS-SU is greater than 1.8. The value of 1.8 was chosen since a database analysis indicated that a high percentage of shifts-down had RMS-SU > 1.8.
(16) GOOD-INC-MM - An indicator variable used to indicate when the sequence minimum was early and the sequence maximum was late. The first 20% and last 20% was chosen since a database analysis indicated that a high percentage of increasing trends had their minimum and maximum within the first 20% and last 20% respectively of the sequence.
(17) GOOD-DEC-MM - An indicator variable used to indicate when the sequence maximum was early and the sequence minimum was late. The first 20% and last 20% was chosen since a database analysis indicated that a high percentage of decreasing trends had their maximum and minimum within the first 20% and last 20% respectively of the sequence.
(18) HIGH-R-root-N - An indicator variable used to indicate whether R-root N-r is greater than 0.1. The object of introducing this variable was to help draw a dizinction between random sequences and cycles. The value of 0.1 was chosen since a database analysis indicated that a high percentage of cycles and a low percentage of random sequences had R-root-N-r > 0.1.
(19) SMALL-A - An indicator variable used to indicate whether the absolute value of A is less than 0.8. The object of introducing this variable was to help draw a distinction between random sequences or cycles and the other chart patterns. The value of 0.8 was chosen since a database analysis indicated that a high percentage of cycles and random sequences and a low percentage of other types of patterns had abs(A) < 0.8.
(20) MAYBE CYCLE - An indicator variable used to indicate when both R-root-N-r > 0.1 and AB~(A) < 0.8. This is the logical AND of variables 18 and 19.