APPLICATION OF GROUND PENETRATING RADAR …recognized. The radar frequencies of from one to several...
6
International Research Journal of Engineering and Technology (IRJET) e-ISSN: 2395 -0056 Volume: 03 Issue: 01 | Jan-2016 www.irjet.net p-ISSN: 2395-0072 © 2016, IRJET ISO 9001:2008 Certified Journal Page 48 APPLICATION OF GROUND PENETRATING RADAR (GPR) IN DETECTING TARGET OF INTEREST Muhamad Afiq Saharudin 1 , M.M. Nordiana 2 , A.N. Nordiana 1 , Umi Maslinda 1 1 Geophysics Postgraduate Student, Geophysics Section, School of Physics, 11800 Universiti Sains Malaysia, Penang, Malaysia. 2 Geophysics Lecturer, Geophysics Section, School of Physics, 11800 Universiti Sains Malaysia, Penang, Malaysia. ---------------------------------------------------------------------***--------------------------------------------------------------------- Abstract – The research was conducted using Ground Penetrating Radar (GPR) in detecting the target of interest. The study sites with its respective targets are at the School of Language, Literacies, and Translation (SoLLAT) which the known target is the suspected cavity, the Convocation site which the known target is drainage, Desasiswa Bakti Permai which the known target is bunker and the School of Physics which the known target is pipe. The importance of this research is about travel time of electromagnetic (EM) wave velocity applied in medium while processing GPR data towards depth calculation. The graph of Amplitude vs time and Amplitude vs Depth are plotted. The depth also obtained from the equation. Both depth obtained from graph and equation are compared and their depth almost the same. The equation can be used to verify the depth of the target and different medium by using the information obtained from graph Amplitude vs Depth and Time. Key Words: Ground penetrating radar (GPR), target, travel time, depth 1. INTRODUCTION Universiti Sains Malaysia is largely consists of igneous rocks where mostly is granite. However, certain area in this campus are still well preserved and been used until today. Thus, Geophysics plays an important role in a process to identify the evidences of different targets at different places around the campus area. The ground penetrating radar geophysical method is a rapid, high- resolution tool for non-invasive investigation. Ground penetrating radar records microwave radiation that passes through the ground and is returned to the surface [1]. Ground Penetrating Radar (GPR) is a non-destructive ground survey method that can be used in assessing roads, railways, bridges, airports, tunnels and environmental objects. Its main advantage is the continuous profile it provides over the road structure and subgrade soil [2]. The GPR method has many applications in a number of fields. It provides accurate depth information of suspected target through visualization. The depth information is important to correlates the location of buried structure, which can be beneficial to the engineer and contractor to locate the utility location or specific area, before they conduct any projects. In GPR, the radar methods use the reflections of short bursts of electromagnetic energy with a range of frequencies being transmitted into the ground and register the reflected pulses as functions of time and the position of the antenna pair along a survey line. Dry soils are favorable for the GPR application, since higher radio-frequencies can be used for a given depth of investigation, which implies a better resolution of the buried structures [3]. The antenna consists of many frequencies that can be used such as 500 MHz, 250 MHz, 100 MHz antennas. Frequency, record length and sampling frequency can all be varied to some extent in most GPR studies. Frequency is the most important parameter, since it constrains the values of many other parameters because to obtain a desired spatial resolution depends on the suitable frequency that being used in the studies. Radar signals are recorded digitally and must be sampled sufficiently often to ensure that waveforms are fully defined. Ground penetrating radar can be collected fairly rapidly, and initial interpretations can be made with minimal data processing, making the use of ground penetrating radar for shallow geophysical investigation quite cost-effective [1]. 2. THEORY OF GROUND PENETRATING RADAR Radar methods use the reflections of short bursts of electromagnetic energy with a range of frequencies being transmitted into the ground and register the reflected pulses as functions of time and the position of the antenna pair along a survey line (Figure 1). These data are processed and visualized through different methods, and the signals produced by the investigated targets recognized. The radar frequencies of from one to several thousand MHz were originally thought to be too high for useful ground penetration, and ground penetrating radar (GPR) is a relatively new geophysical tool. Historically, the development of GPR derives from the use of radio echo sounding to determine any certain targets at the subsurface area [4]. Dry soils are favorable for the GPR application, since higher radio-frequencies can be used for
Transcript of APPLICATION OF GROUND PENETRATING RADAR …recognized. The radar frequencies of from one to several...
International Research Journal of Engineering and Technology (IRJET) e-ISSN: 2395 -0056
Volume: 03 Issue: 01 | Jan-2016 www.irjet.net p-ISSN: 2395-0072
© 2016, IRJET ISO 9001:2008 Certified Journal Page 48
APPLICATION OF GROUND PENETRATING RADAR (GPR) IN DETECTING
TARGET OF INTEREST
Muhamad Afiq Saharudin 1, M.M. Nordiana 2, A.N. Nordiana 1, Umi Maslinda 1
1 Geophysics Postgraduate Student, Geophysics Section, School of Physics, 11800 Universiti Sains Malaysia, Penang, Malaysia.
2 Geophysics Lecturer, Geophysics Section, School of Physics, 11800 Universiti Sains Malaysia, Penang, Malaysia.
---------------------------------------------------------------------***---------------------------------------------------------------------Abstract – The research was conducted using Ground Penetrating Radar (GPR) in detecting the target of interest. The study sites with its respective targets are at the School of Language, Literacies, and Translation (SoLLAT) which the known target is the suspected cavity, the Convocation site which the known target is drainage, Desasiswa Bakti Permai which the known target is bunker and the School of Physics which the known target is pipe. The importance of this research is about travel time of electromagnetic (EM) wave velocity applied in medium while processing GPR data towards depth calculation. The graph of Amplitude vs time and Amplitude vs Depth are plotted. The depth also obtained from the equation. Both depth obtained from graph and equation are compared and their depth almost the same. The equation can be used to verify the depth of the target and different medium by using the information obtained from graph Amplitude vs Depth and Time.
Key Words: Ground penetrating radar (GPR), target, travel time, depth
1. INTRODUCTION Universiti Sains Malaysia is largely consists of igneous rocks where mostly is granite. However, certain area in this campus are still well preserved and been used until today. Thus, Geophysics plays an important role in a process to identify the evidences of different targets at different places around the campus area. The ground penetrating radar geophysical method is a rapid, high-resolution tool for non-invasive investigation. Ground penetrating radar records microwave radiation that passes through the ground and is returned to the surface [1]. Ground Penetrating Radar (GPR) is a non-destructive ground survey method that can be used in assessing roads, railways, bridges, airports, tunnels and environmental objects. Its main advantage is the continuous profile it provides over the road structure and subgrade soil [2]. The GPR method has many applications in a number of fields. It provides accurate depth information of suspected target through visualization. The depth information is
important to correlates the location of buried structure, which can be beneficial to the engineer and contractor to locate the utility location or specific area, before they conduct any projects. In GPR, the radar methods use the reflections of short bursts of electromagnetic energy with a range of frequencies being transmitted into the ground and register the reflected pulses as functions of time and the position of the antenna pair along a survey line. Dry soils are favorable for the GPR application, since higher radio-frequencies can be used for a given depth of investigation, which implies a better resolution of the buried structures [3]. The antenna consists of many frequencies that can be used such as 500 MHz, 250 MHz, 100 MHz antennas. Frequency, record length and sampling frequency can all be varied to some extent in most GPR studies. Frequency is the most important parameter, since it constrains the values of many other parameters because to obtain a desired spatial resolution depends on the suitable frequency that being used in the studies. Radar signals are recorded digitally and must be sampled sufficiently often to ensure that waveforms are fully defined. Ground penetrating radar can be collected fairly rapidly, and initial interpretations can be made with minimal data processing, making the use of ground penetrating radar for shallow geophysical investigation quite cost-effective [1].
2. THEORY OF GROUND PENETRATING RADAR Radar methods use the reflections of short bursts of electromagnetic energy with a range of frequencies being transmitted into the ground and register the reflected pulses as functions of time and the position of the antenna pair along a survey line (Figure 1). These data are processed and visualized through different methods, and the signals produced by the investigated targets recognized. The radar frequencies of from one to several thousand MHz were originally thought to be too high for useful ground penetration, and ground penetrating radar (GPR) is a relatively new geophysical tool. Historically, the development of GPR derives from the use of radio echo sounding to determine any certain targets at the subsurface area [4]. Dry soils are favorable for the GPR application, since higher radio-frequencies can be used for

International Research Journal of Engineering and Technology (IRJET) e-ISSN: 2395 -0056
Volume: 03 Issue: 01 | Jan-2016 www.irjet.net p-ISSN: 2395-0072
© 2016, IRJET ISO 9001:2008 Certified Journal Page 49
a given depth of investigation, which implies a better resolution of the buried structures [3]. It was soon realized that some penetration was being achieved into the deeper depth of investigation, although unlikely to ever amount to more than a few tens of meters, could be increased by processing techniques virtually identical to those applied to seismic reflection data. GPR is now widely used to study about the shallow subsurface at landfill, construction, archaeological sites and many other survey sites.
Fig -1: Simplified schematic of ground penetrating radar. The time that GPR measure is two-way travel time in nanosecond (ns) pulse can converted into thickness or depth information with knowledge of the velocity of propagation in the subsurface layer, as expressed in the formula:
(1) where; d= depth v=velocity t=two-way travel time Table 1 below is the velocity of material through different medium for dry sand, wet clay, averaged soil and concrete. The velocity was used to calculate the depth. Table -1: The velocity of material through different medium [5]. Material Velocity (mm/ns)
Sand (dry) 120-170
Clay (wet) 86-110
Average soil 75
Concrete 55-112
3. STUDY AREA The study was carried out at Universiti Sains Malaysia (USM), Penang, Malaysia. The study area covered at different locations as shown in Figure 2. The first location was at School of Languages, Literacies and Translation (A), from N 5°21’23.24, E 100°18’25.72 to N 5°21’23.24, E 100°18’26.20 second location was at the convocational site (B) from N 5°21’22.9, E 100°18’08.9, to N 5°21’23.0, E 100°18’09.6, third location was at Bakti Desasiswa hostel (C) from N 5°21’21.8, E 100°18’00.5 to N 5°21’22.8, E 100°18’00.9 and the last location was at the School of Physics (D). Figure 3 and 4 show the areas of the study location.
Fig -2: Survey area of GPR in USM, Penang, Malaysia [6].
Fig -3: Survey area at Location A and B.
Fig -4: Survey area at Location C and D.
C
D
A B
A
B
C
D
International Research Journal of Engineering and Technology (IRJET) e-ISSN: 2395 -0056
Volume: 03 Issue: 01 | Jan-2016 www.irjet.net p-ISSN: 2395-0072
© 2016, IRJET ISO 9001:2008 Certified Journal Page 50
4. METHODOLOGY Ground Penetrating Radar (GPR) survey is based on measuring the electromagnetic pulses that being transmitted into the ground and then being collected by the receiver. Both of the transmitter and receiver are being placed in the antenna. The antenna frequency used during this study is 250 MHz antenna. The survey line at Location A, B and C are 30 meters length while at Location D is 12 meters length. GPR data are recorded digitally and need extensive processing using the filters. First step in GPR processing was filter the raw data for instrument noise or any irregularities in the data such as DC Removal, Time Varying Gain, and Band Pass in the GroundVision software. The data were exported into an ASCII file. Then the ASCII file is opened in Microsoft Excel, the amplitudes were chosen to produce the graphs. The graphs that produces are Amplitude vs Time and Amplitude vs Depth. The depth was calculated by using Equation 1 where the velocity was taken from Table 1 and time was taken from the graph Amplitude vs Time. The depth was obtained from the equation and being compared with the depth in the graph Amplitude vs Depth.
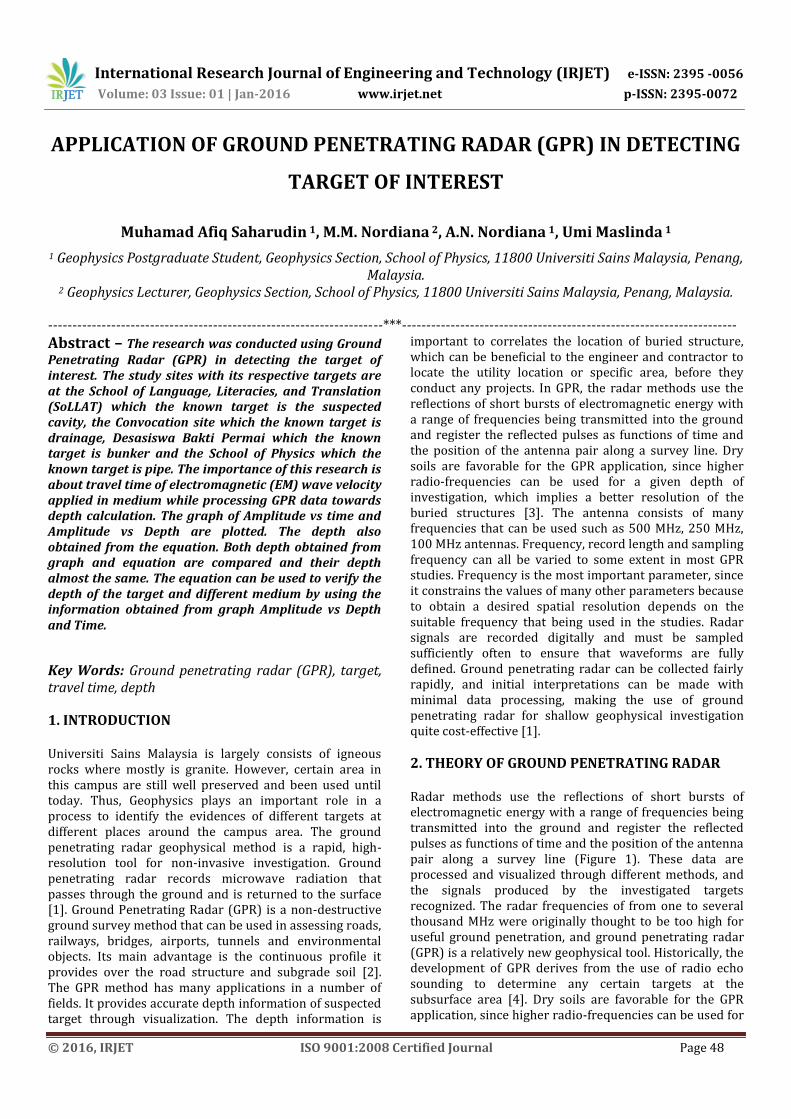
5. RESULTS AND DISCUSSION The data at Location A shows the hyperbolic curve which indicated as the target of suspected cavity (Figure 5). From Figure 5 the suspected cavity was located at depth about 1.51 meters. The Figure 6 shows the graph of Amplitude vs Depth. The graph shows the highest amplitude at 0.681792 meter depth where the medium is wet clay. The water moisture slows down the radar wave speed and it attenuates the energy [4]. Then the wave reaches another medium (air) or suspected cavity at 1.1 meter depth. The depth of the air medium is almost the same as in Figure 5 and Figure 7 shows the layer of the medium at Location A.
Fig -5: Data at Location A with target of suspected cavity.
Fig -6: The graphs of Amplitude vs Depth at Location A (suspected cavity).
Fig -7: A photo of cavity located at Location A. Figure 8 shows the hyperbolic curve for the target of drainage at Location B with depth of about 2.0 meters and the travel time is 27 ns. The graph in Figure 9 shows the highest amplitude at 1.008 meter depth where the wave reaches medium of dry sand. The penetration of the electromagnetic (EM) wave was deeper than wave penetration at Location A, this is due to the most of top of the drainage was covered with sand. Sand has high porosity that allows the wave to penetrate deeper. The wave propagates properly and will distribute in dry sand area. Dry sand is considered as good medium for wave propagation. The depth of second positive amplitude is almost the same depth as in Figure 8 which indicates as drainage. The wave reached the concrete (drainage) and started to lose its energy when it reaches the air. Figure 10 shows the layer of the medium at Location B.
Fig -8: Data at Location B with target of drainage.

International Research Journal of Engineering and Technology (IRJET) e-ISSN: 2395 -0056
Volume: 03 Issue: 01 | Jan-2016 www.irjet.net p-ISSN: 2395-0072
© 2016, IRJET ISO 9001:2008 Certified Journal Page 51
Fig -9: The graphs of Amplitude vs Depth at Location B.
Fig -10: Illustration of underground drainage with different medium at Location B. The data at location C which is the bunker at Desasiswa Bakti Permai shows a hyperbolic curve that indicates the suspected target at 0.87 meters depth (Figure 11). Figure 12 shows the first positive amplitude at 0.51 meters depth which indicates as soil and the second positive amplitude at 0.755 meters depth indicate as concrete (bunker). The amplitude range is less compare with Location B because the penetration of the wave is less. It is because of the target area largely consists of thicker concrete compare with Location B and mostly the top of bunker is covered by soil. Soil cause the wave cannot penetrate further. The layer of the medium at this location consists of soil, concrete and air (Figure 13).
Fig -11: Data at Location C with target of a bunker.
Fig -12: The graphs of Amplitude vs Depth at Location C.
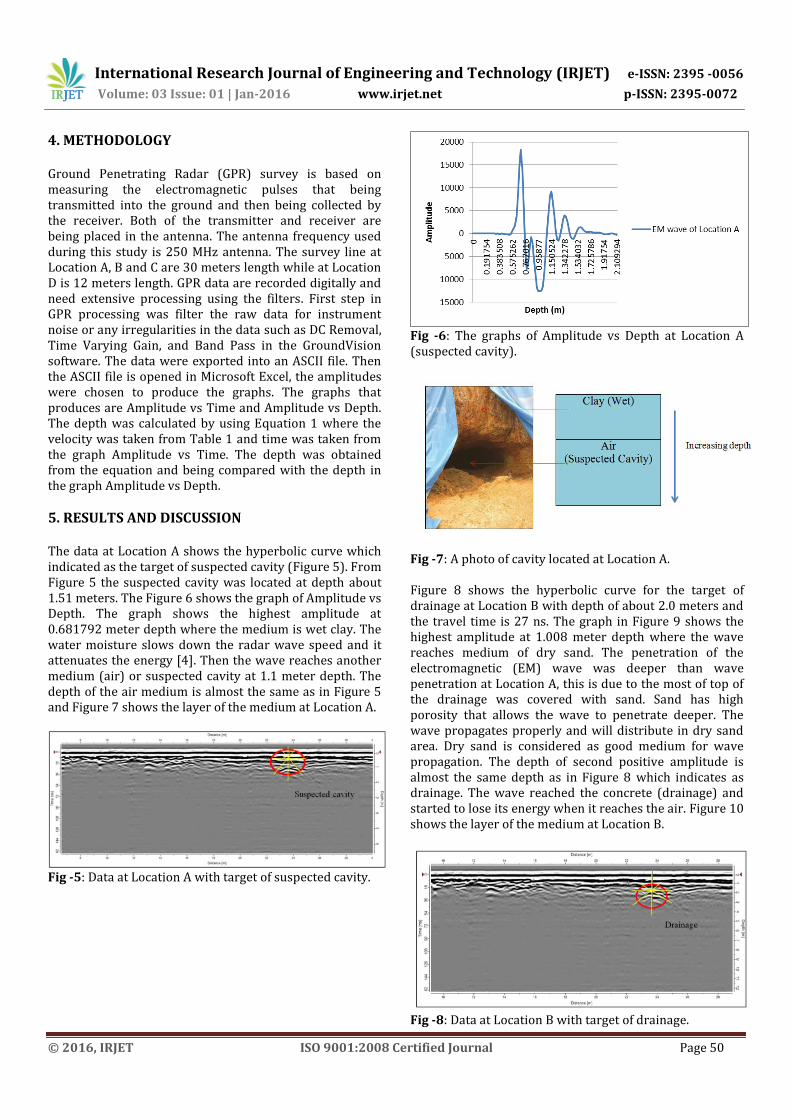
Fig -13: The different medium at Location C. The result at location D which is at School of Physics shows a hyperbolic curve that indicates the suspected target at 0.83 meters depth (Figure 14). The graph in Figure 15 shows the penetration of the wave is similar with Location C but with less amplitude height. It is because that area largely covered by concrete which will cause the wave travel with less velocity. The pipe also has a lower reflection percentage compare to the metal material or different medium. The first positive amplitude at 0.62 meters indicates as concrete (cement) and second positive amplitude indicate as another medium (pipe) at 0.805 meters depth. The depth of pipe in the graph (Figure 15) is close with depth in Figure 14. Figure 16 shows the layer of different medium at Location D.
International Research Journal of Engineering and Technology (IRJET) e-ISSN: 2395 -0056
Volume: 03 Issue: 01 | Jan-2016 www.irjet.net p-ISSN: 2395-0072
© 2016, IRJET ISO 9001:2008 Certified Journal Page 52
Fig -14: Data at Location D with target of pipe.
Fig -15: The graphs of Amplitude vs Depth at Location D.
Fig -16: The different medium at Location D.
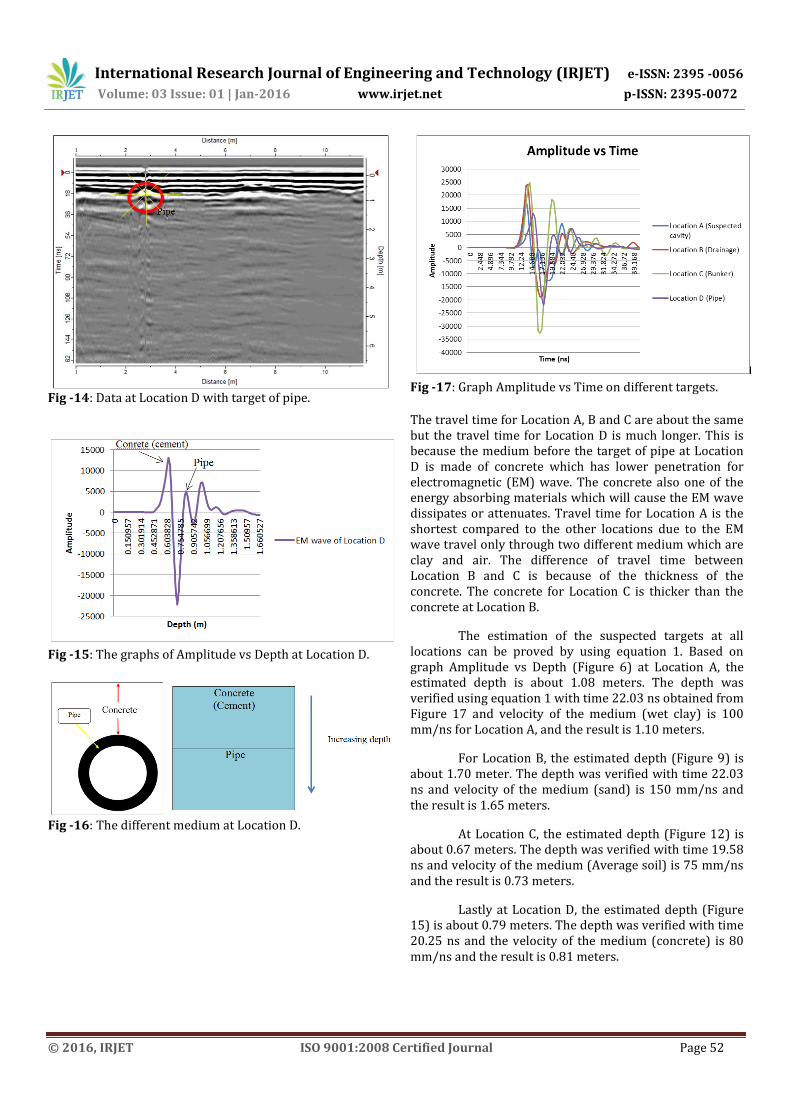
Fig -17: Graph Amplitude vs Time on different targets.
The travel time for Location A, B and C are about the same but the travel time for Location D is much longer. This is because the medium before the target of pipe at Location D is made of concrete which has lower penetration for electromagnetic (EM) wave. The concrete also one of the energy absorbing materials which will cause the EM wave dissipates or attenuates. Travel time for Location A is the shortest compared to the other locations due to the EM wave travel only through two different medium which are clay and air. The difference of travel time between Location B and C is because of the thickness of the concrete. The concrete for Location C is thicker than the concrete at Location B.
The estimation of the suspected targets at all locations can be proved by using equation 1. Based on graph Amplitude vs Depth (Figure 6) at Location A, the estimated depth is about 1.08 meters. The depth was verified using equation 1 with time 22.03 ns obtained from Figure 17 and velocity of the medium (wet clay) is 100 mm/ns for Location A, and the result is 1.10 meters.
For Location B, the estimated depth (Figure 9) is about 1.70 meter. The depth was verified with time 22.03 ns and velocity of the medium (sand) is 150 mm/ns and the result is 1.65 meters.
At Location C, the estimated depth (Figure 12) is about 0.67 meters. The depth was verified with time 19.58 ns and velocity of the medium (Average soil) is 75 mm/ns and the result is 0.73 meters.
Lastly at Location D, the estimated depth (Figure 15) is about 0.79 meters. The depth was verified with time 20.25 ns and the velocity of the medium (concrete) is 80 mm/ns and the result is 0.81 meters.
International Research Journal of Engineering and Technology (IRJET) e-ISSN: 2395 -0056
Volume: 03 Issue: 01 | Jan-2016 www.irjet.net p-ISSN: 2395-0072
© 2016, IRJET ISO 9001:2008 Certified Journal Page 53
6. CONCLUSIONS
The Ground Penetrating Radar (GPR) is a very effective method for shallow subsurface investigation for different target of interest even in different medium. The equation 1 can be used to verify the depth by using the information obtained from graph Amplitude vs Depth and Time. The depth that obtained using the equation almost similar to the depth that obtained from graph Amplitude vs Depth and from the estimated depth in the raw data after filtered.
ACKNOWLEDGEMENT The authors thanked all the technical staffs of the Geophysics laboratory, postgraduate students and final year students, School of Physics, Universiti Sains Malaysia for their assistance during the data acquisition.
REFERENCES [1] Steve, C. (2002), Subsurface Investigation Using
Ground Penetrating Radar. Department of Geology and Geophysics, University of Missouri-Rolla, Rolla, MO.
[2] Timo, S. and Pekka, M. (2011), The Use of GPR in Road Rehabilitation Projects. Roadscanners Oy, Finland.
[3] María, V.B., Matías, D.L.V. and Néstor, B. (2011), Contribution of the resistivity method to characterize mud walls in very dry region and comparison with GPR. Journal of Archaeological Science.
[4] Milsom, J. (2003), Field geophysics: The geological field guide series, Third Edition, pg 167-175.
[5] Davis, J.L. and Annan, A.P. (1989), Ground Penetrating Radar for High-Resolution Mapping of Soil and Rock Stratigraphy, Volume 37, Issue 5 pages 531-551.
[6] Google earth, 2015. [7] Reynolds, J.M. (1997), An Introduction to Applied and
Environmental Geophysics. John Wiley and Sons, Ltd., New York.