APPLICATION OF GAMING ENGINES INSIMULATION · PDF fileAPPLICATION OF GAMING ENGINES...
16
www.itcon.org - Journal of Information Technology in Construction - ISSN 1874-4753 ITcon Vol.16 (2011), ElNimr & Mohamed, pg. 23 APPLICATION OF GAMING ENGINES IN SIMULATION DRIVEN VISUALIZATION OF CONSTRUCTION OPERATIONS SUBMITTED: March 2010 REVISED: July 2010 PUBLISHED: January 2011 EDITOR: Turk Z. Amr A. ElNimr Hole School of Construction Engineering, University of Alberta , Edmonton, AB , Canada [email protected] Yasser Mohamed Hole School of Construction Engineering, University of Alberta , Edmonton, AB , Canada [email protected] http://www.uofaweb.ualberta.construction.ca/construction/mohamed.cfm SUMMARY: Simulation modelling is an effective approach for analysing construction operations that is not widely used by construction practitioners. Visualization in general, and particularly in construction projects, is a convenient and intuitive way of conveying project information among various project parties. Recently, construction management researchers have been investigating adding a visualization component to construction simulation models in order to make these models more intuitive and appealing to decision makers. These researchers argue that enhancing visualization and spatial representation of construction operations in a simulation environment can improve the adoption of simulation techniques by the industry. Among different industries that make use of advanced visualization technologies, the gaming industry is one of the leaders in utilizing and advancing these technologies. This paper explains the utilization of video game technologies in the development of a framework for construction operations simulation visualization. The framework is based on High Level Architecture (HLA) standards for distributed simulation and allows for hooking different visualization components to the simulation environment with great deal of flexibility. The paper presents the different elements of the framework and discusses the benefits and challenges experienced while using two different gaming engines as visualization portals in the framework. KEYWORDS: gaming engines, simulation, distributed simulation, HLA, Blender, TureVision, pipe modules REFERENCE: Amr A. ElNimr (2011) Application of gaming engines in simulation driven visualization of construction operations, Journal of Information Technology in Construction (ITcon), Vol. 16, pg. 23-38, http://www.itcon.org/2011/3 COPYRIGHT: © 2011 The authors. This is an open access article distributed under the terms of the Creative Commons Attribution 3.0 unported (http://creativecommons.org/licenses/by/3.0/), which permits unrestricted use, distribution, and reproduction in any medium, provided the original work is properly cited.
Transcript of APPLICATION OF GAMING ENGINES INSIMULATION · PDF fileAPPLICATION OF GAMING ENGINES...
www.itcon.org - Journal of Information Technology in Construction - ISSN 1874-4753
ITcon Vol.16 (2011), ElNimr & Mohamed, pg. 23
APPLICATION OF GAMING ENGINES IN SIMULATION DRIVEN VISUALIZATION OF CONSTRUCTION OPERATIONS
SUBMITTED: March 2010 REVISED: July 2010 PUBLISHED: January 2011 EDITOR: Turk Z.
Amr A. ElNimr Hole School of Construction Engineering, University of Alberta , Edmonton, AB , Canada [email protected]
Yasser Mohamed Hole School of Construction Engineering, University of Alberta , Edmonton, AB , Canada [email protected] http://www.uofaweb.ualberta.construction.ca/construction/mohamed.cfm
SUMMARY: Simulation modelling is an effective approach for analysing construction operations that is not widely used by construction practitioners. Visualization in general, and particularly in construction projects, is a convenient and intuitive way of conveying project information among various project parties. Recently, construction management researchers have been investigating adding a visualization component to construction simulation models in order to make these models more intuitive and appealing to decision makers. These researchers argue that enhancing visualization and spatial representation of construction operations in a simulation environment can improve the adoption of simulation techniques by the industry. Among different industries that make use of advanced visualization technologies, the gaming industry is one of the leaders in utilizing and advancing these technologies. This paper explains the utilization of video game technologies in the development of a framework for construction operations simulation visualization. The framework is based on High Level Architecture (HLA) standards for distributed simulation and allows for hooking different visualization components to the simulation environment with great deal of flexibility. The paper presents the different elements of the framework and discusses the benefits and challenges experienced while using two different gaming engines as visualization portals in the framework.
KEYWORDS: gaming engines, simulation, distributed simulation, HLA, Blender, TureVision, pipe modules
REFERENCE: Amr A. ElNimr (2011) Application of gaming engines in simulation driven visualization of construction operations, Journal of Information Technology in Construction (ITcon), Vol. 16, pg. 23-38, http://www.itcon.org/2011/3
COPYRIGHT: © 2011 The authors. This is an open access article distributed under the terms of the Creative Commons Attribution 3.0 unported (http://creativecommons.org/licenses/by/3.0/), which permits unrestricted use, distribution, and reproduction in any medium, provided the original work is properly cited.
ITcon Vol. (2010), ElNimr & Mohamed, pg. 24
1. INTRODUCTION
1.1 Construction Simulation Visualization Simulation is defined as the process of designing a model of a real system and conducting experiments with this model for the purpose of either understanding the behaviour of the system or evaluating various strategies for the operation of the system (Shannon, 1975). The strength of simulation approaches emanates from their ability to examine various scenarios of the simulated system, rather than giving a mathematically optimum result as is the case in mathematical optimizations. Most researches stress the fact that simulation is not used to its maximum potential in the construction industry (Ioannou and Martinez, 1996; Kamat and Martinez, 2001; Huang and Halpin, 1994; Tucker et. al., 1998). There are two major reasons for this lack of use:
• Most simulation models show results in statistical and text formats, which causes simulation to be perceived by the construction industry as a “black box.”
• The current simulation models do not consider the transformation of space that result from the evolution of the constructed product (Kamat and Martinez, 2001).
In order to overcome the limitations of simulation and to encourage its application in the construction industry, researchers turned to SDV (Simulation Driven Visualization). It incorporates 2D and 3D depictions and animation to provide the end user with better representation and understanding of construction operations and space. Also, SDV addresses the limitations of using stand alone animation or simulation systems where graphical representations of construction operations and simulation of activity timing and resource interactions are separate and independent of each other.
There are SDV commercial, off the shelf (COTS) packages that exist in the market. These include Delmia’s Quest® and Brooks Software AutoMod®. However, these COTS are generally concentrated on manufacturing operations. They are usually unable to effectively handle the additional complications introduced by the changes in the geometry of the construction site as work progresses, and their use to model and animate construction operations requires a radical change in the model conceptualization and thought process followed by construction model developers (Oloufa, 1993 and Kamat and Martinez, 2008). Another visualization and CAD package that is used in the construction industry is CATIA®. Although powerful on the CAD side, it is limited on the simulation side of processes as it lacks the Discrete Event Simulation (DES) engine. CATIA can be a better solution for 4D modelling—final product development modelling—but not for simulation of construction processes.
The first construction simulation tools to adopt graphics did so in the early 80s (Rohrer, 2000). This was done through attempts to link construction simulation packages to animation to achieve a post-process playback of the simulation (Halpin and Woodhead, 1976; Kalk and Douglas, 1980; Paulson et al., 1983). The “Utopian Framework” for earth moving operations was a good example (Oloufa and Crandall, 1992). Another attempt to extract product information from a CAD design into a simulation was done through the PSE (Product-oriented Simulation Environment) (Xu and AbouRizk, 1999). Recent research in construction operations SDV involves the use of simulation trace files to invoke post-simulation animation (replay) of the simulation. This includes the Dynamic Construction Visualizer (DCV) and Visualization of Simulated Construction Operations (VITASCOPE) by Kamat and Martinez, 2001 and Kamat and Martinez, 2004 respectively.
The above simulation visualization packages (both commercial and research oriented) provide advanced visualization capabilities. However, they inherit some characteristics that limit their use in visualizing simulation behaviours of construction operations. Some of these characteristics include:
• Post-processing visualization: After a simulation is complete, visualization is produced as a replayed record of what took place during the simulation run. It does not allow the decision maker to interact with the simulation. This causes the visualization component also to rely on simulation trace statements produced by the simulation engine exclusively for visualization purposes.
• Tight coupling between simulation and visualization engines: Existing SDV mechanisms and COTS packages are usually tightly coupled with whatever simulation engine they serve. A particular visualization component will usually work perfectly with a particular simulation engine but will be very time consuming or knowledgably demanding to tailor it to work with other simulation engines. This leads to compromises on the strengths of both the simulation and
ITcon Vol. (2010), ElNimr & Mohamed, pg. 25
visualization components. Also, this makes the two tightly coupled components strong in depicting certain applications and weak when it comes to depicting others. Finally this decreases the reusability these tightly coupled frameworks or COTS packages and limits their use in day to day construction operations.
• Compromising the power of the visualization components: Graphics usually demands specialized and high computer processing power. Running simulation models is also a demanding task on computer processors. Running the two in parallel significantly increases the demand on computer hardware and may be deemed infeasible in case of highly detailed simulation and visualization models. In addition, there have been significant advancements and optimization of software specially developed for handling graphics and visualization tasks. Capitalizing on these advancements requires the development of a mechanism to allow different specialized simulation and visualization components to interoperate without limiting or compromising the strengths of each.
To overcome the above limitations, this research proposes a loosely coupled simulation visualization framework. In this framework, the execution of the visualization components is parallel and independent from the simulation engine. Execution of these components can also be carried by completely separate and dedicated computer systems allowing the utilization of the strength of each component independently and exclusively. In addition, the framework capitalizes on existing high-level 3D graphic engines to reduce the effort required to customize and develop the visualization components.
This paper discusses the proposed framework. The framework capitalizes on gaming technologies in the search for an effective method to visualize simulated construction operations. Different approaches using two different gaming engines—namely, the Blender Game Engine (BGE) and TrueVision3D®—were used to develop this framework. The paper presents the architecture of the framework and the incorporation of the gaming engines. In addition, it discusses the benefits and challenges experienced during development.
1.2 HSV Framework and Underlying Distributed Simulation Standards The proposed High Level Architecture (HLA)- based Simulation Visualization framework which can be referred to as HSV framework for short is based on the distributed simulation standard known as HLA (IEEE 1516.2000). Distributed simulation is a technology that enables models to be linked together over computer networks so that they work together (or interoperate) during a simulation run. HLA is a set of standards that regulates distributed simulation development (Taylor et al., 2003). In HLA, each simulation is connected with the others through Runtime Infrastructure (RTI) software. The simulations or models connected to the RTI are called Federates and a collection of them working together to simulate the same system is known as a Federation. A federate is not required to be a simulation model, but can be any piece of software or hardware, or even an interface to human user (user-in-the-loop), as long as each federate complies with HLA standards (Rycerz et al., 2007). RTI facilitates communication between federates and performs time management of the simulation. A key component of a Federation (collection of federates) is the Federation Object Model (FOM) which defines all the entities produced by the various federates during the simulation run, states the attributes of those entities and information about which federates will update those entities' attributes (i.e., publish them) and which federates will read them (i.e., subscribe to them). For example, in the proposed HLA-based simulation visualization framework (HSV), federates responsible for the visualization may only subscribe to some attributes, while federates responsible for simulation behaviours generation can write and read (publish and subscribe) these attributes.
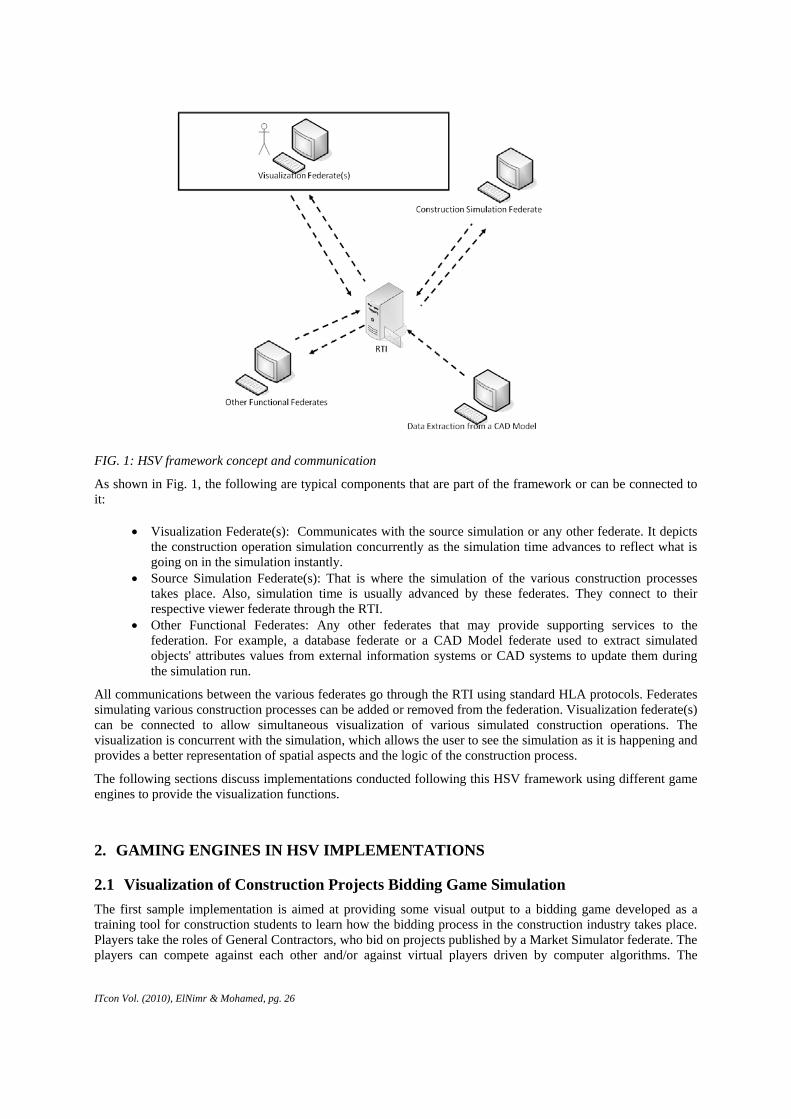
Fig. 1 shows the HSV concept, typical components and communications between the visualization federate(s) on one hand and other functional/simulation federates on the other hand.
ITcon Vol. (2010), ElNimr & Mohamed, pg. 26
FIG. 1: HSV framework concept and communication
As shown in Fig. 1, the following are typical components that are part of the framework or can be connected to it:
• Visualization Federate(s): Communicates with the source simulation or any other federate. It depicts the construction operation simulation concurrently as the simulation time advances to reflect what is going on in the simulation instantly.
• Source Simulation Federate(s): That is where the simulation of the various construction processes takes place. Also, simulation time is usually advanced by these federates. They connect to their respective viewer federate through the RTI.
• Other Functional Federates: Any other federates that may provide supporting services to the federation. For example, a database federate or a CAD Model federate used to extract simulated objects' attributes values from external information systems or CAD systems to update them during the simulation run.
All communications between the various federates go through the RTI using standard HLA protocols. Federates simulating various construction processes can be added or removed from the federation. Visualization federate(s) can be connected to allow simultaneous visualization of various simulated construction operations. The visualization is concurrent with the simulation, which allows the user to see the simulation as it is happening and provides a better representation of spatial aspects and the logic of the construction process.
The following sections discuss implementations conducted following this HSV framework using different game engines to provide the visualization functions.
2. GAMING ENGINES IN HSV IMPLEMENTATIONS
2.1 Visualization of Construction Projects Bidding Game Simulation The first sample implementation is aimed at providing some visual output to a bidding game developed as a training tool for construction students to learn how the bidding process in the construction industry takes place. Players take the roles of General Contractors, who bid on projects published by a Market Simulator federate. The players can compete against each other and/or against virtual players driven by computer algorithms. The
ITcon Vol. (2010), ElNimr & Mohamed, pg. 27
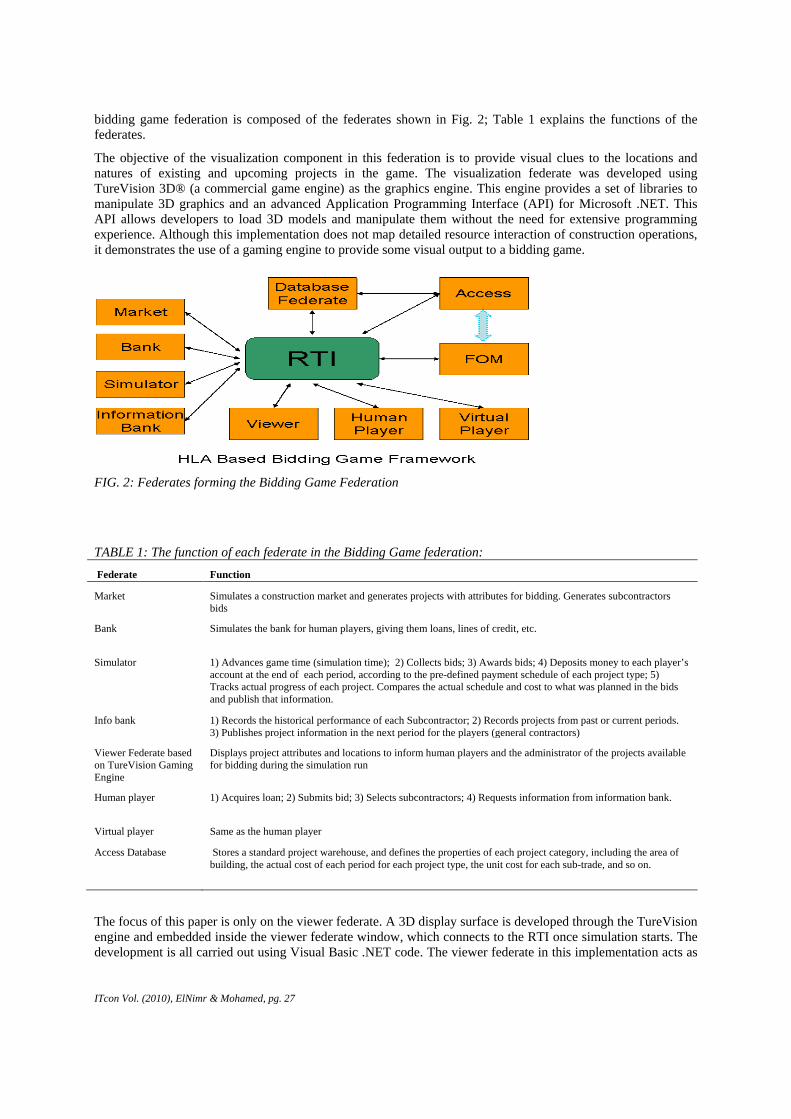
bidding game federation is composed of the federates shown in Fig. 2; Table 1 explains the functions of the federates.
The objective of the visualization component in this federation is to provide visual clues to the locations and natures of existing and upcoming projects in the game. The visualization federate was developed using TureVision 3D® (a commercial game engine) as the graphics engine. This engine provides a set of libraries to manipulate 3D graphics and an advanced Application Programming Interface (API) for Microsoft .NET. This API allows developers to load 3D models and manipulate them without the need for extensive programming experience. Although this implementation does not map detailed resource interaction of construction operations, it demonstrates the use of a gaming engine to provide some visual output to a bidding game.
FIG. 2: Federates forming the Bidding Game Federation
TABLE 1: The function of each federate in the Bidding Game federation: Federate Function
Market Simulates a construction market and generates projects with attributes for bidding. Generates subcontractors bids
Bank Simulates the bank for human players, giving them loans, lines of credit, etc.
Simulator 1) Advances game time (simulation time); 2) Collects bids; 3) Awards bids; 4) Deposits money to each player’s account at the end of each period, according to the pre-defined payment schedule of each project type; 5) Tracks actual progress of each project. Compares the actual schedule and cost to what was planned in the bids and publish that information.
Info bank 1) Records the historical performance of each Subcontractor; 2) Records projects from past or current periods. 3) Publishes project information in the next period for the players (general contractors)
Viewer Federate based on TureVision Gaming Engine
Displays project attributes and locations to inform human players and the administrator of the projects available for bidding during the simulation run
Human player 1) Acquires loan; 2) Submits bid; 3) Selects subcontractors; 4) Requests information from information bank.
Virtual player Same as the human player
Access Database Stores a standard project warehouse, and defines the properties of each project category, including the area of building, the actual cost of each period for each project type, the unit cost for each sub-trade, and so on.
The focus of this paper is only on the viewer federate. A 3D display surface is developed through the TureVision engine and embedded inside the viewer federate window, which connects to the RTI once simulation starts. The development is all carried out using Visual Basic .NET code. The viewer federate in this implementation acts as

ITcon Vol. (2010), ElNimr & Mohamed, pg. 28
a listener to interactions and attribute updates produced by other federates in the federation. Once the viewer federate is connected to the simulation, and the simulation starts, the market federate starts to generate projects and their attributes at different times during the simulation. The viewer federate listens (subscribes) to a number of attributes of a project. These attributes are:
• Project location: Each project is generated at a certain location defined in the form of (X, Y) coordinates. This (X, Y) location is read by the Viewer Federate and scaled to fit the dimensions of a map of the province of Alberta (the province for which the market is simulated). Once the project is published in the federation, the viewer federate displays its location on the map using a generic 3D model of a building.
• Project title and category: The Viewer federate displays the title and category for each project. These attributes are displayed using a 3D font in front of each project on the display surface.
Human players use the visualization to pick projects for bidding and to know when projects are generated during the simulation run. Fig. 3 shows a screen shot of the viewer federate during the simulation while Fig. 4 shows the logic behind the code used for utilizing the gaming engine in the development of the viewer federate.
FIG. 3: Viewer Federate showing projects, their locations and project information during the simulation
FIG. 4: TureVision 3D engine coding logic inside the Viewer Federate
ITcon Vol. (2010), ElNimr & Mohamed, pg. 29
The gaming engine pseudo-code shown in Fig. 4 starts with the declaration of all the TureVision 3D elements; the various game engine components are declared here, for example, the TV Engine itself, scenes, meshes, cameras and the scene atmosphere. The code is then set to subscribe to the project's attributes mentioned earlier and read the changes in these attributes’ values by connecting to the RTI. This subscription part includes the code to display projects based on their actual locations on the viewer screen. Then the code creates the various screen elements which were set in the declaration phase. These various elements (including meshes with their various textures representing different projects) are displayed to the players based on the simulation scenario. The last portion of the code sets the user interface, for example the user controlling the viewer screen through mouse movements or changing the scene's camera. The use of a game engine in this implementation allowed for the development of the viewer federate in a relatively short time. It also allowed for integrating naturally with other components of the federation (i.e. other federates and the RTI) through the VB .NET API. However, it still required some programming knowledge for customizing the behaviours of the 3D objects on the display surface. Despite the advanced services provided by the engine, this programming knowledge grows significantly with the complexity of the behaviours required for the 3D objects.
In search for a more effective and flexible way to provide visual behaviours and interaction with 3D objects, another sample implementation is conducted as described in the following sections.
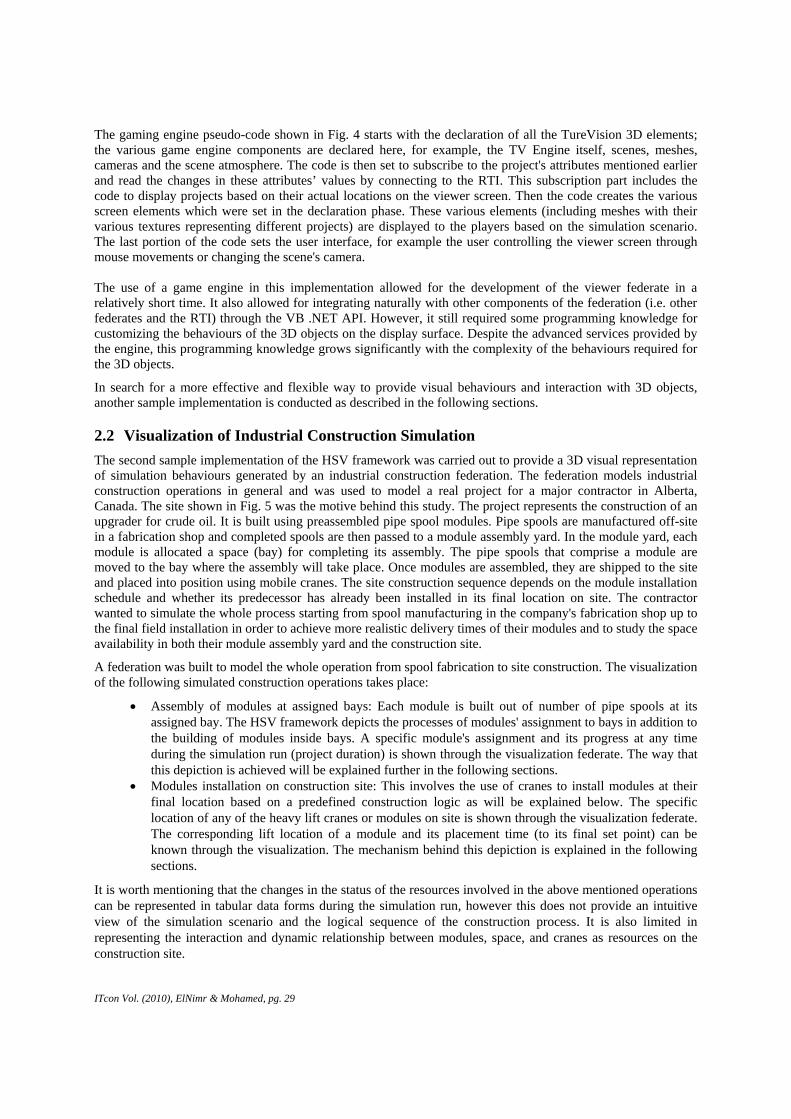
2.2 Visualization of Industrial Construction Simulation The second sample implementation of the HSV framework was carried out to provide a 3D visual representation of simulation behaviours generated by an industrial construction federation. The federation models industrial construction operations in general and was used to model a real project for a major contractor in Alberta, Canada. The site shown in Fig. 5 was the motive behind this study. The project represents the construction of an upgrader for crude oil. It is built using preassembled pipe spool modules. Pipe spools are manufactured off-site in a fabrication shop and completed spools are then passed to a module assembly yard. In the module yard, each module is allocated a space (bay) for completing its assembly. The pipe spools that comprise a module are moved to the bay where the assembly will take place. Once modules are assembled, they are shipped to the site and placed into position using mobile cranes. The site construction sequence depends on the module installation schedule and whether its predecessor has already been installed in its final location on site. The contractor wanted to simulate the whole process starting from spool manufacturing in the company's fabrication shop up to the final field installation in order to achieve more realistic delivery times of their modules and to study the space availability in both their module assembly yard and the construction site.
A federation was built to model the whole operation from spool fabrication to site construction. The visualization of the following simulated construction operations takes place:
• Assembly of modules at assigned bays: Each module is built out of number of pipe spools at its assigned bay. The HSV framework depicts the processes of modules' assignment to bays in addition to the building of modules inside bays. A specific module's assignment and its progress at any time during the simulation run (project duration) is shown through the visualization federate. The way that this depiction is achieved will be explained further in the following sections.
• Modules installation on construction site: This involves the use of cranes to install modules at their final location based on a predefined construction logic as will be explained below. The specific location of any of the heavy lift cranes or modules on site is shown through the visualization federate. The corresponding lift location of a module and its placement time (to its final set point) can be known through the visualization. The mechanism behind this depiction is explained in the following sections.
It is worth mentioning that the changes in the status of the resources involved in the above mentioned operations can be represented in tabular data forms during the simulation run, however this does not provide an intuitive view of the simulation scenario and the logical sequence of the construction process. It is also limited in representing the interaction and dynamic relationship between modules, space, and cranes as resources on the construction site.
ITcon Vol. (2010), ElNimr & Mohamed, pg. 30
One of the challenges of construction simulation models is representing site space limitations (spatial data). A typical solution is by representing space as resource, yet this can be counter intuitive and is not easy to visualize by project team. For example, the simulation model would only depict a crane as a resource with certain quantity without showing the crane manoeuvrability space or the crane routes.. Also, the simulation of such a project might have flaws and errors especially when it comes to site installation sequence and the spatial conflicts that may arise from that. A 3D visualization component would be able to depict spatial conflicts better than textual output.
A flexible visualization component was sought after as the solution to detect spatial conflicts in the module assembly and site installation sequences of the modules. An SDV approach would be able to show a module yard's occupied and free bays during the modules assembly operations as the project time (simulation time) advances in a more intuitive way along with depicting the spaces on the construction site.
In this implementation of the HSV framework, the game engine for Blender (an open source digital content creation environment) was utilized. The Blender Game Engine (BGE) provides a graphical interface that enables the development of interactive behaviours for 3D objects without the need for programming knowledge.
Two visualization federates are developed in this case, one for representing the utilization of space by different modules during their building processes on the module assembly yard, and the other for showing the on-site construction sequence of the modules. Both federates run simultaneously with other simulation federates and concurrently map the behaviours generated from the other federates to 3D worlds that represent the yard and the site. The architecture of these federates in relation to the whole federation is represented in Fig. 6 and explained in the following sections.
FIG. 5: PCL-Shell Ft. Saskatchewan site

ITcon Vol. (2010), ElNimr & Mohamed, pg. 31
HLA Based Simulation Visualization (HSV) Framework
FIG. 6: Framework used in simulation and visualization of pipe modules’ assembly and their site installation
2.2.1 Main Elements of the Industrial Construction Federation
Communication between the BGE and the federation is enabled through a number of layers as shown in Fig. 6. The first layer consists of the following:
• Simulation Federates: Where all the simulation of the various spool fabrications and spool assembly takes place. These federates produce the statistics needed by the decision maker. Each federate represents not only a phase of the construction process but also work done in separate areas; namely the PCL Fabrication Shop (Spool Fabrication Federate), the PCL Module Yard (Module Yard Simulation Federate) and the Construction Site (Site Construction Simulation Federate).
• Other Federates: The Resource Allocation Federate is responsible for allocating the various cranes to lift/move certain modules to their final location on site. Cranes are assigned to modules based on the cranes’ availability and their fitness to handle certain module sizes and weights.
Spool Fabrication Simulation Federate
Site Construction Simulation Federate
Resource Allocation Federate
Runtime Infrastructure (RTI)
HLA Messages Module Yard
Simulation Federate
HLA Communication
HLA Simulation Visualization Federate
Site Viewer
HLA Simulation Visualization Federate
Yard Viewer
UDP Messages Layer
Windows Sockets/Ports
Python UDP Network Client
Blender Gaming Engine (BGE) logic bricks
3D Object Behaviours
Replaceable Components
3D Gaming Engine Layer
ITcon Vol. (2010), ElNimr & Mohamed, pg. 32
• Visualization Federates: Federates that read (subscribe to) the objects’ (cranes and Modules) attributes and communicate these attribute values with a secondary layer of the framework that contains the visualization engines.
The second layer consists of the visualization engines, which are based on the BGE. Two visualization BGE screens are provided for the user; one showing installation of modules at their final location on site and the other showing module assembly progress with simulation time in module yard before transporting it to the site. The visualization federates show the following behaviours:
• The logical sequence of the modules’ installation on site during the modules site installation operations. For example, the top module cannot be installed before the bottom one is installed, and a middle module cannot be installed after the left and right modules are installed. This provides a check for the logic of the construction schedule.
• The progress of a module’s assembly together with the bay it is assigned to, so the user can see bay occupancy during the course of the assembly process. This gives the user a depiction of the module yard bays' utilization and the distribution of the modules’ assembly work load. The user can also pause the simulation and/or visualization to visually check the utilization of the bays at a given period of the project. Also, the user can make use of this visualization to test their construction schedule logic and make sure that there is no module installed before its predecessors are set in their final locations.
The way that each of the two BGE visualizations are connected to their respective viewer federates will be explained in the following section.
2.2.2 Connection between BGE and Simulation
The two visualization federates subscribe to different attributes published by simulation federates during simulation.
The site viewer federate subscribes to the following attributes:
• Module Name: this attribute helps identify the prototype 3D model that represents the module from a hidden layer inside the Site Visualization BGE.
• Module's Field Location: this attribute describes the state of the module on site and can take one of three values: "Delivered At Site", indicating that the module has arrived to the site; "In Lift", indicating that the module is currently being placed by a crane; and "At Set Point", indicating that the module is installed at its final location on site. These enumerations are predefined inside the federation's FOM and are produced during simulation by the site simulation federate to mark the location of each module instance at any point in of simulation time.
The Yard Viewer federate subscribes to the following attributes:
• Module Name: this attribute identifies the prototype of the module from a hidden layer inside the Yard Visualization BGE.
• Module-Bay: This is published by the Module Yard federate and defines the bay allocated to each module inside the module yard at any point in time where the module assembly will take place.
• Module Progress: A percentage showing the completion of the module assembly. Once the attributes are published, the viewer federates read them and sends a message containing the module unique identifier (module ID) and the module assembly’s percent complete or its on-site state to the BGE. The execution of the BGE takes place as a completely independent execution thread and therefore, the communication between the viewer federates and the BGE is achieved through a network User Datagram Protocol (UDP), which provides language-independent communications between the .NET based HLA federation and the Python based BGE. The Site and Yard Viewer federates on the second layer of the HSV framework architecture shown in Fig. 6 act as clients to send messages to their respective BGE based visualizers. The server part on the BGE' side is based on a Python API, which receives the messages from site or Yard Viewer federates and converts them to BGE internal messages. The internal BGE messages are delivered to the corresponding 3D objects using BGEs graphical logic bricks as described in the following sections.
ITcon Vol. (2010), ElNimr & Mohamed, pg. 33
2.2.3 Mapping Simulation Messages to Visual Behaviours
The visual behaviours of the 3D objects are customized differently inside the Yard and Site Visualization BGEs. As the simulation runs the site viewer Federate reads the changes in the Module Field Location value for each module and sends messages through the UDP connection to the site visualization BGE. The BGE recalls the prototype of the module from a hidden layer and places it at its final location if the module's field location is set to be "At Set Point". This indicates that the module is lifted and installed in its final location based on the planned construction logic. On the assembly yard side, once a module is assigned to a bay through the Module-Bay attribute, this is reflected to the Yard Viewer federate through the RTI and consequently, messages are sent from the Yard Viewer federate to the yard visualization BGE stating the module's bay assignment. In addition, subsequent messages that update a module's assembly progress are also sent.
Once the yard visualization BGE receives these messages, it performs the following visual behaviours as the simulation time advances:
• Assigns a module to its bay in the yard 3D model once it is allocated one by the simulation • Shows the change in modules' progress inside its respective bay as the simulation runs. This
behaviour is depicted by building the module prototype inside its bay till reaching the typical complete prototype of the module once the assembly progress is set to 100% by the yard simulation federate.
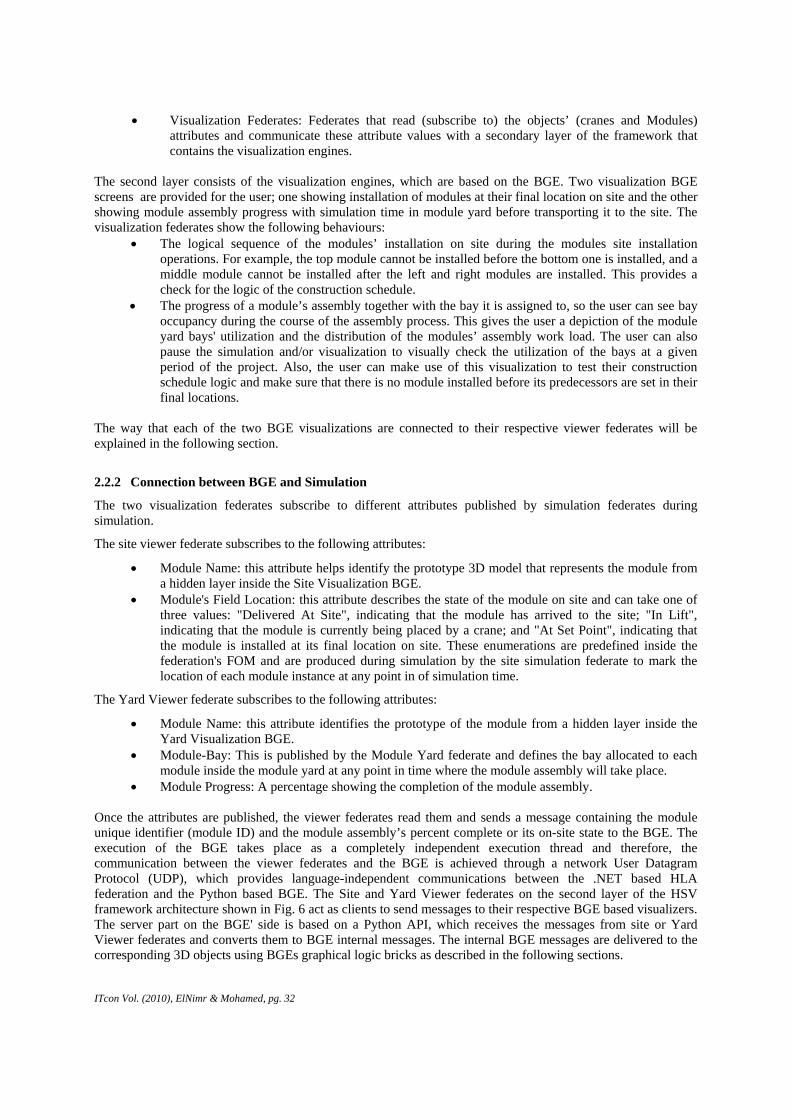
The following figures show screen shots of the viewer federates of the site and yard and their corresponding BGE visualizations. Fig. 7a shows the messages in the list box which are sent to the BGE. These messages simply tell the BGE to recall a certain module using its module unique identifier, followed by its location on site. Once a module is "At Set Point" then it appears in its predefined location based on the design drawings. Fig. 7b shows the BGE screen displaying modules at their predefined set points based on the messages received from the site viewer federate.
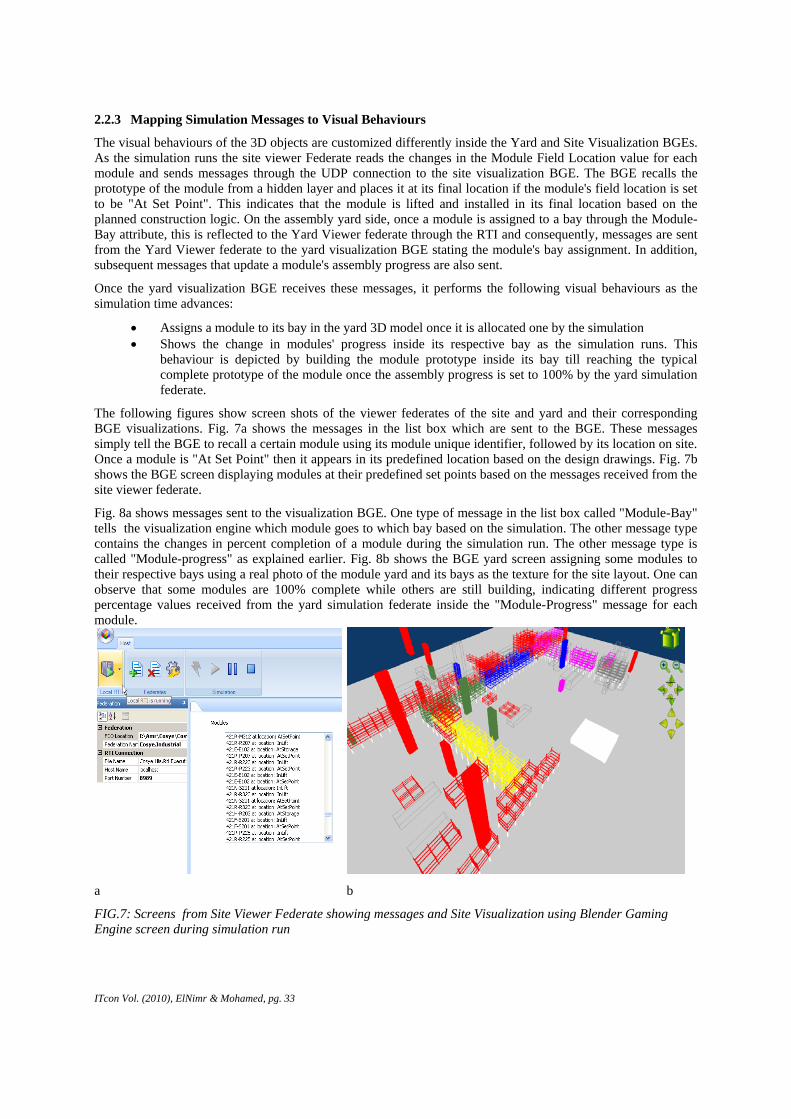
Fig. 8a shows messages sent to the visualization BGE. One type of message in the list box called "Module-Bay" tells the visualization engine which module goes to which bay based on the simulation. The other message type contains the changes in percent completion of a module during the simulation run. The other message type is called "Module-progress" as explained earlier. Fig. 8b shows the BGE yard screen assigning some modules to their respective bays using a real photo of the module yard and its bays as the texture for the site layout. One can observe that some modules are 100% complete while others are still building, indicating different progress percentage values received from the yard simulation federate inside the "Module-Progress" message for each module.
FIG.7: Screens from Site Viewer Federate showing messages and Site Visualization using Blender Gaming Engine screen during simulation run
a b
ITcon Vol. (2010), ElNimr & Mohamed, pg. 34
FIG. 8: Screens from Yard Viewer Federate and Yard Visualization BGE during simulation run
The way BGE receives these reflections and performs this animation through the simulation run will be explained in the following section.
2.2.4 Generating Visual Behaviours in BGE
Generation and customization of the behaviours of 3D objects inside BGE is done using graphical logic bricks. These logic bricks are built-in constructs in the Blender environment that allow developers create interactive game environments. Any object in the Blender environment can be equipped with these bricks, which allow it to respond to different events happening in the environment or generated by user activities. The logic bricks are broken down into three main types: “sensors”, “controllers”, and “actuators”. Sensors have different types and their main function is to sense a certain action or event that happens in the environment. Once a sensor is triggered, it sends a signal its controller. Controllers can be connected to different sensors and act as logical gates (e.g. “AND”, “OR”) to actuators. When all conditions of a controller are met, it fires one or more actuators. Actuators are the producers of visual behaviours in the game environment. A set of actuators owned by a certain 3D object will trigger it to produce different transformations according to the type of these actuators and the controller they are connected to. The following sections describe some of the logic bricks used to produce the visual behaviours of the site and yard visualization BGEs.
As an entry point to the game environment in Blender, a hidden object inside each of the BGEs acts as a server that receives messages during the simulation run and re-route them to trigger different logic bricks to produce the behaviours of 3D objects. A Python script on each of the two server objects does the following:
• Receives the messages from the respective viewer federate through a predefined port. • Parses messages to pieces and sends them to the BGEs’ logic bricks.
Fig. 9 shows the logic bricks of the server object. In this case the server object is forced to signal a Python controller (i.e. execute the script in the controller) every certain number of animation frames. The script listen to the port and routes the messages as described above.
FIG. 9: Logic bricks for the server object
a b
ITcon Vol. (2010), ElNimr & Mohamed, pg. 35
A 3D game environment is created for each visualizer (i.e. site and yard visualizers). These environments contain different 3D objects. Some objects are static and they are mainly to enhance realism of the environment. Dynamic objects are equipped with logic bricks to react to simulation messages. The dynamic objects inside the site visualization BGE are:
• Module prototype models: these represent 3D models of the actual modules and were imported from CAD files of the project.
• Bound objects: these represent markers of the final set-points of the different modules and help manage the placement of module prototypes at their final locations on site.
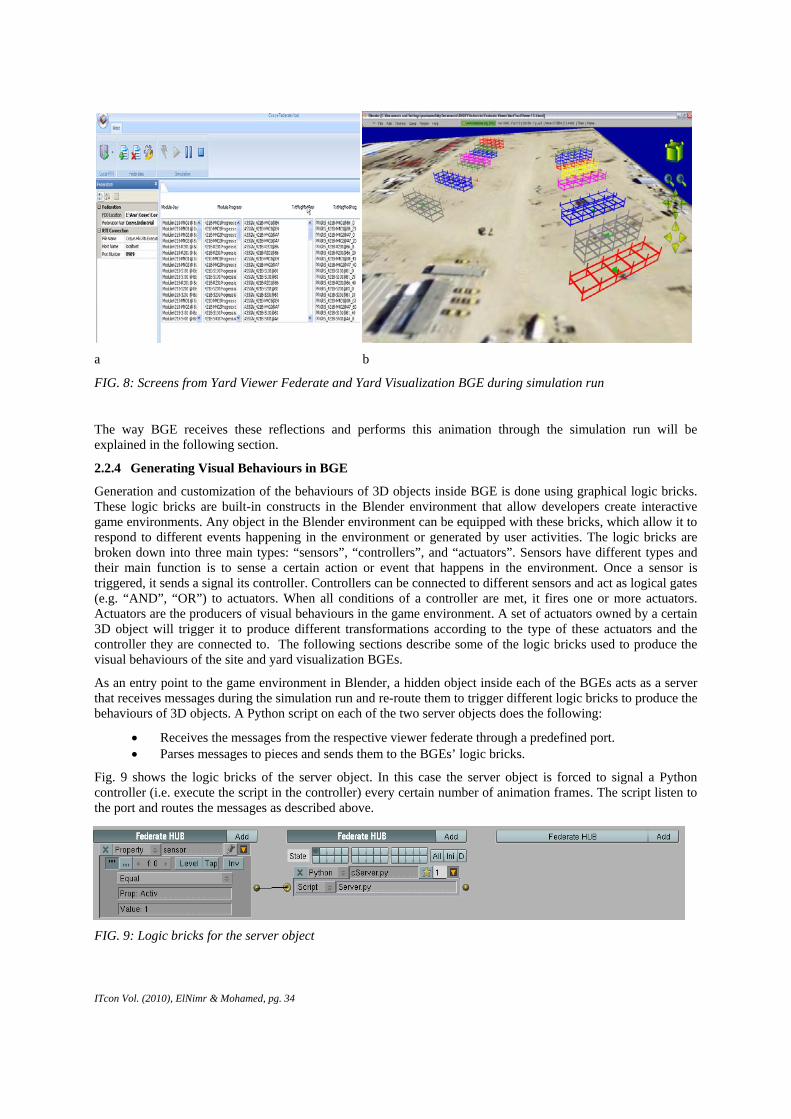
The logic bricks of the bound objects are shown in Fig. 10. A sensor is created to listen to messages with a subject equal to the string “SET”. When such a message is sent to the object, it triggers two actuators. The first actuator adds the prototype model of the module to the scene at its final location. The second one deletes the bound object itself from the scene as it is no longer required.
FIG. 10: Logic bricks of bound objects in the site visualizer
The dynamic objects inside the yard visualization BGE are: • Module prototypes • Bay objects
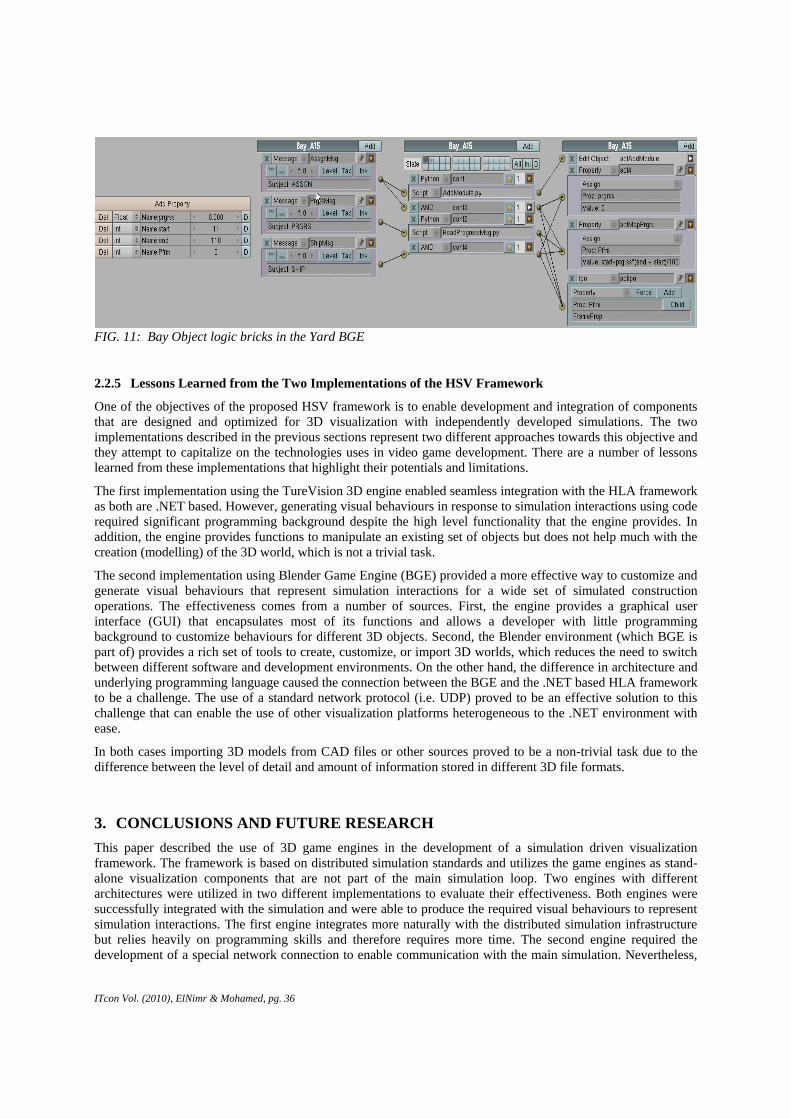
Fig. 11 shows the logic bricks for a bay object. The object is equipped with three sensors for messages with subjects “ASSGN”, “PRGRS”, and “SHP”. These messages instruct the object to produce three different visual behaviours that represent 1) assignment of a bay to a module, 2) a certain progress of the module, or 3) shipping of a module out of the yard. An “ASSGN” message will trigger four actuators: the first one adds the module to the bay that is receiving this message, the second and third resets progress properties to 0, and the fourth resets an interpolated animation curve (IPO) to its original state, which represents 0 progress of the module.
A “PRGRS” message will first signal its controller to read the percentage of progress sent from the federate. Then, the message will trigger two actuators. The first actuator will calculate an animation frame to represent the percentage of progress sent. The second actuator uses the calculated frame number to change the look of the 3D object that represent the module. The change is based on a predefined IPO that represent different states of the module from 0% complete to 100% complete.
The last message (“SHIP”) triggers three actuators that reset progress properties and remove the 3D module prototype from the scene.
ITcon Vol. (2010), ElNimr & Mohamed, pg. 36
FIG. 11: Bay Object logic bricks in the Yard BGE
2.2.5 Lessons Learned from the Two Implementations of the HSV Framework
One of the objectives of the proposed HSV framework is to enable development and integration of components that are designed and optimized for 3D visualization with independently developed simulations. The two implementations described in the previous sections represent two different approaches towards this objective and they attempt to capitalize on the technologies uses in video game development. There are a number of lessons learned from these implementations that highlight their potentials and limitations.
The first implementation using the TureVision 3D engine enabled seamless integration with the HLA framework as both are .NET based. However, generating visual behaviours in response to simulation interactions using code required significant programming background despite the high level functionality that the engine provides. In addition, the engine provides functions to manipulate an existing set of objects but does not help much with the creation (modelling) of the 3D world, which is not a trivial task.
The second implementation using Blender Game Engine (BGE) provided a more effective way to customize and generate visual behaviours that represent simulation interactions for a wide set of simulated construction operations. The effectiveness comes from a number of sources. First, the engine provides a graphical user interface (GUI) that encapsulates most of its functions and allows a developer with little programming background to customize behaviours for different 3D objects. Second, the Blender environment (which BGE is part of) provides a rich set of tools to create, customize, or import 3D worlds, which reduces the need to switch between different software and development environments. On the other hand, the difference in architecture and underlying programming language caused the connection between the BGE and the .NET based HLA framework to be a challenge. The use of a standard network protocol (i.e. UDP) proved to be an effective solution to this challenge that can enable the use of other visualization platforms heterogeneous to the .NET environment with ease.
In both cases importing 3D models from CAD files or other sources proved to be a non-trivial task due to the difference between the level of detail and amount of information stored in different 3D file formats.
3. CONCLUSIONS AND FUTURE RESEARCH This paper described the use of 3D game engines in the development of a simulation driven visualization framework. The framework is based on distributed simulation standards and utilizes the game engines as stand-alone visualization components that are not part of the main simulation loop. Two engines with different architectures were utilized in two different implementations to evaluate their effectiveness. Both engines were successfully integrated with the simulation and were able to produce the required visual behaviours to represent simulation interactions. The first engine integrates more naturally with the distributed simulation infrastructure but relies heavily on programming skills and therefore requires more time. The second engine required the development of a special network connection to enable communication with the main simulation. Nevertheless,

ITcon Vol. (2010), ElNimr & Mohamed, pg. 37
it proved more effective in representing simulation interactions through 3D visual behaviours. The effectiveness comes from the ability to use a graphical user interface to generate the required behaviours with minimal code writing skills. For construction researchers, this is an advantage as the unique nature of construction operations requires rapid prototyping and customization of solutions within short decision making time windows.
Future development of this framework will focus on expanding the range of visual behaviours to represent a wider range of simulation interactions in graphical format. It will also focus on enabling two way communications between simulation- and graphics-dedicated components to allow users to be more involved in the simulation loop and be able to try different decisions during the simulation run.

ITcon Vol. (2010), ElNimr & Mohamed, pg. 38
4. REFERENCES Hajjar D. and Abourizk S. (1999). Simphony: an environment for building special purpose construction
simulation tools, Proceedings of the Winter Simulation Conference , Phoenix, USA, December 1999.
Halpin D. and Woodhead R. (1976). Design of construction and process operations, John Wiley & Sons, New York, N.Y., USA.
Blender Foundation. (2010). Help & Education [Online] Available at: http://www.blender.org/education-help/.
Truevision3D. (2010). 3D Engine and Game Development SDK by Truevision3D [Online] Available at: http://www.truevision3d.com/.
Huang R. and Halpin D. (1994). Simulation of cable stayed bridges using DISCO, Proceedings of the Winter Simulation conference, Buena Vista, USA, December 1994.
Ioannu P. and Martinez J. (1996). Animation of complex construction simulation models, Proceedings of the Congress of Computer in Civil Engineering, New York, USA, 1996.
Kalk A. and Douglas S. (1980). Insight: Interactive simulation of construction operations using graphical techniques, Technical Report No. 283, Construction Institution, Department of Civil Engineering, Stanford Univ., Stanford, California, USA.
Kamat V. and Matrinez J. (2001). Visualizing simulated construction operations in 3D, Journal of Computing in Civil Engineering, Vol. 15, No.4, October 2001.
Kamat V. and Matrinez J. (2008). Software mechanisms for extensible and scalable 3D visualization of construction operations, Journal of Advances in Engineering Software, Vol. 39, No.8, August 2008.
Oloufa A. (1993). Modelling and simulation of construction operations, Journal of Automation in Construction, Vol. 1, No.4, March 1993.
Oloufa A.A. and Crandall K.C.(1992). Feedback mechanism for operational simulation, Journal of Computing in Civil Engineering, Vol. 6, No. 2 , April 1992.
Paulson B.C., Douglas S.A., Kalk A., Touran A. and Victor G. (1983). Simulation and analysis of construction operations, Journal of Technical Topics in Civil Engineering, Vol. 109, No. 2 , August 1983.
Shannon R.E. (1975). System Simulation: The art and science, Prentice-Hall, Englewood Cliffs, N.J., USA.
Rohrer M. and McGregor I. (2002). Simulating reality using Auto-Mod, Proceedings of the Winter Simulation Conference, San Diego, USA, December 2002.
Xu J. and Abourizk S. (1999). Product-based model representation for integrating 3D CAD with computer simulation, Proceedings of the Winter Simulation Conference, Phoenix, USA, December 1999.