Application of Functional Analysis Techniques and...
22
5 Application of Functional Analysis Techniques and Supervision of Thermal Power Plants M.N. Lakhoua Member IEEE Laboratory of Analysis and Command of Systems (LACS) ENIT, Le Belvedere, Tunis, Tunisia 1. Introduction Supervision consists of commanding a process and supervising its working [1]. To achieve this goal, the supervisory system of a process must collect, supervise and record important sources of data linked to the process, to detect the possible loss of functions and alert the human operator. The main objective of a supervisory system is to give the means to the human operator to control and to command a highly automated process [2]. So, the supervision of industrial processes includes a set of tasks aimed at controlling a process and supervising its operation. An automatic supervisory system is a traditional supervisory system, that is to say, a system which provides a hierarchical list of alarms generated by a simple comparison with regard to thresholds [3]. The information synthesis system manages the presentation of information via any support (synoptic, console, panel, etc.) to the human operator. Today, the supervision of production systems is more and more complex to perform, not only because of the number of variables always more numerous to monitor but also because of the numerous interrelations existing between them, very difficult to interpret when the process is highly automated [4]. The challenge of the future years is based on the design of support systems which let an active part to the supervisory operators by supplying tools and information allowing them to understand the running of production equipment. Indeed, the traditional supervisory systems present many already known problems. First, whereas sometimes the operator is saturated by an information overload, some other times the information under load does not permit them to update their mental model of the supervised process [5]. Moreover, the supervisory operator has a tendency to wait for the alarm to act, instead of trying to foresee or anticipate abnormal states of the system. So, to avoid these perverse effects and to make operator’s work more active, the design of future supervisory systems has to be human centred in order to optimize Man-Machine interactions [6]. It seems in fact important to supply the means to this operator to perform his own evaluation of the process state. To reach this objective, Functional Analysis seems to be a promising research method. In fact, allowing the running of the production equipment to be www.intechopen.com
Transcript of Application of Functional Analysis Techniques and...

5
Application of Functional Analysis Techniques and Supervision of Thermal Power Plants
M.N. Lakhoua Member IEEE
Laboratory of Analysis and Command of Systems (LACS) ENIT, Le Belvedere, Tunis,
Tunisia
1. Introduction
Supervision consists of commanding a process and supervising its working [1]. To achieve
this goal, the supervisory system of a process must collect, supervise and record important
sources of data linked to the process, to detect the possible loss of functions and alert the
human operator.
The main objective of a supervisory system is to give the means to the human operator to
control and to command a highly automated process [2]. So, the supervision of industrial
processes includes a set of tasks aimed at controlling a process and supervising its
operation.
An automatic supervisory system is a traditional supervisory system, that is to say, a system
which provides a hierarchical list of alarms generated by a simple comparison with regard
to thresholds [3]. The information synthesis system manages the presentation of information
via any support (synoptic, console, panel, etc.) to the human operator.
Today, the supervision of production systems is more and more complex to perform, not
only because of the number of variables always more numerous to monitor but also because
of the numerous interrelations existing between them, very difficult to interpret when the
process is highly automated [4].
The challenge of the future years is based on the design of support systems which let an
active part to the supervisory operators by supplying tools and information allowing them
to understand the running of production equipment. Indeed, the traditional supervisory
systems present many already known problems. First, whereas sometimes the operator is
saturated by an information overload, some other times the information under load does not
permit them to update their mental model of the supervised process [5].
Moreover, the supervisory operator has a tendency to wait for the alarm to act, instead of
trying to foresee or anticipate abnormal states of the system. So, to avoid these perverse
effects and to make operator’s work more active, the design of future supervisory systems
has to be human centred in order to optimize Man-Machine interactions [6].
It seems in fact important to supply the means to this operator to perform his own
evaluation of the process state. To reach this objective, Functional Analysis seems to be a
promising research method. In fact, allowing the running of the production equipment to be
www.intechopen.com

Thermal Power Plants 92
understood, these techniques permit designers to determine the good information to display
through the supervisory interfaces dedicated to each kind of supervisory task (monitoring,
diagnosis, action, etc.). In addition, Functional Analysis techniques could be a good help to
design support systems such as alarm filtering systems [7].
By means of a significant example, the objective of this paper is to show interests of the
use of Functional Analysis (FA) techniques such as SADT (Structured Analysis Design
Techniques) and SA-RT (Structured Analysis Real Time) for the design of supervisory
systems. An example of a SCADA system of a thermal power plant (TPP) is presented.
The next section briefly describes the characteristics of a SCADA system and the
problems linked to its design. Next, the interests of using FA in the design steps are
developed. In Section 3, after presenting concepts of SADT and SA-RT, these methods
are applied to a SCADA system of a TPP. The last section presents a discussion about the
advantages and inconveniences of FA techniques and some examples of SCADA
applications in a TPP.
2. Presentation of supervisory control and data acquisition system
The SCADA term (supervisory control and data acquisition) refers to a system that
collects data coming from different sensors of an industrial or other process [8] [9] [10],
these sensors can beings installed in the same site or distant (several Km), the introverted
data are treated by an unit called processor power station (CPU, PCU, PC...), results are
sent in real time to the Men / Machine interfacing that can be a computer with its
peripherals (See Figure 1).
The SCADA system of the TPP of Radès (in Tunisia) orders and classifies all data for [11]
[12]:
Instantaneous impression.
Visualization on screen using data tables and tabular diagrams.
Registration of instantaneous exchanges of numeric and analogical data.
Instantaneous calculation for example corrections of gas debits, direct middle specific
consumption, middle values.
Storage of the analogical information of the process.
Calculation of outputs and losses of the process.
Surveillance of the SOE signals (entrances rapid contact 1ms)
Interfacing interactive Men / Machine for the surveillance of the system and the
conduct of processes (tabular, curves view of alarm).
The objective of the SCADA system of the TPP of Radès is to collect data instantaneously
(ON LINE) of their sites and to transform them in numeric data. This centralized
supervision allows operators, since the room of control of the TPP, to control facilities in
their domain of exploitation and the different types of incidents.
The SCADA system of the TPP of Radès is equipped of three networks of communication:
Field bus, 5 Mbits, permitting to do exchanges of the numeric data of the entrance card / exits (FBM) toward the central system (CP) via modules of communication (FCM);
Node bus, 10 Mbits, permitting to do exchanges of the numeric data of the central system (CP) via modules of communication (DNBT) toward the Men/Machine interfacing (workstations);
www.intechopen.com

Application of Functional Analysis Techniques and Supervision of Thermal Power Plants 93
Fig. 1. SCADA system of the TPP.
Ethernet TCP/IP, 100 Mbits, permitting to do exchanges of files between
workstations of the Men/Machine interfacing. It avoids so the overcharge of the
Nodebus network.
Figure 2 presents the different links between the CP60, FCM and FBM blocks.
www.intechopen.com

Thermal Power Plants 94
Fig. 2. The CP60/FCM/ FBM links.
3. Functional analysis of a SCADA system
There are many methods that have been used to enhance participation in Information
System planning and requirements analysis [13]. We present the application of SADT and
SA-RT methods on a SCADA system.
The SADT method represents attempts to apply the concept of focus groups specifically to
information systems planning, eliciting data from groups of stakeholders or organizational
teams. SADT is characterized by the use of predetermined roles for group/team members
and the use of graphically structured diagrams. It enables capturing of proposed system’s
functions and data flows among the functions [14].
SADT, which was designed by Ross in the 1970s [15], was originally destined for software
engineering but rapidly other areas of application were found, such as aeronautic,
production management, etc.
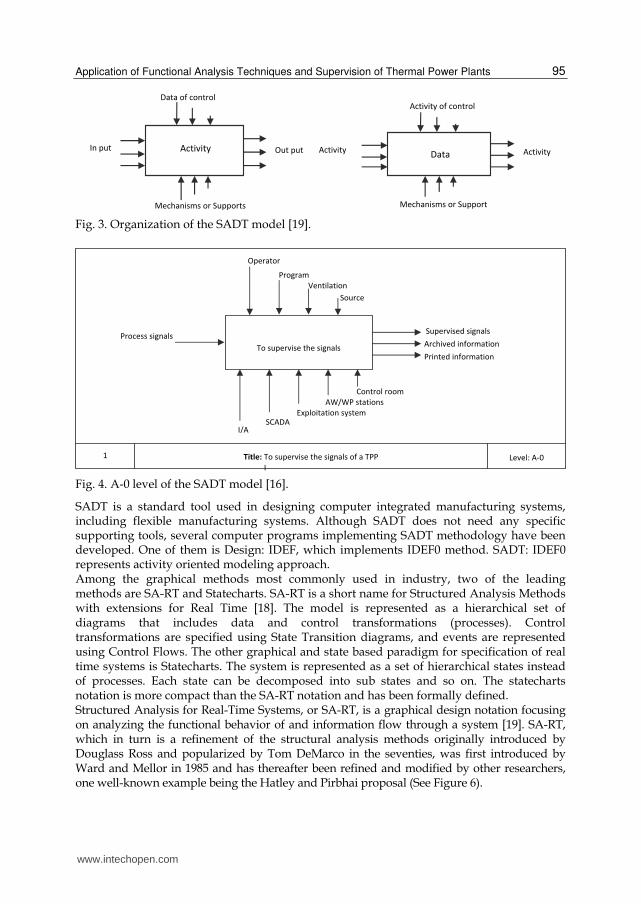
For SADT diagrams or function boxes, we will consider two events to be representing the
activation states of the activities. The first event represents the instant when the activity is
triggered off, and the second event represents the ending instant.
Figure 3 presents the Actigram and Datagram of the SADT model.
The boxes called ICOM’s input-control-output-mechanisms are hierarchically decomposed.
At the top of the hierarchy, the overall purpose of the system is shown, which is then
decomposed into components-subactivities. The decomposition process continues until
there is sufficient detail to serve the purpose of the model builder.
Figures 4 and 5 present respectively the A-0 and the A0 levels of the SADT model of a SCADA system [16] [17].
www.intechopen.com
Application of Functional Analysis Techniques and Supervision of Thermal Power Plants 95
Fig. 3. Organization of the SADT model [19].
Fig. 4. A-0 level of the SADT model [16].
SADT is a standard tool used in designing computer integrated manufacturing systems, including flexible manufacturing systems. Although SADT does not need any specific supporting tools, several computer programs implementing SADT methodology have been developed. One of them is Design: IDEF, which implements IDEF0 method. SADT: IDEF0 represents activity oriented modeling approach. Among the graphical methods most commonly used in industry, two of the leading methods are SA-RT and Statecharts. SA-RT is a short name for Structured Analysis Methods with extensions for Real Time [18]. The model is represented as a hierarchical set of diagrams that includes data and control transformations (processes). Control transformations are specified using State Transition diagrams, and events are represented using Control Flows. The other graphical and state based paradigm for specification of real time systems is Statecharts. The system is represented as a set of hierarchical states instead of processes. Each state can be decomposed into sub states and so on. The statecharts notation is more compact than the SA-RT notation and has been formally defined. Structured Analysis for Real-Time Systems, or SA-RT, is a graphical design notation focusing on analyzing the functional behavior of and information flow through a system [19]. SA-RT, which in turn is a refinement of the structural analysis methods originally introduced by Douglass Ross and popularized by Tom DeMarco in the seventies, was first introduced by Ward and Mellor in 1985 and has thereafter been refined and modified by other researchers, one well-known example being the Hatley and Pirbhai proposal (See Figure 6).
www.intechopen.com

Thermal Power Plants 96
Fig. 5. A0 level of the SADT model [16].
Fig. 6. Organization of an SA-RT model [19].
www.intechopen.com

Application of Functional Analysis Techniques and Supervision of Thermal Power Plants 97
Thus, SA-RT is a complex method for system analysis and design. This is one of the most
frequently used design method in technical and real-time oriented applications adopted by
various Case-Tools. It is a graphical, hierarchical and implementation independent method
for top-down development.
SA-RT method enables us to identify an entrance and an exit of data in an algorithm or a
computer program. It is divided in three modules: Diagram of Context, Data Flows Diagram
and Control Flows Diagram. Every module includes in its graphic interpretation different
symbols.
So, the SA-RT model is composed exclusively of diagrams [20]. It starts with the main
process ‘To supervise the signals of the TPP’ (Figure 7). Then, this process is broken into a
preliminary data flows diagram composed of three processes. We continue the
decomposition of the processes until the last decomposition level has been reached (levels
DFD1, DFD2 and DFD3).
For this example, we present the control flow diagram of the application of the SCADA
system in a hydrogen station (Figure 8).
Fig. 7. Diagram of Context of the SCADA system [20].
In order to give a detailed vision of the control of the hydrogen station, we present on
Figure 9 an example of a State/Transition diagram.
Compared to the results given by the SADT method, the SA-RT method allows a functional
as well as a temporal analysis.
The possible uses for the SADT and the SA-RT models are the design of a monitoring
display and a diagnosis display. For the design of a monitoring display, the A0 level of the
SADT model or the preliminary data flow diagram of the SA-RT model supplies a global
view of the system. Indeed, information relative to each function represented through this
level should appear in a monitoring display.
For the design of hierarchical diagnosis displays, each actigram of the SADT model or data
flows diagram of the SA-RT model constitutes a vision at a given abstraction level. So, each
www.intechopen.com

Thermal Power Plants 98
of these actigrams gives a less or more detailed vision. In function of the objectives defined
by the designer for each display, a particular actigram or data flows diagram can supply the
required information.
Fig. 8. Control Flows Diagram of the SCADA system [20].
Fig. 9. State/Transition diagram of the SCADA system [20].
Finally, this application of the FA techniques on the SCADA system of a TPP shows briefly the interests of the SADT and SA-RT methods in the design of supervisory systems.
4. Application of the supervision of a hydrogen station of a TPP
The objective of this application is to show interests of the use of a SCADA system in a hydrogen station of a TPP. In fact, the cooling by hydrogen has been adopted for turbo-alternators in 1926. This technique has been used for the interior cooling of drivers while doing circulating of the fluid in their conducts, putting the fluid in contact with materials in which the heat is produced.
www.intechopen.com

Application of Functional Analysis Techniques and Supervision of Thermal Power Plants 99
Hydrogen is an odorless, colorless, very light gas (more that air) and composed of two atoms of hydrogen. It possesses a high gravimetric energizing power: 120 MJ/kgs compared to oil (45 MJ/kgs), to the methanol (20 MJ/kgs) and to the natural gas (50 MJ/kgs). However it is as the lightest gas (2,016g/mol H2), of where a weak volumetric power: 10,8MJ/m3 facing the methanol (16 MJ/m3), natural gas (39.77 MJ/m3). It puts a real problem of storage and transport: that it is for the utilization of hydrogen in a vehicle or for the transport in pipeline, in truck, it is the volumetric density that imports. The volumetric energizing density of H2 is not interesting that to the state liquid tablet either (700 bars). The fact that a mixture of hydrogen and air is an exploding mixture on a large range of proportions, the machine and the procedure of utilization specified is conceived so that no exploding mixture can occur in the normal conditions of working. The aforesaid unforeseen conditions cannot present themselves that during the replacement. However the pressure of gas being nearly equal to the air pressure in this condition, the intensity of explosion can take place doesn't pass to the more of 7bar. The purity of hydrogen H2 in an alternator is always maintained superior to 95% until 98% and when it decreases to 90% an alarm is given out to the panel of the local cupboard as well as the room of control. Preventing gas H2 intern to form an exploding the mixture. It is necessary to renew a certain volume of H2 lodged in the alternator by another volume coming from bottles H2. The principle of the interior cooling permitted the increase of the strength of the alternator and an efficient utilization of the hydrogen pressure (See Figure 10).
Fig. 10. Cooling by hydrogen of an alternator.
Gas hydrogen is introduced in the alternator while manipulating the regulator of pressure or the regulator. When the purity of hydrogen measured is 95% or more on the meter, its feeding is stopped, the regulator of pressure is adjusted foreseen at the level and the pressure of the alternator is increased. Thus, gas hydrogen is introduced in the envelope, giving back the ready alternator to the working. The diagram of circuit of the system of gas control represents the position of every floodgate during the working.
www.intechopen.com
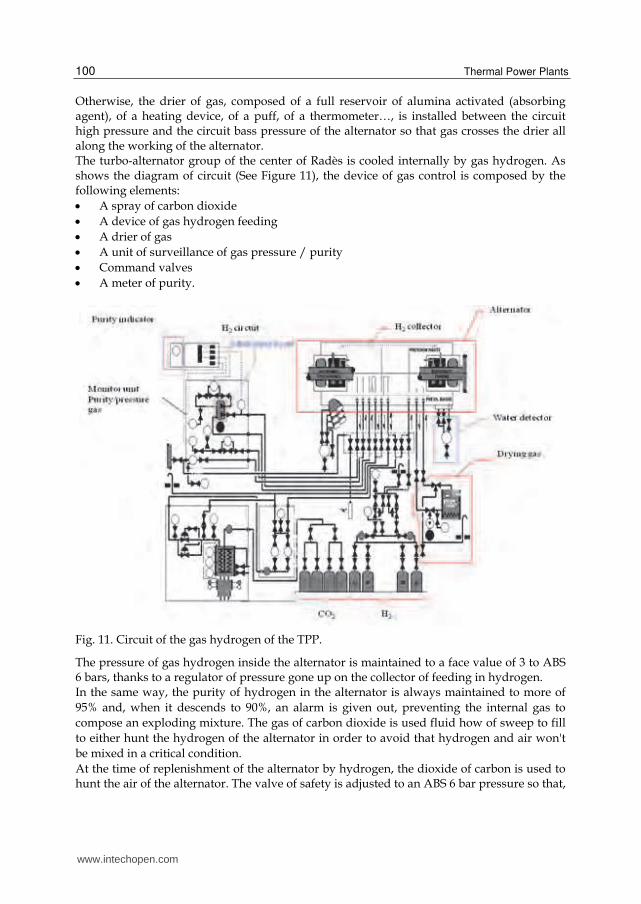
Thermal Power Plants 100
Otherwise, the drier of gas, composed of a full reservoir of alumina activated (absorbing agent), of a heating device, of a puff, of a thermometer…, is installed between the circuit high pressure and the circuit bass pressure of the alternator so that gas crosses the drier all along the working of the alternator. The turbo-alternator group of the center of Radès is cooled internally by gas hydrogen. As shows the diagram of circuit (See Figure 11), the device of gas control is composed by the following elements:
A spray of carbon dioxide
A device of gas hydrogen feeding
A drier of gas
A unit of surveillance of gas pressure / purity
Command valves
A meter of purity.
Fig. 11. Circuit of the gas hydrogen of the TPP.
The pressure of gas hydrogen inside the alternator is maintained to a face value of 3 to ABS 6 bars, thanks to a regulator of pressure gone up on the collector of feeding in hydrogen. In the same way, the purity of hydrogen in the alternator is always maintained to more of
95% and, when it descends to 90%, an alarm is given out, preventing the internal gas to
compose an exploding mixture. The gas of carbon dioxide is used fluid how of sweep to fill
to either hunt the hydrogen of the alternator in order to avoid that hydrogen and air won't
be mixed in a critical condition.
At the time of replenishment of the alternator by hydrogen, the dioxide of carbon is used to hunt the air of the alternator. The valve of safety is adjusted to an ABS 6 bar pressure so that,
www.intechopen.com

Application of Functional Analysis Techniques and Supervision of Thermal Power Plants 101
when an anomaly occurs in the circuit of gas of carbon dioxide, the pressure of the bottle is exercised on all tubings. The CO2 being heavier than air, it is provided in the alternator through the lower
distribution hose. It is then necessary to measure the purity of gas to the top of the
alternator: the lower hose leads to the valve of command in the post office of distribution
that is opened opportunely and closed.
In the same way, the puff of the meter of the purity is starting up in the alternator with the
spray in start. When the purity of carbon dioxide gotten on the meter of purity is besides
75%, the feeding is stopped and hydrogen is by following introduces to its room.
By reason of its relatively weak weight in relation to the CO2, gas hydrogen is provided with
the help of the superior hose of distribution of the alternator.
The purity of gas hydrogen must be measured to the bottom of the alternator that is for it
the valve of command is opened appropriately and closed. A regulator of pressure is
installed between the hose of gas feeding and the station of gas hydrogen in order to
maintain the pressure of the internal gas to a value wanted of 1 to 8 Abs bars.
In this application, we present on the one hand, the programming of the general numbering,
timetable and daily of the gas hydrogen consumption and on the other hand, the
configuration of a new tabular circuit gas hydrogen containing the new information [21].
Figure 12 presents the new tabular of the Hydrogen circuit containing the new
modifications.
Fig. 12. New tabular of the hydrogen circuit [21].
www.intechopen.com

Thermal Power Plants 102
The TPP of Radès arranges a regulator of pressure that assures the feeding of H2. When the uncommunicative gas in the alternator and the pressure is increased the regulator in will be stopped. The calculation of hydrogen flights makes himself by hand therefore we cannot have an exact value on these flights. This value is not displayed on the SCADA system. The daily taking of values of numberings of flights of hydrogen consumption decreases the precision of calculation of the output of every slice. To remedy these problems we propose a solution of automatic reading of the value of the gas hydrogen flight. The proposed solution is to make the calculation of flights by the SCADA system and to program blocks of the daily calculation. This solution is automatic and cyclic where the period of the time is stationary. The algorithmic of treatment is based on the concepts of block and diagram (or compound). Indeed, a block is a software entity that achieves a specific function more less complex (stake to the ladder, conversion, filtering, calculation, test of alarms, etc.) definite by its algorithm. For the configuration stage, we used the ICC software (Integrated Control Configuration). This software permits the creation and configuration of the resident program in the CP60. For the conception stage of the tabular, we used the FoxDraw software. This software possesses a library of components permitting to represent the various elements of an industrial installation.
5. Application of the supervision of a water steam - cycle a TPP
Considering that the water used contains an elevated rate in dissolved salts and in matter suspended, it is indispensable to adopt a stage of pretreatment to assure the good working of the inverse osmosis installation and to protect modules against risks of usuries, corrosion and especially membrane calmative. The pretreatment is constituted of two filtration chains each including a sand filter and an active coal filter. Thereafter, we present the two stations of the TPP: inverse osmosis and demineralization. The control of the water quality is an important task to maintain the efficiency and the sure and continuous working of the power station. To guarantee the best water quality at the level of the water steam circuit, the TPP of Radès arranges an inverse osmosis station that permits to eliminate the majority of salts dissolved in the raw water before being treated in a demineralization station (See Figure 13). This stage serves to minimize risks of failing by corrosion of the turbine or the loss of the efficiency and the power. The basic principle of the ion exchange consists in withdrawing ions (remaining salts that are lower to 8%) in solution in water is to recover an ion of value, either to eliminate a harmful or bothersome ion for the ulterior utilization of water. The exchange of ions is a process which ions with a certain load contents in a solution are eliminated of this solution, and replaced in the same way by an equivalent quantity of other ions load gave out by the strong but the opposite load ions are not affected. In the demineralization chain, osmosis water passes by the following stages:
a weak cationic exchanger (CF1); a strong cationic exchanger (CF2); a weak anionic exchanger (AF1); a degasser; a strong anionic exchanger (AF2); a strong cationic exchanger (CF3); a strong anionic exchanger (AF3).
www.intechopen.com

Application of Functional Analysis Techniques and Supervision of Thermal Power Plants 103
After the demineralization, the water must have a lower conductivity of 0.2 µS/cm, a pH between 6.5 and 7.5; silica < 30 ppb. Figure 14 presents the cycle of the water treatment in the demineralization station.
Legend: FS1: Sand filter of the filtration chain 1. FC1: Active coals filter of the filtration chain 1. FS2: Sand filter of the filtration chain 2. FC2: Active coals filter of the filtration chain 2. The bold lines present the water circuit in the two filtration chains and the light lines present the water circuit in the two inverse osmosis chains.
Fig. 13. Functional diagram of the inverse osmosis station of the TPP.
In order to remedy to the absence of indication, of follow-up and of storage of the chemical characteristics of the water of the furnace, it is necessary to achieve an interfacing between the chemical sensors (pH meter and conductivity meter) and the stations of surveillance of the control room of the TPP. The interfacing of the signals of the pH and the conductivity of the ball furnace is assured by a data configuration of both analogical and numeric signals and requires a unique code for every entrance which must be programmed in the data base system. This application is declined in six stages: Stage 1: Choosing the site of the signal (FBM module). Stage 2: Programming both AIN and CIN blocks for the supervision of the signals pH (4 to 20 mA) and conductivity (alarm). Stage 3: Testing both AIN and CIN blocks by injection of current and by short circuit. Stage 4: Passing the cable between the sampling room and the SCADA room. Stage 5: Connecting the signals in the two modules 10FBM215 and 10FBM325. Stage 6: Conceiving a new tabular for the general vision of the sampling room. The last stage of this application of interfacing consists in improving the tabular pH meter and conductivity meter. Figure 15 presents the display of the sampling room containing the chemical analysis parameters of the water - steam cycle of the TPP.
www.intechopen.com

Thermal Power Plants 104
Fig. 14. Demineralization station of the TPP.
Fig. 15. Display of the chemical analysis parameters [22].
www.intechopen.com

Application of Functional Analysis Techniques and Supervision of Thermal Power Plants 105
6. Application of the supervision of pumps vibrations of a TPP
Systems of vibration surveillance are often equipped of measure chains for other
complementary parameters, as the axial position, the crankiness, the differential dilation, the
dynamic pressure, the speed of rotation and the temperature.
Among the new systems of measures, we mention notably IDS (system of icing detection)
and AGMS (system of measure of the bore between the rotor and the stator) that complete a
system of vibration surveillance efficiently, but that are also usable as of the autonomous
specific systems [23].
The MMS system (System of Machine Surveillance) is the synthesis of the long experience of
Vibro-Meter in the domain of the surveillance of machines and its expertise to master
technologies of vanguard as for the manufacture of the electronic of surveillance.
The instrument of vibration control measures the vibration all the time when machines
(turbine of power plant, big dimension compressor, pump, blower…) are in service. When
the supervised vibration reached the amplitude of vibration, that is adjusted in advance, the
instrument gives out an exit of point of alarm contact to give a warning to the working of
the machine or gives out an instruction to stop the working of the machine, avoiding so the
danger and accidents before they occur.
The mechanical vibration that is developed in a machine is controlled by a sensor of vibration
and is converted in electric signal and this signal is introduced in an amplifier of vibration. In
this amplifier, a signal that is proportional to the speed of vibration and supervised by an
instrument of vibration control, and convert in a signal that is proportional to the displacement
of the vibration, and this last is to its tower convert in a tension to continuous current, that is
given back like signal to an indicator and a signal to the circuit of alarm.
The instrument of vibration measure used in our application is constituted by a sensor of
vibration (Model U1-FH) and an instrument of vibration control (Model AVR-148). In fact,
the sensor of vibration, model U1-F, is similar to the construction of a loudspeaker to
permanent magnet. The sensor is attached to the machine on the one hand with screws and
on the other hand to connect to the system of registration with the special cables.
With sensors of Vibro-Meter, we can measure in general most the critical parameters in the
surveillance of machines, but particularly what concerns vibrations. In this domain, Vibro-
Meter proposes a vast range of sensors, of conditioners of the signal as well as an effective
signal transmission.
Sensors of proximity and other translators of displacement are based on currents of Foucault
and present a high linearity with an active compensation of the temperature. Some sensors,
as piezoelectric accelerometers, have favors to be deprived of the mobile pieces, what
permits to guarantee their reliability and a long life span.
The piezoelectric sensor is used as detector of shock, vibration or percussion. It captures the
mechanical vibrations that transmit itself in a material.
Figure 16 presents the diagram block of the system vibratory surveillance of a pump used in
a TPP [24].
To achieve a complete monitor of surveillance, we always associate a module of treatment
UVC 691 with a module of surveillance with a high performance PLD 772.
UVC 691 is a module of signal treatment assorted to different sensors and conditioners via a
galvanic separation.
www.intechopen.com

Thermal Power Plants 106
Most modules of Vibro-Meter provide unipolar signals in the range of 0 to 10 V DC.
However, the PLD 772 can accept some bipolar signals in the range of 0 to ±10 V DC.
Fig. 16. Block diagram of vibratory surveillance.
In fashion of programming of the PLD 772, the user has the possibility to define the
calibration of the display and all parameters of alarm. While equipping the PLD 772 of an
interfacing RS-485, the module is capable to the digital communication (Figure 17). Thus, a
system of surveillance can make part of a cabled network. A computer detains the main
computer role. All other modules PLDS 772 in racks are some secondary stations. Such a
link between a system of surveillance and a main computer is in measure to do functions of
programming from afar and of data transfer.
The central computer can read the calibration of every module at all times PLD 772.
Instructions of set up and a special authorization permit to modify parameters of calibration
or doorsteps of alarm of every surveillance module. Commands become thus easy and the
result is from afar a fully programmable surveillance system.
The computer calls each module periodically to ask it the measured values (DC signals) and
the state of alarm of every channel. Such a process of acquirement suits the registration of
data and the creation of a data basis very well with the acquisition in DC in order to do an
analysis of tendency subsequently using software of conditional maintenance.
We have built many displays with FoxDraw that are used by FoxView, and become the I/A
Series interface to the pumping process of the TPP (See Figure 18).
Monitoring display and diagnosis display are important for the supervisory system. A global view of the system should appear the information needed for the pumping process [25].
www.intechopen.com

Application of Functional Analysis Techniques and Supervision of Thermal Power Plants 107
Fig. 17. Transfer of data between units.
Fig. 18. Display of the pump A of the TPP [24].
Mac II
Keyboard
Mouse
RS-485
Vibration
Position
Temperature
System of surveillance ON-LINE
US
G
www.intechopen.com
Thermal Power Plants 108
7. Conclusion
SCADA systems are used to control and monitor physical processes, examples of which are
transmission of electricity, transportation of gas and oil in pipelines, water distribution,
traffic lights, and other systems used as the basis of modern society.
SCADA system gathers information, transfers the information back to the central site,
alerting the home station and carrying out necessary analysis and control, and displaying
the information in a logical and organized fashion.
In this work, we presented on the one hand an application of Functional Analysis (FA)
techniques on a SCADA system of thermal power plant (TPP) and on the other hand some
examples of SACDA applications.
The first application of the SCADA system consists in integrating a module for the
calculation of hydrogen flights in the alternator. The proposed solution was permit to
elaborate a new tabular for the hydrogen circuit containing the new modifications. The
second application of the SCADA system consists in interfacing the chemical analysis
parameters of a water- steam cycle to the SCADA system. The third application is related
to the supervision of a system of vibratory surveillance in a TPP. This application enables
us the creating and the maintaining dynamically updating the pumping process
displays.
This achieved applications is going to facilitate the work of both laboratory and
instrumentation agents in the TPP.
Functional Analysis techniques seem to be a promising way because the major advantage of
these kinds of techniques is due to the concept of function and abstraction hierarchy which
are familiar to the human operator. These techniques permit the complexity of a system to
be overcome.
In this paper, the application of SADT and SA-RT methods on a real system, a SCADA
system of a TPP generates a source of useful information for the design of a supervisory
system (monitoring and diagnosis displays, definition of alarms, etc.). So, research into the
application of FA techniques for the design of a human centered supervisory system must
be intensified in order to solve several difficulties and to improve their efficiency (tools to
build the model, tools to check the validity of the model, etc.).
8. Acknowledgements
The author extends his especial thanks to Moncef Harrabi and Moez Lakhoua, Tunisian Society of Electricity and Gas (STEG) for their valuable help.
9. References
[1] Bailey D., Wright E., Practical SCADA for Industry, Elsevier, 2003.
[2] Clarke G., Reynders D., Wright E., Practical Modern SCADA Protocols, Elsevier,
2003.
[3] Gergely E.I., Coroiu L., Popentiu-Vladicescu F., Analysis of the Influence of the
Programming Approach on the Response Time in PLC Control Programs,
www.intechopen.com

Application of Functional Analysis Techniques and Supervision of Thermal Power Plants 109
Journal of Computer Science and Control Systems, 3(1), 2010, Oradea,
Romania, pp 61-64.
[4] Avlonitis S.A., Pappas M., Moutesidis K., Avlonitis D., Kouroumbas K., Vlachakis N., PC
based SCADA system and additional safety measures for small desalination plants,
Desalination 165, 2004, p. 165-176.
[5] Heng G. T., Microcomputer-based remote terminal unit for a SCADA system, Microprocessors
and Microsystems, Volume 20, Issue 1, 1996, p. 39-45.
[6] Horng J.H., SCADA system of DC motor with implementation of fuzzy logic controller on
neural network, Advances in Engineering Software 33, 2002, p. 361–364.
[7] Patel M., Cole G. R., Pryor T. L., Wilmota N. A., Development of a novel SCADA system for
laboratory testing, ISA Transactions 43, 2004, p. 477–490.
[8] Munro K., SCADA - A critical situation, Network Security, Vol. 2008, Issue 1, 2008, p. 4-
6.
[9] Wiles J., Supervisory Control and Data Acquisition: Techno Security's Guide to Securing
SCADA, 2008, p. 61-68.
[10] Wiles J., Techno Security's Guide to Securing SCADA: A Comprehensive Handbook On
Protecting The Critical Infrastructure, Elsevier, 2008.
[11] STEG, Rapport Annuel de la STEG, Société Tunisienne de l’Electricité et du Gaz,
2008.
[12] Revue de l’électricité et du gaz, Société Tunisienne de l’Electricité et du Gaz, N°16,
2008.
[13] Peffers K., Planning for IS applications: a practical, information theoretical method and
case study in mobile financial services, Information & Management, Vol.42, Issue
3, March 2005, pp. 483-501.
[14] Marca DA., McGowan CL., SADT: structured analysis and design technique, New York:
McGraw-Hill Book Co., Inc., 1988.
[15] Schoman K., Ross D.T., Structured analysis for requirements definition, IEEE
Transaction on Software Engineering 3 (1), pp. 6-15, 1977.
[16] Lakhoua M.N, Application of Functional Analysis on a SCADA system of a Thermal Power
Plant, Advances in Electrical and Computer Engineering journal, Issue No2. Vol.9,
2009, p. 90-98.
[17] Lakhoua M.N, Application of functional analysis for the design of supervisory systems: Case
study of heavy fuel-oil tanks, International Transactions on Systems Science and
Applications, Vol.5, N°1, 2009, p.21-33.
[18] Gomaa H., Software design methods for the design of large-scale real-time systems,
Journal of Systems and Software, vol. 25, Issue 2, pp 127-146, 1994.
[19] Jaulent P., Génie logiciel les méthodes : SADT, SA, E-A, SA-RT, SYS-P-O, OOD, HOOD,
Armand Colin, Paris, 1992.
[20] Lakhoua M.N., Application of SA-RT method to supervisory systems, Journal of
Electrical Engineering, ISSN: 1582-4594, Politechnica Publishing House, vol.11, N°2,
2011.
[21] Lakhoua M.N., Application of a SCADA system on a hydrogen station, Journal of
Electrical Engineering, vol.10, N°3, 2010.
www.intechopen.com

Thermal Power Plants 110
[22] Lakhoua M.N., “Systemic analysis of a supervisory control and data acquisition
system”, Journal of Electrical Engineering, ISSN: 1582-4594, Politechnica Publishing
House, vol.11, N°1, 2011.
[23] Système de surveillance des machines MMS, VIBRO-METER SA, Fribourg/Suisse, 4,
1990.
[24] Lakhoua M.N, Surveillance of pumps vibrations using a SCADA, Control Engineering and
Applied Informatics, Vol.12. N°1, 2010.
[25] Lakhoua M.N., Application of a supervisory control and data acquisition system in a
thermal power plant, 12th symposium Large Scale Systems: Theory and
Applications LSS’10, 11-14 July 2010, France.
www.intechopen.com

Thermal Power PlantsEdited by Dr. Mohammad Rasul
ISBN 978-953-307-952-3Hard cover, 266 pagesPublisher InTechPublished online 13, January, 2012Published in print edition January, 2012
InTech EuropeUniversity Campus STeP Ri Slavka Krautzeka 83/A 51000 Rijeka, Croatia Phone: +385 (51) 770 447 Fax: +385 (51) 686 166www.intechopen.com
InTech ChinaUnit 405, Office Block, Hotel Equatorial Shanghai No.65, Yan An Road (West), Shanghai, 200040, China
Phone: +86-21-62489820 Fax: +86-21-62489821
Thermal power plants are one of the most important process industries for engineering professionals. Over thepast few decades, the power sector has been facing a number of critical issues. However, the mostfundamental challenge is meeting the growing power demand in sustainable and efficient ways. Practicingpower plant engineers not only look after operation and maintenance of the plant, but also look after a rangeof activities, including research and development, starting from power generation, to environmentalassessment of power plants. The book Thermal Power Plants covers features, operational issues, advantages,and limitations of power plants, as well as benefits of renewable power generation. It also introduces thermalperformance analysis, fuel combustion issues, performance monitoring and modelling, plants healthmonitoring, including component fault diagnosis and prognosis, functional analysis, economics of plantoperation and maintenance, and environmental aspects. This book addresses several issues related to bothcoal fired and gas turbine power plants. The book is suitable for both undergraduate and research for higherdegree students, and of course, for practicing power plant engineers.
How to referenceIn order to correctly reference this scholarly work, feel free to copy and paste the following:
M.N. Lakhoua (2012). Application of Functional Analysis Techniques and Supervision of Thermal PowerPlants, Thermal Power Plants, Dr. Mohammad Rasul (Ed.), ISBN: 978-953-307-952-3, InTech, Available from:http://www.intechopen.com/books/thermal-power-plants/application-of-functional-analysis-techniques-and-supervision-of-thermal-power-plants

© 2012 The Author(s). Licensee IntechOpen. This is an open access articledistributed under the terms of the Creative Commons Attribution 3.0License, which permits unrestricted use, distribution, and reproduction inany medium, provided the original work is properly cited.