Application of fast light-readapted plants for measurement ...
11
245 PHOTOSYNTHETICA International Journal for Photosynthesis Research Application of fast light-readapted plants for measurement of chlorophyll fluorescence and P 700 light absorption with the RLC method E.A. LYSENKO Institute of Plant Physiology RAS, 35 Botanicheskaya St., 127276 Moscow, Russia Abstract Keywords: actinic light intensity; barley; pulse amplitude modulation; rapid light curves. Abbreviations: AL – actinic light; Chl – chlorophyll; D/L – plants adapted to darkness and readapted to light before the measurement; ETR – electron transport rate; F0 – minimal fluorescence yield of the dark-adapted state; F0' – minimal fluorescence yield of the light-adapted state; FM – maximal fluorescence yield of the dark-adapted state; FM' – maximal fluorescence yield of the light-adapted state; FS – steady-state fluorescence yield; FV – variable fluorescence; GL – grow light growth conditions; HL – high-light growth conditions; L – light-adapted plants without adaptation to darkness before the measurement; LL – low-light growth conditions; NPQ – nonphotochemical quenching; P – the steady state-level of P700 absorption in light; P0 – minimal P700 light absorption; P700 – reaction center Chl of PSI; PAM – pulse amplitude modulation; PM – maximal P700 change in the dark-adapted state; PM' – maximal P700 change in light; qC – coefficient of acceptor-side limitation of PSII; qN – nonphotochemical quenching coefficient; qP – photochemical quenching coefficient; RLC – rapid light curve; sHL – subhigh light growth conditions; SP – saturation pulse; Y(I) – coefficient of quantum yield of PSI; X(II) – relative quantum yield of PSII; Y(ND) – coefficient of limitation of PSI at the donor side; ΔC – portion of ‘closed’ PSII; ΔF – portion of photochemically active (‘open’) PSII; ΔP – portion of photochemically active PSI; ΦPSII – effective quantum yield of PSII photochemistry. Acknowledgements: The author thanks Dr. A.A. Klaus for growing the barley plants. Conflict of interest: The author declares no conflict of interest. Highlights ● Dark adaptation enables to measure all PAM values and calculate all coefficients. ● Short-time light adaptation restores both photosystems to the light-adapted state. ● Light-readapted plants show some differences from continuously light-adapted plants. Received 5 November 2020 Accepted 3 March 2021 Published online 12 April 2021 + Corresponding author phone: +7-963-610-1875 e-mail: [email protected] DOI 10.32615/ps.2021.015 PHOTOSYNTHETICA 59 (2): 245-255, 2021 The rapid light curve method is a time-saving approach to the measurement of photosynthetic processes over a wide spectrum of light intensities. The adaptation to darkness enables the calculation of a complete set of coefficients for chlorophyll (Chl) fluorescence and P 700 light absorption; however, dark-adapted plants demonstrate drastically different patterns of Chl fluorescence than that of light-adapted plants. The present work compared light-adapted barley plants without dark adaptation (L), and barley plants adapted to darkness and readapted to light for 7.5 min (D/L). The rapid light curves were generally similar in both the L and D/L variants. Some differences between the L and D/L variants were found in plants grown at any illumination. A number of distinctions between the L and D/L variants were characteristic of plants grown under particular illumination levels. The present analysis demonstrated that the scheme including dark adaptation and short readaptation to light (D/L) enabled to obtain generally correct data. Introduction The pulse amplitude modulation (PAM) method is a powerful tool for the investigation of photosynthesis. The induced fluorescence of chlorophyll (Chl) enables the assessment of the activity of PSII (Lichtenthaler et al. 2005, Kalaji et al. 2014). Light absorption in the far-red part of the spectrum allows the measurement of the activity of PSI (Klughammer and Schreiber 1994, 2008). The classic approach is based on dark adaptation with subsequent light induction and measurement of the slow kinetics of fluorescence decay. This approach gives valuable information but has one drawback. It takes dozen minutes for a measurement and provides a result for one
Transcript of Application of fast light-readapted plants for measurement ...

245
PHOTOSYNTHETICAInternational Journal for Photosynthesis Research
Application of fast light-readapted plants for measurement of chlorophyll fluorescence and P700 light absorption with the RLC method
E.A. LYSENKO
Institute of Plant Physiology RAS, 35 Botanicheskaya St., 127276 Moscow, Russia
Abstract
Keywords: actinic light intensity; barley; pulse amplitude modulation; rapid light curves.
Abbreviations: AL – actinic light; Chl – chlorophyll; D/L – plants adapted to darkness and readapted to light before the measurement; ETR – electron transport rate; F0 – minimal fluorescence yield of the dark-adapted state; F0' – minimal fluorescence yield of the light-adapted state; FM – maximal fluorescence yield of the dark-adapted state; FM' – maximal fluorescence yield of the light-adapted state; FS – steady-state fluorescence yield; FV – variable fluorescence; GL – grow light growth conditions; HL – high-light growth conditions; L – light-adapted plants without adaptation to darkness before the measurement; LL – low-light growth conditions; NPQ – nonphotochemical quenching; P – the steady state-level of P700 absorption in light; P0 – minimal P700 light absorption; P700 – reaction center Chl of PSI; PAM – pulse amplitude modulation; PM – maximal P700 change in the dark-adapted state; PM' – maximal P700 change in light; qC – coefficient of acceptor-side limitation of PSII; qN – nonphotochemical quenching coefficient; qP – photochemical quenching coefficient; RLC – rapid light curve; sHL – subhigh light growth conditions; SP – saturation pulse; Y(I) – coefficient of quantum yield of PSI; X(II) – relative quantum yield of PSII; Y(ND) – coefficient of limitation of PSI at the donor side; ΔC – portion of ‘closed’ PSII; ΔF – portion of photochemically active (‘open’) PSII; ΔP – portion of photochemically active PSI; ΦPSII – effective quantum yield of PSII photochemistry. Acknowledgements: The author thanks Dr. A.A. Klaus for growing the barley plants.Conflict of interest: The author declares no conflict of interest.
Highlights
● Dark adaptation enables to measure all PAM values and calculate all coefficients.● Short-time light adaptation restores both photosystems to the light-adapted state.● Light-readapted plants show some differences from continuously light-adapted plants.
Received 5 November 2020 Accepted 3 March 2021 Published online 12 April 2021
+Corresponding author phone: +7-963-610-1875 e-mail: [email protected]
DOI 10.32615/ps.2021.015 PHOTOSYNTHETICA 59 (2): 245-255, 2021
The rapid light curve method is a time-saving approach to the measurement of photosynthetic processes over a wide spectrum of light intensities. The adaptation to darkness enables the calculation of a complete set of coefficients for chlorophyll (Chl) fluorescence and P700 light absorption; however, dark-adapted plants demonstrate drastically different patterns of Chl fluorescence than that of light-adapted plants. The present work compared light-adapted barley plants without dark adaptation (L), and barley plants adapted to darkness and readapted to light for 7.5 min (D/L). The rapid light curves were generally similar in both the L and D/L variants. Some differences between the L and D/L variants were found in plants grown at any illumination. A number of distinctions between the L and D/L variants were characteristic of plants grown under particular illumination levels. The present analysis demonstrated that the scheme including dark adaptation and short readaptation to light (D/L) enabled to obtain generally correct data.
Introduction
The pulse amplitude modulation (PAM) method is a powerful tool for the investigation of photosynthesis. The induced fluorescence of chlorophyll (Chl) enables the assessment of the activity of PSII (Lichtenthaler et al. 2005, Kalaji et al. 2014). Light absorption in the
far-red part of the spectrum allows the measurement of the activity of PSI (Klughammer and Schreiber 1994, 2008). The classic approach is based on dark adaptation with subsequent light induction and measurement of the slow kinetics of fluorescence decay. This approach gives valuable information but has one drawback. It takes dozen minutes for a measurement and provides a result for one

246
E.A. LYSENKO
intensity of actinic light (AL). Reactions of photosystems may depend substantially on the intensity of AL. Therefore, a thorough analysis requires measurements at different AL intensities.
The method of rapid light curves (RLC) was established to facilitate analysis of a wide spectrum of AL (Schreiber et al. 1997, White and Critchley 1999). The method ex-ploited relatively short periods of AL exposure, following each with a saturating pulse for the determination of maximal, stationary, and minimal levels of Chl fluorescence at a given light intensity. Consecutive steps have the same duration and different intensities of AL; the AL intensity is increased stepwise, usually, enabling the study of a wide range of intensities in a relatively short time.
White and Critchley (1999) showed that plants adapted to darkness and illumination demonstrated basically different reactions in RLCs; plants adapted to darkness demonstrated very low level of the coefficient ETR (electron transport rate). Therefore, plants should be adapted to light prior to the application of the RLC method. The easiest way to perform this method is to take plants from light immediately and start the RLC procedure. However, in this case, all the characteristics associated with dark adaptation will be lost, which makes impossible to calculate most coefficients except photochemical quen-ching coefficient (qP), effective quantum yield of PSII photochemistry (ΦPSII), and ETR. The alternative approach is to measure basic parameters in dark-adapted plants, then to adapt these plants to light conditions, and then initiate the measurement of basic parameters with RLCs. White and Critchley (1999) demonstrated that adaptation to light conditions for 4 min increases the ETR value substantially; the 8-min adaptation to light may be sufficient, and 12 min is quite sufficient. In this work, researchers used sliced fragments of leaves and 10-s intervals of AL for each step. The duration of the AL interval is also an important factor. The prolongation of AL steps from 20 s to 2 min increased the ETR levels (Kalaji et al. 2014). In the dark-adapted leaves, the increase was gradual; in the leaves readapted to light, the prolongation of AL steps from 20 to 30 s resulted in a large effect, while further prolongation to 1–2 min had small effects. These results suggest that 5–10 min for readaptation to light and 30-s spans for each AL step in the RLC procedure may be sufficient to obtain quite a good approximation of processes in the photosynthetic apparatus in shor-time measurements.
The RLC approach has been used in many studies. The analysis was not limited to ETR; the list of coefficients applied includes ΦPSII, qP, and the coefficients of non-photochemical quenching qN and NPQ (Schreiber et al. 1997, Xu et al. 2009, Sousa et al. 2017). However, researchers used different strategies in the experimental design of the initial stage: (1) light-adapted plants without any dark adaptation (Pérez et al. 2007, Huang et al. 2012); (2) ‘quasi darkness’, very short and insufficient period of dark adaptation (10 s) (Ralph and Gademann 2005, Sousa et al. 2017); (3) dark-adapted plants without readaptation to light conditions (Rascher et al. 2000, Xu et al. 2009) or with very short (30 s) and insufficient readaptation to light conditions (Schreiber et al. 1997, Karim et al. 2003); and
(4) dark-adapted plants readapted to light conditions for 4–5 min (Zhang et al. 2011, Kalaji et al. 2014) or longer (White and Critchley 1999, Serôdio et al. 2006). Most of these works used short-time AL steps (10 s); some used AL for 20 s (Pérez et al. 2007, Zhang et al. 2011) and 30 s (Rascher et al. 2000, Kalaji et al. 2014); very long AL steps (2 min) were also used (Huang et al. 2012, Kalaji et al. 2014). All the diversity in the design of the RLC procedure points to the scarcity of methodical analyses that prove the optimal approach to RLC in terms of both correctness and time savings. The RLC method can also be applied to P700 light absorbance but neither work has studied the correctness of such applications.
The RLC approach is popular in studies of environ-mental factors (reviewed in Brestič and Živčák 2013). If factors, such as drought, heat, or heavy metals, are analyzed, then all variants are grown under the same light conditions. A general drawback in the light/dark scheme of the RLC may cause a bias; however, this bias will be the same for all variants studied and an effect of environmental factor can be revealed. Light intensity is one of the most important external factors for plants. In such research, plants are grown in drastically different conditions of light intensity or quality. This raises a number of questions concerning RLC application. Would the readaptation to light remove any effect of dark adaptation with no bias for different variants? Will bias (if any) be the same for all variants? Is it possible to use a single intensity of AL for readaptation of all variants (and so on)?
The present research attempts to answer these questions. The young barley plants were grown in conditions of low light (LL), normal light (grow light, GL), excessive nonstressful light (subhigh light, sHL), and stressful high light (HL). Plants adapted to light were measured with the RLC regime with a Dual-PAM-100 device; both Chl fluorescence and P700 light absorption were determined simultaneously. The barley plants were adapted to light in two different ways. First, plants were taken directly from the illumination conditions in the growth chamber without any adaptation to darkness (L). Second, plants were adapted to the darkness for 30 min and then readapted to light for 7.5 min (D/L); all the variants were readapted to light of the same intensity [218 μmol(photon) m–2 s–1] corresponding to GL. The values were measured directly (F0', FM', FS, PM', P), and their differences (FV', ΔF, ΔC, ΔP) were studied in both types of plants; coefficients based on light-values only (qP, ΦPSII) and the ratio ΔP/ΔF were also calculated. The comprehensive analysis of the data obtained is presented below.
Materials and methods
Plant growth conditions: Barley (Hordeum vulgare L. cv. Luch) seedlings were grown under continuous aeration on modified Hoagland medium (Lysenko et al. 2019). Caryopses were kept for 2–3 d at 4°C in the dark on filter paper moistened with 0.25 M CaCl2. Imbibed caryopses were placed at 25°C under light conditions, and the plant age was determined from this time. Two days later, the seedlings were transferred to pots with Hoagland

247
MEASUREMENT OF CHLOROPHYLL FLUORESCENCE WITH THE RLC METHOD
medium under GL conditions (see text table below). One day later, pots with seedlings were placed under various light conditions with continuous illumination (24 h). Continuous illumination was required to obtain severe growth inhibition and other visually distinguished reactions to stress in barley seedlings under the HL conditions (not shown). The growth at various light intensities in the regime of continuous illumination was carried out for six days; nine-day-old plants were analyzed.
The LL conditions were fulfilled in a thermostat cham-ber equipped with fluorescent lamps. The GL conditions were achieved in a phytotron chamber equipped with MASTER HPI-T Plus 400 W/645 metal halide lamps (Philips, Netherlands). The sHL and HL conditions were accomplished in a phytotron chamber equipped with metal halide lamps HPI-T 2000 W/646 (Philips, Netherlands) and intensive cooling; cooling was necessary to compensate for the heat from the light source. For both the sHL and HL conditions, plants were placed under the same lamp at different distances; therefore, the temperature surrounding the sHL plants was lower (text table). The light intensities were controlled with the use of an LI-250A light meter equipped with an LI-190 quantum sensor measuring PAR (Li-Cor, USA).
PAM analysis: The Chl a fluorescence and P700 light absorption were registered simultaneously with the Dual-PAM-100 (Walz, Germany). The Chl a fluorescence was excited at 460 nm (Int. #5, 12 μmol(photon) m–2 s–1; the measuring light). P700 is the reaction center chlorophyll of PSI; the level of oxidized P700 was measured as the difference in light absorption at 830 and 875 nm (Int. #5). The red light 635 nm was used as the AL and for the saturation pulses (SPs).
The light-adapted barley plants were used for RLC analysis. Two types of light adaptation were compared. For the first type of light adaptation (L), plants were taken directly from the growth chamber and transferred to Dual-PAM-100, and the measurement of RLC was started immediately. During the transfer, plants were in uncontrolled light conditions: approximately 0.5 min for LL, 1.5 min for sHL and HL, and 2–2.5 min for GL. The adaptation to darkness was not applied to these plants. For the second type of light adaptation (D/L), plants were taken from the growth chamber and placed in the darkness for 30 min. Then, the plants were transferred rapidly to the Dual-PAM-100, avoiding bright light, and kept in the dark for another 4 min. The dark-adapted barley plants were used for the measurement of minimal (F0) and maximal
(FM) Chl fluorescence, and for minimal (P0) and maximal (PM) P700 absorption. Next, the plants were readapted to light during the process of induction curve measurement: AL of 218 μmol(photon) m–2 s–1 for 7.5 min; SPs were induced every 40 s and consisted of a 10 mmol(photon) m–2 s–1 pulse for 500 ms followed by far-red light (Int. #10) for 5 s. After the end of induction curve measurement, the measurement of the RLC was started immediately.
In RLC, each step of actinic light lasted for 30 s; at the end of each period, the steady-state fluorescence (FS) was measured. Then, SP [10 mmol(photon) m–2 s–1, 500 ms] was applied and the maximum level of fluorescence in the light (FM') and maximal P700 change in the light (PM') were measured. The minimum level of fluorescence in the light (F0') was determined after 5-s illumination with far-red light (720 nm, Int. #10).
The parameters of Chl fluorescence were calculated using the following equations: FV = FM – F0; FV' = FM' – F0'; ΔF = FM' – FS (Lichtenthaler et al. 2005, FS and F are synonyms); ΔC = FS – F0'; ΦPSII = (FM' – FS)/FM' (Genty et al. 1989, Kalaji et al. 2014); qP = (FM' – FS)/ (FM' – F0') (Schreiber et al. 1986, van Kooten and Snel 1990).
Recalculation of P and ΔP values: P is the steady-state level of P700 absorption in light; ΔP = PM' – P. The values of P are not shown in the tables of Dual-PAM-100 software. They were recalculated:
ΔP =Y(I) × PM (1)
P = Y(ND) × PM (2)
The recalculated values ΔP and P were compared with the genuine PM' given in the tables. If |PM' – (ΔP + P)| < 0.0025, then the data were accepted. The threshold level ± 0.0025 was chosen empirically (Fig. 1S, supplement). For the complete explanation, see the supplement.
ΔF, ΔP, and ΔC represent spans of PSI and PSII activities without normalizing to other values. ΔF reflects the portion of photochemically active (‘open’) PSII (ΔF/FM' = ΦPSII; ΔF/FV' = qP). ΔP reflects the portion of photochemically active PSI [ΔP/(PM – P0) = Y(I); Klughammer and Schreiber 1994, 2008]. ΔC shows the portion of so-called ‘closed’ PSII (ΔC + ΔF = FV'; ΔF/(ΔF + ΔC) = qP; ΔC/FV = qC; Lysenko et al. 2020).
Statistical analysis: For each variant of light intensity, biological experiments were repeated 3–6 times. For both
Designation Light intensitya
[μmol(photon) m–2 s–1]Temperatureb [°C] Relative air humidity [%]
LL (low light) 35 28 55–68GL (grow light) 180–220 28 27–31sHL (subhigh light) 950–1,200 24–25 13–20HL (high light) 1,350–1,600 27–28 13–20
a – the range of light intensities from lower to higher parts of leaves; b – the temperature in close vicinity to the plants was controlled.
248
E.A. LYSENKO
variants of light adaptation prior to measurement (L and D/L), the same number of plants was analyzed: 19 for LL, 27 for GL, 25 for sHL, and 25 or 24 for HL. All the data were processed using the Excel (Microsoft) software. The means and standard errors (SE) were reported.
Results
Plants, which were taken from illuminated conditions and were not subjected to dark adaptation (L), were compared to plants adapted to darkness for 30 min and then readapted to light for 7.5 min (D/L).
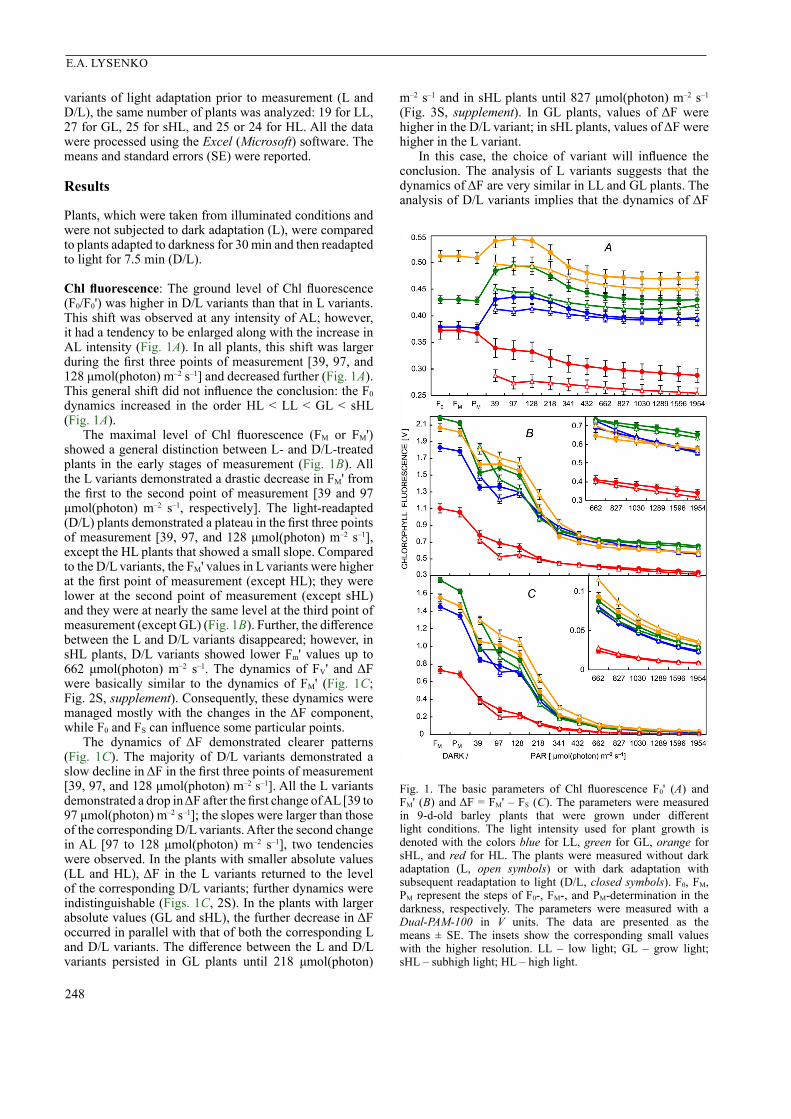
Chl fluorescence: The ground level of Chl fluorescence (F0/F0') was higher in D/L variants than that in L variants. This shift was observed at any intensity of AL; however, it had a tendency to be enlarged along with the increase in AL intensity (Fig. 1A). In all plants, this shift was larger during the first three points of measurement [39, 97, and 128 μmol(photon) m–2 s–1] and decreased further (Fig. 1A). This general shift did not influence the conclusion: the F0 dynamics increased in the order HL < LL < GL < sHL (Fig. 1A).
The maximal level of Chl fluorescence (FM or FM') showed a general distinction between L- and D/L-treated plants in the early stages of measurement (Fig. 1B). All the L variants demonstrated a drastic decrease in FM' from the first to the second point of measurement [39 and 97 μmol(photon) m–2 s–1, respectively]. The light-readapted (D/L) plants demonstrated a plateau in the first three points of measurement [39, 97, and 128 μmol(photon) m–2 s–1], except the HL plants that showed a small slope. Compared to the D/L variants, the FM' values in L variants were higher at the first point of measurement (except HL); they were lower at the second point of measurement (except sHL) and they were at nearly the same level at the third point of measurement (except GL) (Fig. 1B). Further, the difference between the L and D/L variants disappeared; however, in sHL plants, D/L variants showed lower Fm' values up to 662 μmol(photon) m–2 s–1. The dynamics of FV' and ΔF were basically similar to the dynamics of FM' (Fig. 1C; Fig. 2S, supplement). Consequently, these dynamics were managed mostly with the changes in the ΔF component, while F0 and FS can influence some particular points.
The dynamics of ΔF demonstrated clearer patterns (Fig. 1C). The majority of D/L variants demonstrated a slow decline in ΔF in the first three points of measurement [39, 97, and 128 μmol(photon) m–2 s–1]. All the L variants demonstrated a drop in ΔF after the first change of AL [39 to 97 μmol(photon) m–2 s–1]; the slopes were larger than those of the corresponding D/L variants. After the second change in AL [97 to 128 μmol(photon) m–2 s–1], two tendencies were observed. In the plants with smaller absolute values (LL and HL), ΔF in the L variants returned to the level of the corresponding D/L variants; further dynamics were indistinguishable (Figs. 1C, 2S). In the plants with larger absolute values (GL and sHL), the further decrease in ΔF occurred in parallel with that of both the corresponding L and D/L variants. The difference between the L and D/L variants persisted in GL plants until 218 μmol(photon)
m–2 s–1 and in sHL plants until 827 μmol(photon) m–2 s–1 (Fig. 3S, supplement). In GL plants, values of ΔF were higher in the D/L variant; in sHL plants, values of ΔF were higher in the L variant.
In this case, the choice of variant will influence the conclusion. The analysis of L variants suggests that the dynamics of ΔF are very similar in LL and GL plants. The analysis of D/L variants implies that the dynamics of ΔF
Fig. 1. The basic parameters of Chl fluorescence F0' (A) and FM' (B) and ΔF = FM' – FS (C). The parameters were measured in 9-d-old barley plants that were grown under different light conditions. The light intensity used for plant growth is denoted with the colors blue for LL, green for GL, orange for sHL, and red for HL. The plants were measured without dark adaptation (L, open symbols) or with dark adaptation with subsequent readaptation to light (D/L, closed symbols). F0, FM, PM represent the steps of F0-, FM-, and PM-determination in the darkness, respectively. The parameters were measured with a Dual-PAM-100 in V units. The data are presented as the means ± SE. The insets show the corresponding small values with the higher resolution. LL – low light; GL – grow light; sHL – subhigh light; HL – high light.

249
MEASUREMENT OF CHLOROPHYLL FLUORESCENCE WITH THE RLC METHOD
are very similar in GL and sHL plants (Fig. 3S). At the highest AL levels only [1,596 and 1,954 μmol(photon) m–2 s–1], the distinction between the corresponding L and D/L variants disappeared and both variants demonstrated an unambiguous increase in ΔF in the order LL < GL < sHL (Fig. 3S).
The steady-state level of fluorescence FS also demon-strated a general tendency. At the first three points of measurement [39–128 μmol(photon) m–2 s–1], the values of FS in the L variants were lower than those in the D/L variants (Fig. 2A,B). At the next stages of measurement, an inverse tendency was seen.
The steady-state level of fluorescence FS consists of two components: antennae fluorescence (F0) and a portion of fluorescence between F0 and FS (Lichtenthaler et al. 2005, Lysenko et al. 2020). The last component is generally considered the fluorescence emitted by a fraction of the excited PSII that cannot transfer electrons due to limitation at the acceptor side (‘closed’ PSII complexes). After the subtraction of the F0 component (ΔC = FS – F0), the tendency was changed (Fig. 2C,D). At the first three stages of measurement, both the L and D/L variants demonstrated no differences except two points in LL plants. At the higher intensities of AL [218–662 μmol(photon) m–2 s–1], ΔC in all L variants was larger than that in D/L variants; in HL plants, the tendency was insignificant, and in sHL plants, the tendency was prolonged until 1,030 μmol(photon) m–2 s–1.
Most of the coefficients for the calculation of Chl fluorescence require parameters measured in dark-adapted plants. However, the coefficient of photochemical quen-ching qP and effective quantum yield ΦPSII are calculated from parameters measured in light only; therefore, qP and ΦPSII can be calculated in both the L and D/L variants and compared.
The dynamics of ΦPSII (Fig. 3A,B) were similar to the dynamics of the basic parameters FM' and FV' and reflected the dynamics of ΔF (Figs. 1B,C; 1S). In L variants, the value of ΦPSII decreased abruptly after the first point of measurement [39 μmol(photon) m–2 s–1]; this fall was obvious in LL, GL, and HL plants and weak in sHL plants. In the LL and HL plants, there were no further differences in ΦPSII curves between L and D/L variants. In the GL plants, the ΦPSII values were slightly higher in the D/L variant; in the sHL plants, ΦPSII values were slightly higher in the L variant (Fig. 3A,B). The choice of variant (L or D/L) will influence the conclusion. In the L variants, the dynamics of ΦPSII were indistinguishable in LL and GL plants and drastically higher in sHL plants (Fig. 4SA, supplement). In the D/L variants, all the three ΦPSII dynamics were very similar: LL ≤ GL ≤ sHL (Fig. 4SB).
At the first site, the coefficient of photochemical quenching qP showed a similar tendency. In LL and HL plants, the dynamics of qP were similar in both the L and D/L variants of corresponding plants. The only exception was a significant difference between the L and D/L variants
Fig. 2. The steady-state level of Chl fluorescence FS itself (A,B) and after subtracting the F0 component, ΔC = FS – F0 (C,D). The dynamics in LL and HL plants (A,C) and GL and sHL plants (B,D) are given separately for better visibility. All designations are the same as in Fig. 1. LL – low light; GL – grow light; sHL – subhigh light; HL – high light.

250
E.A. LYSENKO
of LL plants at 218–432 μmol(photon) m–2 s–1 (Figs. 3C,D; 4SE). The GL and sHL plants demonstrated clear dif-ferences between the L and D/L variants. In the central part of the AL intensity spectrum, the qP dynamics were higher in D/L variants than that in L variants in both the GL and sHL plants. However, in contrast to the dynamics of FM', FV', ΔF, and ΦPSII, the curves of qP demonstrated no drastic fall at the second point of measurement [97 μmol(photon) m–2 s–1] in L variants (Fig. 3C,D). Both variants (L or D/L) led to the same conclusion: the qP dynamics in LL, GL, and HL plants were similar, and the qP dynamics was higher in sHL plants (Fig. 4SC,D).
P700 light absorption: Dual PAM-100 registers a set of parameters of P700 light absorption: P0, PM('), and P (Klughammer and Schreiber 2008). P0 is accepted as the zero level (Dual-PAM_1e 2009, Lysenko et al. 2020). The value of P is not included in the data sheet list. The value of PM(') is only included in the data list. The values of P and ΔP can be recalculated (Eq. 1 and Eq. 2, see ‘Materials and methods’). ΔP = PM' – P; therefore, the sum of P and ΔP must be equal to PM'. However, a large portion of recalculated P and ΔP values did not fit to this expectation. The value ± 0.0025 was chosen as the threshold level (Fig. 1S). Of all the 2,856 PM' points measured, the inconsistency between P + ΔP and PM' was larger than ± 0.0025 in 506 cases (17.7%); these recalculated data were rejected.
The distribution of inconsistent cases was not random; three tendencies can be revealed (Fig. 4). (1) In all the variants, the frequency of inconsistent points was maximal at the beginning of the RLC measurement [39 μmol(photon) m–2 s–1] and decreased rapidly over the next three steps. (2) The minimal or zero level was reached at the AL step matching GL [218 μmol(photon) m–2 s–1]. (3) Next, the frequency of inconsistency started increasing slowly. The last tendency appeared in all kinds of L variants; in D/L variants, the tendency was observed in stressed HL plants and at the last steps, in relatively weak LL plants (Fig. 4). The third tendency demonstrated a negative correlation with photochemical usage of light energy. In the order of sHL–GL–LL–HL, the values of ΔF (Fig. 1C) and ΔP (Fig. 5E,F) decreased, and vice versa, the frequency of PM' ≠ ΔP + P increased. Therefore, the inconsistency was characteristic of a low-level photosynthetic apparatus that did not undergo dark/light preadaptation in the PAM device.
The dynamics of P700 light absorption is shown in Fig. 5. At the early steps of RLC, the large dispersion (SE) occurred due to the small set of consistent data points (see Fig. 4). In the GL, sHL, and HL plants, PM' values demonstrated no substantial differences between D/L and L variants; in LL plants, the PM' dynamics in D/L variants was lower than those in the L variants (Fig. 5A,B). The analysis of components (ΔP and P) revealed interesting details. In LL plants, the difference between D/L and L
Fig. 3. The coefficients of Chl fluorescence: effective quantum yield ΦPSII (A,B) and coefficient of photochemical quenching qP (C,D). The data for the same parameters are given separately for better visibility. All designations are the same as in Fig. 1. LL – low light; GL – grow light; sHL – subhigh light; HL – high light.

251
MEASUREMENT OF CHLOROPHYLL FLUORESCENCE WITH THE RLC METHOD
variants was due to a lower level of P in D/L variants; the dynamics of ΔP were very similar in both D/L and L variants (Fig. 5C,E). The difference between L and D/L did not influence the final conclusion: the dynamics of both PM' and P increased in the order HL < LL < GL < sHL (Fig. 5A–D). In contrast, in GL plants, both ΔP and P were different in the D/L and L variants. In the D/L variant, the dynamic of P was lower (Fig. 5D) and ΔP values were higher (Fig. 5F) compared to the L variant; as a result, the PM' values were nearly the same in both the D/L and L variants (Fig. 5B). In plants grown at high intensities of light (sHL and HL), the dynamics of all the P700 parameters were indistinguishable (Fig. 5). The difference between the two variants of GL plants generated some ambiguity in the conclusion. In D/L variants, the dynamics of ΔP clearly increased in the order HL < LL < GL < sHL (Fig. 5SB, supplement), while in L variants, the difference between LL and GL plants was generally small and insignificant at particular points (Fig. 5SA). In D/L variants, the dynamics of P increased in the order HL < LL < GL < sHL without any exception (Fig. 5SD); in L variants, GL plants demonstrated the highest values of P in the beginning of the RLC procedure [97–341 μmol(photon) m–2 s–1] (Fig. 5SC).
Finally, it should be fruitful to compare the balance of photochemical components between the two photosystems. A substantial difference was revealed in plants with the largest values of ΔF and ΔP. In sHL plants, the D/L variants demonstrated a higher ΔP/ΔF ratio than that of the L variants (Fig. 6A). In GL plants, the ΔP/ΔF ratio was also higher in D/L variants; however, the difference was small and found at some stages of the RLC procedure only (Fig. 6A). In LL and HL plants, both D/L and L variants demonstrated similar dynamics in the ΔP/ΔF ratio (Fig. 6). The difference between L and D/L variants did not influence the final conclusion: in both cases, the dynamics of ΔP/ΔF increased in the order LL < GL < sHL (Fig. 6A).
In HL plants, the ΔP/ΔF ratio demonstrated a large dispersion; the dynamics of ΔP/ΔF were mostly consistent between HL and GL plants (Fig. 6).
Discussion
The present research was focused on two kinds of light adaptation before measuring the RLCs. The plants taken directly from the light conditions (L) were compared with the plants adapted to darkness and then readapted to light (D/L). The analysis includes all the basic parameters of PAM Chl fluorescence and P700 light absorption in plants grown at different intensities of light. In most cases, the difference between the L and D/L variants was small and insignificant. In many cases, the differences were characteristic of plants grown at any intensity of light. In some cases, differences were revealed in plants grown at a particular intensity of light.
General differences between D/L and L variants: The basic fluorescence F0 was always higher in D/L variants than that in L variants (Fig. 1A). This general tendency was enhanced along with the intensity of light in the growth conditions: LL < GL ≤ sHL < HL. This sequence was unique; usually, HL plants demonstrated minimal values and/or differences between H/L and L variants. Therefore, the sequence HL ≤ LL ≤ GL ≤ sHL was observed frequently (e.g., see absolute values of F0). The basic fluorescence is generally attributed to processes in antennae Chl (Lichtenthaler et al. 2005, Kalaji et al. 2014). Processes in antennas probably require more time for readaptation to light conditions, and proper time depends on the intensity of illumination in a growth chamber.
The area between steady-state fluorescence (FS) and basic fluorescence (F0) reflects the portion of so-called ‘closed’ PSII. This area ΔC = FS – F0 decreased in D/L
Fig. 4. The frequency [%] of inconsistent data points (P + ΔP ≠ PM') revealed after the recalculation of P and ΔP components of P700 light absorption (see ‘Materials and methods’). The light intensity used for plant growth is denoted with the colors blue for LL, green for GL, orange for sHL, and red for HL. The plants without dark adaptation (L) are represented with solid bars; the plants with dark adaptation with subsequent readaptation to light (D/L) are represented with hatched bars. The position of the GL L row is changed for better visibility. LL – low light; GL – grow light; sHL – subhigh light; HL – high light.

252
E.A. LYSENKO
variants compared to that in L variants (Fig. 2C,D). The D/L-treated plants were readapted to the light conditions at the AL intensity of 218 μmol(photon) m–2 s–1; the difference in ΔC dynamics appeared from this AL intensity. The difference in ΔC was enhanced in the order HL < LL ≈ GL < sHL.
Another general effect was found in the dynamics of qP (Fig. 3C,D). The photochemical coefficient reflects the ratio between open (ΔF) and closed (ΔC) PSII: qP = ΔF/(ΔF + ΔC). The qP was higher in D/L plants than that in L plants. The effect appeared from the AL intensity used for readaptation [218 μmol(photon) m–2 s–1]. This effect was insignificant in HL plants and shorter in LL plants
[218–432 μmol(photon) m–2 s–1] (Fig. 3C,D). There was similarity between the dynamics of ΔC and qP. In D/L plants, the decrease in ΔC shifted the balance in favor of ΔF and resulted in the increased qP; consequently, the general shift in qP was defined with the general shift in ΔC. The dynamics of ΔF also influenced qP; therefore, differences between D/L and L variants in ΔC and qP were similar but not identical.
If the plants were measured without any preadaptation (L), they demonstrated a drastic decrease in induced fluorescence just after the first step of the RLC procedure. This was observed in plants grown at any intensity of light; this fall was obvious for FM' (Fig. 1B), FV' (Fig. 2S), and
Fig. 5. The parameters of P700 light absorption PM' (A,B), P (C,D), and ΔP = PM' – P (E,F). The data P and ΔP were recalculated; only the data matching P + ΔP = PM' were used. The PM' (means ± SE) values were calculated in two ways: all the data measured were used (Σ, hatched line); only the data matching P + ΔP = PM' were used (Δ, solid line). The dynamics in LL and HL plants (A,C,E) and GL and sHL plants (B,D,F) are given separately for better visibility. All designations are the same as in Fig. 1. LL – low light; GL – grow light; sHL – subhigh light; HL – high light.

253
MEASUREMENT OF CHLOROPHYLL FLUORESCENCE WITH THE RLC METHOD
ΔF (Fig. 1C). Consequently, this decrease was defined by ΔF as their main component. If the plants were adapted to darkness and readapted to light in a Dual-PAM-100, they showed no such fall (Figs. 1B,C; 2S). Probably, this drastic decrease in ΔF was a reaction of plant cells to the first SP exacerbated with recent positioning between measurement blocks that presumes some mechanical stress and warming.
All the parameters of P700 light absorption demonstrated no difference between D/L and L variants in sHL and HL plants (Fig. 5). Therefore, a general shift in P700 light absorption was not found. The only distinction was the difference in the frequency of inconsistent data: at AL ≥ 218 μmol(photon) m–2 s–1, the frequency of points with PM' ≠ ΔP + P was much higher in L variants than that in D/L variants (Fig. 4). I have no explanation for this difference.
Intensity-specific distinctions between D/L and L variants: The current analysis revealed a number of differences specific to a single light intensity. The LL plants demonstrated two specific differences. At the beginning of RLC [97 and 128 μmol(photon) m–2 s–1], D/L variants demonstrated larger values of the ΔC component of Chl fluorescence than that of L variants; the effect was small and local (Fig. 2C). The analysis of P700 light absorption revealed that the dynamics of P were smaller in D/L variants than that in L variants (Fig. 5C). The decrease in P led to a decrease in PM' in the D/L variants (Fig. 5A) because the photochemical component ΔP generally did not change (Fig. 5E). The value of P is attributed to the limitation at the donor side of PSI (Klughammer and Schreiber 2008). The effect was of a moderate size.
The decrease in P in D/L variants was also found in GL plants; however, it manifested differently. In the D/L variant, the dynamic of P was lower (Fig. 5D) and ΔP values were higher (Fig. 5F) compared to the L variant. The sum of these components, PM', was retained in both D/L and L variants at a similar level (Fig. 5B). The difference between D/L and L variants was of moderate size and was maintained until 432 μmol(photon) m–2 s–1; it coincided with a small increase in ΔF at AL intensities of
128 and 218 μmol(photon) m–2 s–1 only (Figs. 1C, 2SB, 3S). The value ΔP reflects the ability of PSI to photochemical energy quenching (Klughammer and Schreiber 2008, Lysenko et al. 2020). The increase in ΔP resulted in a slightly higher ΔP/ΔF ratio in the D/L variant than that in the L variant of GL plants at the AL intensity range of 218–432 μmol(photon) m–2 s–1 (Fig. 6A).
In the sHL plants, D/L variant demonstrated lower levels of FM', FV', and ΔF compared to L variant (Figs. 1B,C; 2S). The sHL plants demonstrated the highest absolute values of these parameters. The light intensity and/or time lapse chosen for the light readaptation may have been insufficient for the complete recovery of ΔF that defined the dynamics (see above). This incomplete recovery of ΔF resulted in a lower level of ΦPSII (Fig. 3B) and in higher ratio of ΔP/ΔF in D/L sHL plants than that in L plants (Fig. 6); in the last case, the difference was large.
No specific difference was found in HL plants.
General analysis: What are the potential sources of mis-representation in the RLC analysis? First, the adaptation to darkness induces some changes; subsequent 5–10-min readaptation to light may be insufficient to remove any changes completely. Considering this, plants taken directly from a site of growth (L) should provide a data set with minimal distortion. Second, PAM analysis is a noninvasive method of measurement; nevertheless, this method affects processes in the leaf. A leaf inserted into the measurement tool probably undergoes some mechanical stress and slight warming. Regular light pulses of enormous intensity (SPs) can also disturb the activity of photosystems. In the D/L variant, plants have several minutes for adaptation to AL, SPs, and other inevitable factors of the measuring process (see ‘Materials and methods’). Therefore, plants that were readapted to the light conditions in the regime of the induction curve can be a source of data with minimal distortion.
PSI is considered to be more tolerant to high light than PSII (Nishiyama and Murata 2014). The dynamics of P700 light absorption were generally similar in L and
Fig. 6. The ratio between the photochemical components of P700 light absorption and Chl fluorescence: ΔP/ΔF. The dynamics in LL, GL, and sHL plants (A) and in HL plants (B) are given separately for better visibility. All designations are the same as in Fig. 1. LL – low light; GL – grow light; sHL – subhigh light; HL – high light.

254
E.A. LYSENKO
D/L plants (Fig. 5). The dynamics of Chl fluorescence is attributed to PSII. At the beginning of the RLC process, all the readapted (D/L) plants demonstrated smooth slopes or plateaus (Figs. 1B,C; 2S). All the plants used without preadaptation (L) demonstrated drastic decreases in ΔF (Fig. 1C) and ΔF including the FV' (Fig. 2S) and FM' values (Fig. 1B). This fall was minimal in sHL plants that demonstrated the best ability to photochemical reactions under high light conditions (Figs. 1–5). After two SPs and one more minute of measurement, the dynamics of ΔF in L variants was stabilized. In plants that demonstrated lower photochemical values (LL and HL), ΔF in L and D/L plants was equal. In GL and sHL plants, the slope of ΔF was parallel in both variants. Probably, the measurement conditions distorted the dynamics of ΔF in L variants that were not adapted preliminary to these conditions.
All the D/L plants were readapted to AL at 218 μmol(photon) m–2 s–1. From this AL intensity in the RLCs, D/L variants demonstrated lower levels of ΔC and there-fore higher levels of qP than the corresponding L variants (Figs. 2C,D; 3C,D). The L variants of GL plants adapted for days to the same intensity in the phytotron demonstrated also a higher portion of ΔC in this interval of tolerance (Fig. 2D). ΔC is the Chl fluorescence induced with AL only. Most likely, this fluorescence is emitted with PSII that captured photon and cannot quench the excitement photochemically due to a limitation at the acceptor side; such a PSII is called closed (Lichtenthaler et al. 2005, Kalaji et al. 2014). Probably, the preadaptation in PAM made the acceptor side of PSII more ‘open’, i.e, tolerant to some distortions in the process of measurement; the intensity of preadaptation light defined the ‘interval of tolerance’. In HL plants, the ability to adapt was probably exhausted, and the tolerance in this interval was negligible and insignificant.
Interestingly, the ‘ΔF triangle’ in L plants [Fig. 1C, AL of 39–97–128 μmol(photon) m–2 s–1] disappeared in qP (Fig. 3C,D). The slope of qP was smooth and equal in the corresponding D/L and L variants. The photochemical coefficient shows the balance between an open (ΔF) and closed (ΔC) PSII. Therefore, the decrease in ΔF and ΔC was proportional under these intensities of AL.
All the D/L plants demonstrated higher values of F0' than the corresponding L variants (Fig. 1A). However, F0(') does not refer to the processes in the reaction center of PSII. Some coefficients, such as Fv/Fm, ΦPSII, and NPQ, comprise the F0(') area; many coefficients, including qP, relative quantum yield of PSII (X(II)), qN, and qC, do not comprise F0(') area (Lichtenthaler et al. 2005, Kalaji et al. 2014, Lysenko et al. 2020). Contemporary PAM devices have a reliable routine for the determination of F0'; therefore, an exploitation of the coefficients with F0(')-subtraction is one way to discard the impact of F0(') deviation on the assessment of processes in the reaction center of PSII.
The frequency of inconsistent points, where PM' ≠ P + ΔP, was lower in D/L plants than that in the corresponding L plants (Fig. 4). This is evidence in favor of the use of preadapted D/L plants.
All the considerations above demonstrated that the suggested D/L approach is suitable or even advantageous
for the analysis of the light-adapted plants. However, application of a single AL intensity for all the variants resulted in some deviations.
In the D/L variant, LL plants [35 μmol(photon) m–2 s–1] were readapted at higher AL intensity [218 μmol(photon) m–2 s–1]. This procedure likely reduced donor-side limitation of PSI; therefore, D/L-treated plants demonstrated lower values of P compared to L plants in all the spectrum of AL (Fig. 5C).
In the D/L variant, GL plants [180–220 μmol(photon) m–2 s–1] were readapted at the same AL intensity [218 μmol(photon) m–2 s–1]. This procedure likely increased PSI photochemical activity due to the decrease in donor-side limitation. Therefore, D/L-treated plants demonstrated smaller P and larger ΔP values than L variants at the similar AL intensities [97–432 μmol(photon) m–2 s–1] (Fig. 5D,F).
In the D/L variant, sHL plants [950–1,200 μmol(photon) m–2 s–1] were readapted at a lower AL intensity [218 μmol(photon) m–2 s–1]. Probably, this readaptation was insufficient for PSII. The D/L-treated plants demonstrated lower values of ΔF (Fig. 1C). This decrease resulted in smaller FV' (Fig. 2SC), FM' (Fig. 1B), and ΦPSII (Fig. 3B) values and a greater ΔP/ΔF ratio (Fig. 6A) in the D/L variant than in the L variant of GL plants. However, D/L-treated sHL plants demonstrated the largest decrease in donor-side limitation of PSII compared with that of the L variants; it can be concluded from the dynamics of ΔC (Fig. 2C,D) and qP (Fig. 3C,D).
Conclusion: The data obtained showed that the relatively short light readaptation was sufficient to recover the light-adapted state after adaptation to darkness. The HL plants showed no significant difference in photochemical values between the L and D/L variants. The sHL and HL plants demonstrated no differences in the parameters of P700 light absorption. The dynamics of P700 light absorption demonstrated no general distinction between L and D/L variants; a general ‘shift’ between L and D/L variants was characteristic of the dynamics of Chl fluorescence. In the most cases of general ‘shift’, D/L variant appeared to be preferable; insufficient readaptation of F0(') can be avoided with the use of F0(')-independent coefficients. Application of a single AL intensity for plants grown at very different light intensities resulted in particular deviations. For the experiments including plants grown at different light intensities, AL intensity used for the readaptation has to be verified experimentally.
References
Brestič M., Živčák M.: PSII fluorescence techniques for measurement of drought and high temperature stress signal in crop plants: protocols and applications. – In: Rout G.R., Das A.B. (ed.): Molecular Stress Physiology of Plants. Pp. 87-131. Springer, Dordrecht 2013.
Dual-PAM_1e: Instruction manual for DUAL-PAM-100. Pp. 87. Heinz Walz GmbH 2009.
Genty B., Briantais J.-M., Baker N.R.: The relationship between the quantum yield of photosynthetic electron transport and quenching of chlorophyll fluorescence. – BBA-Gen. Subjects 990: 87-92, 1989.

255
MEASUREMENT OF CHLOROPHYLL FLUORESCENCE WITH THE RLC METHOD
Huang W., Yang S.-J., Zhang S.-B. et al.: Cyclic electron flow plays an important role in photoprotection for the resurrection plant Paraboea rufescens under drought stress. – Planta 235: 819-828, 2012.
Kalaji H.M., Schansker G., Ladle R.J. et al.: Frequently asked questions about in vivo chlorophyll fluorescence: practical issues. – Photosynth. Res. 122: 121-158, 2014.
Karim A., Fukamachi H., Hidaka T.: Photosynthetic performance of Vigna radiata L. leaves developed at different temperature and irradiance levels. – Plant Sci. 164: 451-458, 2003.
Klughammer C., Schreiber U.: An improved method, using saturating light pulses, for the determination of photosystem I quantum yield via P700+-absorbance changes at 830 nm. – Planta 192: 261-268, 1994.
Klughammer C., Schreiber U.: Saturation Pulse method for assessment of energy conversion in PSI. – PAM Application Notes 1: 11-14, 2008.
Lichtenthaler H.K., Buschmann C., Knapp M.: How to correctly determine the different chlorophyll fluorescence parameters and the chlorophyll fluorescence decrease ratio RFd of leaves with the PAM fluorometer. – Photosynthetica 43: 379-393, 2005.
Lysenko E.A., Klaus A.A., Kartashov A.V., Kusnetsov V.V.: Distribution of Cd and other cations between the stroma and thylakoids: a quantitative approach to the search for Cd targets in chloroplasts. – Photosynth. Res. 139: 337-358, 2019.
Lysenko E.A., Klaus A.A., Kartashov A.V., Kusnetsov V.V.: Specificity of Cd, Cu, and Fe effects on barley growth, metal contents in leaves and chloroplasts, and activities of photosystem I and photosystem II. – Plant Physiol. Bioch. 147: 191-204, 2020.
Nishiyama Y., Murata N.: Revised scheme for the mechanism of photoinhibition and its application to enhance the abiotic stress tolerance of the photosynthetic machinery. – Appl. Microbiol. Biot. 98: 8777-8796, 2014.
Pérez P., Zita G., Morcuende R., Martínez-Carrasco R.: Elevated CO2 and temperature differentially affect photosynthesis and resource allocation in flag and penultimate leaves of wheat. – Photosynthetica 45: 9-17, 2007.
Ralph P.J., Gademann R.: Rapid light curves: a powerful tool to assess photosynthetic activity. – Aquat. Bot. 82: 222-237, 2005.
Rascher U., Liebig M., Lüttge U.: Evaluation of instant light response curves of chlorophyll fluorescence parameters obtained with a portable chlorophyll fluorometer on site in the field. – Plant Cell Environ. 23: 1397-1405, 2000.
Schreiber U., Gademann R., Ralph P.J., Larkum A.W.D.: Assessment of photosynthetic performance of Prochloron in Lissoclinum patella in hospite by chlorophyll fluorescence measurements. – Plant Cell Physiol. 38: 945-951, 1997.
Schreiber U., Schliwa U., Bilger W.: Continuous recording of photochemical and non-photochemical chlorophyll fluorescence quenching with a new type of modulation fluorometer. – Photosynth. Res. 10: 51-62, 1986.
Serôdio J., Vieira S., Cruz S., Coelho H.: Rapid light-response curves of chlorophyll fluorescence in microalgae: relationship to steady-state light curves and non-photochemical quenching in benthic diatom-dominated assemblages. – Photosynth. Res. 90: 29-43, 2006.
Sousa C.A.F., Paiva D.S., Casari R.A.C.N. et al.: A procedure for maize genotypes discrimination to drought by chlorophyll fluorescence imaging rapid light curves. – Plant Methods 13: 61, 2017.
van Kooten O., Snel J.F.H.: The use of chlorophyll fluorescence nomenclature in plant stress physiology. – Photosynth. Res. 25: 147-150, 1990.
White A.J., Critchley C.: Rapid light curves: A new fluorescence method to assess the state of the photosynthetic apparatus. – Photosynth. Res. 59: 63-72, 1999.
Xu F., Guo W.H., Wang R.Q. et al.: Leaf movement and photosynthetic plasticity of black locust (Robinia pseudo-acacia) alleviate stress under different light and water conditions. – Acta Physiol. Plant. 31: 553-563, 2009.
Zhang Y.L., Hu Y.Y., Luo H.H. et al.: Two distinct strategies of cotton and soybean differing in leaf movement to perform photosynthesis under drought in the field. – Funct. Plant Biol. 38: 567-575, 2011.
© The authors. This is an open access article distributed under the terms of the Creative Commons BY-NC-ND Licence.